
Abstract
A non-invasive near infrared (NIR) spectroscopic method was developed for the quantitative moisture determination in a lyophilized injection formulation. The calibration samples were prepared by exposing lyophilized samples at different temperatures and relative humidity. The samples from different scales and different process parameters were considered for adding robustness to the model. The NIR spectra were collected using a Fourier-transform (FT) NIR with a diffuse reflectance probe and the same samples were further analyzed by the Karl Fisher (KF) method for moisture content. The pre-treated NIR spectra were used for quantitative method development for moisture content. Partial least squares regression was used to develop calibrations in the 5600-4950 cm−1 region with calibration coefficient of determination (R2) of 0.96 and root mean square error of calibration (RMSEC) of 0.149. The model was cross-validated internally using the Kernel algorithm with r2 = 0.96 and RMSECV = 0.15. The accuracy of the NIR method against the KF method, precision, and reproducibility were good and the model was robust in predicting different external validation samples. This work allowed NIR as an alternative measurement for moisture analysis as well as facilitate 100% monitoring before packaging and save the cost of sample and time of KF analysis.
Introduction
The scientific, risk-based framework outlined in the Process Analytical Technology (PAT) guidance 1 is intended to support innovation and efficiency in pharmaceutical development, manufacturing, and quality assurance. PAT is a system for designing, analyzing, and controlling manufacturing through timely measurements (i.e., during processing) of critical quality and performance attributes of raw and in-process materials and processes, to ensure the final product quality. PAT encourages a real-time release, which is the ability to evaluate and ensure the acceptable quality of in-process and/or final products based on comparable alternative analytical procedures for an assessment/characterization of material attributes, using direct and/or indirect process analytical methods. Near infrared (NIR) spectroscopy2–4 and Raman spectroscopy5,6 are the most widely used techniques for process monitoring. Other PAT tools 7 like microwave resonance technology (MRT), acoustic resonance spectrometry (ARS), optical coherence tomography (OCT), teraHertz pulsed imaging (TPI), electrical capacitance tomography (ECT), hyperspectral imaging (HSI), mass spectrometry (MS), X-ray fluorescence (XRF), spatial filter velocimetry (SFV), and focused beam reflectance measurement (FBRM) also have been explored for different applications. For moisture content determination, NIR is extensively used while MRT 8 and ECT 9 have also been tried. Unlike NIR spectroscopy, MRT does not require any mathematical preprocessing of the collected data. MRT has relatively low sensitivity and a limited range of moisture determination. The moisture content measurement using MRT is representative of the entire product and is not just a measurement of surface moisture. Therefore, it has been used widely to measure moisture during the granulation process. 10 ECT is an imaging technique that is used to estimate the internal spatial distribution of electric permittivity (ε) of a volume within a specified boundary lined with electrodes. It has difficulty measuring bound water at high frequencies and may have problems in accurately measuring moisture below 4%–6%. ECT is the most suitable technique for monitoring fluidized bed processes like granulation, drying, and coating. 11
NIR spectroscopy12,13 is widely used in the pharmaceutical industry as a real-time process monitoring tool due to its advantages like rapid analysis time, non-destructive (no sample pre-treatment is needed), non-invasive, with high penetration into the sample. Molecules having O–H, N–H, C–H, and S–H bonds are strong NIR absorbers since they exhibit a change in dipole moment. Since O-H bonds of water show strong absorption bands in NIR, (the first overtone of OH stretching at around 7100–6800 cm−1 and the combination band of OH stretching as well as bending at around 5300-5100 cm−1) the applicability of NIR spectroscopy for the determination of water is the most suitable technique.
Moisture content is critical for the shelf life of pharmaceutical products, as it influences the quality of drug substances14,15 (DS) and excipients, 16 physicochemical stability of different dosage forms including oral solid dosages17,18 (OSDs) as well as freeze-dried products. 19 Drying of DS is critical to cycle time reduction, maintaining the desired polymorph, and controlling the impurities. NIR spectroscopy has been used in OSD products to monitor the drying process by measuring the moisture content of granules and pellets in a fluidized bed dryer.20–23 In several studies, NIR spectroscopy has been used for the in-line monitoring of freeze-drying to get process understanding and testing the moisture in lyophilized finished product.24–27 The key ingredients in most of the freeze-dried products are proteins, sugars, and residual moisture. Hence, the NIR technique can be the most suitable tool for the characterization of freeze-dried products, especially for moisture content determination, which is one of the major critical quality attributes (CQA) of a freeze-dried product.
Freeze drying28,29 (FD) is one of the main downstream processes used in injectables especially in biopharmaceuticals to improve storage stability via conversion from a liquid phase into a solid. Lyophilization, or the freeze-drying process, consists of removing water or other liquid carriers from a frozen product by sublimation and desorption, which is commonly used to stabilize pharmaceutical drug products that are not stable in aqueous solution for a long period. The lyophilized product is a highly porous and hygroscopic cake or powder. The lyophilized product is typically freeze-dried in a glass vial under an inert atmosphere using a dry gas such as nitrogen. This process is widely used in the pharmaceutical industry to preserve sensitive materials, where almost 50% of parenteral products are lyophilized. The moisture-sensitive products need lower moisture content to ensure stability and require a sterile preservation process. Lyophilization offers the advantages of better stability for bioproducts and easy handling with rapid product reconstitution, hence, enabling longer shelf life. It is challenging to set the FD process, especially on a large scale, and achieve uniform distribution of residual moisture among all the samples of the batch. Sample-to-sample moisture content variation can be due to the non-uniformity in the nucleation temperature, sublimation rate, pressure gradient between the shelves, temperature of shelf surface, product temperature, and different heat fluxes to vials.30,31 For optimizing the process parameters, direct measurement of critical quality attributes (CQAs) using the NIR method will help change the process parameters setting and check the outcome in real time without destroying the sample.
The traditional methods used to measure residual moisture are Karl Fischer (KF) titration32–34 and loss on drying. 35 KF is the most widely used method, but it is a destructive and low throughput technique where sample preparation and manual handling are required. Since the lyophilized cake can be hygroscopic, it may have an impact on atmospheric moisture during sample handling, which can introduce variability in the measurements. The sample may be reconstituted using organic solvent and injected into the reaction vessel, or the lyophilized cake may be sampled and added directly. The physical property of the sample plays a key role as particle size can affect the dissolution of the sample. Since the KF method sometimes needs sample preparation, it is difficult to handle and measure many samples across batches for testing residual moisture. The KF titration is time-consuming and requires high-purity reagents and solvents hence, samples cannot be reused. Multiple samples are required to set up the method, which will be used during development.
Although it is not the method of choice, sometimes the loss on drying (LOD) technique may be used. The quantification of residual moisture is based on weight loss and the main challenge with this is sample handling, which can be a source of errors in the measurement. Along with moisture volatiles can be removed at conditions applied to the product. Due to the destructive nature of traditional methods of testing moisture content, the sample numbers are limited. These small numbers of vials are not representative of a full commercial manufacturing batch. It is difficult to generate a data set representative of a batch due to the low throughput. A substantial number of samples also cannot be used since those will be used up.
The NIR method is noninvasive since the vials remain closed during the analysis, faster, more efficient, and 100% inspection is possible without loss of vial. Therefore, it is the best choice for testing the moisture content of the freeze-dried vials as an effective alternative to traditional methods. Several publications can be found on the NIR application of moisture content estimation for end-product quantification of freeze-dried products containing sucrose, 36 mannitol,37,38 lactose, 39 povidone, 40 vaccines, 41 and antibodies. 42 A major challenge for the development of the NIR method for the determination of moisture content in freeze-dried samples is that the NIR spectra will be influenced by the polymorphic forms of sugars in addition to moisture content. 43 To establish a robust prediction model for residual moisture content, many samples with wide variations in moisture content are needed. The standard samples usually do not cover the range necessary to obtain a reliable and robust quantification model. Exposed samples may change physical properties and induce a polymorphic change of the product. 44 The state of water-bound or surface may interfere with NIR-based quantification. 45 Despite these challenges, the accuracy of the NIR method is attracting attention as an alternative method for moisture content estimation.
Several reports using at-line NIR spectroscopy have been published for the quantitative determination of moisture content in the lyophilized products through the vials focusing on the model development. Kamat et al. checked the feasibility of using NIR spectroscopy for measuring the moisture in freeze-dried products containing sucrose through intact glass vials. 36 Jones et al. developed a calibration curve at one site which was satisfactorily used to predict moisture in samples manufactured at the other site. 46 Derksen et al. used NIR spectroscopy for setting the specification for the residual moisture content in a mannitol-based freeze-dried product and showed a good possibility of using it for the stability samples. 37 The differentiation and quantitative determination of the surface and hydrate moisture in freeze-dried mannitol using NIR spectroscopy was established by Cao et al. 47 Stokvold et al. developed a method for measuring a small change in the moisture in the hygroscopic product which includes the validation and application of the method. 19 Hsu and Lin demonstrated that NIR spectroscopy was able to determine residual moisture in five marketed lyophilized protein products sealed in glass vials with the same precision as KF titration. They also investigated the impact of product configuration and protein formulation on NIR spectral accuracy for a lyophilized monoclonal antibody product and found that the surfactant, as well as a buffer, did not influence the model, but the concentration of the disaccharide used as excipient had to be kept constant. 48 Zheng et al. investigated NIR spectroscopy for moisture determination of five vaccine formulations and stated that product-specific models performed better than multi-product models. 41 Grohganz et al. used samples with varying compositions of mannitol–sucrose mixtures for establishing the model to predict water contents for samples containing proteins. They observed that the excipients had an influence on the determination by NIR spectroscopy and for samples with a definite composition they recommended building a model based on samples with the same composition. 49 For a freeze-dried antibody-drug conjugates product Clavaud et al. demonstrated NIR spectroscopy as an off-line tool for the moisture content analysis in quality control release and stability testing. The NIR spectroscopic model was developed on a specific product with two strengths and validated in compliance with current guidelines by using two instruments. 42 A partial least squares (PLS) regression model with a specific small wavelength region for a single product with different concentrations of sucrose was developed by Bobba et al. and the findings proved the suitability of the model for samples different from those used for its calibration unless too significant variations are introduced. 50
Most of the published applications for residual moisture determination are focused on the application of PLS as a regression method for model development. It turned out to be a powerful tool, but it considers only the linear dependence between the spectra and the residual moisture content.42,49 Three different freeze-dried medicines were chosen to investigate a global regression model for moisture content determination by Clavaud et al. They investigated different regression methods, and the best one based on the support vector regression (SVR) algorithm was demonstrated with very good reliability. 51 Massei et al. developed a novel NIR spectroscopic method combined with machine learning tools. The product-specific model for the 6% sucrose mixture was found consistent for the prediction of residual moisture in other sucrose-containing mixtures and in the one containing trehalose, while failed for the dataset with a higher percentage of arginine. Therefore, a global model was developed and demonstrated the higher accuracy and robustness of the machine learning-based model for the linear models. 52
Most of the published studies for NIR spectroscopic determination of moisture are carried out on freeze-dried products that have mannitol and sucrose. According to literature, this is the only study where at-line NIR spectroscopy has been used for moisture content determination and showing potential for the real-time release of products containing lactose as an excipient. The selected lyophilized product is provided in a single-dose glass vial and is highly susceptible to hydrolysis. The cost of the product is high. For the KF method of moisture content determination, sufficient sample mass is required, which would be consumed during analysis. Hence to save the sample and cost, an NIR spectroscopic method was developed for determining the moisture content of the lyophilized samples as a replacement for the KF titration method. The validated NIR method can be used for the implementation of online monitoring of moisture content and real-time release in the future.
Material and methods
Lyophilized product
The product contains 0.93% w/w active pharmaceutical ingredient A (API-A) with lactose monohydrate (99.07%) (Merck KGA) as a lyo protectant. The finished product appears as a white intact cake, supplied as a 2 mL USP type 1 clear tubular lyophilized vial with a 13 mm neck plugged with bromo-butyl rubber stopper and aluminum seal off. The lyophilized placebo was also prepared for a comparative characterization against the finished product as it contains only lactose.
Preparation of calibration samples
It was not practically possible to generate all the samples of lyophilized products with different moisture content by carrying out separate batches with different lyophilization cycles using different process parameters. Hence a few samples were generated by exposing (humidification or drying) the laboratory scale vials and few samples were taken from batches run with varying drying cycles. The lyophilized vials of the lab scale batch containing moisture content initially at a level of 1.2–1.4%w/w were used for the preparation of calibration samples. To achieve the moisture content above the initial level, the vials of the lab scale batch were open-exposed at 25 °C with relative humidity (RH) in the range of 60%–90% RH to cause ingress of moisture content into the samples. The openly exposed vials were closed with a rubber stopper and sealed with a flip-off Alu seal at predetermined time intervals of 10, 20, 40, 60 min at 60% RH and 15, 25 min at 90% RH. To achieve the moisture content below the initial level, the samples were kept open in a vacuum oven at 25 °C for up to 2 h. The time required for humidification and drying was selected based on the moisture content range requirement for the calibration model development. The preliminary study was carried out by testing the samples containing high, medium, and low moisture content to decide the moisture content range required for developing the NIR method.
With the same formulation composition, different lyophilization batches were taken at the lab scale and the commercial scale by varying process parameters (changes in primary and secondary drying temperatures and pressures with time). Few of the samples from these batches were used for the robust calibration model development to include inter-batch variability as well as expected process variations. A few of the samples were used as external validation samples for testing the performance of the quantitative model. The calibration points constituted 2/3rd of the data with the moisture content in the range of 0.8 to 3.13% w/w (target moisture content 2.0%) and external validation samples ranging from 1.3 to 3% w/w.
NIR instrumentation
A FTNIR spectrophotometer (FTPA2000-260PH, ABB Inc., Canada) with fiber optic noncontact diffuse reflectance probe and thermoelectrically cooled indium galium arsenide (InGaAs) detector was used for capturing spectra of the lyophilized product. The NIR spectra were obtained in the range 12500 to 4500 cm−1 with a resolution of 16 cm−1. Each spectrum was acquired as an average of 32 subsequent spectral scans for a good signal-to-noise ratio.
NIR spectra acquisition
The lyophilized product was an intact cake fitting into a small (2 mL) size glass vial. Hence in the preliminary study, the samples were analyzed at different orientations, through the side and the bottom by placing the probe tip on the side wall and the bottom of the vial focusing on the cake portion. Based on these observations the spectra were acquired from the bottom of the vial for further studies. Three spectra for each sample vial were collected by moving the vial in three different positions of the lyophilized cake, hence capturing spectral variation within the vial. Horizon MB software (ABB NIR) was used for spectra collection. The pre-processing and calibration-model building was done using Unscrambler® X (Version 10.5, CAMO AS, Oslo, Norway).
Spectra data analysis
Spectra were preprocessed with different transformations 53 like standard normal variate (SNV) and derivatization before carrying out principal component analysis (PCA) 54 and partial least square regression. 55 PCA was used to check spectral distribution and identify the outliers while PLS regression was used for correlating the NIR spectra to the reference method KF for moisture content estimation and building a predictive model for moisture content. Different PLS regression models were built using different spectra regions and the performance of the models was checked in terms of regression coefficient (R2) and root mean square error (RMSE) for calibration and validation along with standard error of prediction (SEP).
NIR method validation
The PLS model was validated using an internal cross-validation method and verified using an external validation sample set (varying batch size, process changes, and stability samples).
The NIR method for the moisture content with the final PLS model was validated for specificity, linearity, accuracy, precision, limit of detection and quantification, and robustness as per NIR Guidance 56 and Method validation guidance. 57 Specificity is the ability to assess the analyte in the presence of other constituents present in the matrix. The specificity of the developed PLS model was established through a loadings plot depicting peaks at the moisture-specific NIR regions. Linearity of the NIR regression was established for the moisture content range with R2, slope of line, bias, and offset. The accuracy of the NIR spectroscopic method (prediction of moisture content using NIR spectroscopy) was compared against the reference method using the KF technique. Precision is an indicator of random error of measurement. It is closeness between a series of measurements of the same homogenous sample. Each sample vial was tested in triplicate by changing the position by moving the vial on the probe tip and the reproducibility was checked. The same samples were also tested on different days to check an intermediate precision. The average, standard deviation (SD) and relative standard deviation (%RSD) of the NIR predicted value were calculated and compared. The limit of detection (LOD) and limit of quantification (LOQ) were calculated using equations as per ICH guidance, 58 LOD: 3.3 SD/slope and LOQ: 10 SD/slope where SD is considered from highest SD derived from intermediate precision and slope of the regression line. The robustness of the NIR method was proven by analyzing samples with varying batch size and lyophilization cycle parameters and testing stability samples.
Volumetric Karl-Fischer titration
After the collection of NIR spectra, the samples were subsequently analyzed for moisture content using Karl-Fisher titration (Metrohm 890 Titrando, Switzerland). The solvent was used to dissolve the samples in the vial and the solution was then used for the KF method. The moisture content of calibration samples obtained was considered as standard reference values against the respective NIR spectral data of each vial to build a quantitative calibration model.
X-ray diffractometer (XRD) analysis
The XRD patterns for lyophilized samples, before and after moisture exposure were measured by using a powder XRD (Ultima IV, Rigaku, USA). The instrument was operated with a Cu Kα radiation source at a voltage of 40 kV and a current of 30 mA. The samples were pressed on an Alu sample tray using glass slides and exposed to radiations at diffraction angles 3° to 40° and a scanning rate of 23.9998° per minute. The software was used to locate the peaks in XRD patterns by detecting the minima from the second derivative of the diffractogram.
Lactose monohydrate was used in this product as input material. Lactose is known to occur in one of the three crystalline forms (α-lactose monohydrate, α-lactose anhydrous, and β-lactose anhydrous) or in an amorphous state, which is a thermodynamically unstable state. 59 The amorphous state can be hygroscopic and can lead to transformation to a more stable crystalline form. XRD is widely used to differentiate the solid state and the crystallinity of lactose powders 60 ; hence, in this study, lyophilized products before and after RH exposure, the samples were analyzed using XRD to check the solid state of the product. Lactose monohydrate and lactose anhydrous were also evaluated for comparison.
Raman analysis
Raman spectra in reflectance mode were collected using a Raman RXN2 spectrometer (Kaiser Optical Systems, Inc., USA), a PhAT probe with a spot size of 6 mm. The diode laser emits photons at 785 nm and has a maximum power of 400 mW. The Raman method requires no sample preparation. It is also relatively inexpensive compared to XRD and provides a rapid technique for solid-state characterization. As an alternative technique, Raman spectroscopy has many advantages over XRD. XRD measures crystallinity as an average of an ensemble of particles within a solid sample whereas Raman spectroscopy has the potential to specifically determine the crystallinity of a single particle within that ensemble. Raman spectroscopy has been demonstrated to be an effective method to distinguish lactose monohydrate and amorphous lactose. Hence the Raman analysis was also conducted for lyophilized samples, after moisture exposure to check the impact of ingress moisture on form transformation. The exposed sample having maximum moisture content (approx. 5%) was checked using the Raman technique.
Results and discussion
NIR analysis of raw material and finished product
The NIR spectra of API shows the characteristic peaks at 4860 cm−1, 5740 cm−1, 5900 cm−1 and 6620 cm−1 while (Figure 1) Lactose monohydrate shows specific peaks at 4775 cm−1 (combination bands of O-H stretching and O-H deformation of ROH lactose), 5168 cm−1 (combination bands O-H stretching and O-H deformation of water), and a band at 6873 cm−1 (first overtone of O-H stretching of water). In the finished lyophilized product, the API-specific peaks are not seen but other peaks are observed at 5168 cm−1 and a band at 6850 cm−1. Lyophilized placebo shows peaks at the same positions as the finished product. In both lyophilized product and placebo samples broad peaks are observed as compared to lactose monohydrate with a shift in the moisture-specific bands, due to a change in lactose from crystalline to amorphous state. NIR spectra of API, lactose monohydrate, lyophilized finished product and lyophilized placebo.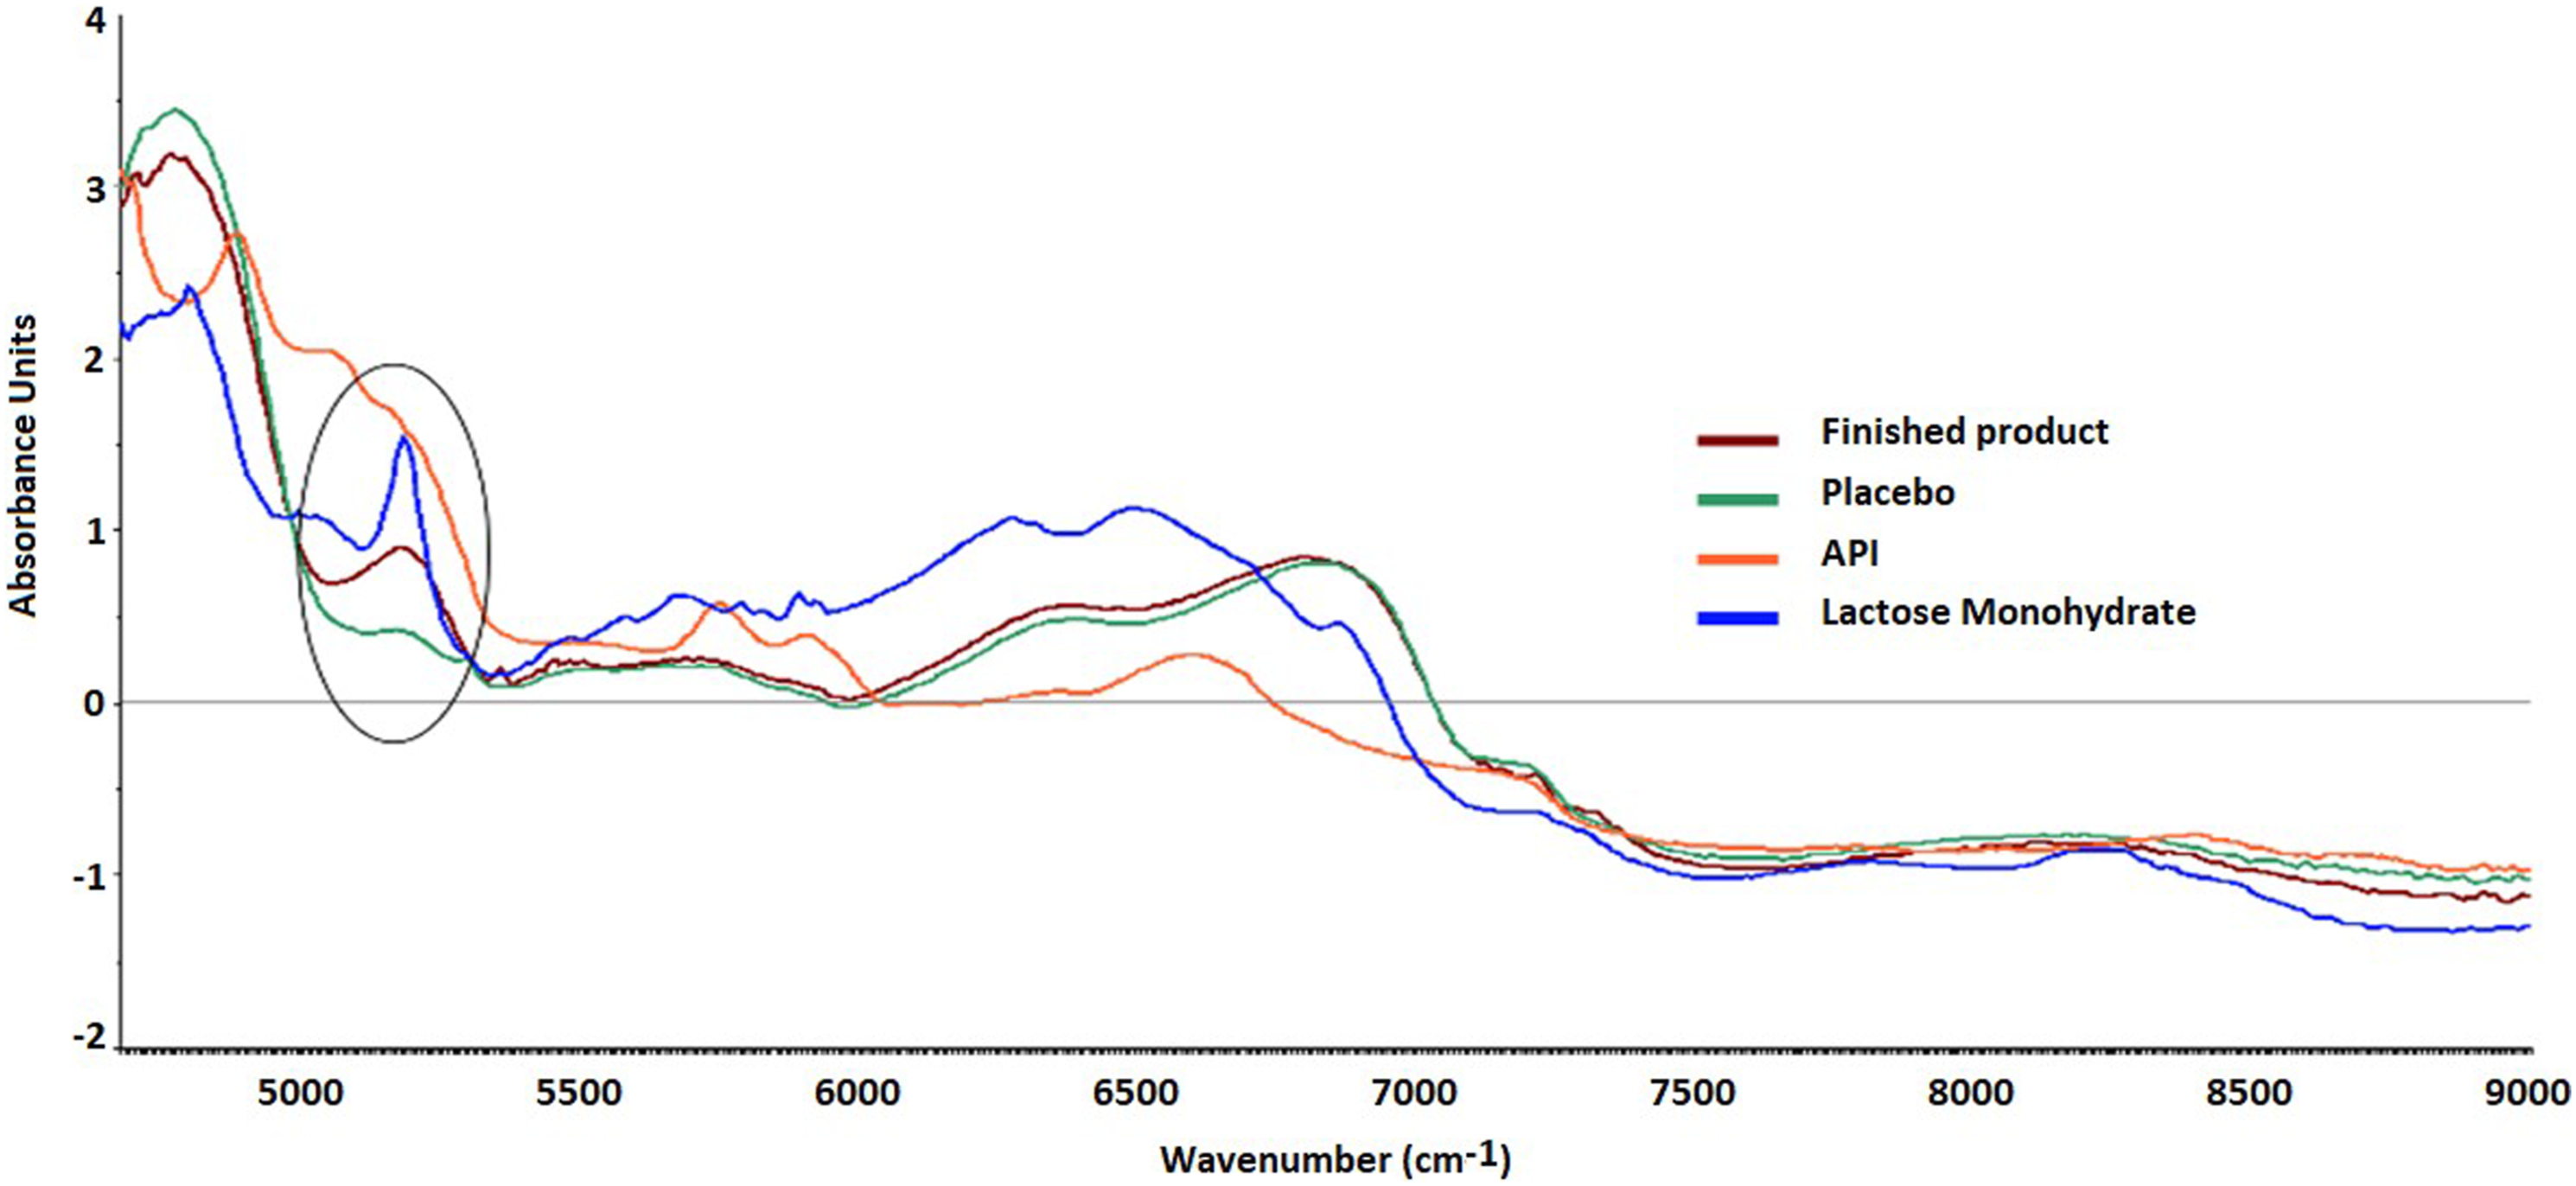
In the preliminary studies, high (samples exposed to 90% RH for 25 min), medium (unexposed sample), and low (samples exposed in a vacuum oven at 25°C for 2 h) moisture content samples were analyzed to check the feasibility of using the samples with moisture content in this range for NIR method development and the orientation of the sample. The NIR spectra (Figure 2) after pretreatment (SNV followed by 1st derivatization) showed a gradual change with the variation in the moisture content at 5168 cm−1, but the distinct separation was not found at 6850 cm−1. Both the combination band (at 5168 cm−1) and the first overtone (at 6850 cm−1) of the OH bond are specific to the moisture but the first overtone at 6850 cm−1 often overlaps with CH bands. Hence, the region around 5168 cm−1 was considered for the quantitative model development. Gradient change in NIR absorbance with the change in moisture content.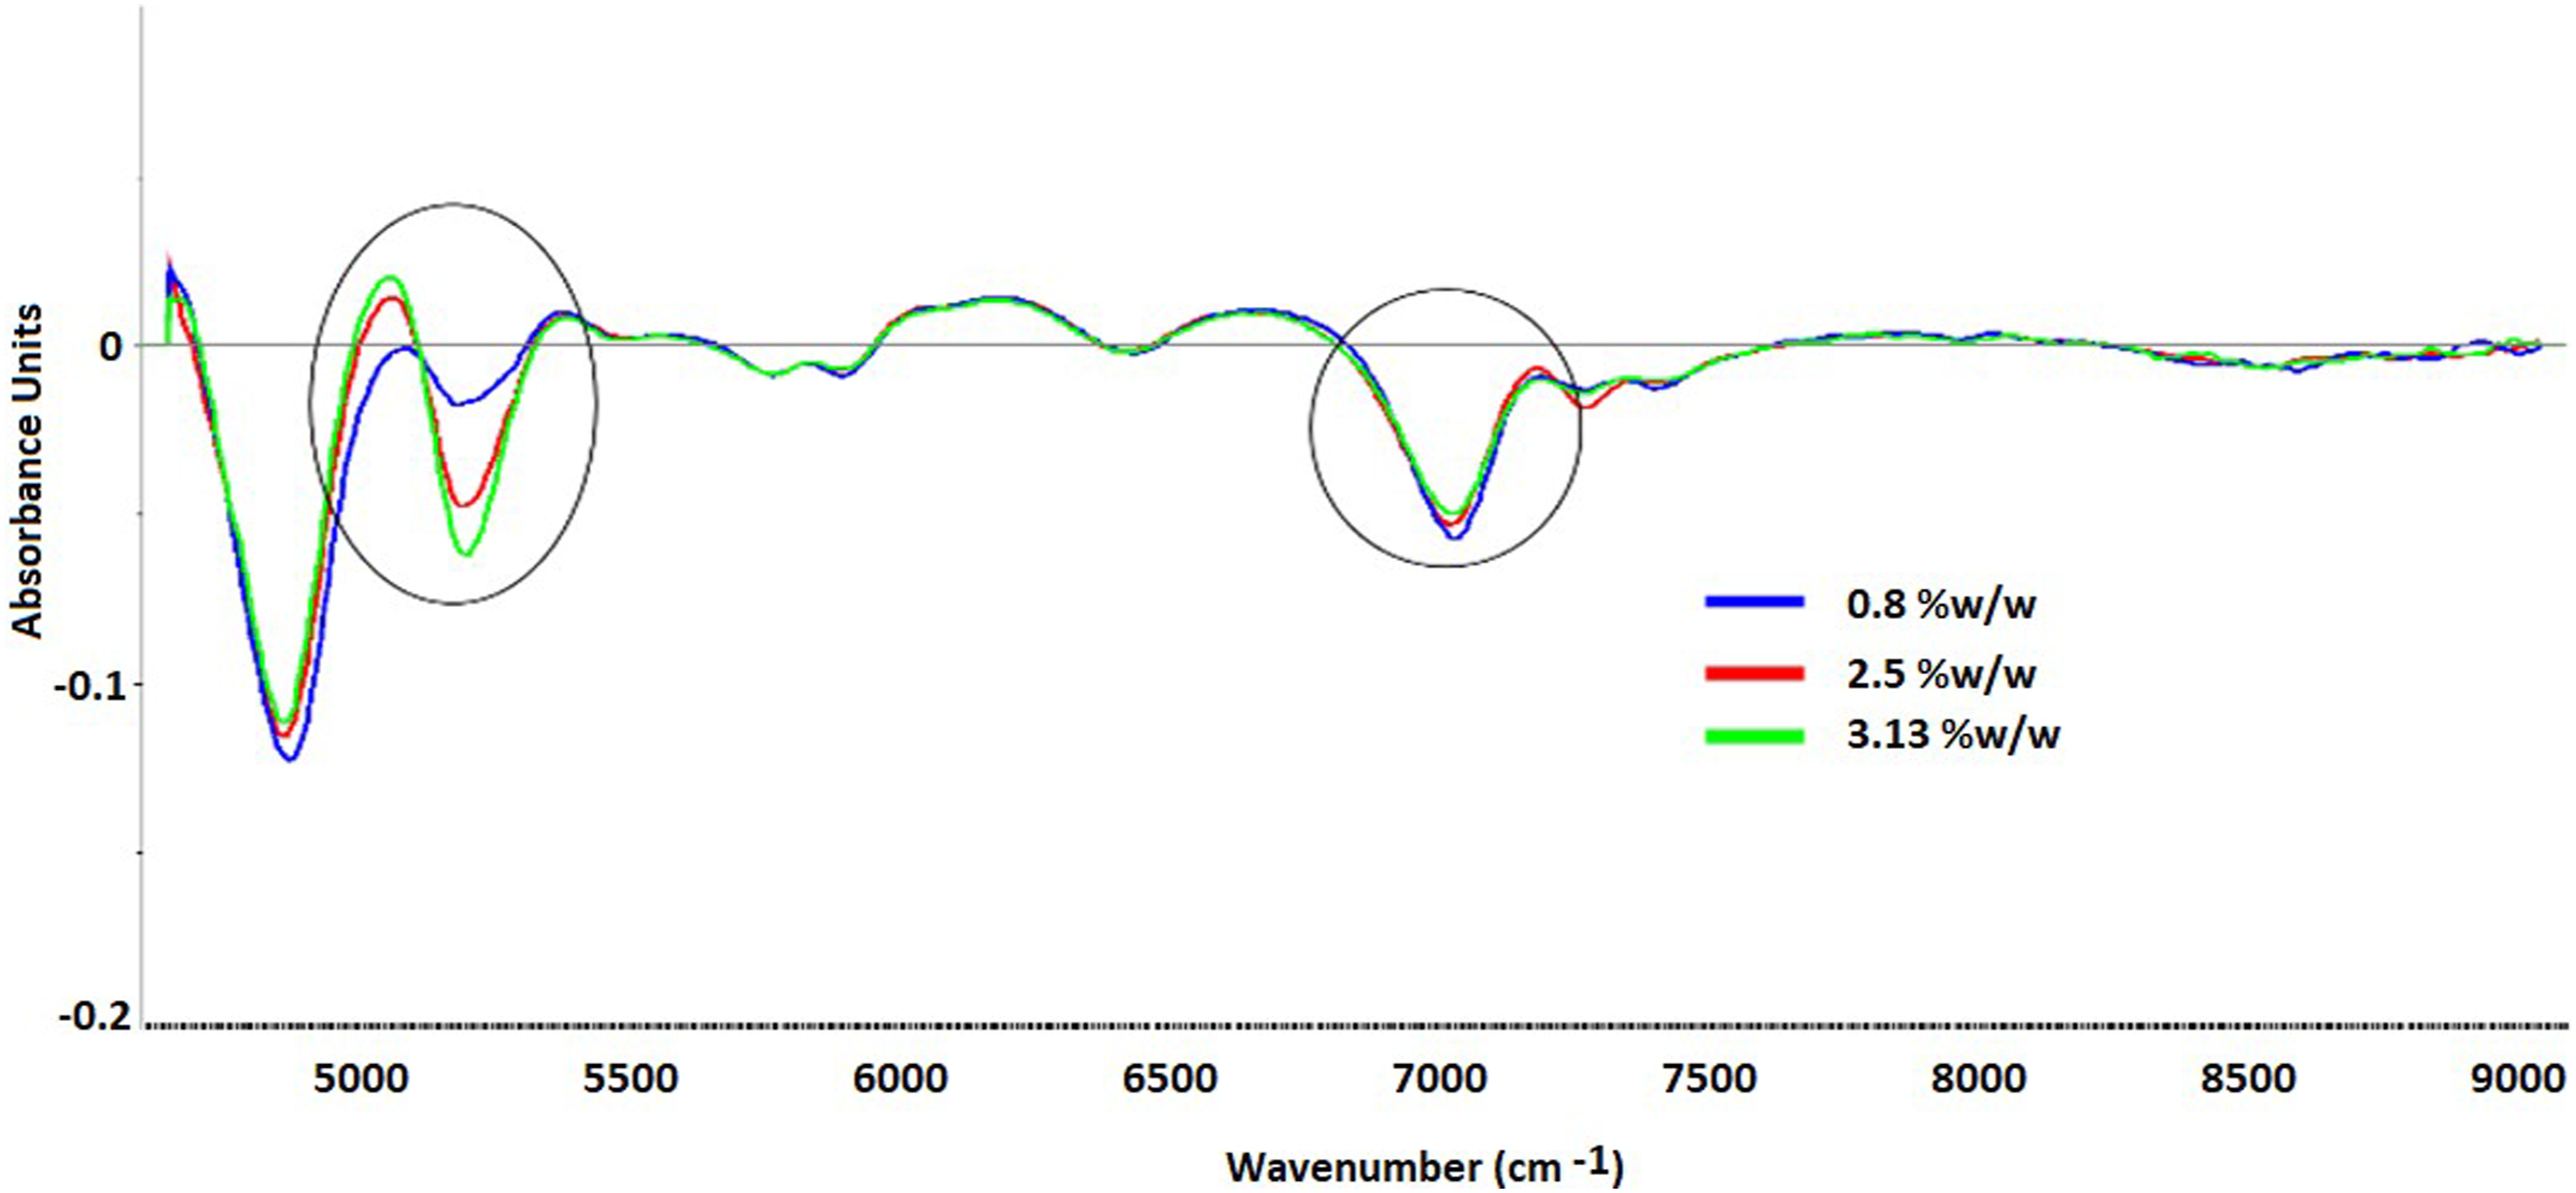
XRD analysis
Lactose monohydrate used in the product showed distinct peaks in XRD which is the characteristic of crystalline nature. But XRD of lyophilized product and lyophilized placebo displays a distinct ‘halo’, which is characteristic of amorphous materials (Figure 3). This observation is in line with the literature59,60 showing XRD of amorphous lactose. The exposed samples (MC: 5.33% w/w) show no significant change in the halo shape. Hence it can be concluded that lyophilized samples exposed at set exposure conditions are absorbing free moisture up to 5% moisture without any form conversion. XRD of lyophilized samples before and after exposure, showing amorphous state.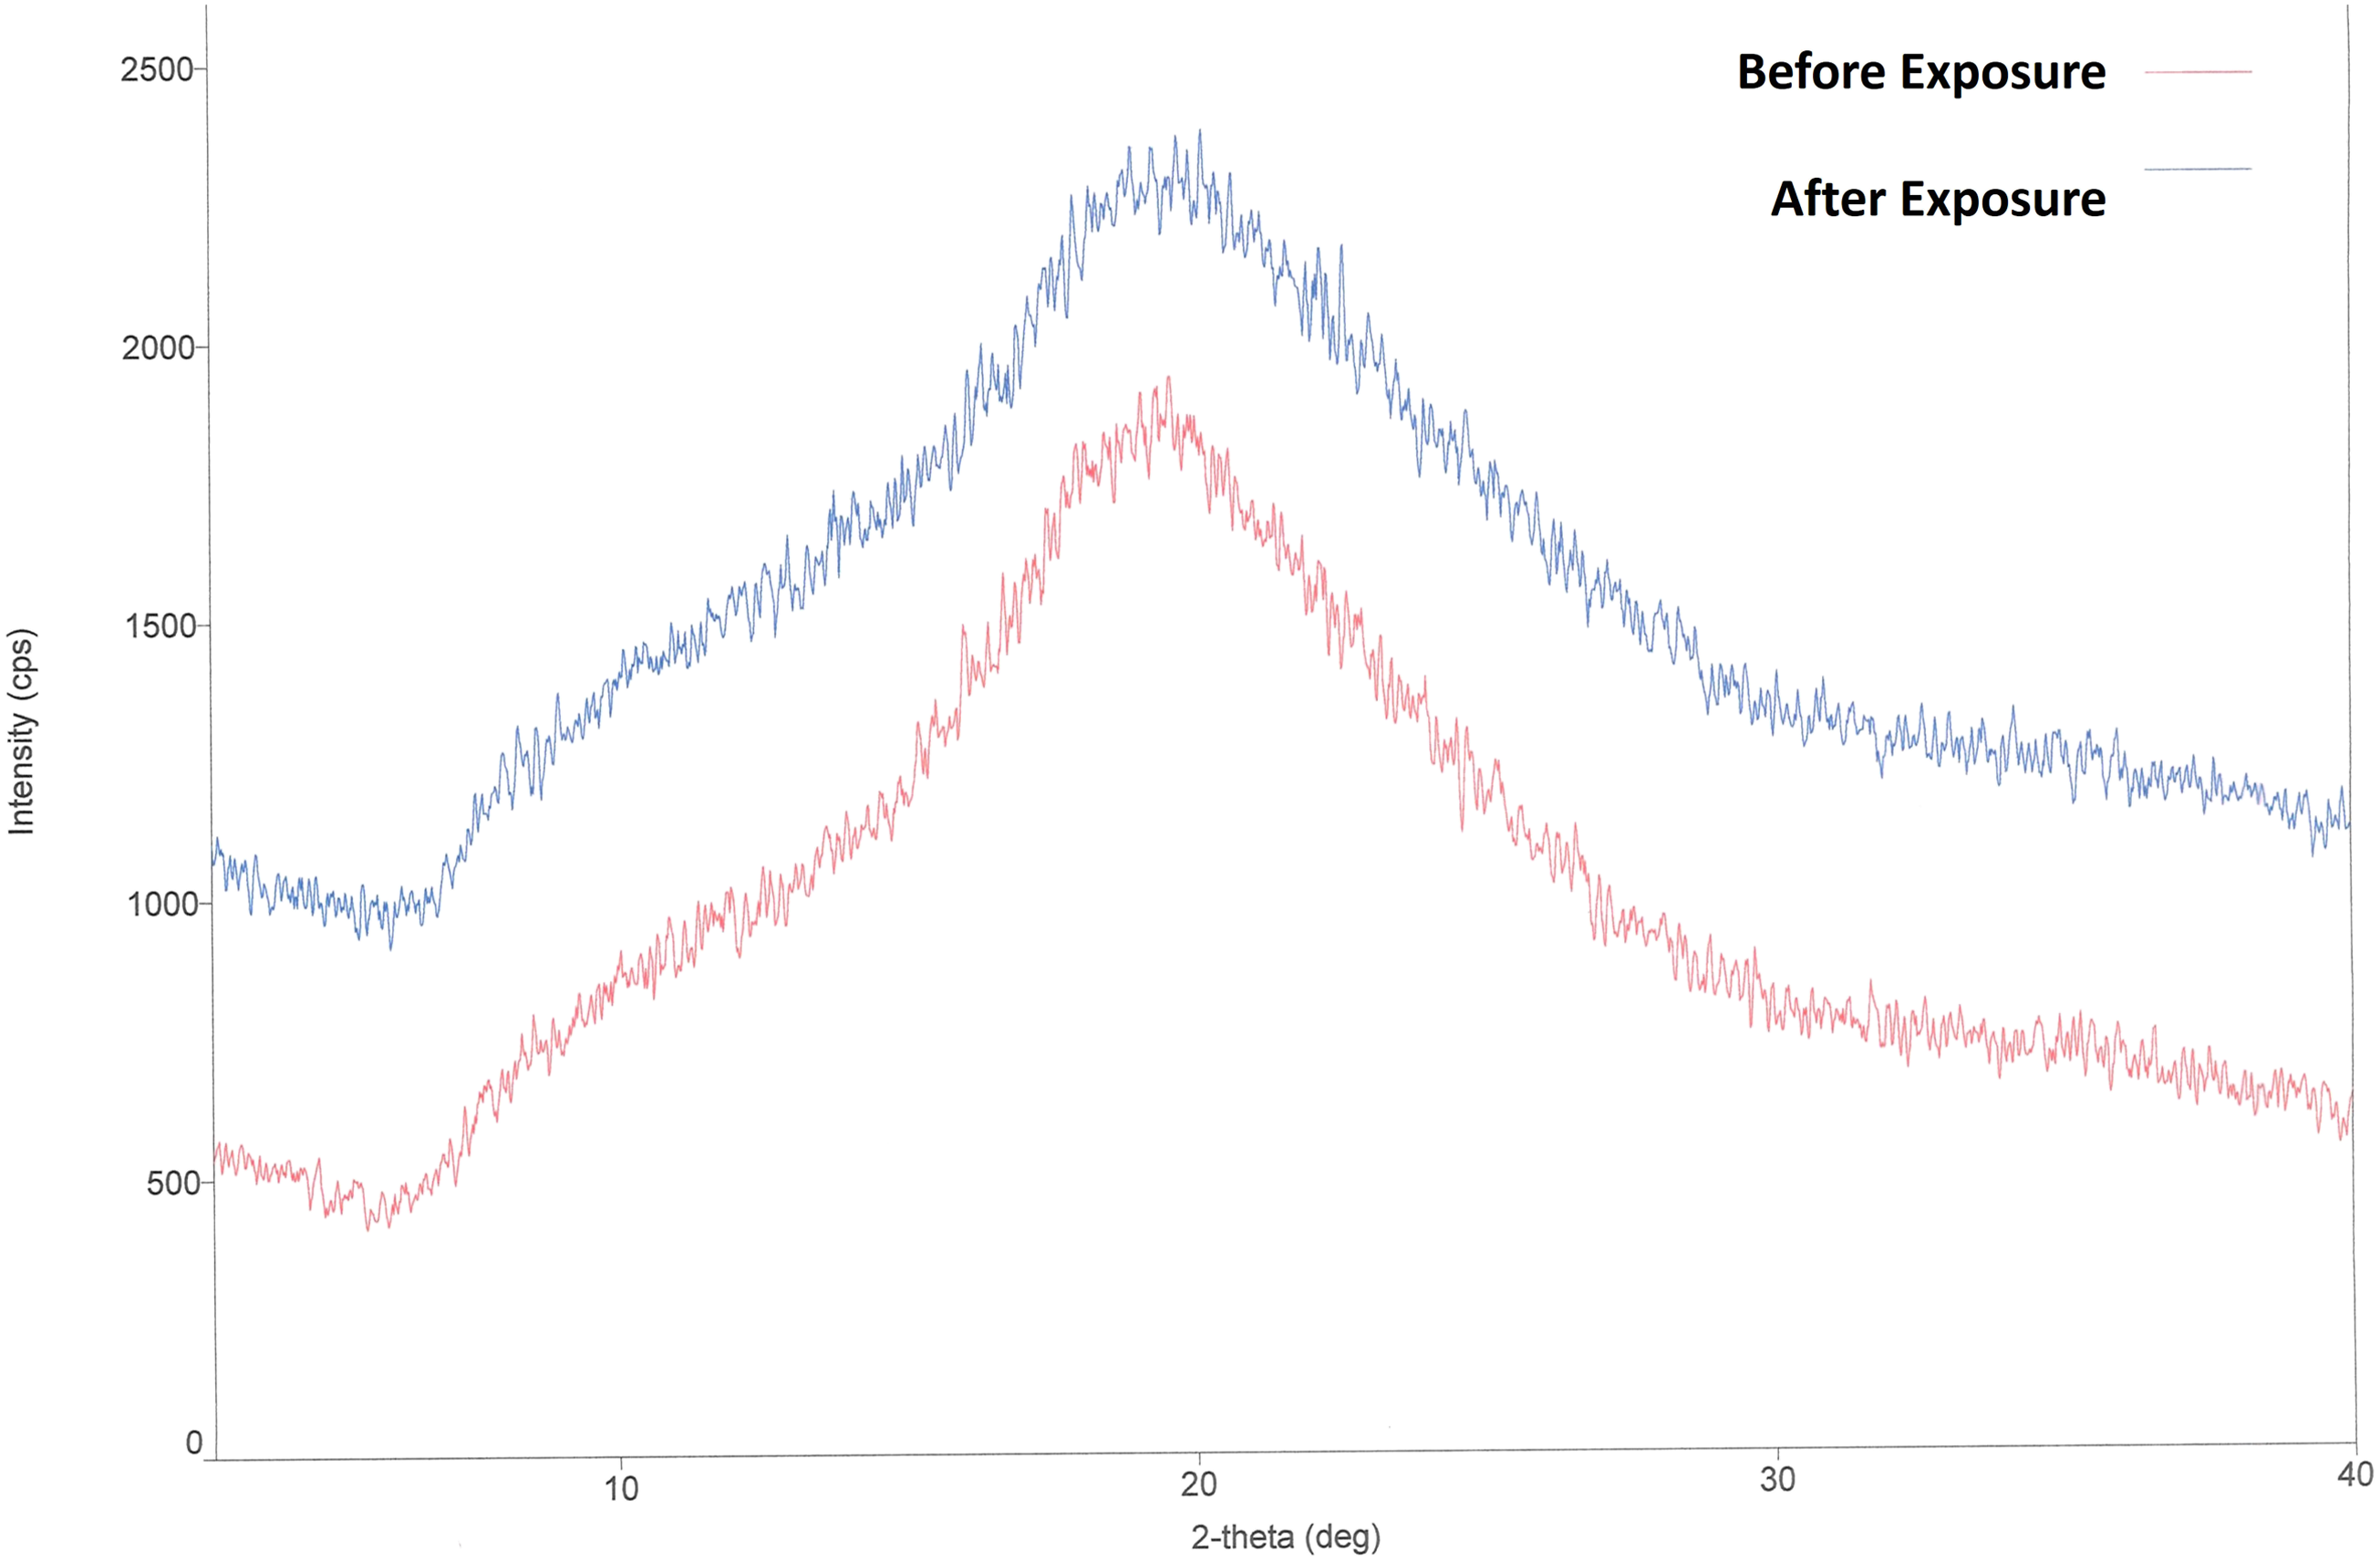
Raman analysis
Raman spectra of lactose monohydrate and lyophilized products are different (Figure 4). The characteristic peaks are seen over the entire fingerprint region of the lactose monohydrate (spectral range 1900-300 cm−1) while lyophilized samples show a broad band of amorphous pattern with an absence of sharp peaks and a decrease in spectral intensity with broad peak areas.
61
The maximum exposed samples having moisture content of 5.33% w/w, have shown an amorphous pattern. This proves the assumption that on exposure, the sample is absorbing moisture (up to 5% w/w) but there was no polymorphic change. Hence this free or unbound moisture can be considered for NIR quantitative model development for the moisture content prediction up to 5% w/w. Raman spectra of lactose monohydrate, lyophilized finished product and lyophilized placebo.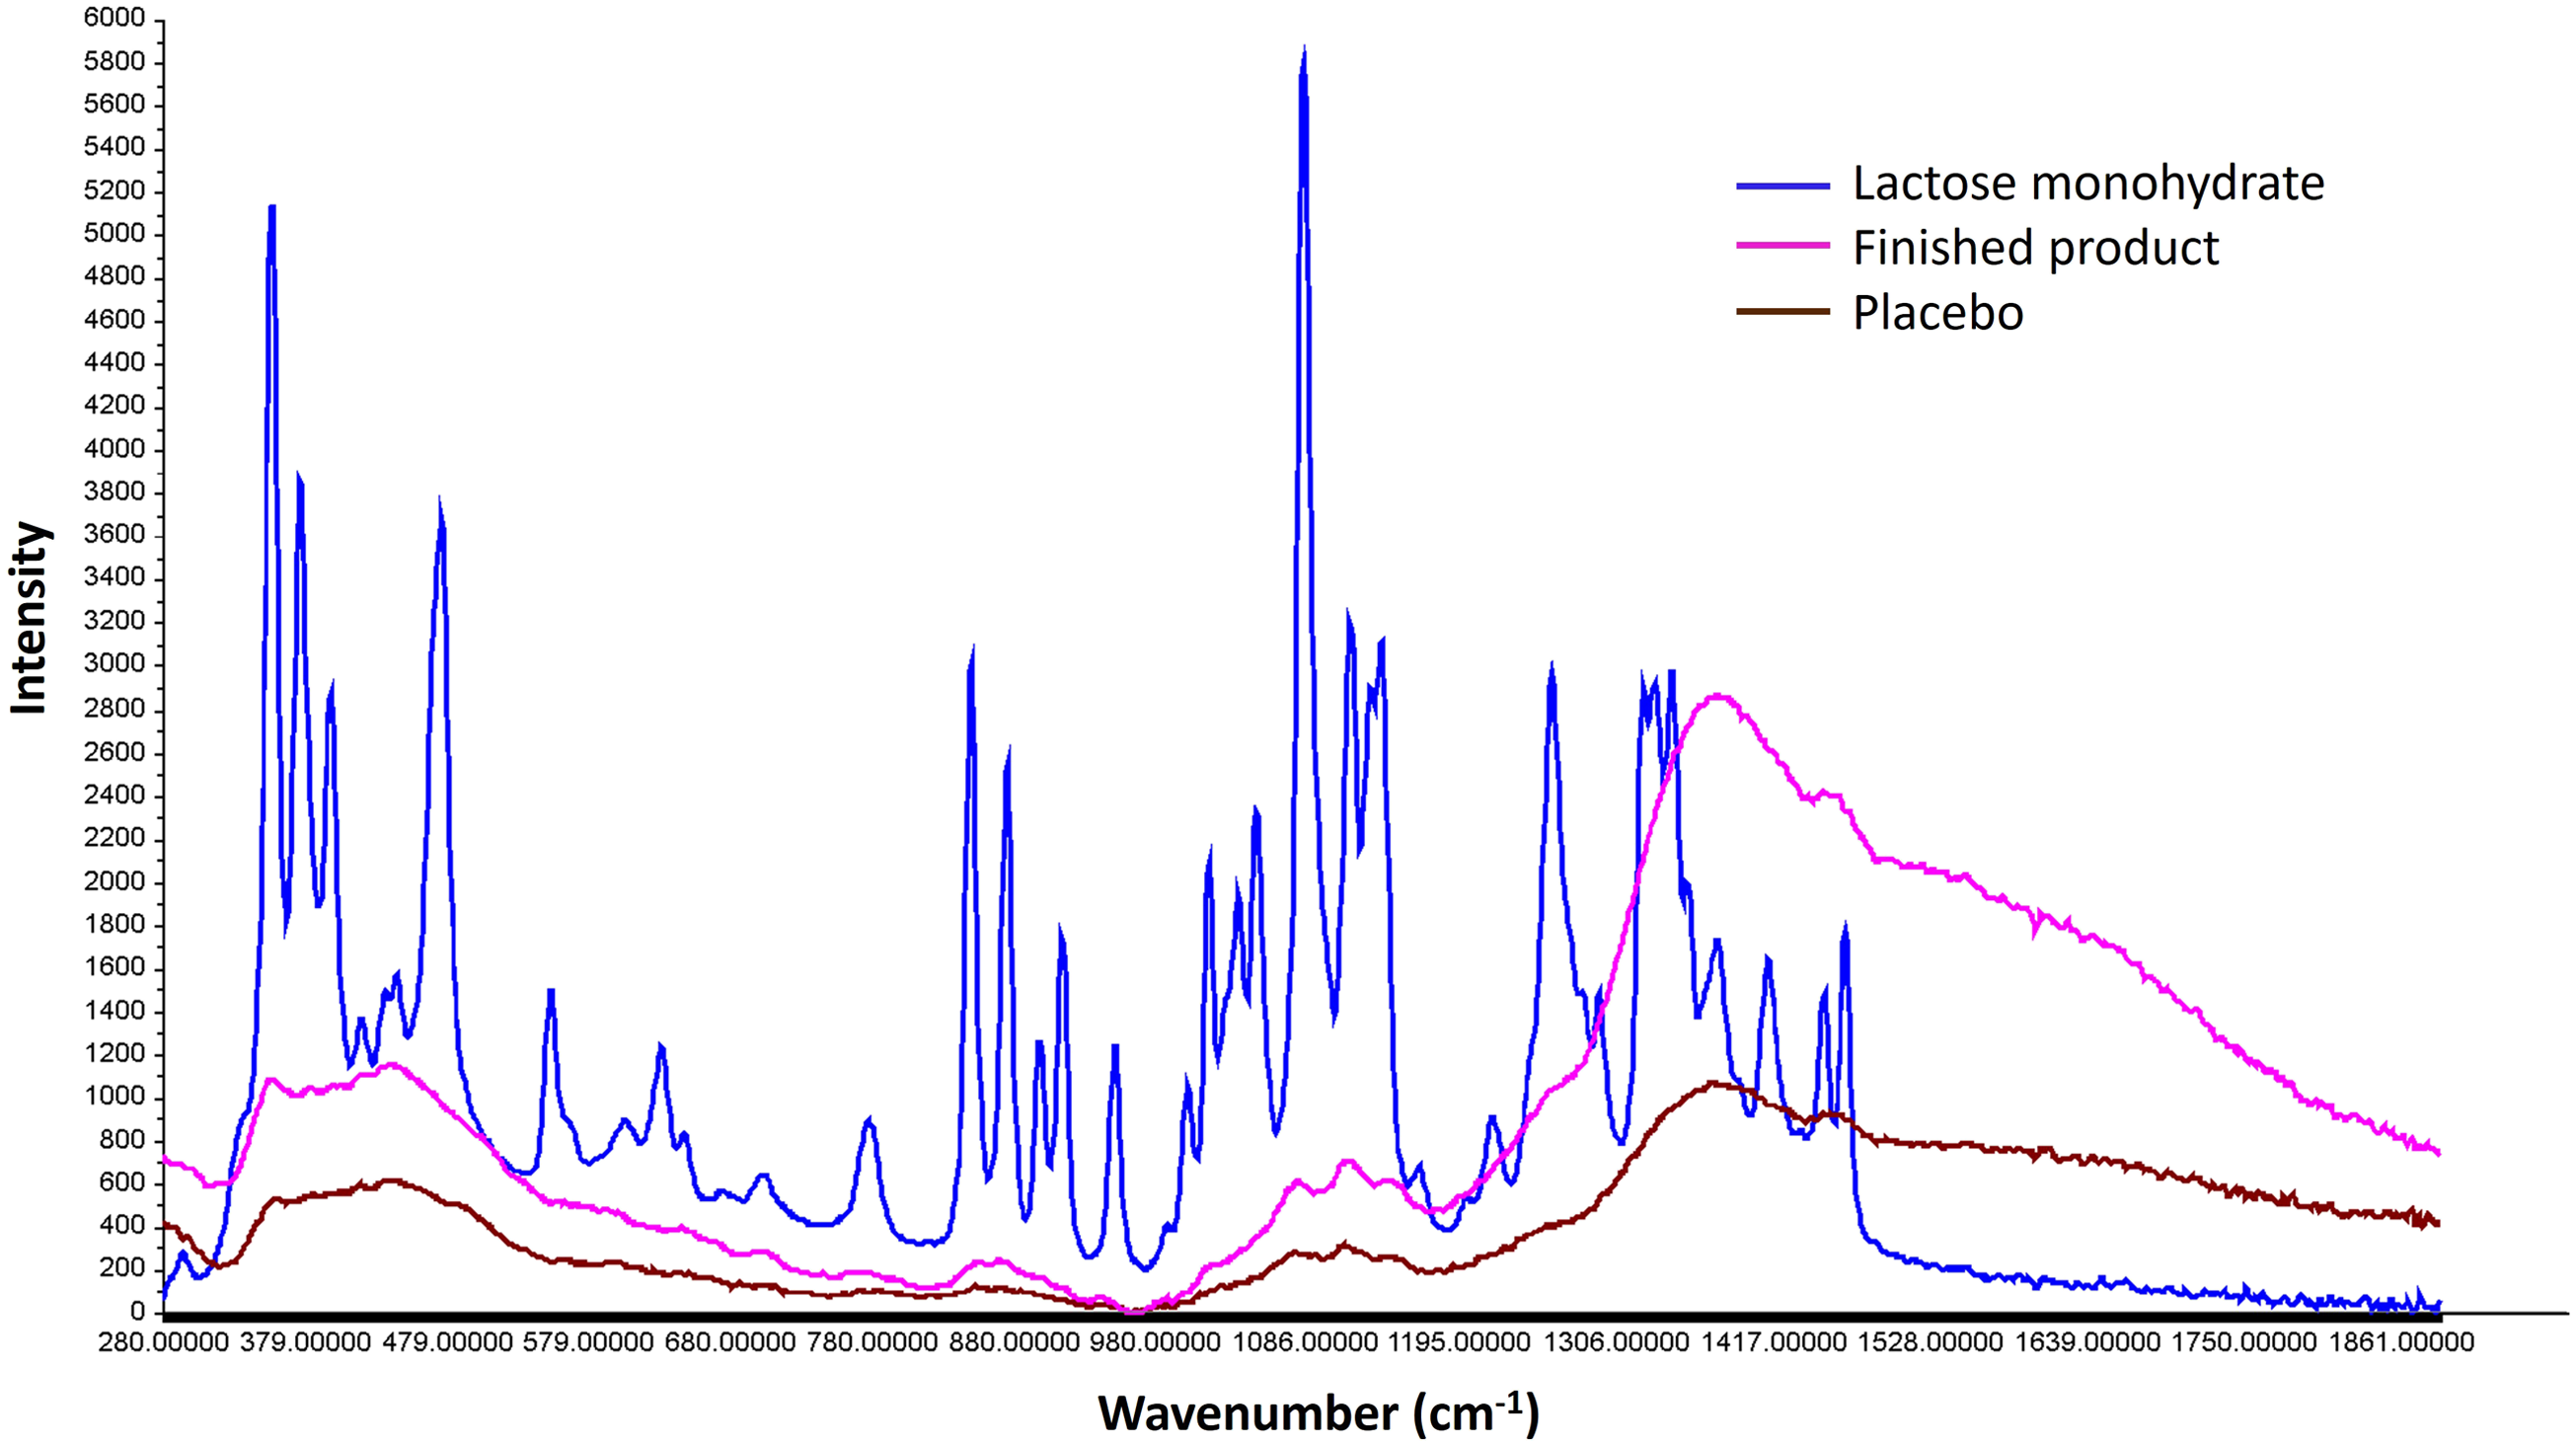
Sample orientation for spectral data acquisition
Due to the intact nature of lyophilized cake as a uniform slug occupying more than 1/4th volume of the vial, the samples were analyzed from the side and bottom of the vial focusing on the lyophilized cake using an NIR probe, in the preliminary study. The pre-treated spectra (SNV followed by 1st derivative) for both orientations were analyzed using PCA in the moisture-specific region of 5530–5100 cm−1. Different clusters for the change in moisture content are prominently seen along the principal component 1 (PC1) axis (Figure 5(a) and (b)). Although the PC1 contribution is 99% in both the orientations of spectra acquisition; greater spread is observed within the vials exposed at the same exposure conditions from the side orientation in comparison to the bottom orientation. This could be due to the curved shape of the small vial (2 mL), causing spectral variation. Based on this preliminary study, it was decided to analyze all the samples through the bottom of the vial. PCA analysis for the treated NIR spectra collected from (a) bottom and (b) side of the lyophilized vial.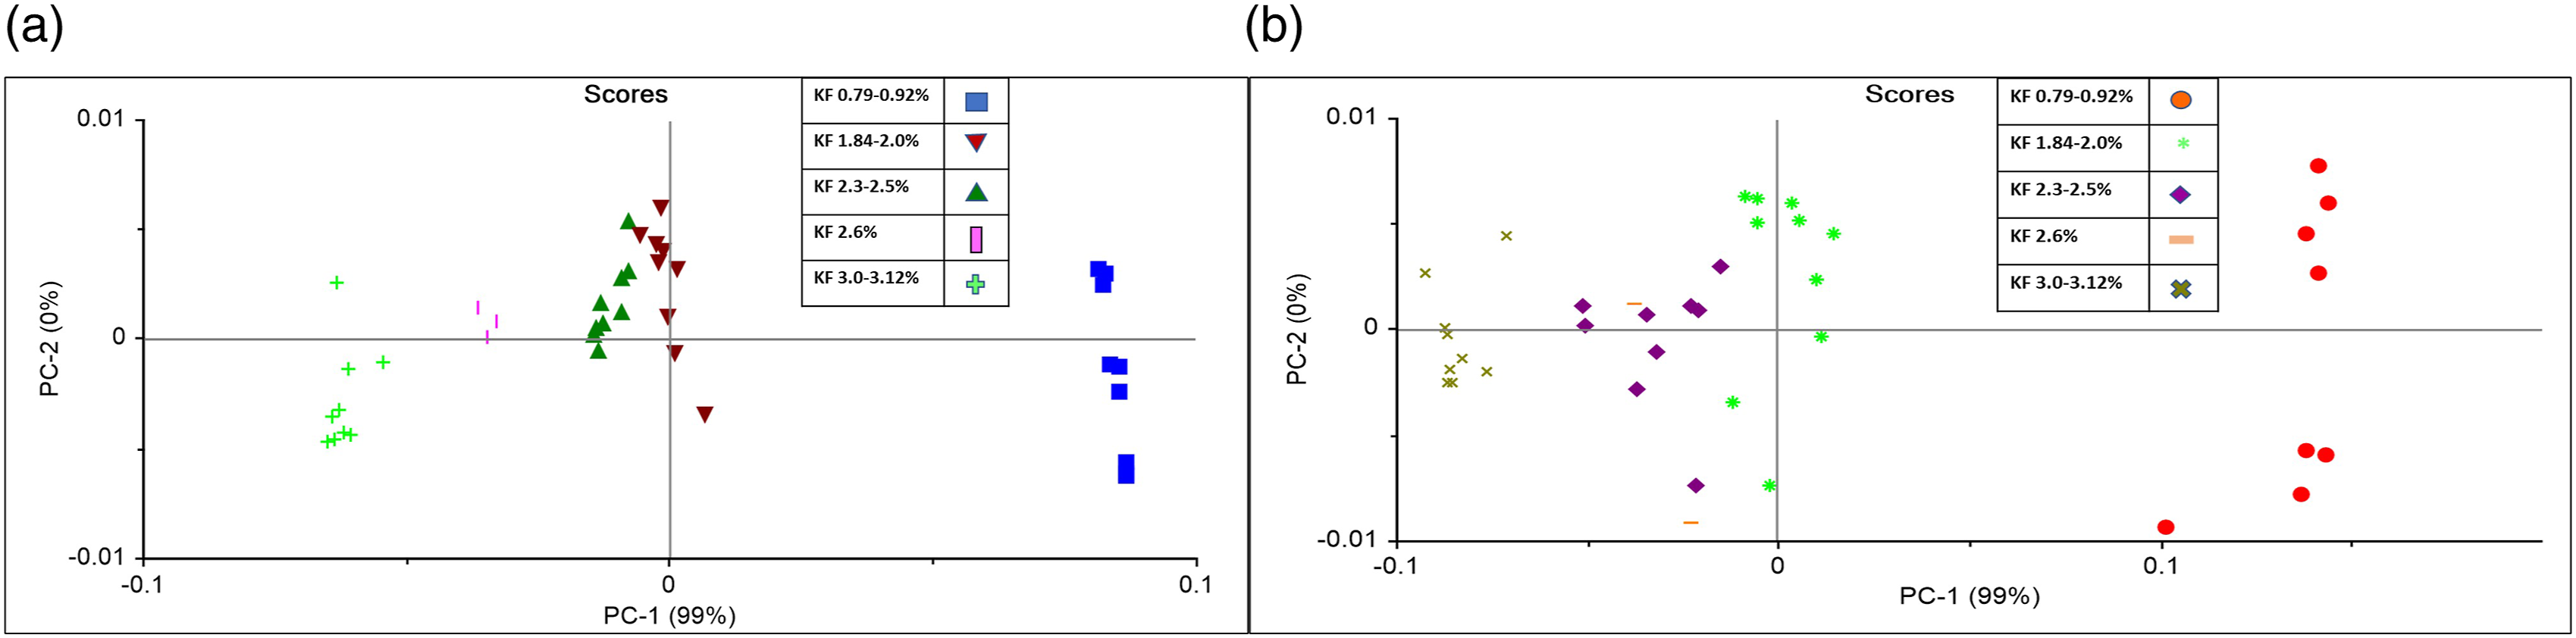
Model development and optimization
Gradient change in NIR spectra with the change in moisture level
From the entire region 12500 to 4500 cm−1, the noisy regions 12500 to 8000 cm−1 and 4750 to 4500 cm−1 region were excluded and only the 7950 to 4750 cm−1 region was considered. The raw NIR spectra (Figure S1-supplementary material) of calibration samples showed a baseline shift across the entire spectral region with the intense absorption bands at 5168 cm−1 and 6850 cm−1 without a distinct separation or correlation according to an increasing trend of the moisture content obtained from KF analysis. After SNV transformation baseline shift correction was observed (Figure S2-supplementary material), and spectral variation was prominently seen at 5168 cm−1. PCA analysis showed a PC1 contribution of 57% and a PC2 contribution of 27%. The loadings plot revealed that PC1 and PC2 contribution was mostly due to spectral variation at 5168 cm−1. However, the separation between spectra of different moisture content was not distinct. Hence, derivatization was further applied to resolve the overlapped band, which provided a better understanding of the gradient change in the moisture content. After SNV followed by 1st derivative, the line plot of spectra (Figure 6) revealed that the maximum variation in the spectral intensity was seen at 5755 to 4950 cm−1 and 7700 to 6800 cm−1. PC1 contribution increased to 84% and PC2 contribution was 11%. Further transformation with SNV followed by 2nd derivative, PC1 contribution was not improved. It explained 78% variation while PC2 explained 8% variation. Hence, SNV followed by 1st derivative was chosen as the preferred pre-treatment for the model development. The model strength was optimized by considering different spectral regions. The comparative model parameters are tabulated separately. (Table 1-supplementary material). Treated spectra of calibration samples showing gradient response with the change in water content.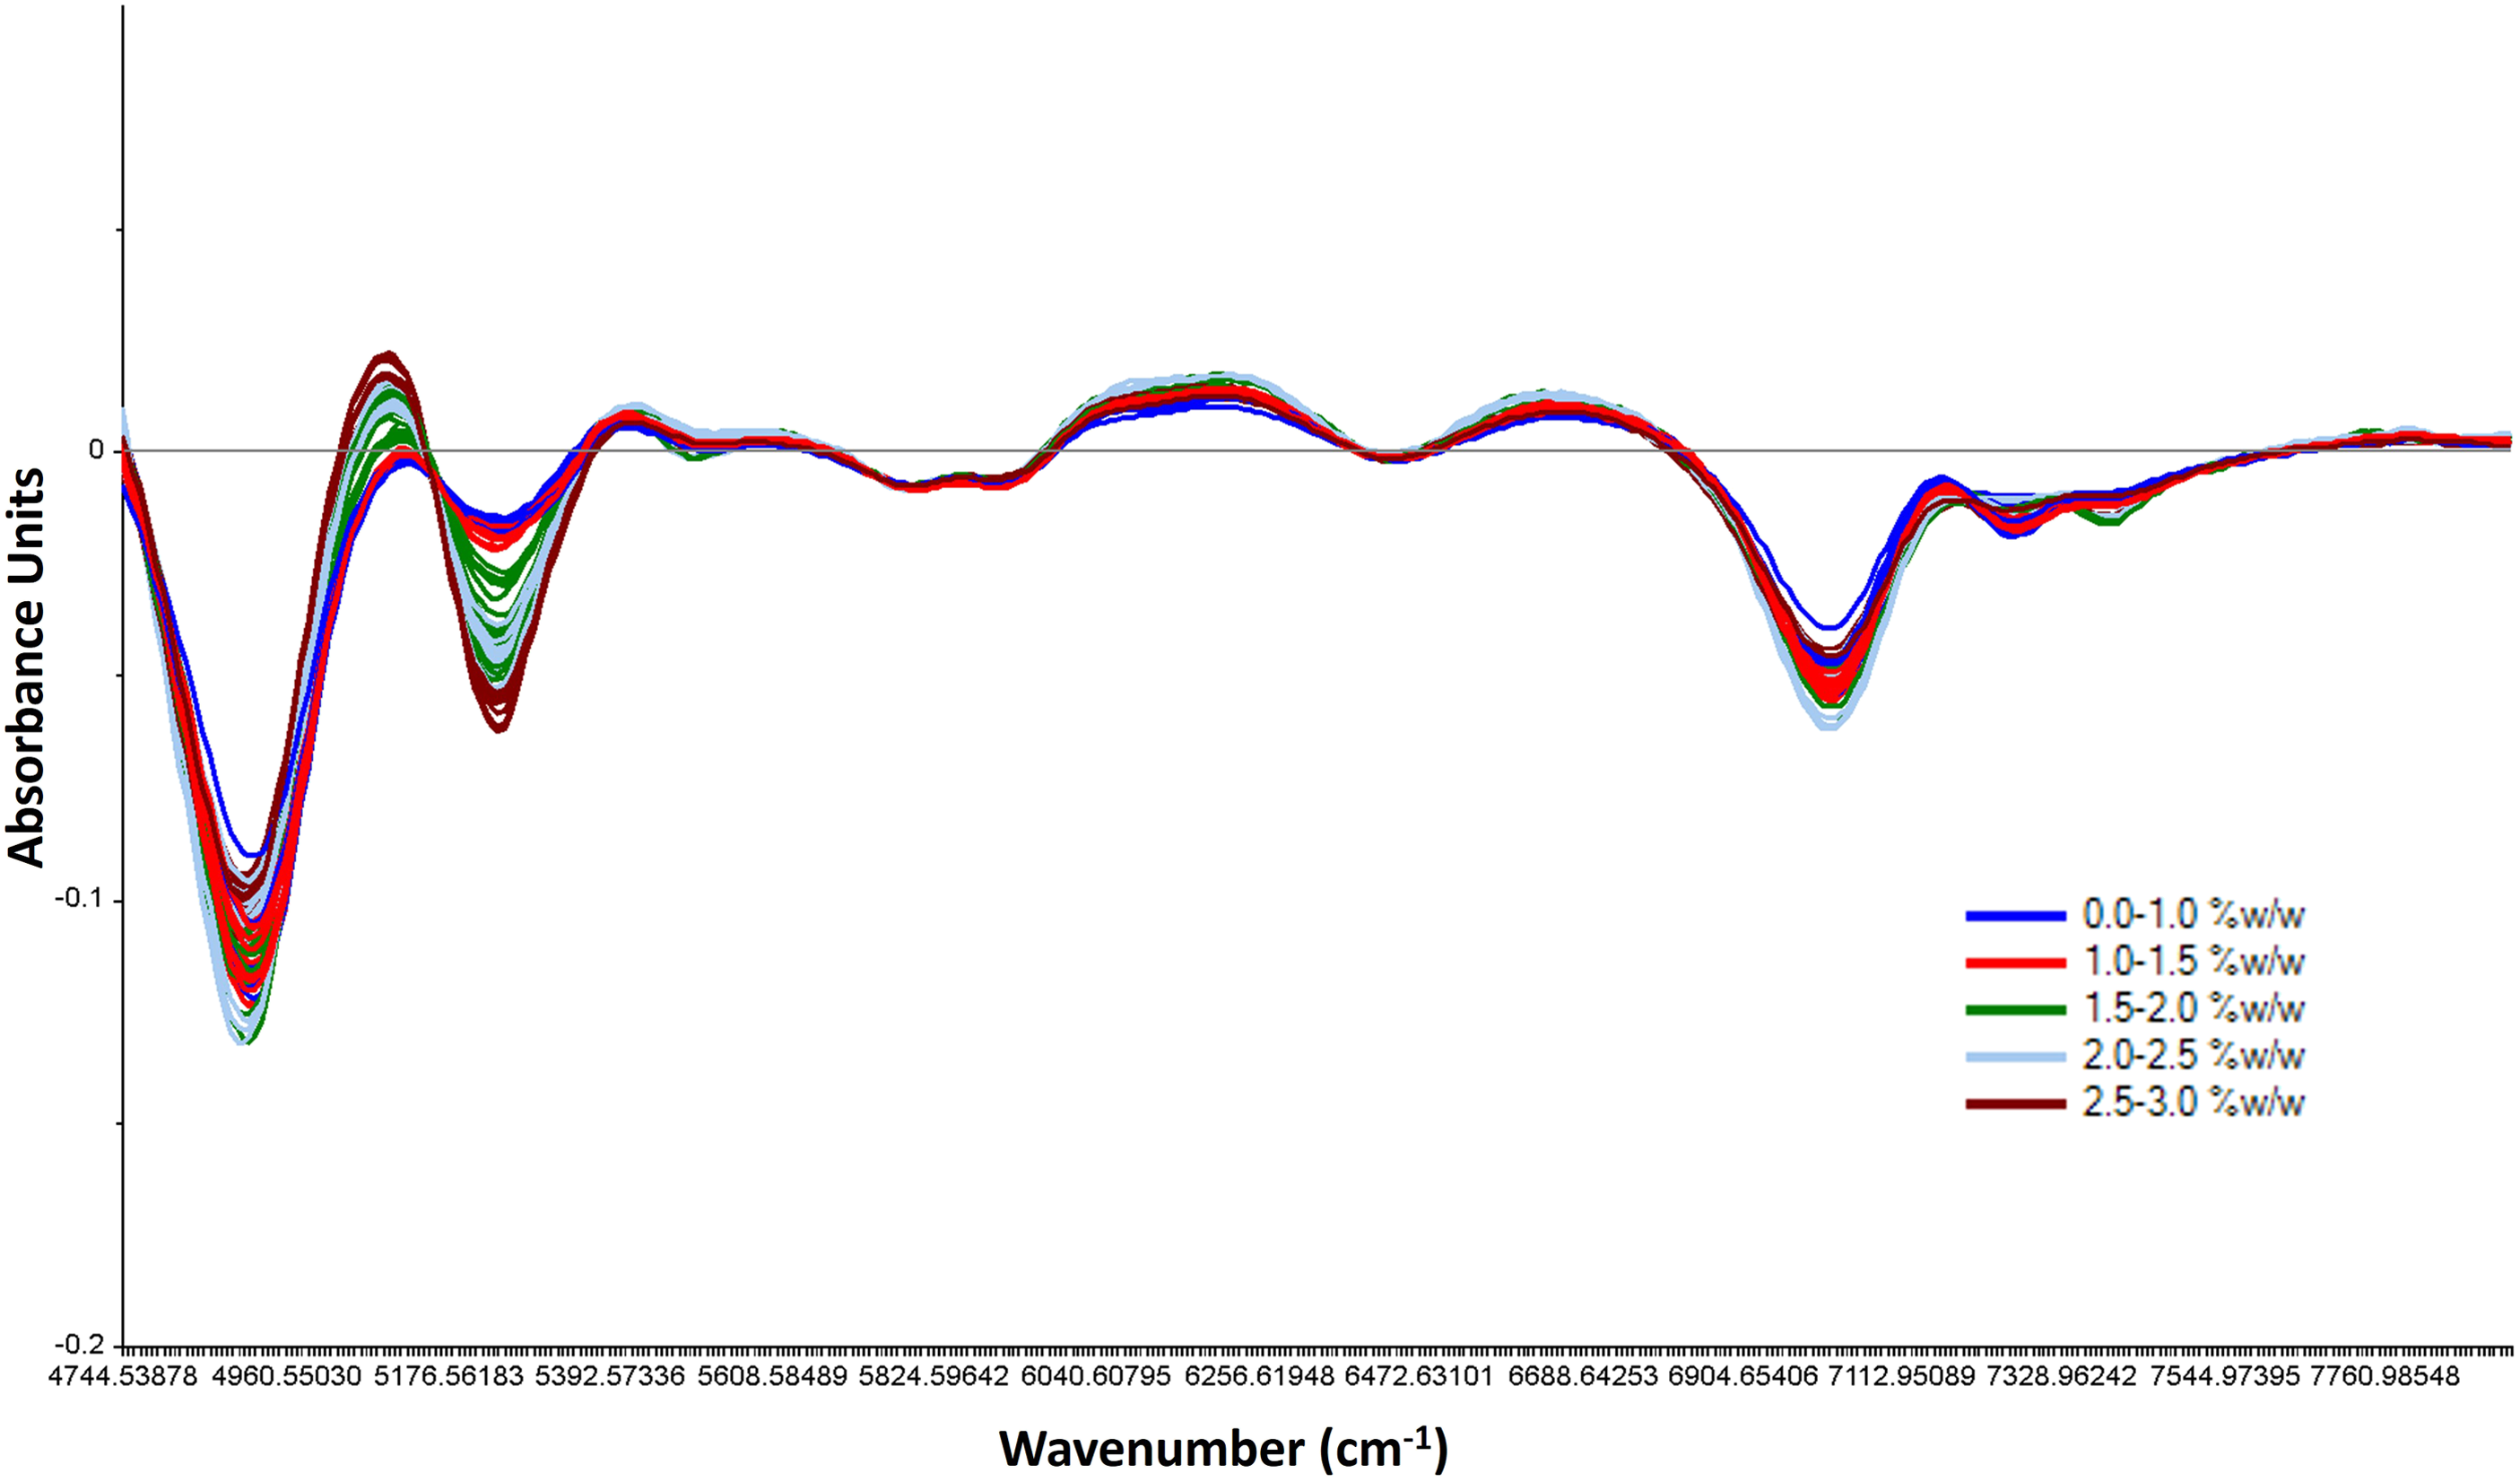
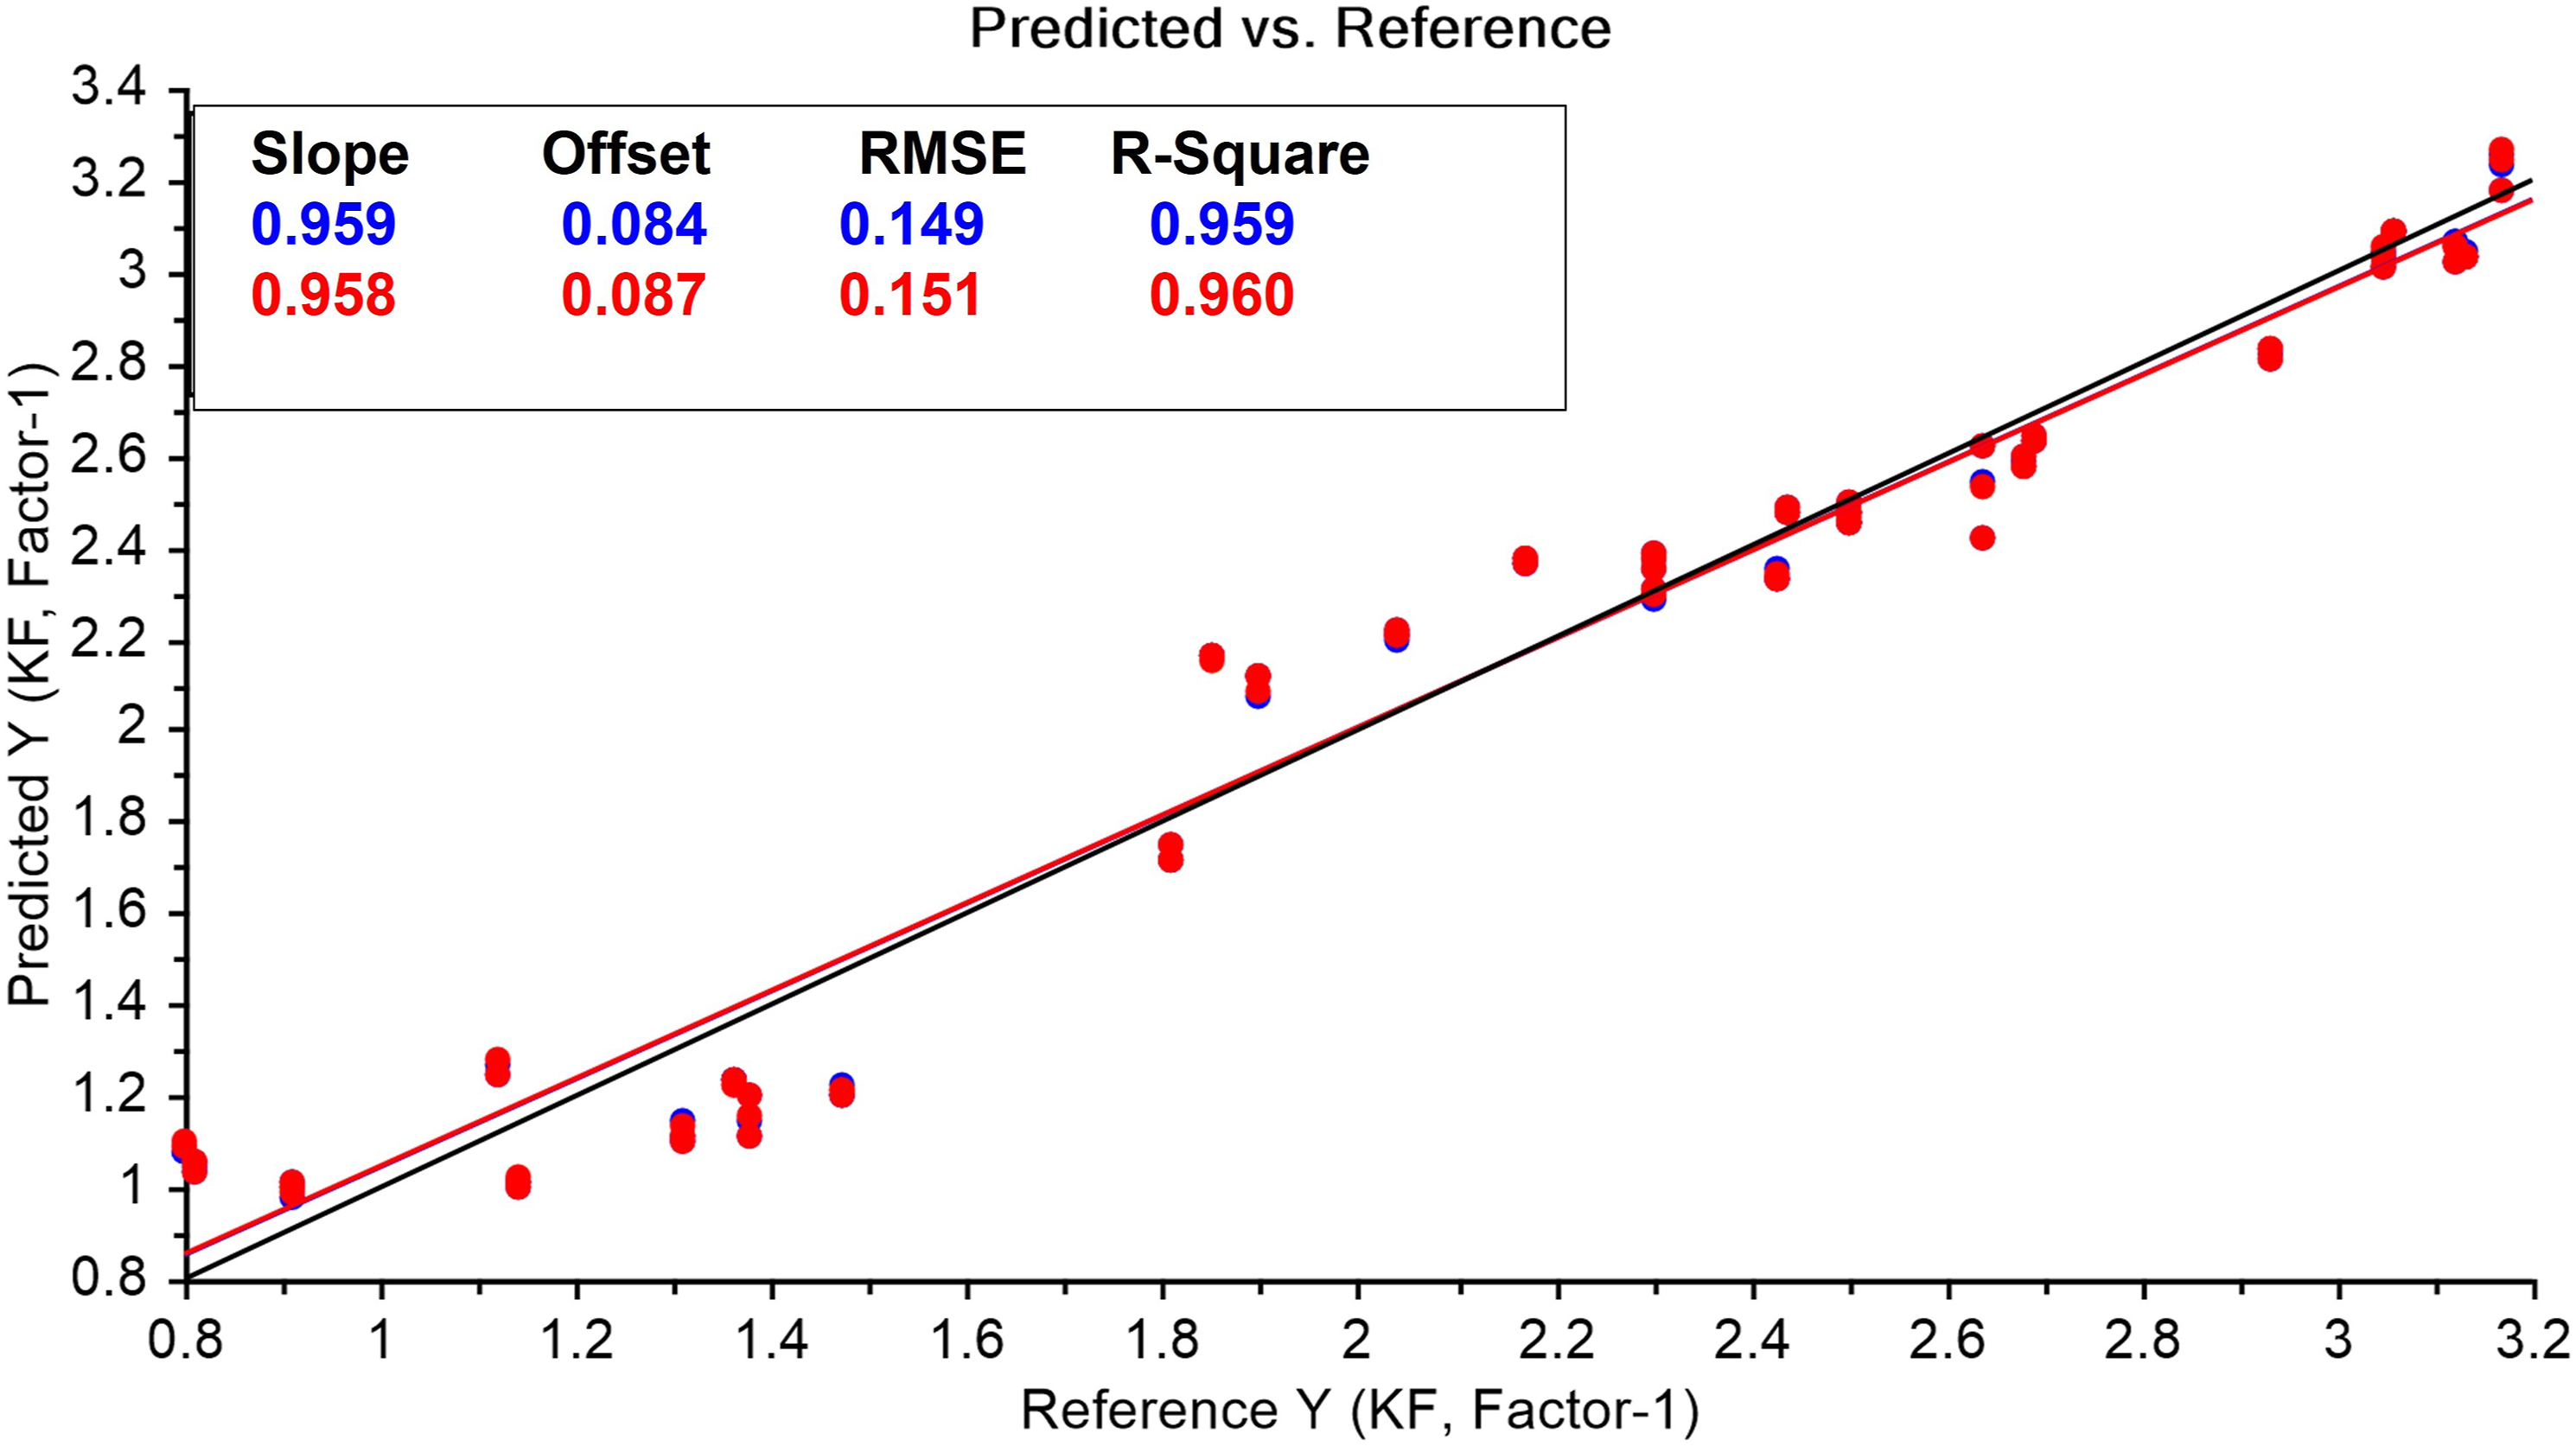
When PCA was done for pre-treated spectra considering 7930–4744 cm−1 region, PC1, and PC2 contribution was 76% and 17%, respectively. The loadings plot revealed that PC1 contribution was purely due to changes at 5168 cm−1. Hence, further PCA was done considering 5531 to 4744 cm−1 and 7200 to 6200 cm−1 separately to understand the contribution of both regions distinctly. The PC1 contribution was improved to 81% for 4744–5531 cm−1 and reduced to 66% for 7200–6200 cm−1. This indicates that the region around 5168 cm−1 is addressing the spectral variation with the change in moisture content. At 6850 cm−1, which overlaps with the CH band stretching of lactose in the region of 6900 to 6200 cm−1 (1st overtone of OH bond) the separation in the spectra was not clear. Hence the PLS was developed considering only a combination band of OH bond with maximum variation in 5755 to 4950 cm−1. PC1 contribution was increased up to 98% while PC2 explained only 1 % (Figure 7) and the loadings plot depicted that PC1 contribution was because of the change in 5600-4950 cm−1. The PLS regression model (Figure 8) was built in 5755 to 4950 cm−1 region having R2 0.96 and RMSE 0.149 for calibration. The model was cross-validated internally using the Kernel algorithm having R2 0.96 and RMSE 0.151 for validation. The same model was used for further verification and external validation. Scores and loadings plot for NIR spectra of calibration samples with pretreatment. PLS regression model for water content prediction using NIR method built considering specific region of 5755-4950cm−1.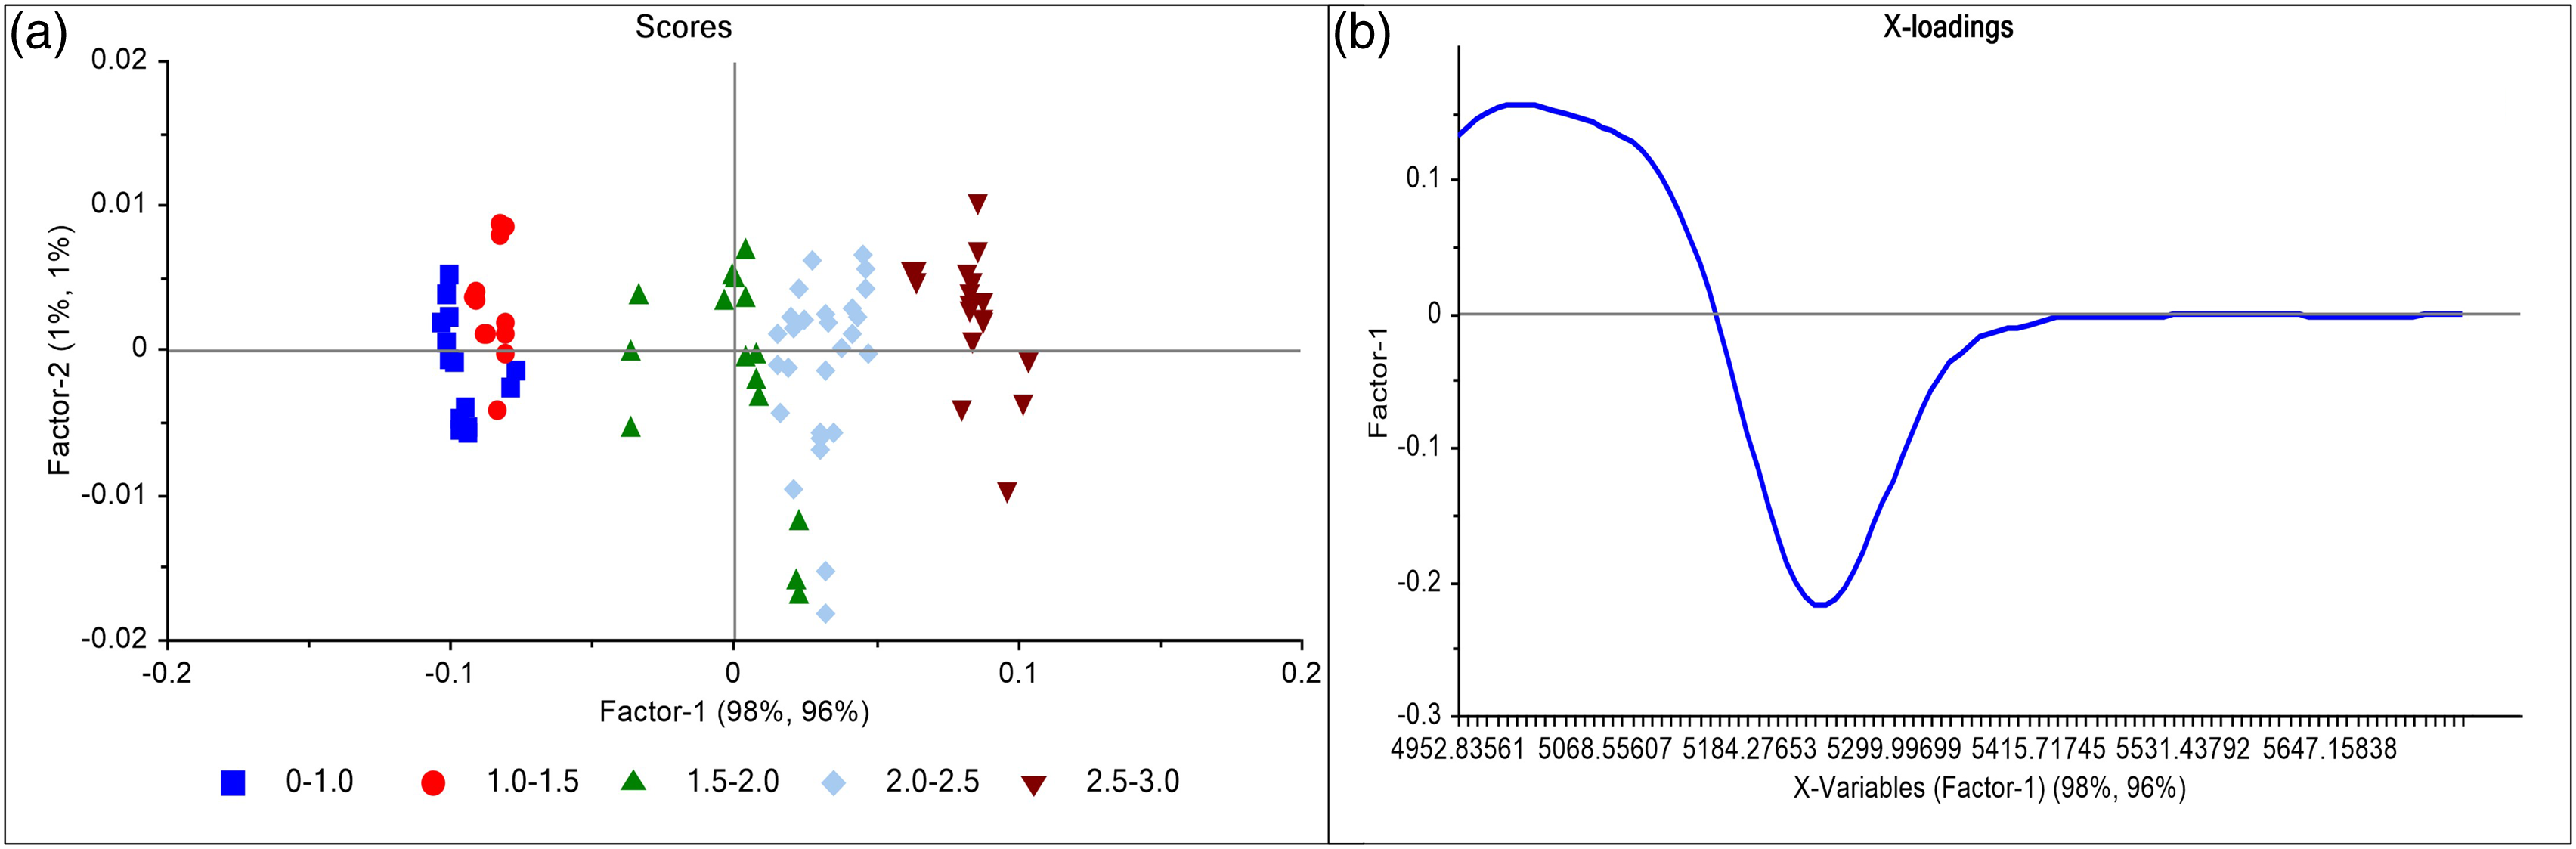
Validation of the PLS model
Specificity
Specificity of the model towards the analyte (i.e., moisture) in the lyophilized formulation was confirmed in the loadings plot where PC1 has a 98% contribution due to spectral variation in the region 5755–4950 cm−1 which is specific to the water absorption band for NIR.
Linearity
The PLS model established the linearity in the range of 0.8 to 3.12% moisture content with a good fit of slope and offset of 0.959 and 0.084, respectively. The linearity plot (Figure 9) of predicted versus reference values for external validation samples reveals a correlation coefficient of 0.978 (p-value is 0.011 at 95% Confidence interval). Predicted vs measured plot of moisture content by Karl Fisher.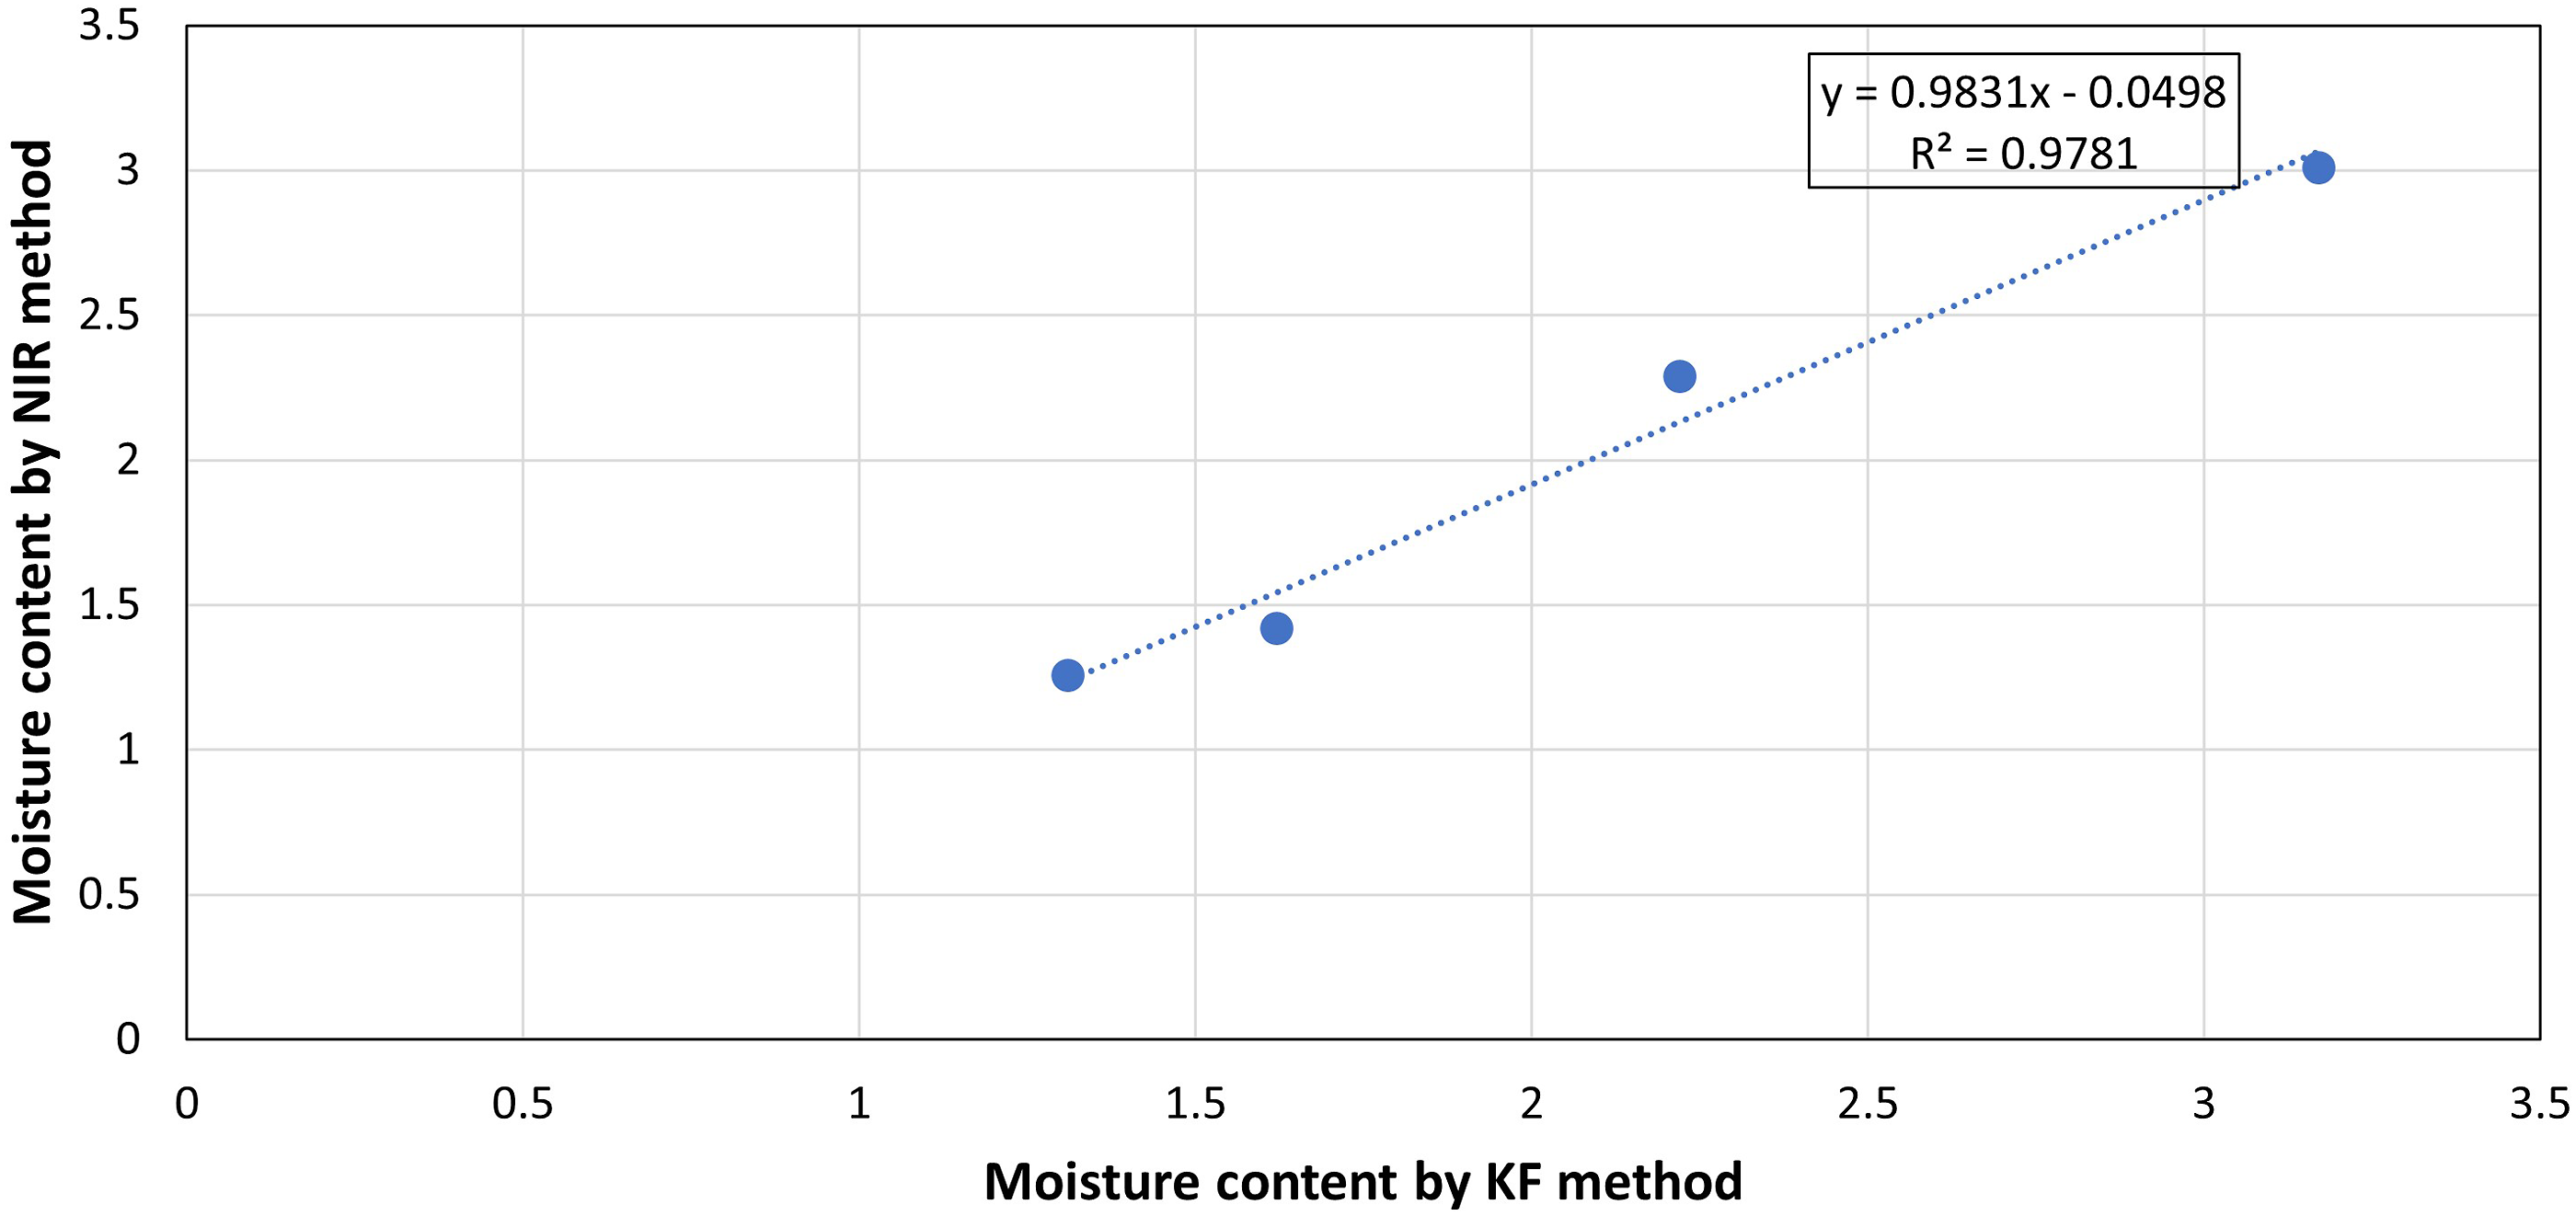
Accuracy
Independent validation set was used to determine the accuracy of the NIR method with moisture content in the range of 1.3–3.17% w/w. Figure 10(a) shows that the NIR predictions for batches A, B, C, D, and E are closely matching with the moisture values obtained from the KF method. Moisture content estimation by NIR method against KF method for batches with (a) process change and (b) formula change.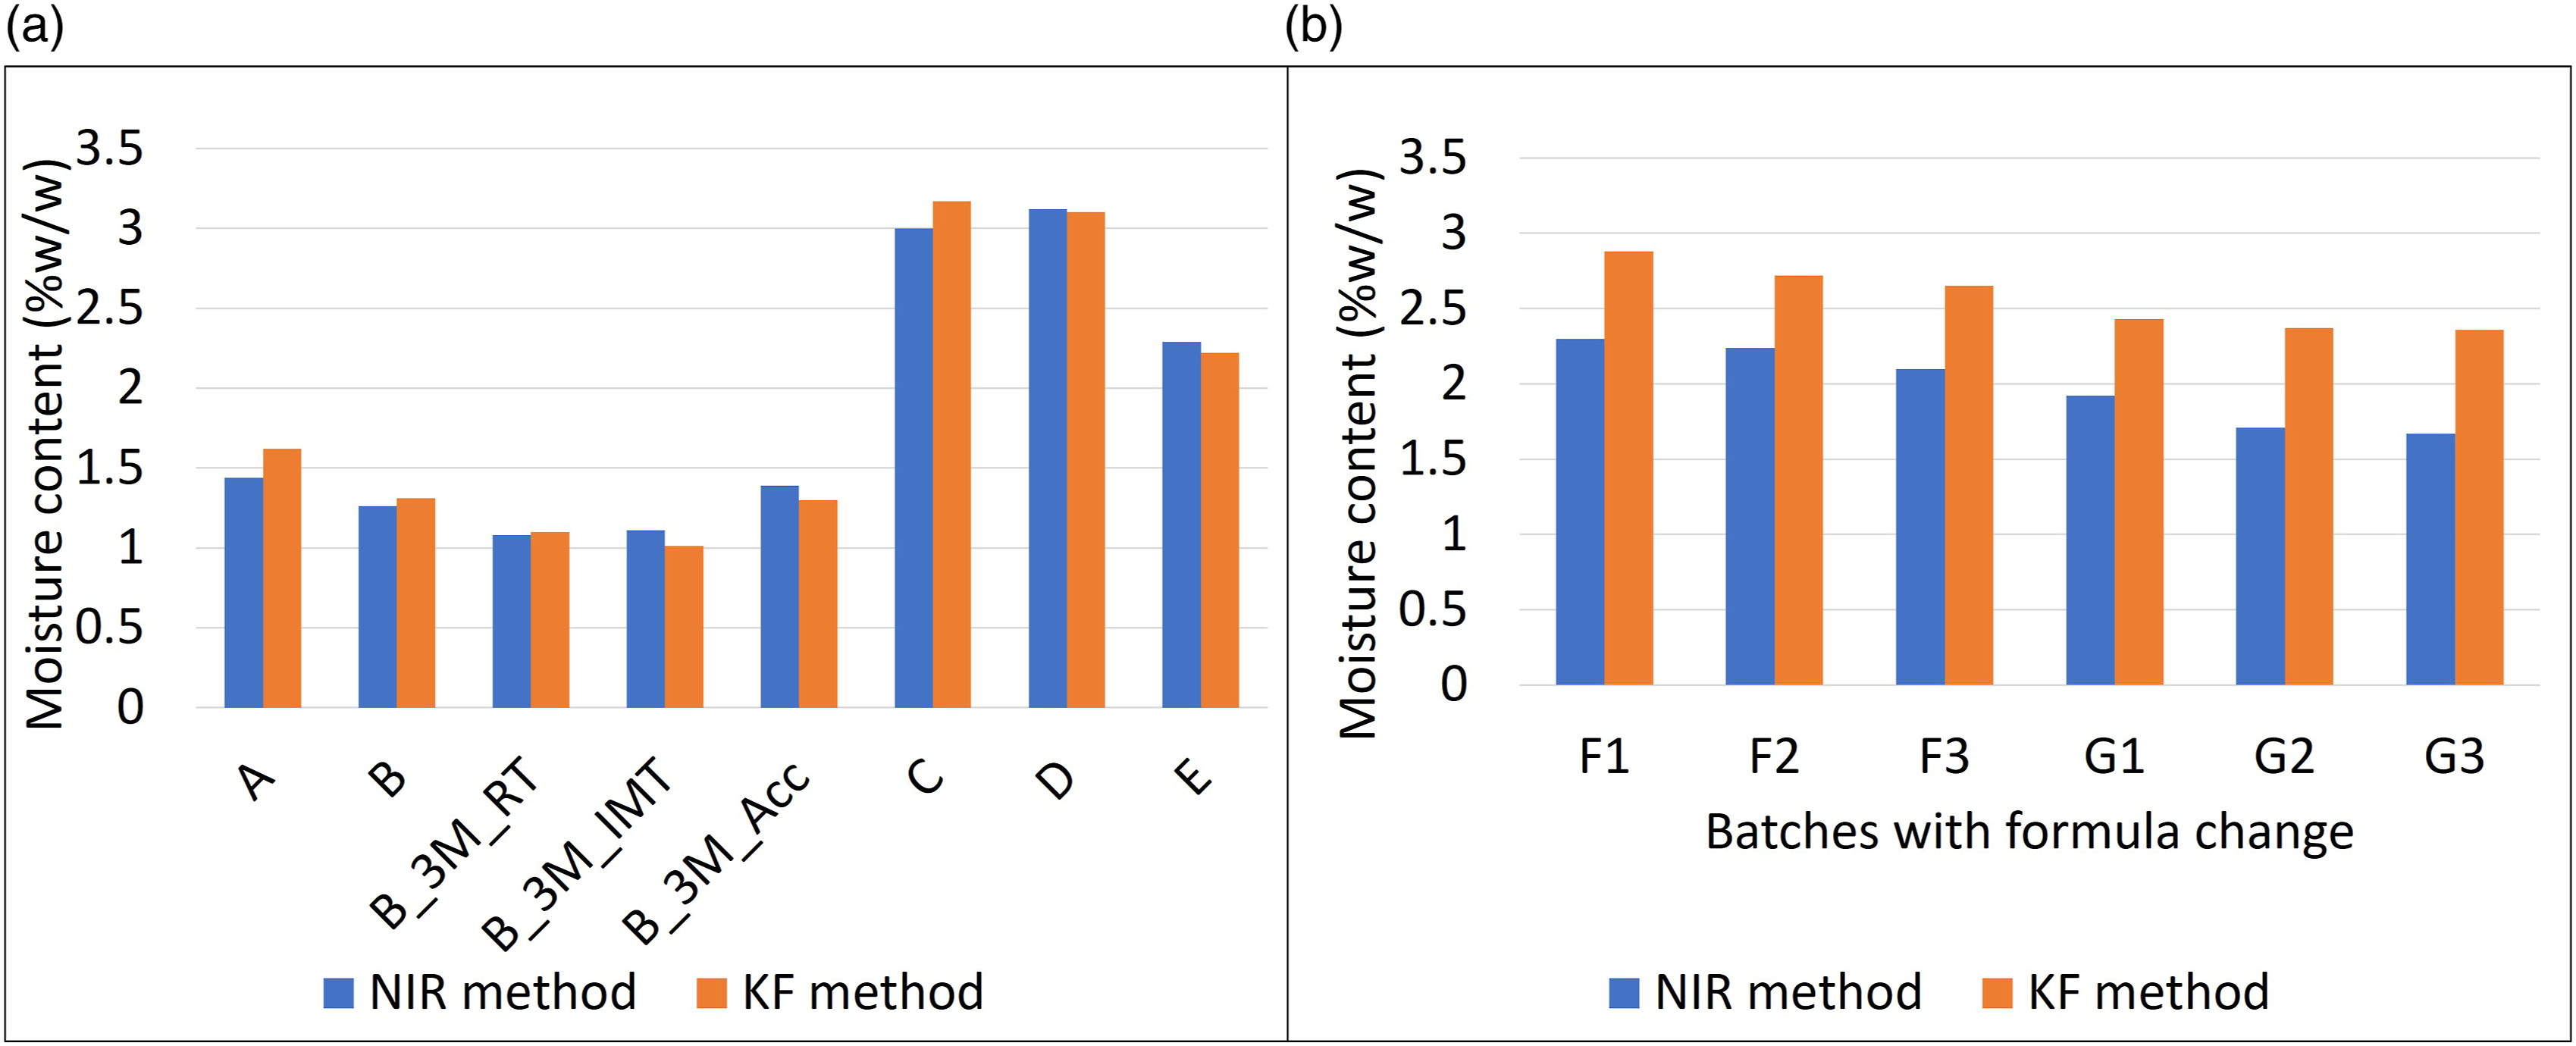
Precision
Reproducibility within the same vial was (expressed as the standard deviation within 3 NIR predicted readings per vial) observed below 0.03 and intermediate precision of NIR prediction on different days was below 1.5 in terms of %RSD. Considering the highest standard deviation (0.03), and slope of the regression line (0.978), LOD and LOQ were calculated as 0.10% and 0.31% w/w, respectively.
Robustness
The developed NIR specvtroscopic method for the measurement of moisture content of lyophilized products was robust for predicting accurately the batches with different batch sizes and process parameters. The PLS regression model could predict accurately (RMSEP 0.151) and precisely (% RSD less than 1.5) the different vials from the same calibration batch A and the other batches (Figure 10(a)) along with the scale-up batches in which lyophilization process parameters were varied. The predictability of the PLS model was found to be closer (bias of 0.0003) against the reference standard KF values.
This indicates that the model is accurate irrespective of different samples from the same batch and different batches having differences in batch size and process change. The stability samples of lab scale batch B could be predicted accurately. For samples from Batch B stored for 3 months at 25 °C/60 %RH, 30 °C/65 %RH, and 40 °C/75 %RH, the prediction and the reference values matched closely (Figure 10(a)). This indicates that the PLS model could predict well for samples throughout the shelf life.
However, the model predicts lower values than the reference values for all the vials tested for batch F (lab scale) and G (scale-up batch), in which the content of lactose monohydrate in the formulation is reduced from the previous formulation (Figure 10(b)). With the change in the formulation composition of batches F and G (more than 50% change in the amount of lactose monohydrate), the cake height of the lyophilized product was reduced substantially as compared to the existing formulation on which the PLS regression was developed. This might have impacted on the NIR spectral response and further impacted the predictability of the NIR calibration model for the change in formulation composition. Due to the above reasons, the developed PLS model could not be applied for the prediction of batches with substantially different concentrations of lactose monohydrate and it needs to develop a new quantitative model.
Conclusion
The study has demonstrated the non-destructive offline moisture content analysis of the lyophilized injection product by NIR specvtroscopy. The calibration spectra were obtained by analyzing the exposed lyophilized samples at different humidity conditions. The PLS regression model was built using SNV transformation and derivatization. Further, the model was validated to ensure its suitability for the determination of moisture content below 3.0% w/w and found applicable for higher scale batches as well as for stability samples. The study has shown that NIR spectroscopy has the potential to be deployed for online analysis to facilitate 100% monitoring of moisture content at commercial manufacturing units.
Supplemental Material
Supplemental Material - Near infrared spectroscopy for determination of moisture content in lyophilized formulation
Supplemental Material for Near infrared spectroscopy for determination of moisture content in lyophilized formulation by Aruna Khanolkar, Pranita Pawale, Viraj Thorat, Bhaskar Patil and Gautam Samanta in Journal of Near Infrared Spectroscopy.
Footnotes
Acknowledgements
The authors are thankful to the manufacturing team for executing the batches and the analytical team for doing the reference analysis.
Declaration of conflicting interests
The author(s) declared no potential conflicts of interest with respect to the research, authorship, and/or publication of this article.
Funding
The author(s) received no financial support for the research, authorship, and/or publication of this article.
Supplemental Material
Supplemental material for this article is available online.
References
Supplementary Material
Please find the following supplemental material available below.
For Open Access articles published under a Creative Commons License, all supplemental material carries the same license as the article it is associated with.
For non-Open Access articles published, all supplemental material carries a non-exclusive license, and permission requests for re-use of supplemental material or any part of supplemental material shall be sent directly to the copyright owner as specified in the copyright notice associated with the article.