
Abstract
In order to share multivariate calibration models of gasoline research octane number between different near infrared spectrometers, a novel calibration transfer method, namely combination of screening consistent wavelengths and direct standardization (SWCSS-DS) was proposed. Firstly, screening wavelengths with consistent and stable signals (SWCSS) between instruments was used to select the wavelengths with best stability, and then direct standardization (DS) further corrected the systematic errors that still exist after the SWCSS was implemented. The spectra of 120 standard gasoline samples collected on two near infrared spectrometers of the same type were investigated in detail to verify the validity of the new algorithm. Compared results of other transfer methods such as SWCSS, Slope/Bias (S/B), direct standardisation (DS), and piecewise direct standardization (PDS), the root mean squared error for prediction (RMSEP) of SWCSS-DS algorithm for target samples was decreased from 5.75 to 0.295, and the Akaike information criterion value decreased from 1516 to 640, which were better than those of the SWCSS, S/B, DS and PDS algorithms. Therefore, the joint algorithm of SWCSS-DS has not only improved the universality of the master model, but also reduced the dimension of the spectral matrix and calibration equation, that would provide a more efficient model transfer strategy for the practical applications.
Keywords
Introduction
Near infrared (NIR) spectroscopy has been widely used in the petrochemical industry due to its advantages of rapid test speed, low sample consumption, non-destructive and little sample preparation.1,2 However, due to changes in the types of NIR specrometers and experimental conditions, the multivariate calibration model established for one instrument cannot readily be shared with other instruments, which severely restricts the accurate quantitative and qualitative analysis of NIR spectra. This problem has become one of the key research directions in the field of NIR spectroscopy. Model transfer is an important way to solve the problem of inapplicability of NIR spectroscopy analysis models.3,4 Commonly used model transfer methods can be divided into two types: with and without standardization. The first type includes methods such as screening wavelengths with consistent and stable signals (SWCSS),5,6 which can be combined with uninformative variables elimination (SWCSS-UVE), 7 scale invariant feature transform (SIFT), 8 wavelet transform (WT), 9 orthogonal signal correction (OSC) 10 , and linear model correction. 11 The second type includes methods such as direct Standardization (DS), 12 piecewise direct standardization (PDS),13,14 slope/bias (S/B), 15 canonical correlation analysis (CCA), 16 spectral space transformation (SST),17,18 and genetic algorithm combined with direct standardization (GA-DS). 19
Among them, Ni et al. 5 proposed the screening wavelengths with consistent and stable signals (SWCSS) method, which can select consistent wavelengths to establish a reliable model based on the master instrument but can also yield good prediction performance on the slave instrument. However, the method cannot be applied when the instrumental difference is large since the selected consistent wavelengths lack instrument difference information, thus a standardization method with the transfer set might be helpful for additional correction. Direct standardization has been widely used for model transfer in near infrared spectroscopy. However, the raw spectral data contained too much or insufficcient component information and wavelength channels, which leads to a large amount of computation in modelling and greatly reduces the transfer efficiency of the DS method. The limitations in solving the model transfer raised the difficulties involved in adoption of rapid detection requirements of gasoline octane number (RON)19,20 in complex and different instruments conditions. In particular, the number of standardization samples chosen to compute the transform is generally much fewer than that of the wavelength channels, which can lead to over-fitting when estimating F of DS. Moreover, when computing F, it is assumed that any change in response value is due to a change in the instrument function, but in fact any variation in the chemical composition of the sample will also be imported into the model and thus F will not truly represent instrumental differences. 21
In view of the above problems, this study proposed a SWCSS-DS algorithm that combined the SWCSS and DS methods. This method used the SWCSS method to screen stable consistent wavelengths, which characterized the common spectral signals of different instruments, reduced the dimension of the spectral matrix, and simplified the model transfer process. The DS method was then used to further correct the systematic errors that remain after the SWCSS correction, which improved the universality of analysis model established on the master instrument and compensated for the shortcomings of the SWCSS and DS algorithms used alone. In this study, the spectral data of the 120 gasoline samples measured on two grating-type spectrometers and their RON value were investigated in detail with the near infrared analysis model based on the SWCSS-DS method. The transfer results were compared with that of the SWCSS, S/B, DS and PDS methods, respectively to verify the feasibility and effectiveness of the proposed model transfer strategy, which would provide a simpler and faster method for rapid detection of oil products.
Materials and methods
Materials
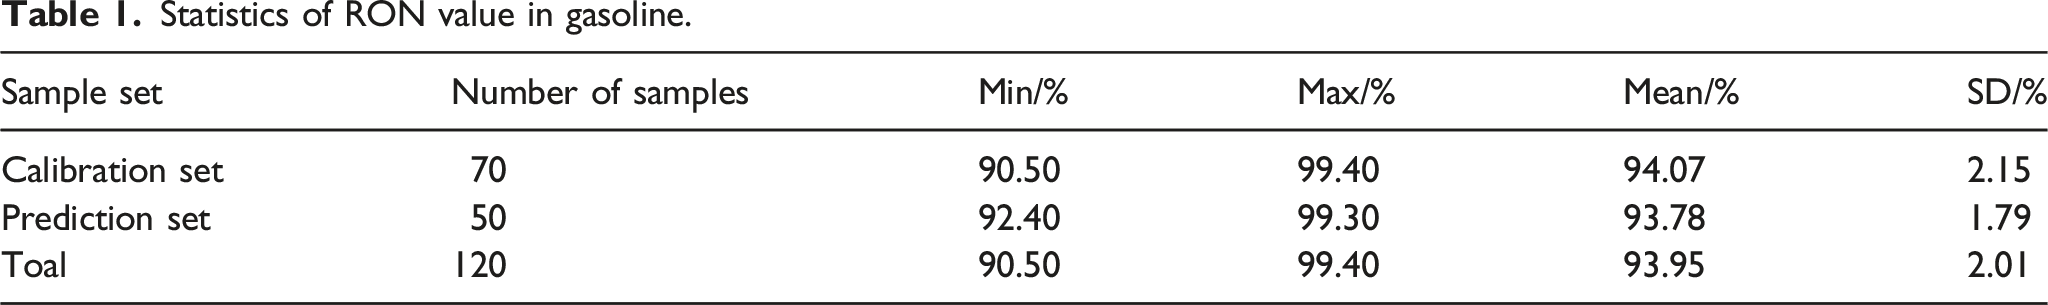
Gasoline sample set division and content analysis
Statistics of RON value in gasoline.
Instrumentation, spectral acquisition and signal processing
In this study, two NIR instruments of the same type were used to collect the NIR spectra of gasoline samples in order to investigate the model transfer performance of the SWCSS-DS method. Both instruments (master and target) were grating scanning infrared spectrometers (Wuxi Xunjie IAS-7000, liquid transmission model, Wuxi, Jiangsu Province, China). When collecting the NIR spectra of gasoline, all samples were equiliabrated at constant ambient temperature, and the instrument parameters were set as follows: the wavelength ranging from 900 to 1700 nm, transmission mode and the resolution of 6 nm. When acquiring the NIR spectra of gasoline, all samples were placed in a 1 × 1 cm quartz cuvette with air as the background with each spectrum being the average of 30 scans. To reduce the experimental error, each sample was measured in triplicate on the master and the target instrument, and the average spectrum was used for further processing. In the process of acquiring spectra of gasoline samples, any slight inconsistency of sampling cuvette thickness and its placement position might minor, but significant changes in the optical path. Therefore, standard normal variate transformation (SNV)23,24 was employed to preprocess the spectral data to correct errors caused by optical path differences.
Modeling and model evaluation methods
In this experiment, partial least squares (PLS) regression was used to build a quantitative analysis model, and the latent variables were determined by the leave-one-out cross validation method. 25 The coefficient of determination (R2), root-mean-square error of cross-validation (RMSECV) and root-mean-square error of prediction (RMSEP) were used to evaluate the model, 26 while the ratio of performance to deviation (RPD) was used to verify the stability and predictive ability of the model. When RPD > 3, the model performance was regarded as satisfactory for rapid screening analysis. 27
The Akaike information criterion (AIC)
28
was defined as
Software for data analysis
In this study, NIRSA 6.1 system and Matlab2021a software platform were used for data analysis. NIRSA 6.1 system is a chemometrics software independently developed by the College of Light Industry and Food Engineering, Nanjing Forestry University for near infrared spectral data processing (computer software copyright registration number is 2007SR06801). The results provided by NIRSA are akin to that of The Unscrambler software (CAMO AS, Oslo, Norway), which has been reported in the literature. 29 It is mainly used for near infrared spectral pretreatment, the establishment of qualitative and quantitative near infrared spectral models of gasoline RON and the selection of standardization sample sets. The algorithm of SWCSS, DS and the combination of both were calculated by using MATLAB2021a platform.
Methods
Screening wavelengths with consistent and stable signals algorithm
Following the steps of the SWCSS method,
30
5, 10, and 20 representative samples were selected from the master samples by the Kennard-Stone method. The absorbance of the selected sample at each wavelength point was taken as a variable, and the ratio of the standard deviation of difference spectra between master and target instruments (SDDSI
j
) of the master-target difference spectrum at wavelength j to the standard deviation of precision detection spectra (SDPDS
j
) of the master-target precision test spectrum was defined as the consistency parameter, which can be used to discriminate the consistent and stable wavelength of the spectral signals of different instruments and shown as follows:
DS algorithm
The DS algorithm converts the target-measured unknown spectral matrix X
s,un
into the uncertain sample-transferred spectral matrix X
s,tr
by the transformation matrix F
DS
. Theoretically, after the matrix F
DS
transfer, X
s,un
was equal to the uncertain sample spectrum matrix X
m,un
tested on the master. The conversion matrix F
DS
was obtained by least squares calculation from the standard sample spectrum matrices X
m
and X
s
of the master and target:

The final step is to calculate the transferred X s,tr , and predicted X s,tr with the established master calibration model to obtain the final predicted value of the spectrum.
Results and analysis
Screening consistency wavelengths
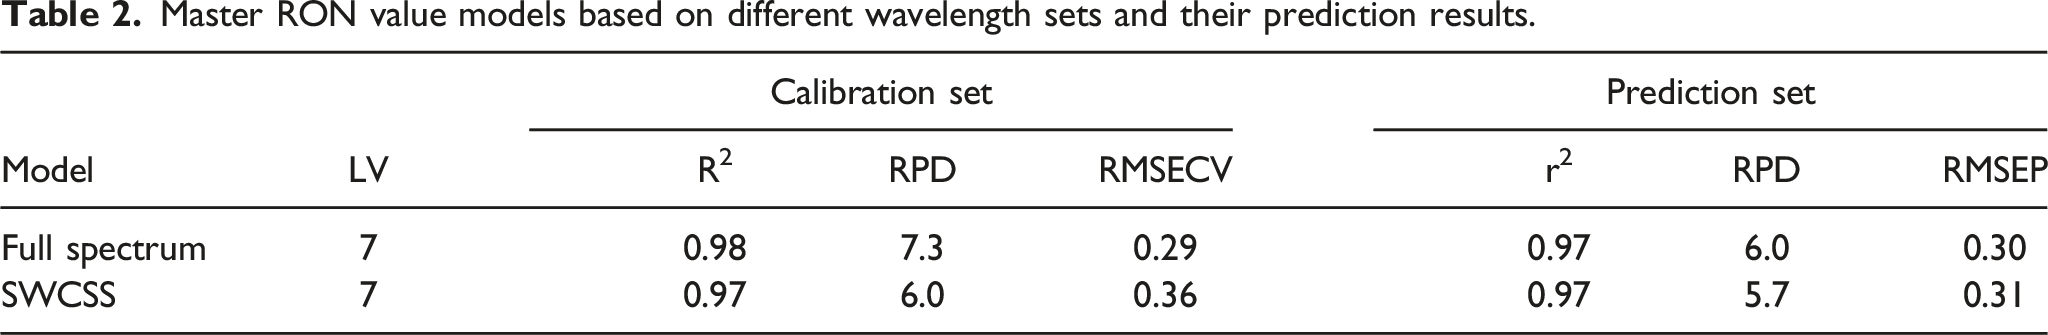
According to the SWCSS method, the Kennard-Stone algorithm was used to select 5, 10, and 20 representative samples measured on master instrument for wavelength screening between the master and target spectra. It was found that the number of selected wavelengths was the same as the number of wavelength points, regardless of how many samples were taken for screening wavelengths. Therefore, in this study, to facilitate the calculation, five representative samples were selected for the SWCSS method to screen out the wavelength set of the master and target machines as Uc. Using the master model established by Uc to analyze the sample set measured on target instrument, the prediction variations of RMSEP with b value were demonstrated in Figure 1. It should be noted that, Uc was screened by stepping b from 1 to 10, and the appropriate b value was selected based on the minimum RMSEP value. As shown in Figure 1, for the 361 wavelengths selected, a setting of b = 7 had the best predictive effect. Therefore, the wavelength set Uc screened by the SWCSS method contained 361 consistent wavelengths, and its distribution was shown in Figure 2, in which the standard deviation SDDSI between the master and the target of each wavelength channel in original spectrum were also plotted for comparison. The variations of RMSEP of target samples with the consistency parameter b value. Position distribution of RON value consistent wavelength set Uc based on SWCSS method.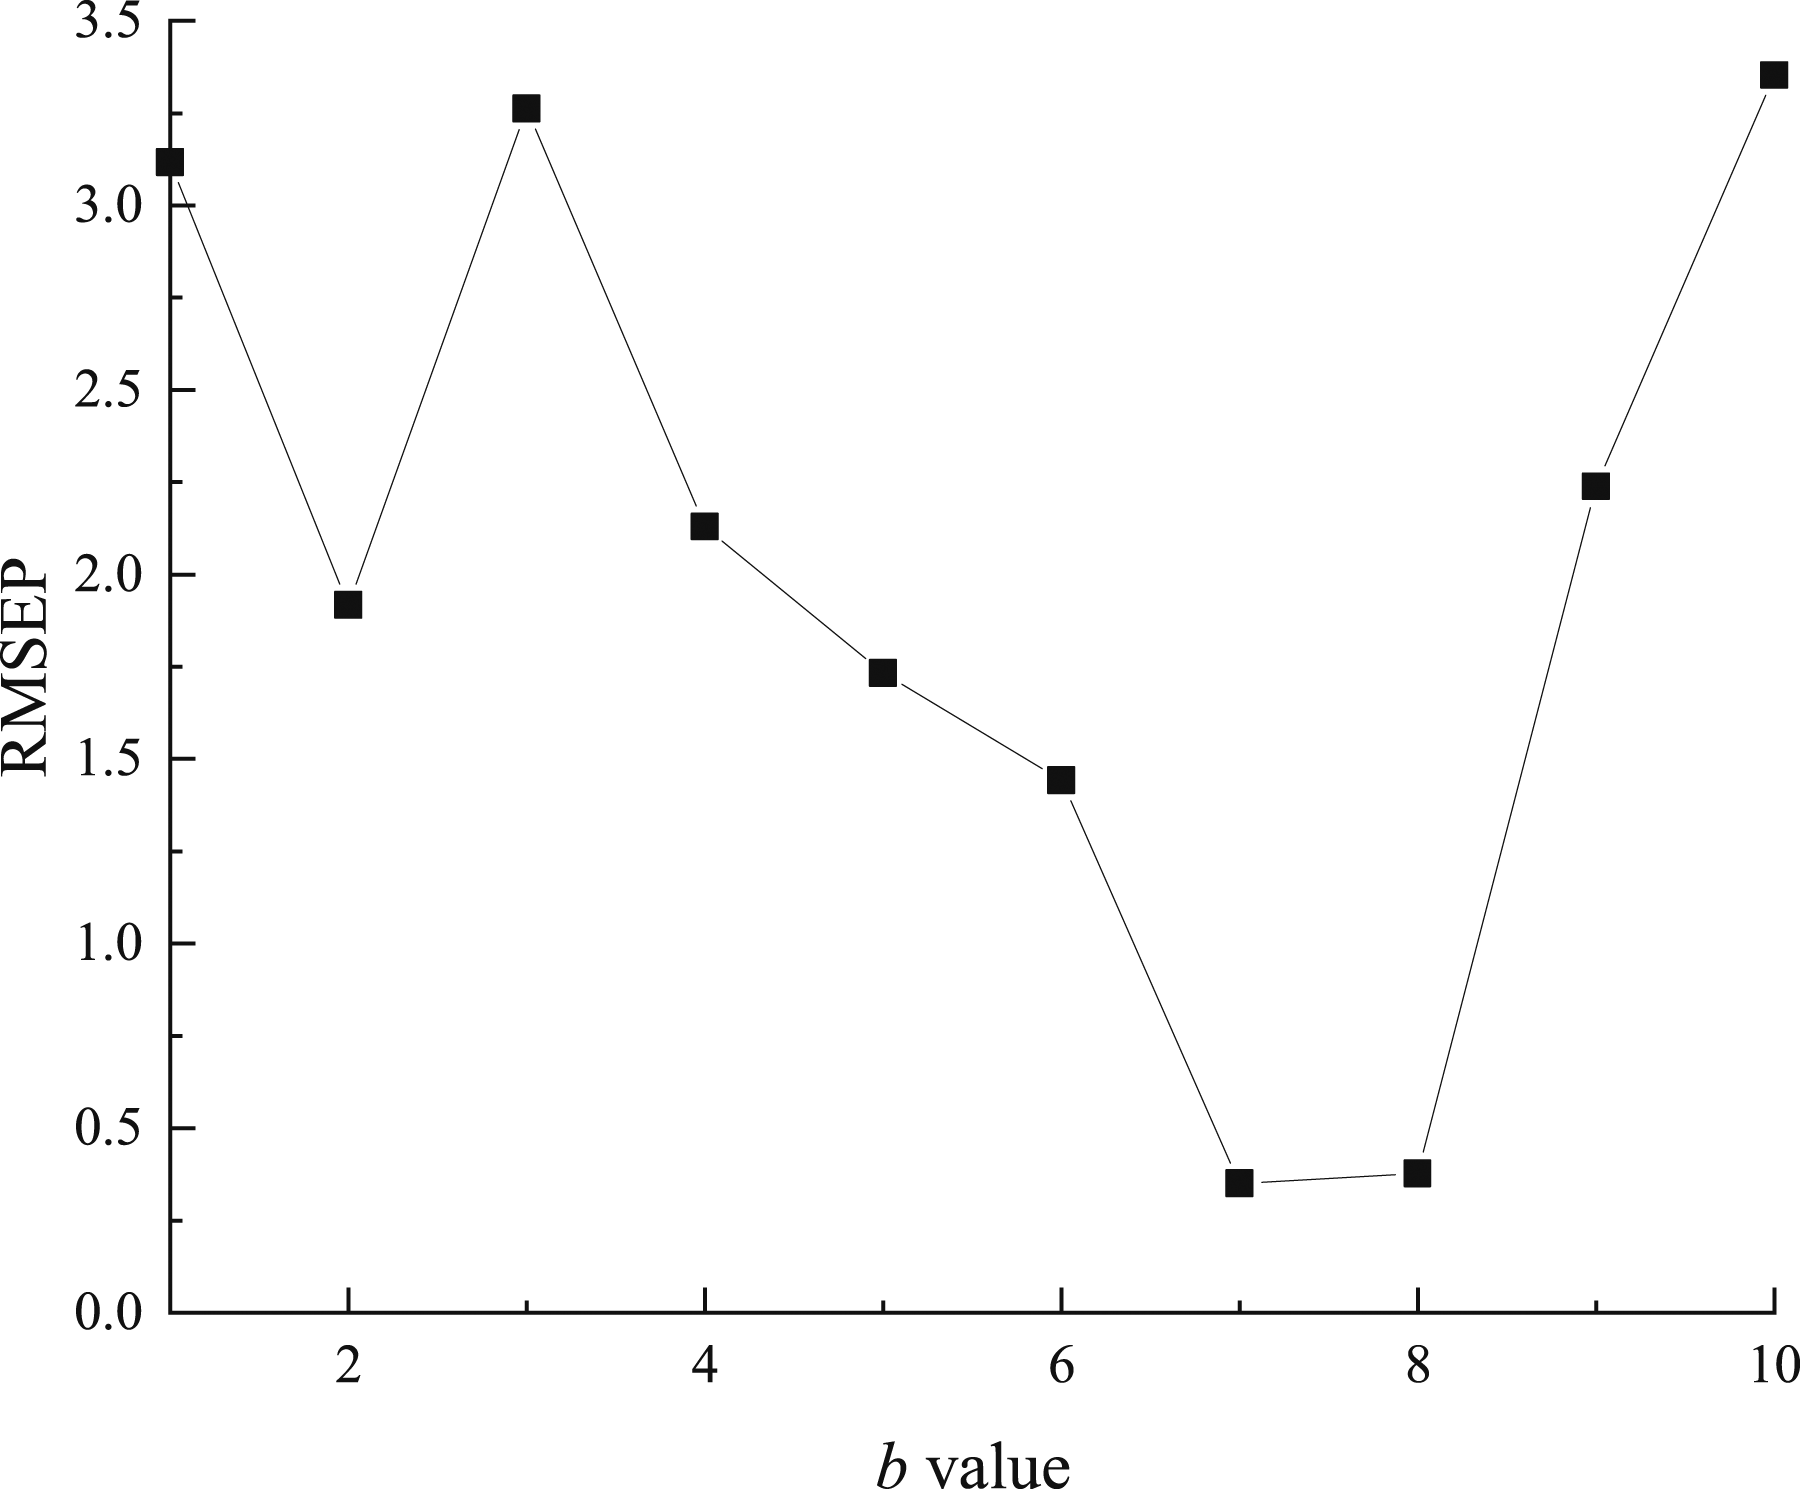
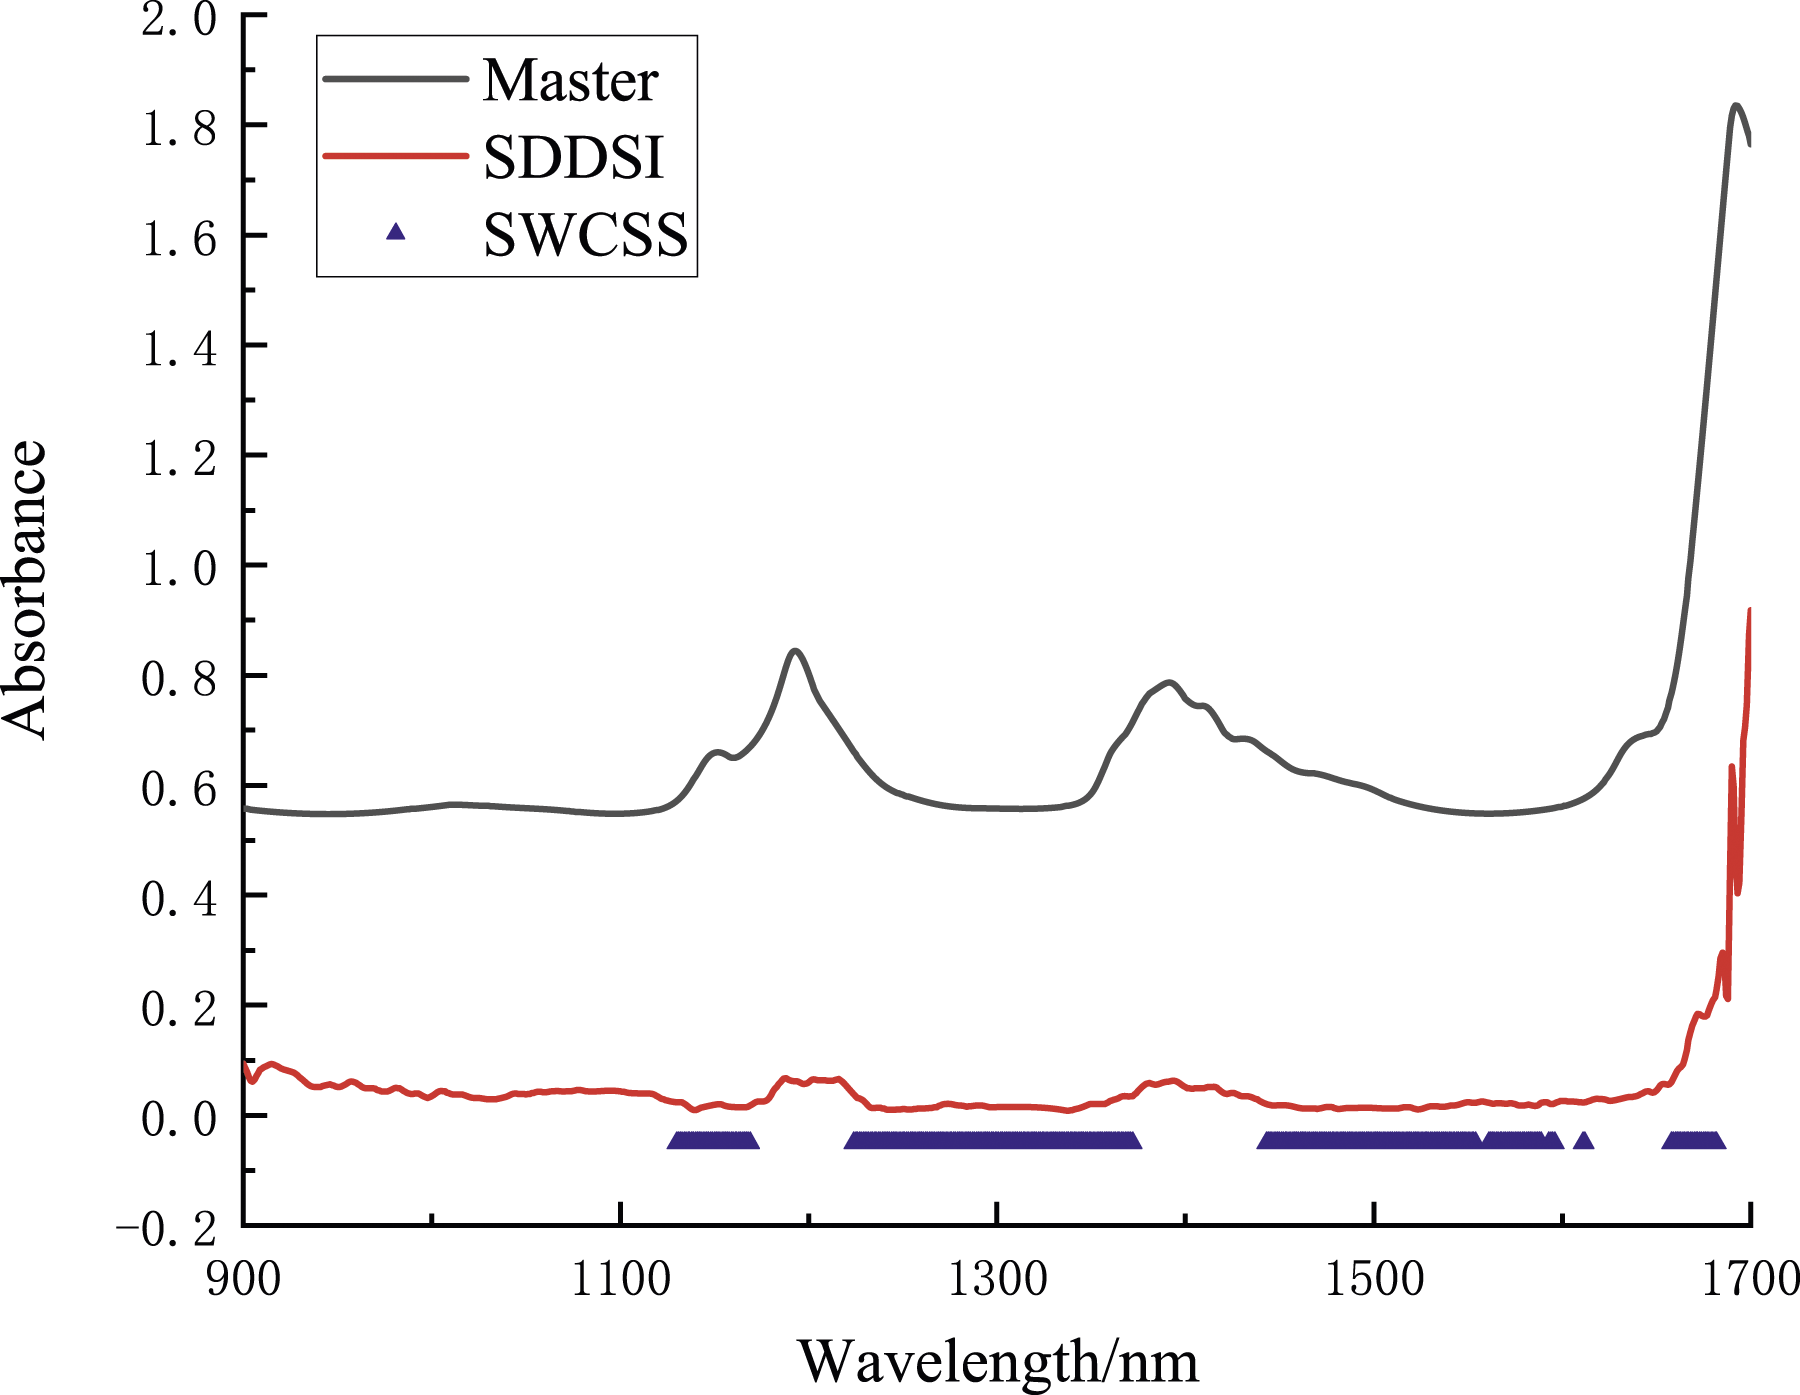
It can be seen from Figure 2 that most of the wavelength points in the Uc based on gasoline RON number selected by the SWCSS method are in the band position where the standard deviation SDDSI between the master and the target is small, while in the areas with large SDDSI values, such as 900 to 1129, 1170 to 1223, 1373 to 1442, 1555 to 1560, 1590 to 1592, 1597 to 1610, 1613 to 1657 and 1683 to 1700 nm, cannot be screened by SWCSS.
Spectral difference analysis
Since spectra of 120 standard gasoline samples were collected on two similar but individual near infrared spectrometers, their averaged spectra can be a suitable way to observe the difference between the spectrometers. The averaged triplicate spectra of before (or original, a) and after SNV pre-processing (b) are shown in Figure 3, respectively. It can be seen that spectral differences still exist after SNV treatment. Since the difference between the spectrometers cannot be completely eliminated by the SNV pre-processing method, the model established on the master was not applied directly to predict samples of the target. To avoid certain errors, the model transfer procedure is necessary for the correction. (a) Original average spectra on 2 instruments; (b) SNV average spectra on 2 instruments.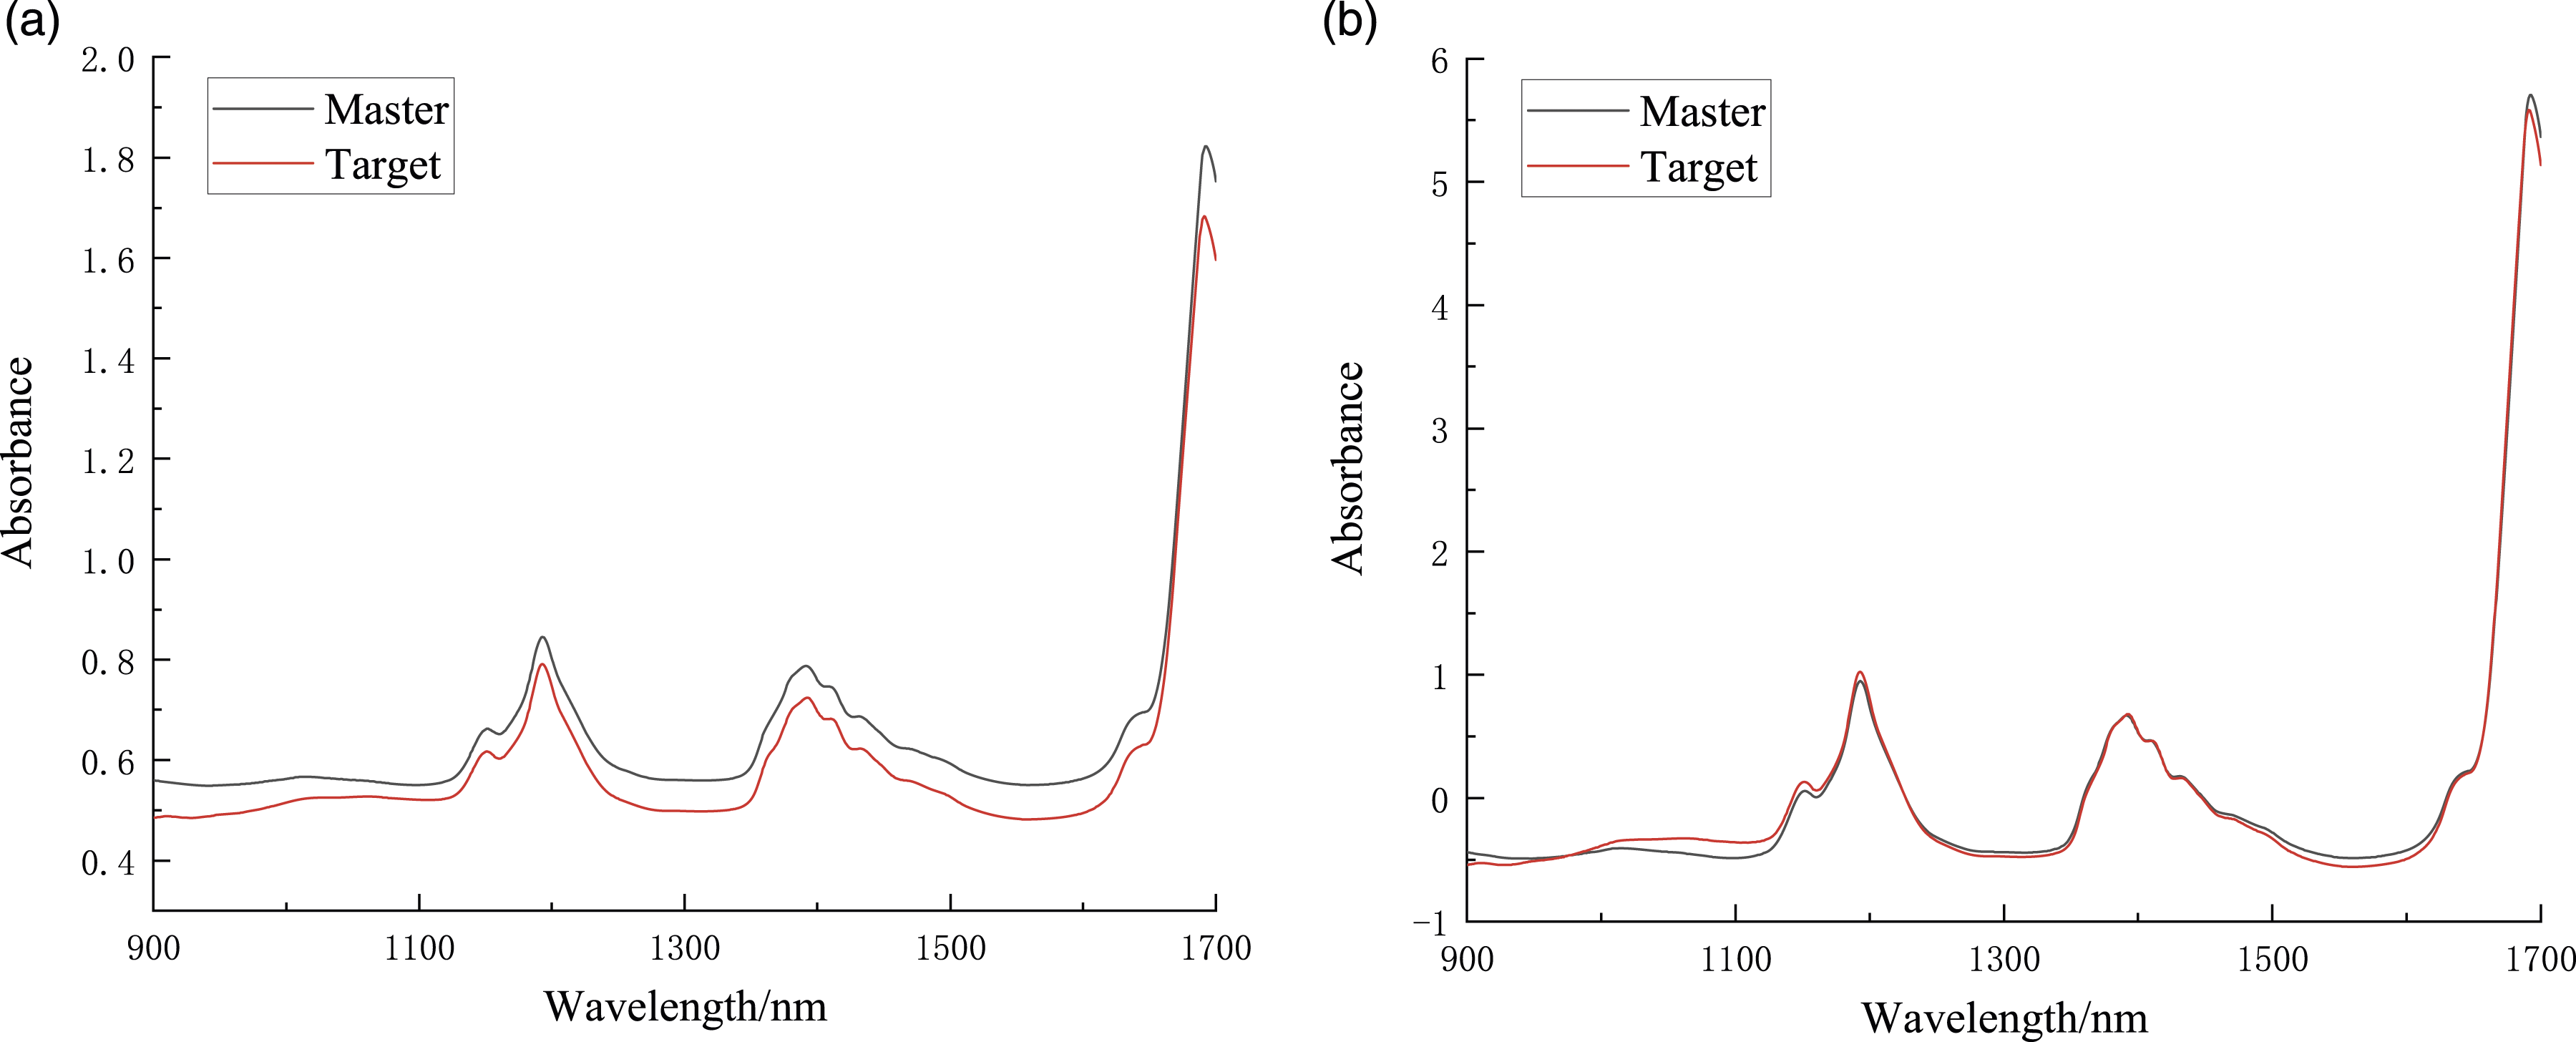
To further verify the analytical capability of the SWCSS method for target samples, principal component analysis (PCA) was used to perform qualitative error evaluation on the master and target, especially by using plots of their first two principal components scores to discriminate the spectral differences between instruments more intuitively and clearly.31,32 As in Figure 4(a) shown, the 2D principal component scores of full spectra of 70 calibration samples have a large degree of difference in the spatial distribution between master and target, despite the use of SNV pre-treatment. The average Mahalanobis distance (MD) between the calibration set and the prediction set on the master instrument was 1.18, while the average MD between the master calibration set and the target prediction set was 8.37, which indicated that the established master model had a very poor performance for directly analysing the target samples than the master samples. In Figure 4(b), the 2D principal component scores were calculated based on wavelengths selected by the SWCSS method, and the distribution of 70 calibration spectra measured on master and target instrument presented an intermixed pattern. Further calculation show that the average MD between the master calibration set and the target prediction set was 1.67, which means the difference between the two spectrometers can be significantly reduced and the established master model expects a good prediction ability for both master and target samples. In other words, the model established by this method on the master can achieve a higher analytical capability on the target than before model transfer, or can compare to traditional transfer strategies. (a) Principal component score plot based on full spectrum and (b) based on SWCSS.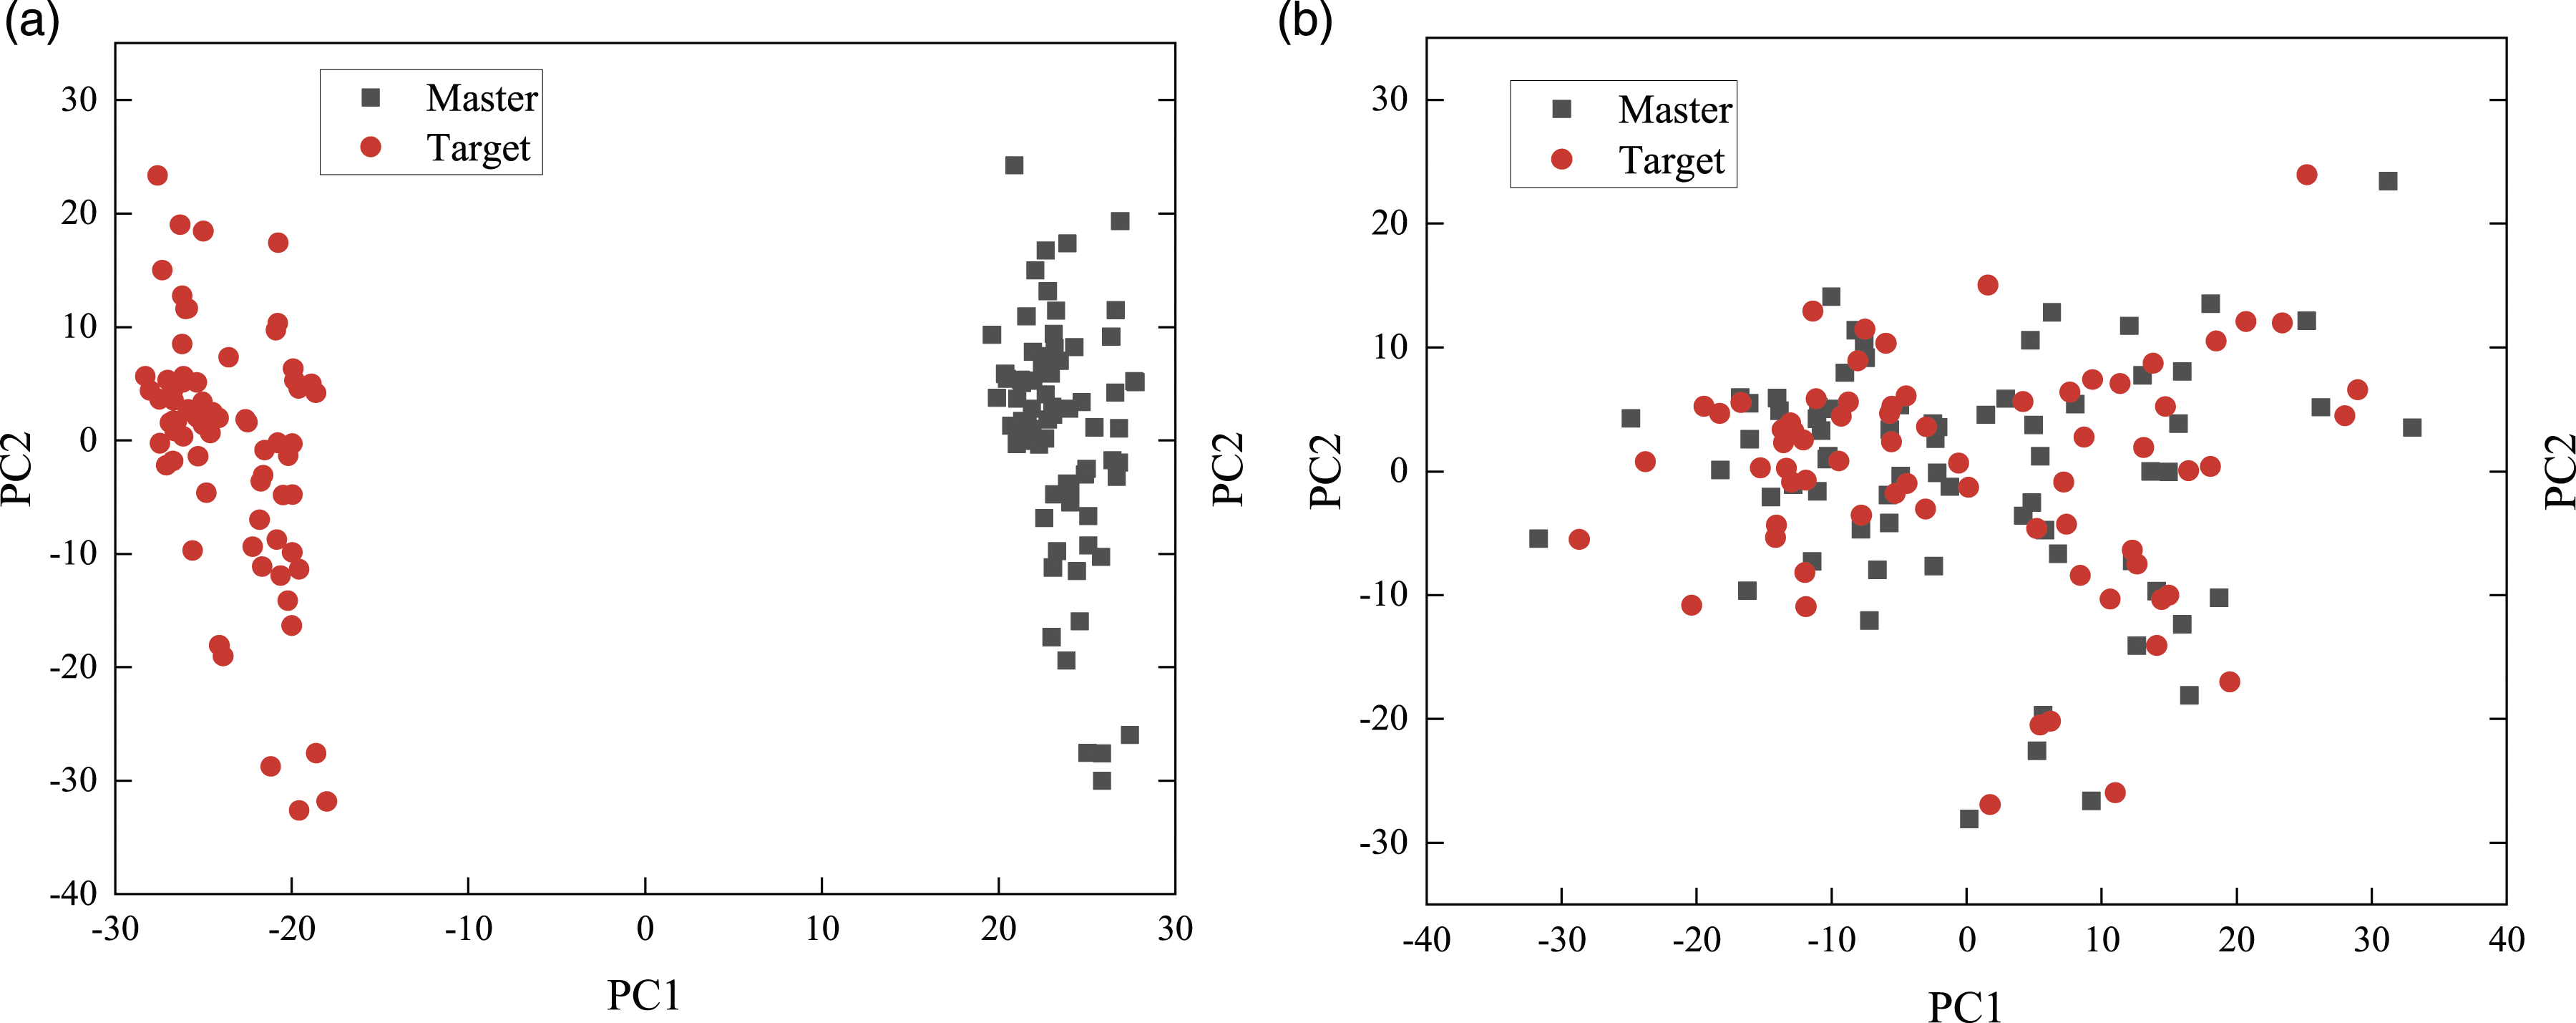
Modeling of gasoline RON value and transfer results analysis
Master RON value models based on different wavelength sets and their prediction results.
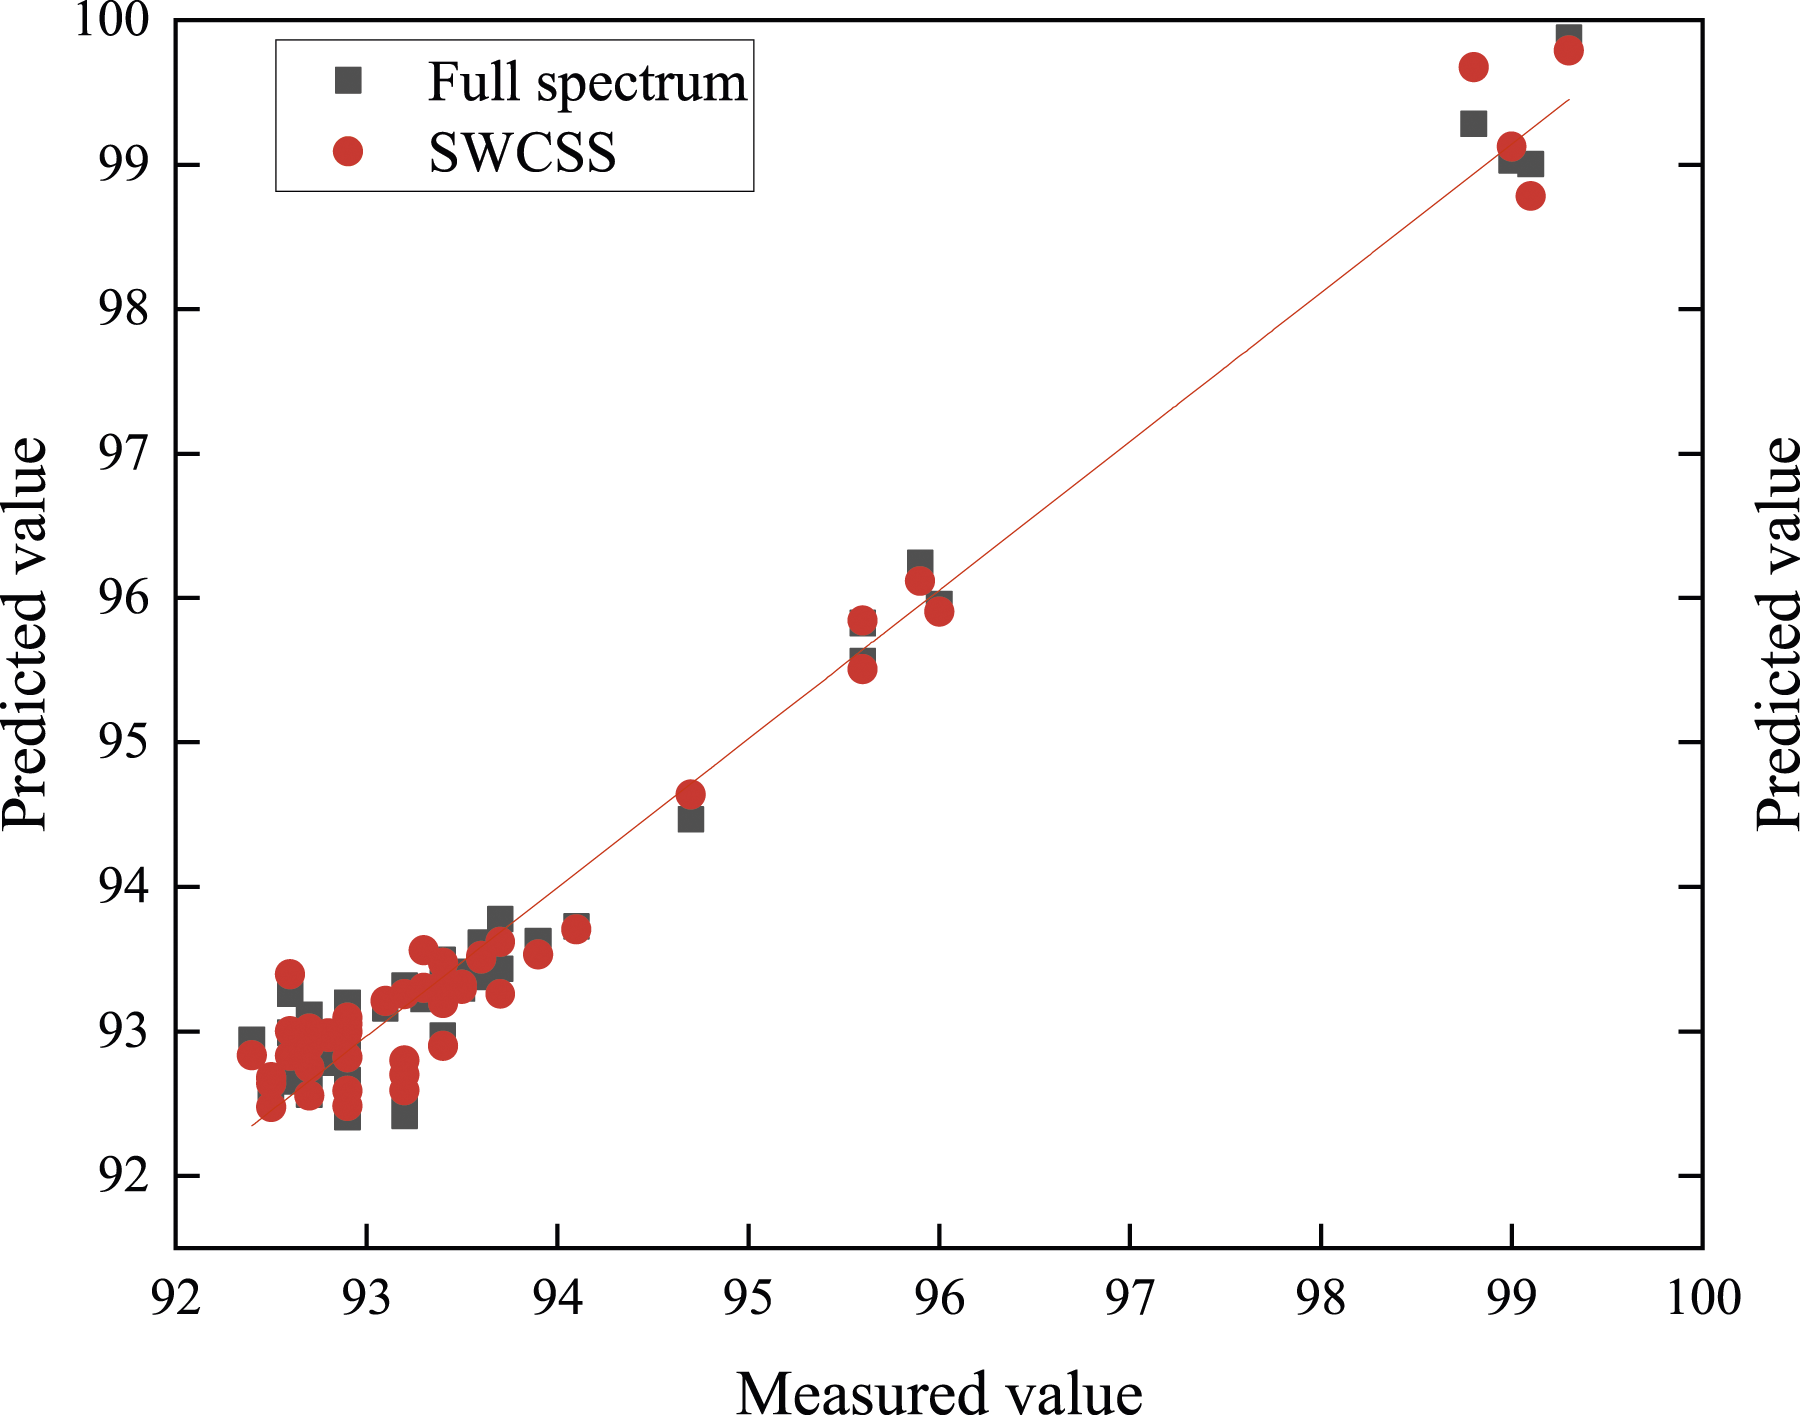
Plot of measured value versus predicted value of the master sample predicted by the master model established with different wavelength sets.
The DS and SWCSS-DS algorithms were both standardization methods. The selection of the standardization samples had a great influence on the effect of model transfer. If the standardization samples set, or transfer set are too small it will lead to less representation of the whole sample trend, while if too large, the operation will be more complicated and it cannot reflect the advantages of model transfer in practical application. Therefore, the Kennard-Stone algorithm was used to select 5, 10, 15, 20, 25, 30, 35 and 40 samples as the transfer set for model transfer. The relationship between the number of samples in the transfer set and the RMSEP was shown in Figure 6. Variation in RMSEP of the master RON model predicting the target with the number of samples in the transfer set.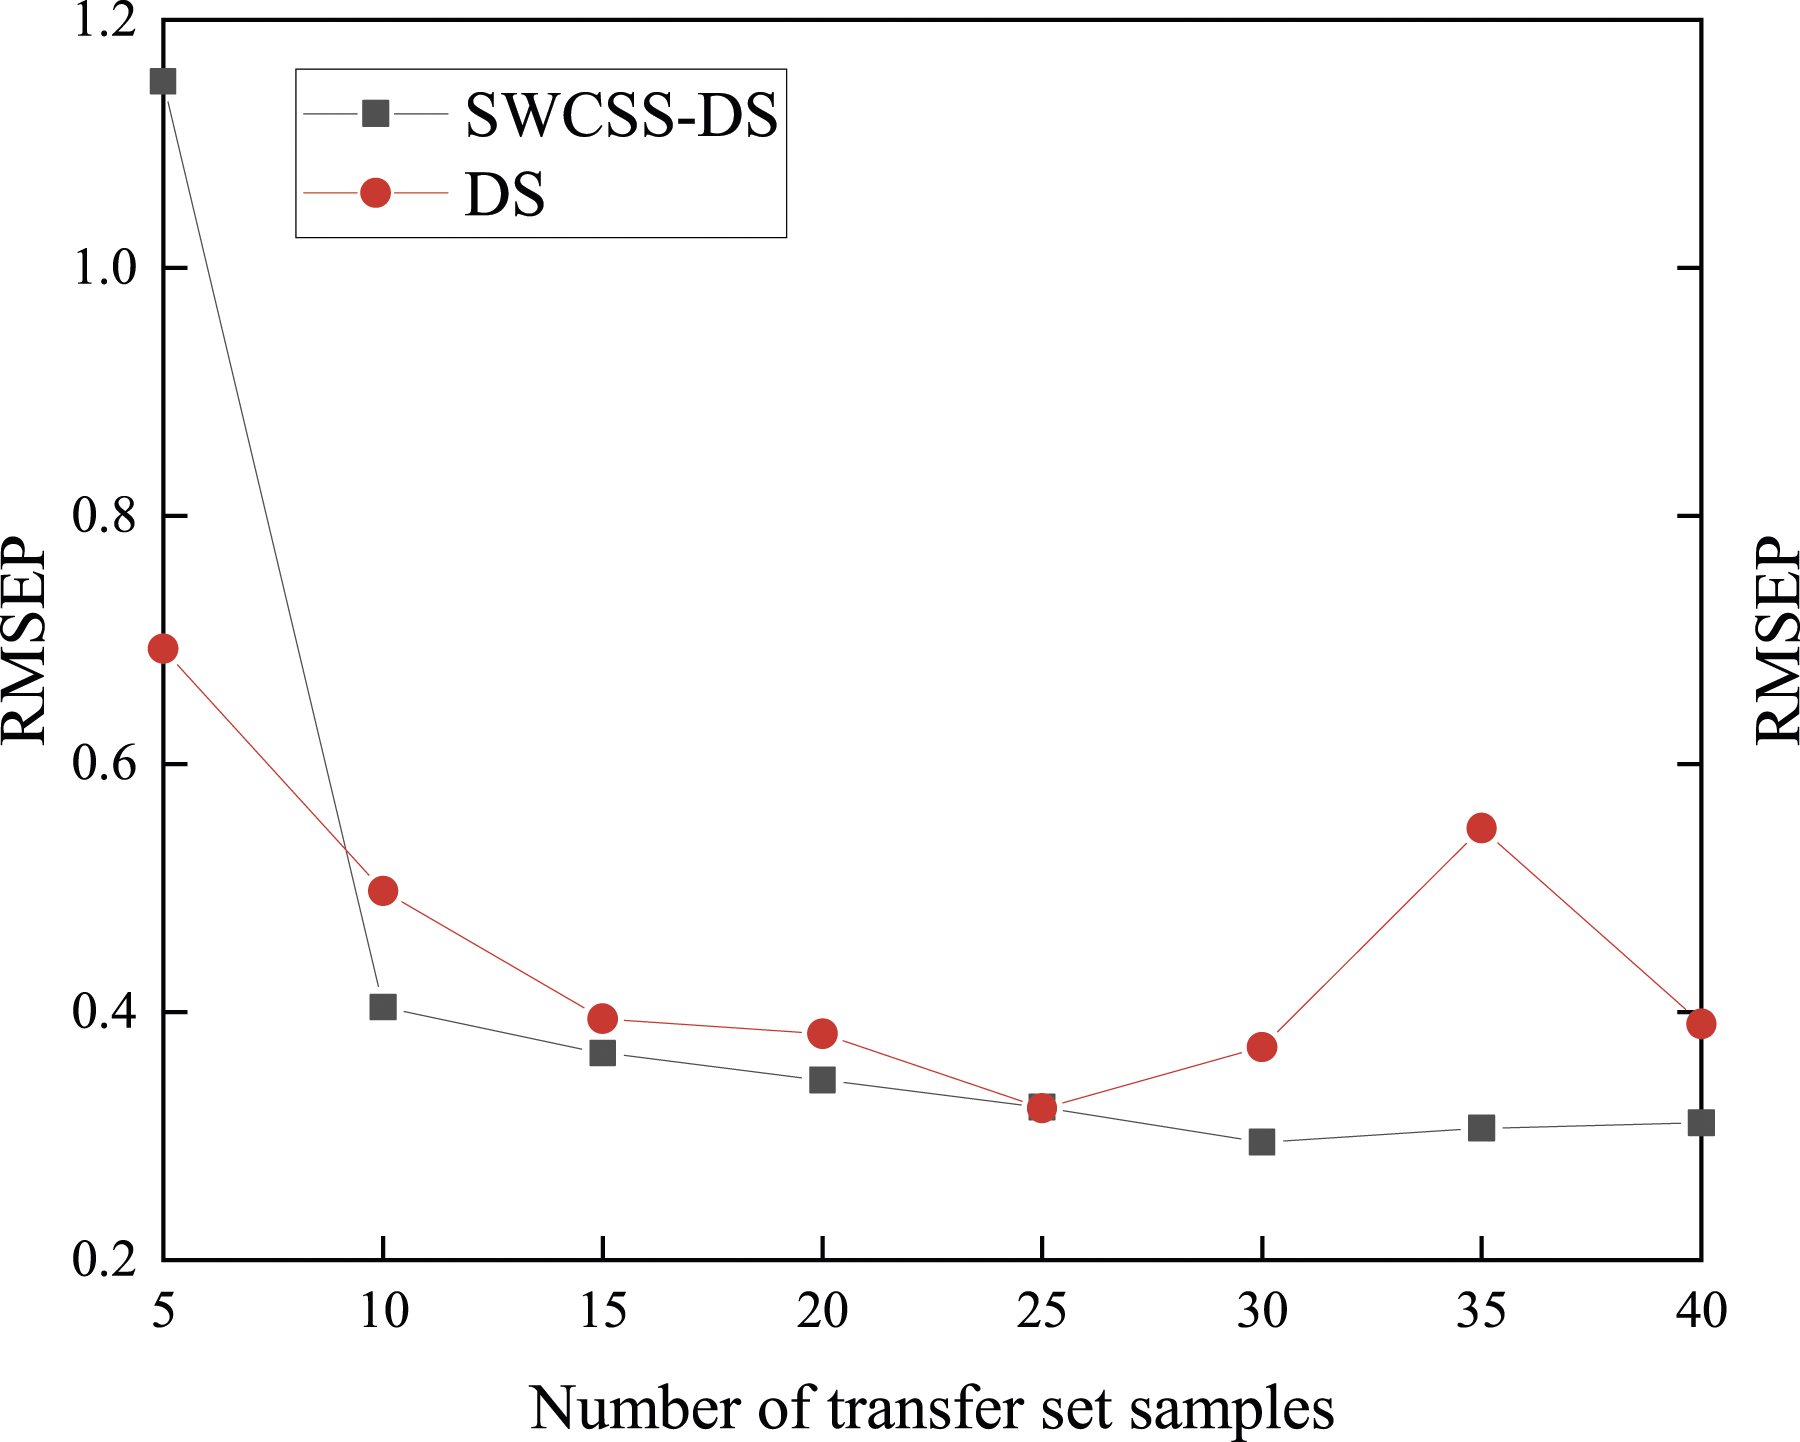
Prediction results of different model transfer methods for RON value.
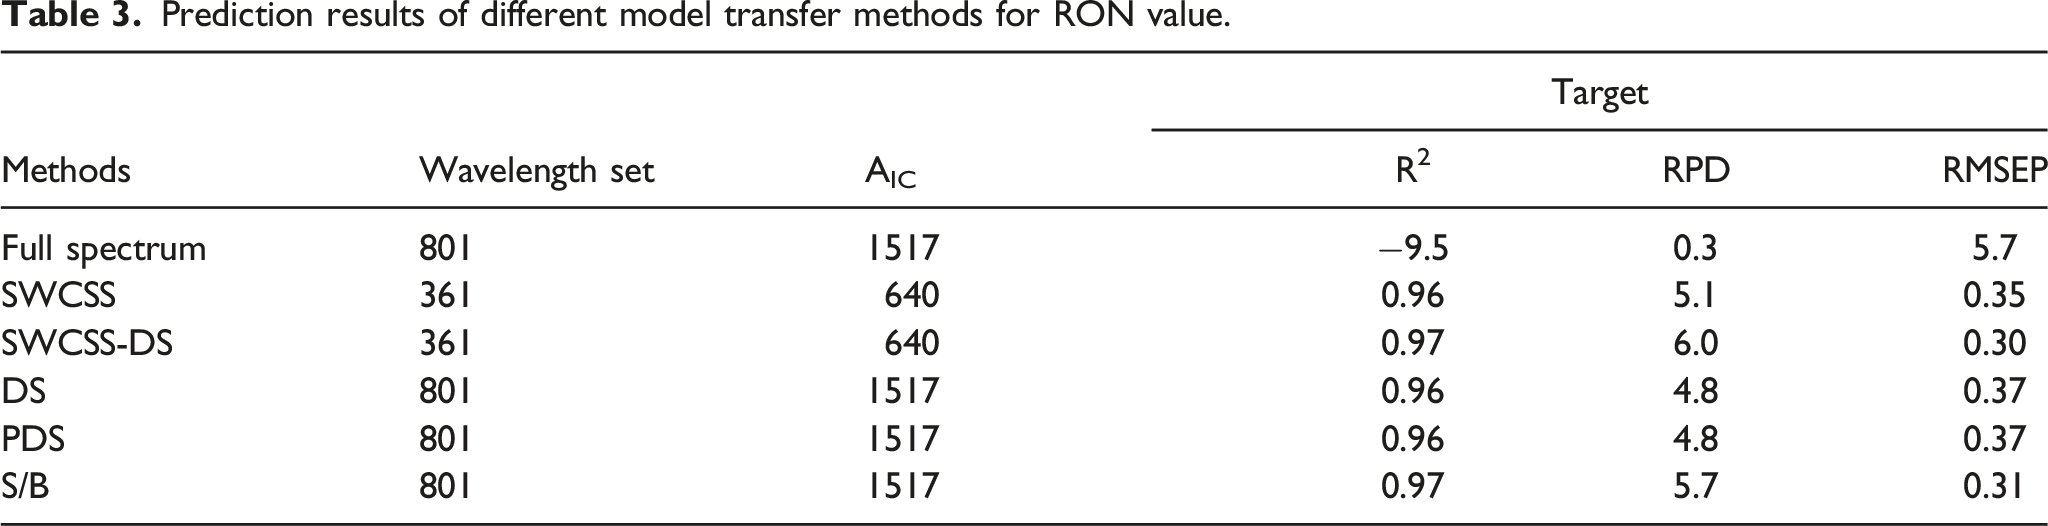
Figure 7 showed the scatter plots of the measured and predicted RON value in the target prediction set samples before and after model transfer using S/B and PDS, SWCSS and DS independently and in their combination, and their distribution. As a reference, the fitted straight lines of the single regression between the RON value analysed by the master full-spectrum model and the actual content of the master samples analysed by the master full-spectrum model were also plotted in the figures. As can be seen from Figure 6, the master model gave the worst predictions of RON value in the target samples before model transfer as well as the largest longitudinal shift. However, the prediction error of the master model applied to the target samples by the SWCSS-DS method was significantly lower, and the predicted values were all distributed roughly within a narrow range along the fitted straight line and with a small longitudinal bias. The SWCSS-DS method-corrected master model predictions for the targets were mostly closer to the fitted straight line using S/B and PDS, SWCSS and DS independently and in combination, further indicating that the SWCSS-DS method transferred a model with less statistical prediction error. (a) Predicted versus measured RON and (b) distribution diagram of the measured value and the predicted value of the RON value in the sample of the target machine prediction set.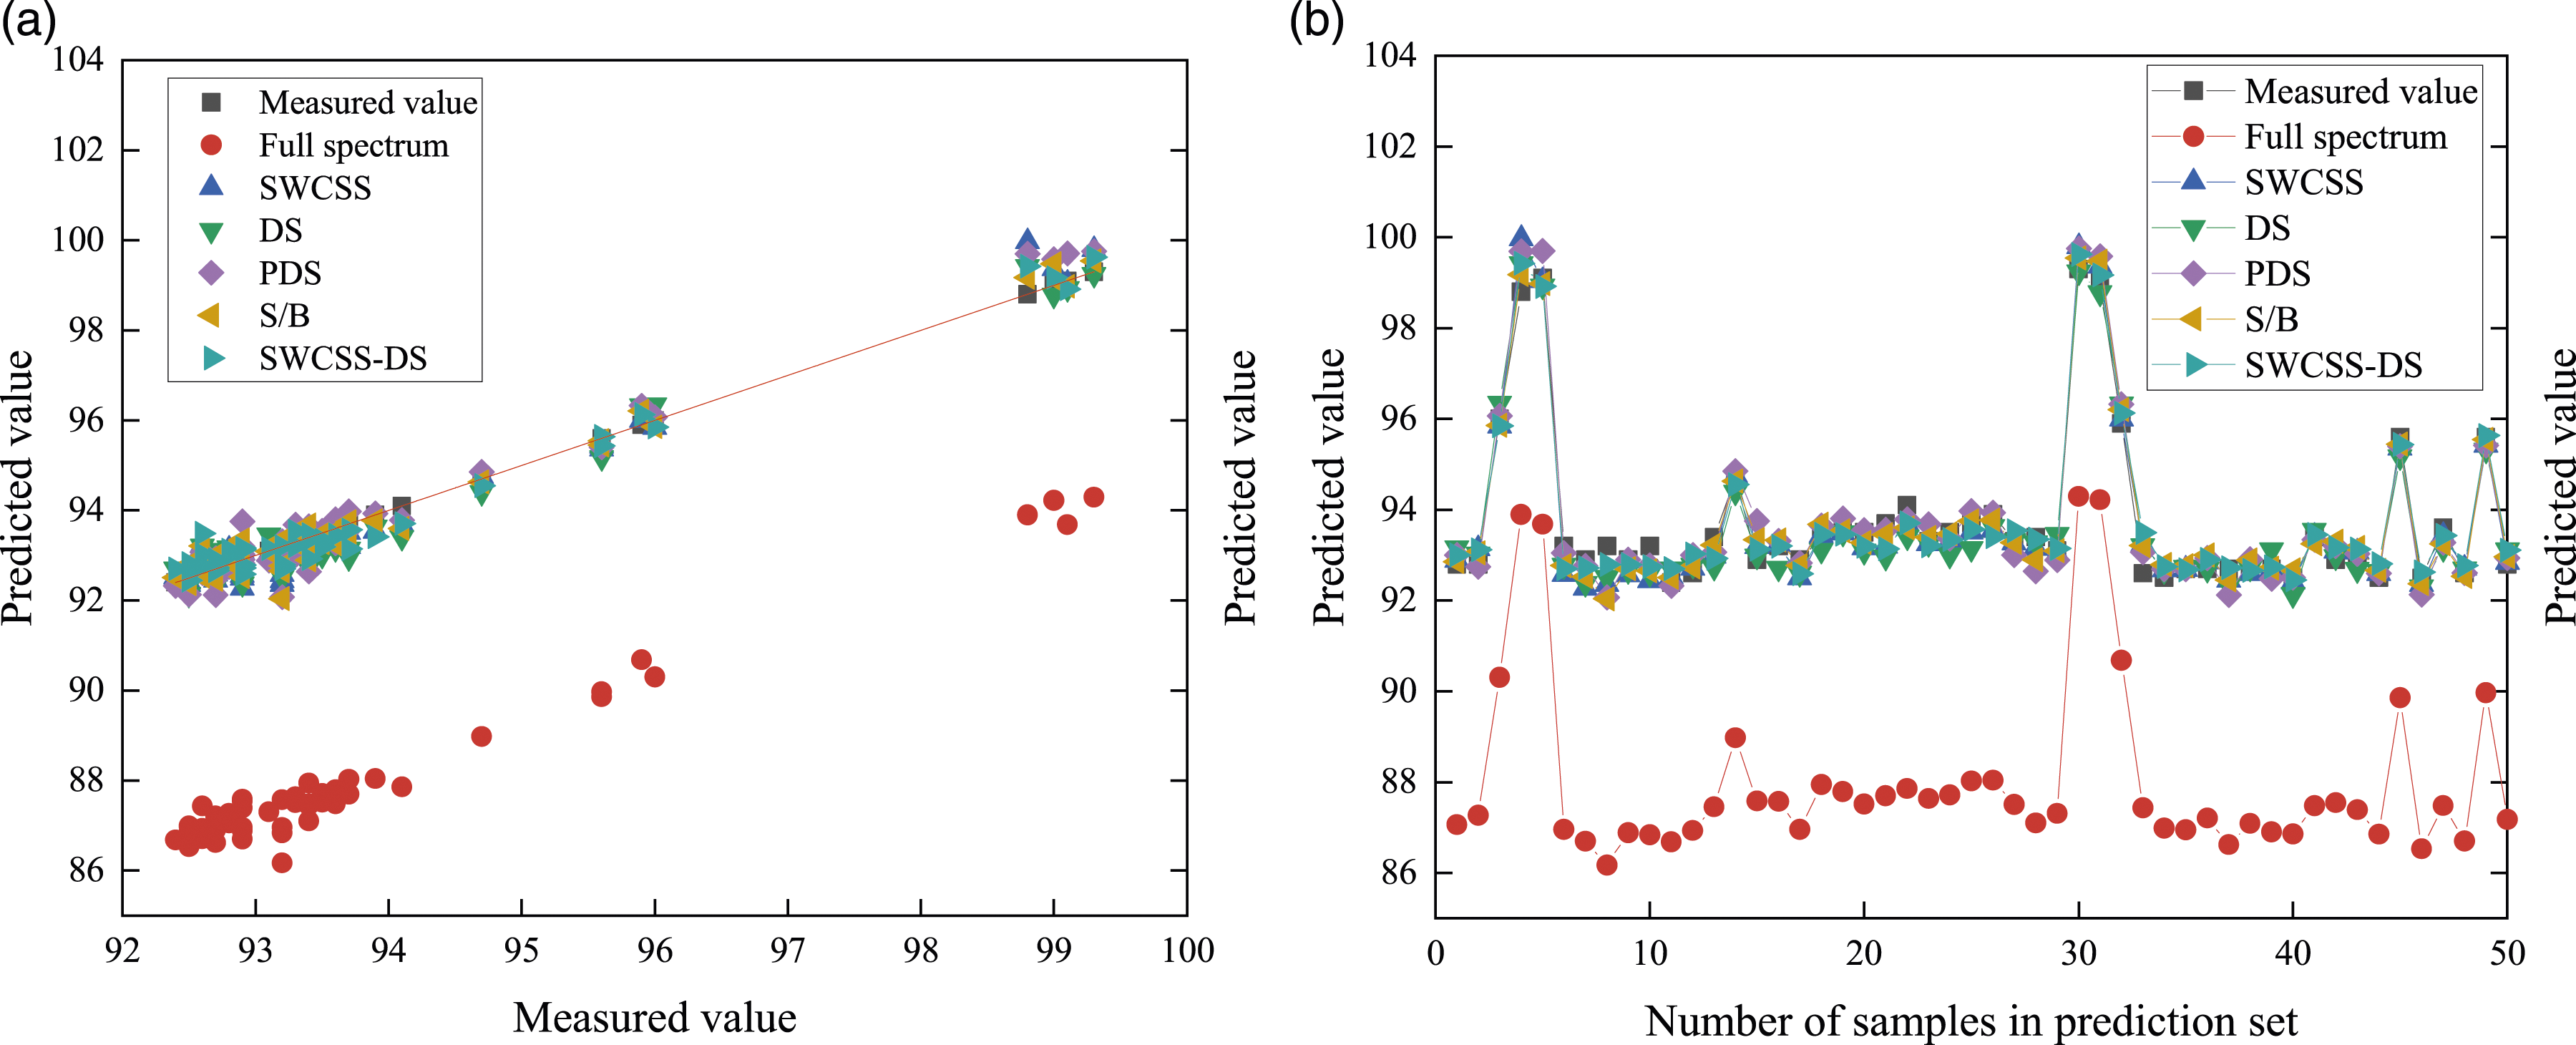
Conclusion
In this paper, a SWCSS-DS based model transfer method is proposed, which uses the SWCSS algorithm to filter out stable consistent wavelengths with small differences to reduce the differences between spectroscopic instruments, and then the DS method was applied to further correct the systematic errors that still exist after SWCSS implementation. The transfer procedure achieved good results. Compared with SWCSS and DS, S/B and PDS algorithms alone, the SWCSS-DS method can better overcome the inconsistency between spectroscopic instruments, significantly improve the predictive ability of the spectral analysis models. Meanwhile, it made the model transfer between different NIR spectrometers more stable and applicable to a wider range, and reduced the dimensions of the spectral matrix, which greatly simplifies the model transfer process and facilitates practical applications. The research provides a reference for rapid and accurate detection and quality stability control of RON value on different instruments, and has high application and promotion value.
Footnotes
Acknowledgements
The authors would like to express their gratitude for support from the State Key Laboratory of Catalytic Materials and Reaction Engineering (RIPP, SINOPEC), Associate Professor Zhi-Xin Xiong and Senior Engineer Yuan Hui for providing the experimental apparatus and experimental expenses.
Declaration of conflicting interests
The author(s) declared no potential conflicts of interest with respect to the research, authorship, and/or publication of this article.
Funding
The author(s) disclosed receipt of the following financial support for the research, authorship, and/or publication of this article: This work was supported by State Key Laboratory of Catalytic Materials and Reaction Engineering.