
Abstract
To assure the quality control of industrial processes, it is important to adopt reproducible and efficient methodologies. Spectroscopic methods, such as near infrared (NIR), are a good option as they are fast and may be used to indirectly estimate multiple physicochemical properties. In this study, NIR spectra of key feedstock samples used in the production of formaldehyde-based resin and wood-based panels, namely urea, ammonium sulfate, ammonium nitrate, sodium hydroxide, and acetic acid, were acquired. Multivariate data analysis was applied to establish the correlation between the spectra and the properties being measured. Quantitative models were then created using partial least squares regression to predict the concentrations of feedstock samples. This study presents quantitative models that were created by combining spectra measured on two probes, which achieved similar prediction results as single-probe based models. The performances of the best models were compared with the reference methods for each of the evaluated samples. For the samples under study, the proposed approach is suitable for routine analysis across multiple equipment configurations using the same quantitative model. NIR spectroscopy combined with chemometric models could be a valuable complement to support in-line raw material monitoring and plant digitalization in the wood panels industry.
Introduction
Wood-based panels (WBP) such as particleboard (PB) and dry process medium-density fiberboard (MDF) were invented and commercialized throughout the 20th century. Pressure and heat are applied to wood particles (such as particles, fibers, and sawdust) together with a formulation of an adhesive and additives to create these panels. The most widely used adhesives are formaldehyde-based resins, and the formulation typically includes resin, water, hardener, and wax emulsion. The industry continues to undergo improvements in production capacity and technology, particularly in relation to the resins used in their production processes. 1
Near infrared (NIR) spectroscopy is a powerful analytical technique that enables the precise, non-destructive, and rapid evaluation of a variety of quality control metrics in industrial manufacturing. NIR spectroscopy may be used for fast product identification, classification, and quality control, as well as assessing several chemical and physical properties. 2
NIR spectroscopy makes use of the electromagnetic spectrum by measuring radiation absorbed or reflected by a sample. Some of the radiation is scattered while some interacts with the sample and passes through. This is subsequently captured by the detector, recording the absorbance data, which along with scatter from the sample, generates the substance’s spectrum. The absorption bands in the NIR range (780-2500 nm) are often overlapping, resulting from overtones and combination bands of the fundamental vibrations mainly associated to stretching of C-O, O-H, C-H, and N-H bonds. 3
NIR spectroscopy requires little sample preparation and several properties can be simultaneously inferred from a single spectrum. It is largely an indirect analytical technique, requiring calibration using samples of known composition, determined by using standard methods. When coupled with multivariate analysis, it has shown to be a successful tool in a range of applications, 4 such as in pharmaceutic industries for quantitative determination of the active ingredient composition of solid drug formulations5,6 and petrochemical for determination of research octane number (RON), alcohols, phenols, and density amongst other properties.7–9
Since wood is a complex material, NIR spectra of wood surfaces are impacted, not only by chemistry, but also by its structure. 10 The NIR spectra of wood are composed of multiple and frequently overlapping bands attributed to its chemical constituents, namely: lignin, cellulose, hemicellulose, and extractives. While significant progress has been achieved in assigning several bands in these spectra, further research is needed to enhance the comprehension of wood component spectra. 11 Despite this, several studies have been conducted using NIR-based quantitative methods in the manufacturing of WBP, such as monitoring raw wood quality for use in particleboards, 12 that enables more efficient utilization of raw materials and ensures consistently high-quality products.
Methods utilising NIR spectroscopy have also been used to determine the content of formaldehyde in aqueous solutions 13 and for monitoring the synthesis of formaldehyde-based resins.14–16 The molar ratio of formaldehyde to urea (F/U) is one of the most studied property that impact formaldehyde emissions17–19 along with other characteristics such as viscosity, solid content, specific gravity, and more. 19 Some studies have also demonstrated the ability to predict the melamine concentration of melamine-urea-formaldehyde resins (MUF) by NIR.20,21
Variability in resin production can lead to variations in its performance, reducing reliability for customers. However, most research has been focused on the characterization of formaldehyde-based resins after synthesis, with little information available on the appropriate quantification of other key raw materials used at various stages of the resin and WBP production.
For instance, incorporating scavengers into WBP - chemicals or amine compounds such as urea - is a strategy for reducing formaldehyde emissions. These scavengers are used in liquid or solid form at the beginning of resin blending. 22 Infrared spectroscopy has been used to predict urea content in resin formulations 23 and NIR spectroscopy to predict trace levels in aqueous solutions 24,25 but not for aqueous urea solutions within the ranges presented in this work, which are of interest to the WBP industry, likely due to the common use of 30–40% urea as a liquid scavenger.
In formaldehyde-based resins, acetic acid and sodium hydroxide are introduced to modify the pH during the synthesis process. The work of Chung et al. 26 proposed quantitative NIR models for acetic acid concentrations above 75% (m/m). Uchida et al. 27 successfully identified sodium hydroxide in aqueous solutions by analyzing NIR spectra of 16 salts with sodium as the common cation in the wavenumber region of 6500–6200 cm−1, where the first overtone of water’s -OH stretching mode is detected. A literature review indicates a lack of existing studies employing NIR spectroscopy to estimate acetic acid or sodium hydroxide concentrations within the ranges presented in this work.
The use of ammonium salts in the curing process of formaldehyde-based resins is well established in the industry. 28 However, there have been no published works on the quantification of aqueous solutions of ammonium sulfate or ammonium nitrate using NIR spectroscopy. This highlights the need for further research in this area.
Furthermore, the use of a multivariate model developed under specific conditions may not be applicable when measurements are taken using different instrumentation. This suggests that slight variations in the NIR spectra can affect the accuracy of model predictions.
Previous studies have demonstrated that multivariate models can be transferred across multiple instruments without requiring full recalibration using several strategies, including direct standardization (DS) and piecewise direct standardization (PDS), among others. 29 Although these standardization techniques can improve quality control procedures, they frequently require corrections when spectra are acquired on equipment other than the one used to build the original model. Whereas the primary goal is to ensure result accuracy regardless of the probe chosen, it may be challenging to implement these strategies directly at industrial sites where end-users may have restricted access to the spectrometer manufacturer’s software.
This study used NIR spectroscopy and chemometric methods to develop quantitative models for the concentration of aqueous solutions of urea, ammonium sulfate, ammonium nitrate (all utilized in WBP production), as well as sodium hydroxide and acetic acid used in the synthesis of formaldehyde-based resins. Two different equipment configurations were used, along with a representative set of calibration samples. Partial least squares (PLS) regression models using a single probe were proposed as well as combined probe models by combining spectra from two probes.
Materials and methods
Sample preparation and reference methods
In this study, samples of urea (99.0%), ammonium sulfate (99.0%), ammonium nitrate (99.5%), sodium hydroxide (industrial grade), and glacial acetic acid (98.0%) were kindly provided by EuroResinas – Indústrias Químicas SA (Sines, Portugal).
Estimated mean absolute error associated with concentration measurements for each reference method.
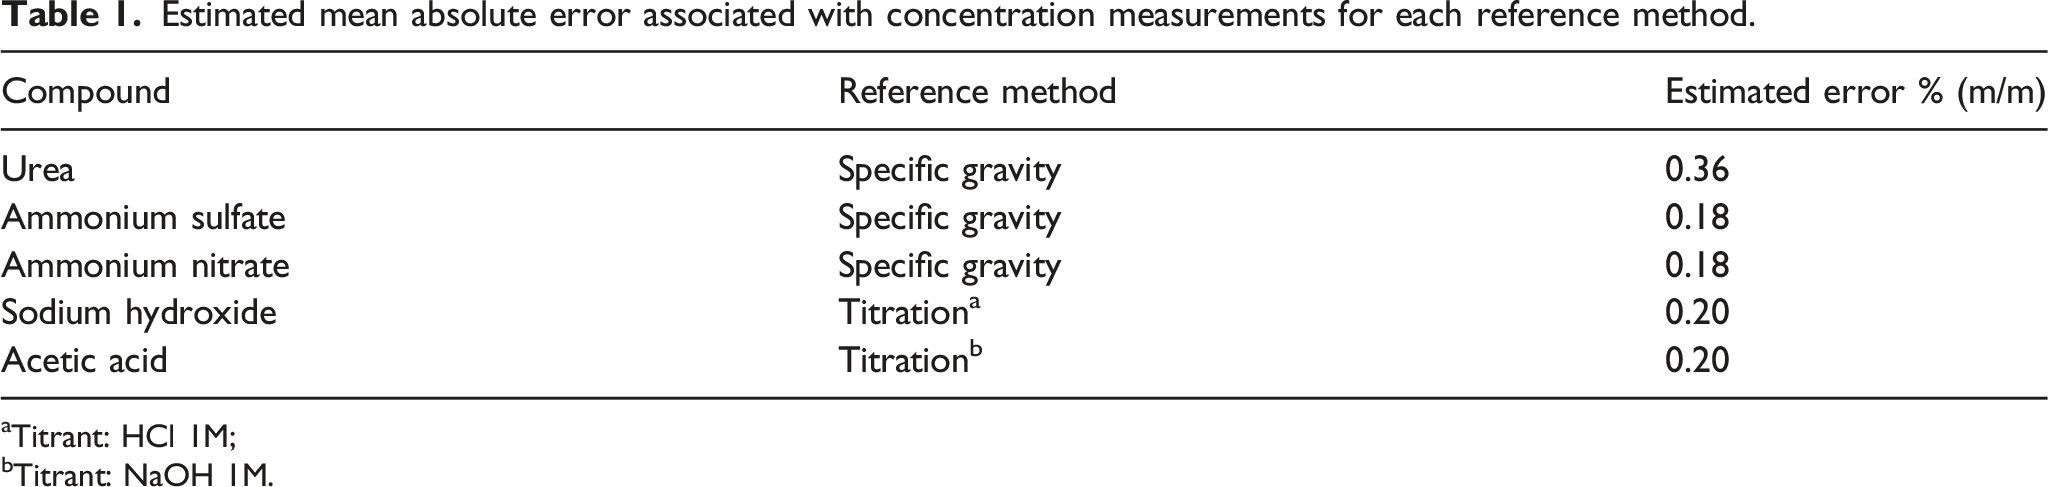
aTitrant: HCl 1M;
bTitrant: NaOH 1M.
An appropriate hydrometer (Alla France - serie M100, Chemillé, France) was used to determine the specific gravity of the samples. After placing it in the solution, it is allowed to float freely. The measurement was made by reading the position of the meniscus in the scale.
The titration method is based on the potentiometric equivalence point detection and involved weighing 1 to 5 g of the sample, then measuring the volume of titrant used until the equivalence point was reached, which is indicated by a sudden shift in the pH of the solution, detected using a pH meter (Mettler-Toledo SevenCompact S220 with pH electrode InLab Routine Pro, Greifensee, Switzerland).
The accuracy of both methods was estimated based on the most significant error in each procedure. The most significant error for the titration was considered the visual reading of the titrant volume in the burette scale and for the specific gravity it was considered the visual reading of the hydrometer scale. The estimated concentration mean absolute error is then determined based on error propagation.
Both reference and spectroscopic procedures were performed by the same analyst to decrease variability in measurement results. The titration method was repeated at least twice for each sample until two determinations agreed. The experimental average deviation obtained from repeated measurements is consistent with the values shown in Table 1.
Near infrared instrumentation
For all samples, NIR spectra were acquired using two different transmission probes (Solvias Zafiro 12S-150 and Bruker IN236E-1, respectively, both with 1 mm optical path length). The probes were connected to a Bruker Matrix-F Fourier-transform spectrometer (Bruker, Ettlingen, Germany). The measurements were conducted by immersing the probe into the sample, which was preconditioned at a temperature of (25 ± 1)°C to ensure consistent results.
OPUS 6.5 (Bruker) was used to collect 32 scans per spectrum at a resolution of 8 cm−1 in the range of 4000 cm−1 to 12,000 cm−1, with air used for the background spectrum. Each spectrum contained 2074 absorbance values with this configuration.
To minimize errors and increase the precision of the calibration data, NIR spectra were acquired in triplicate for each sample. Each replicate was treated as a separate sample for the purpose of developing the calibration models. During the calibration/test split, all three replicates of each sample were grouped together to ensure that the test set accurately reflects ‘unknown' samples.
The probes were carefully washed, prior to switching to a different sample.
Calibration models
The QUANT module of OPUS 6.5 (Bruker) was used to construct quantitative models from the collected dataset of NIR spectra for each sample.
Each dataset was firstly partitioned into probe A (all spectra measured on primary configuration: Bruker probe) and probe B (all spectra measured on secondary configuration: Solvias probe). Three quantitative models are then proposed for each feedstock based on the spectra collected in probe A, B, and the combination of A + B.
Samples analyzed and the corresponding range of concentration values.
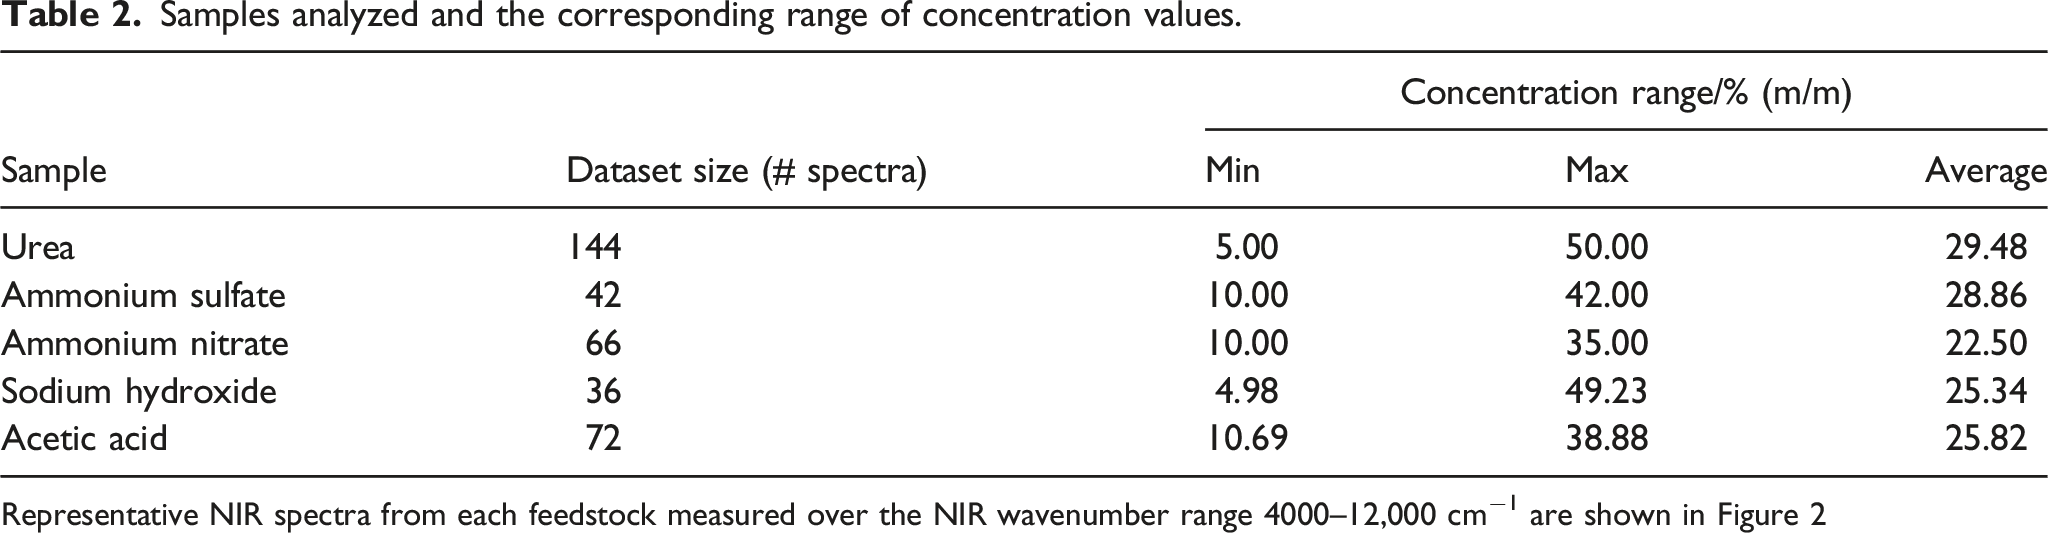
Representative NIR spectra from each feedstock measured over the NIR wavenumber range 4000–12,000 cm−1 are shown in Figure 2
The spectral data were regressed against the concentrations determined by the reference methods, by leave-one-out cross validation. Leave-one-out cross validation is a method for assessing the performance of a quantitative model that split once again the calibration set. A single sample is selected as the new test set and the leftover samples as the calibration set. This procedure is repeated for each sample in the dataset, yielding a model that has been trained and tested using all available calibration data.
The interval partial least squares (iPLS) 30 approach was used to generate the NIR quantitative models. OPUS enables for up to 10 wavenumber intervals to be evaluated. The software proposes default wavenumber regions for typical NIR applications and the wavenumber regions are tested on their own and in all possible combinations.
Interval PLS regression models are developed on spectral subintervals, and the prediction performance of these local models and the global (full-spectrum) model are compared. The comparison is based on the lowest root mean square error of cross validation (RMSECV). The best intervals were selected and the number of latent variables was optimized by exploring all combinations to a maximum of 10.
The RMSECV is given by the equation (1).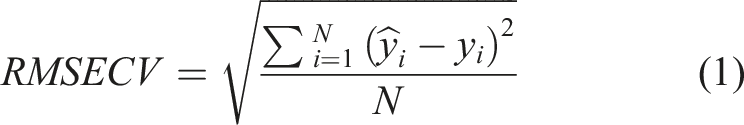
These models were tested on both the raw spectra and spectra treated with various pre-processing methods. Pre-processing is common in the analysis of NIR spectra and is used to minimize the influence of baseline interference on the spectra. There are several pre-processing methods that can be applied. The most common implemented included multiplicative signal correction (MSC), 31 standard normal variation (SNV), 32 Savitzky-Golay smoothing, first derivative and second derivative. 33
The test set samples were chosen (through manual selection) to reflect a representative range of concentrations and were used for model evaluation. The performance of the models was assessed using the mean absolute error (MAE), which calculates the average deviation between the predicted and actual values and is a widely used metric for accuracy assessment. MAE was used to obtain a direct comparison with the estimated errors from the reference methods.
The MAE is given by the equation (2).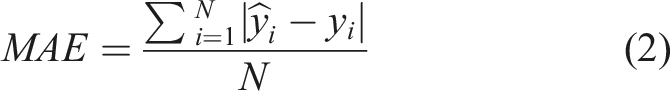
A flowchart of the model selection process is given in Figure 1. Flowchart for model selection. Absorbance spectra in the full NIR region obtained using primary configuration (Bruker probe).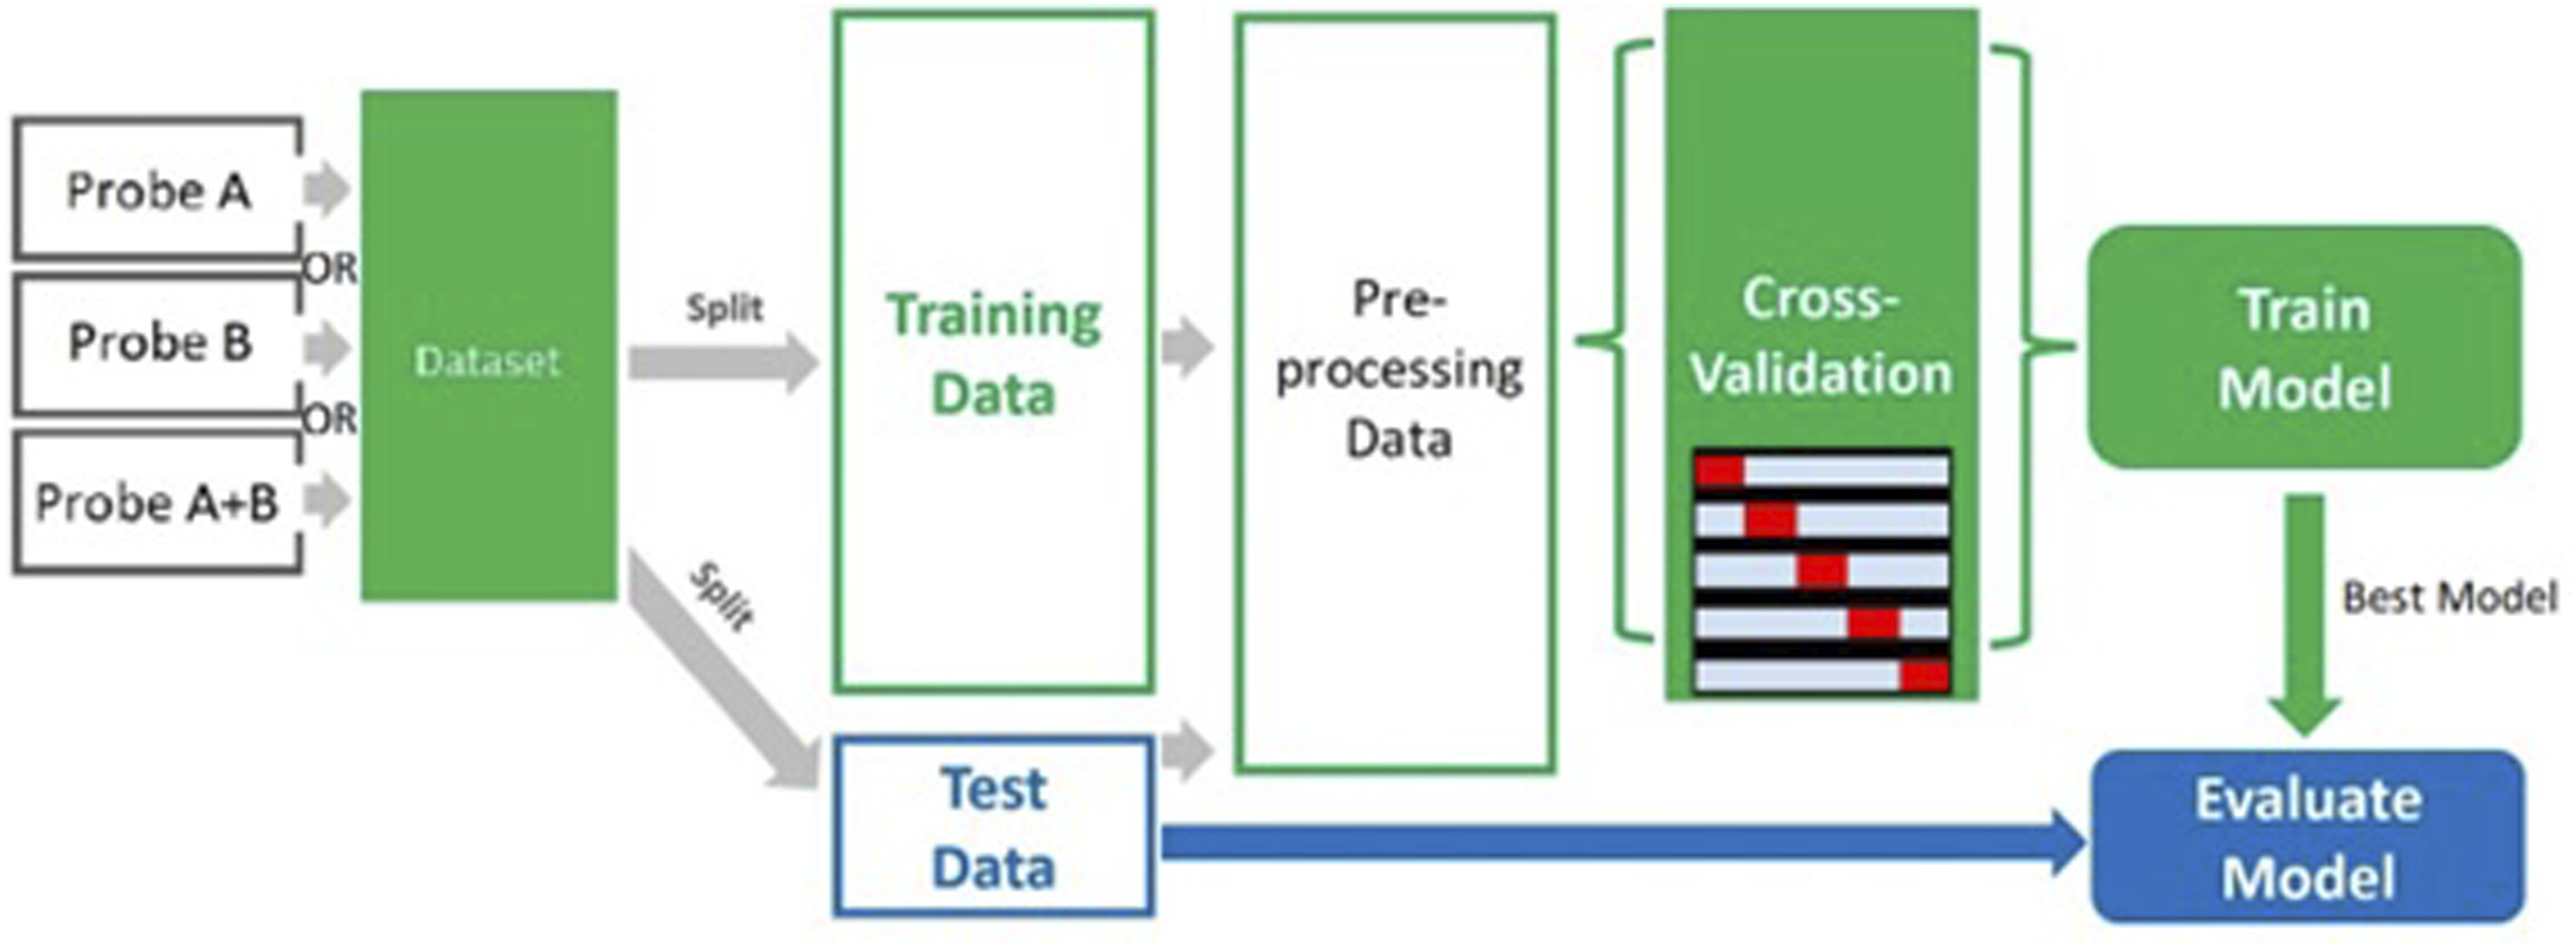
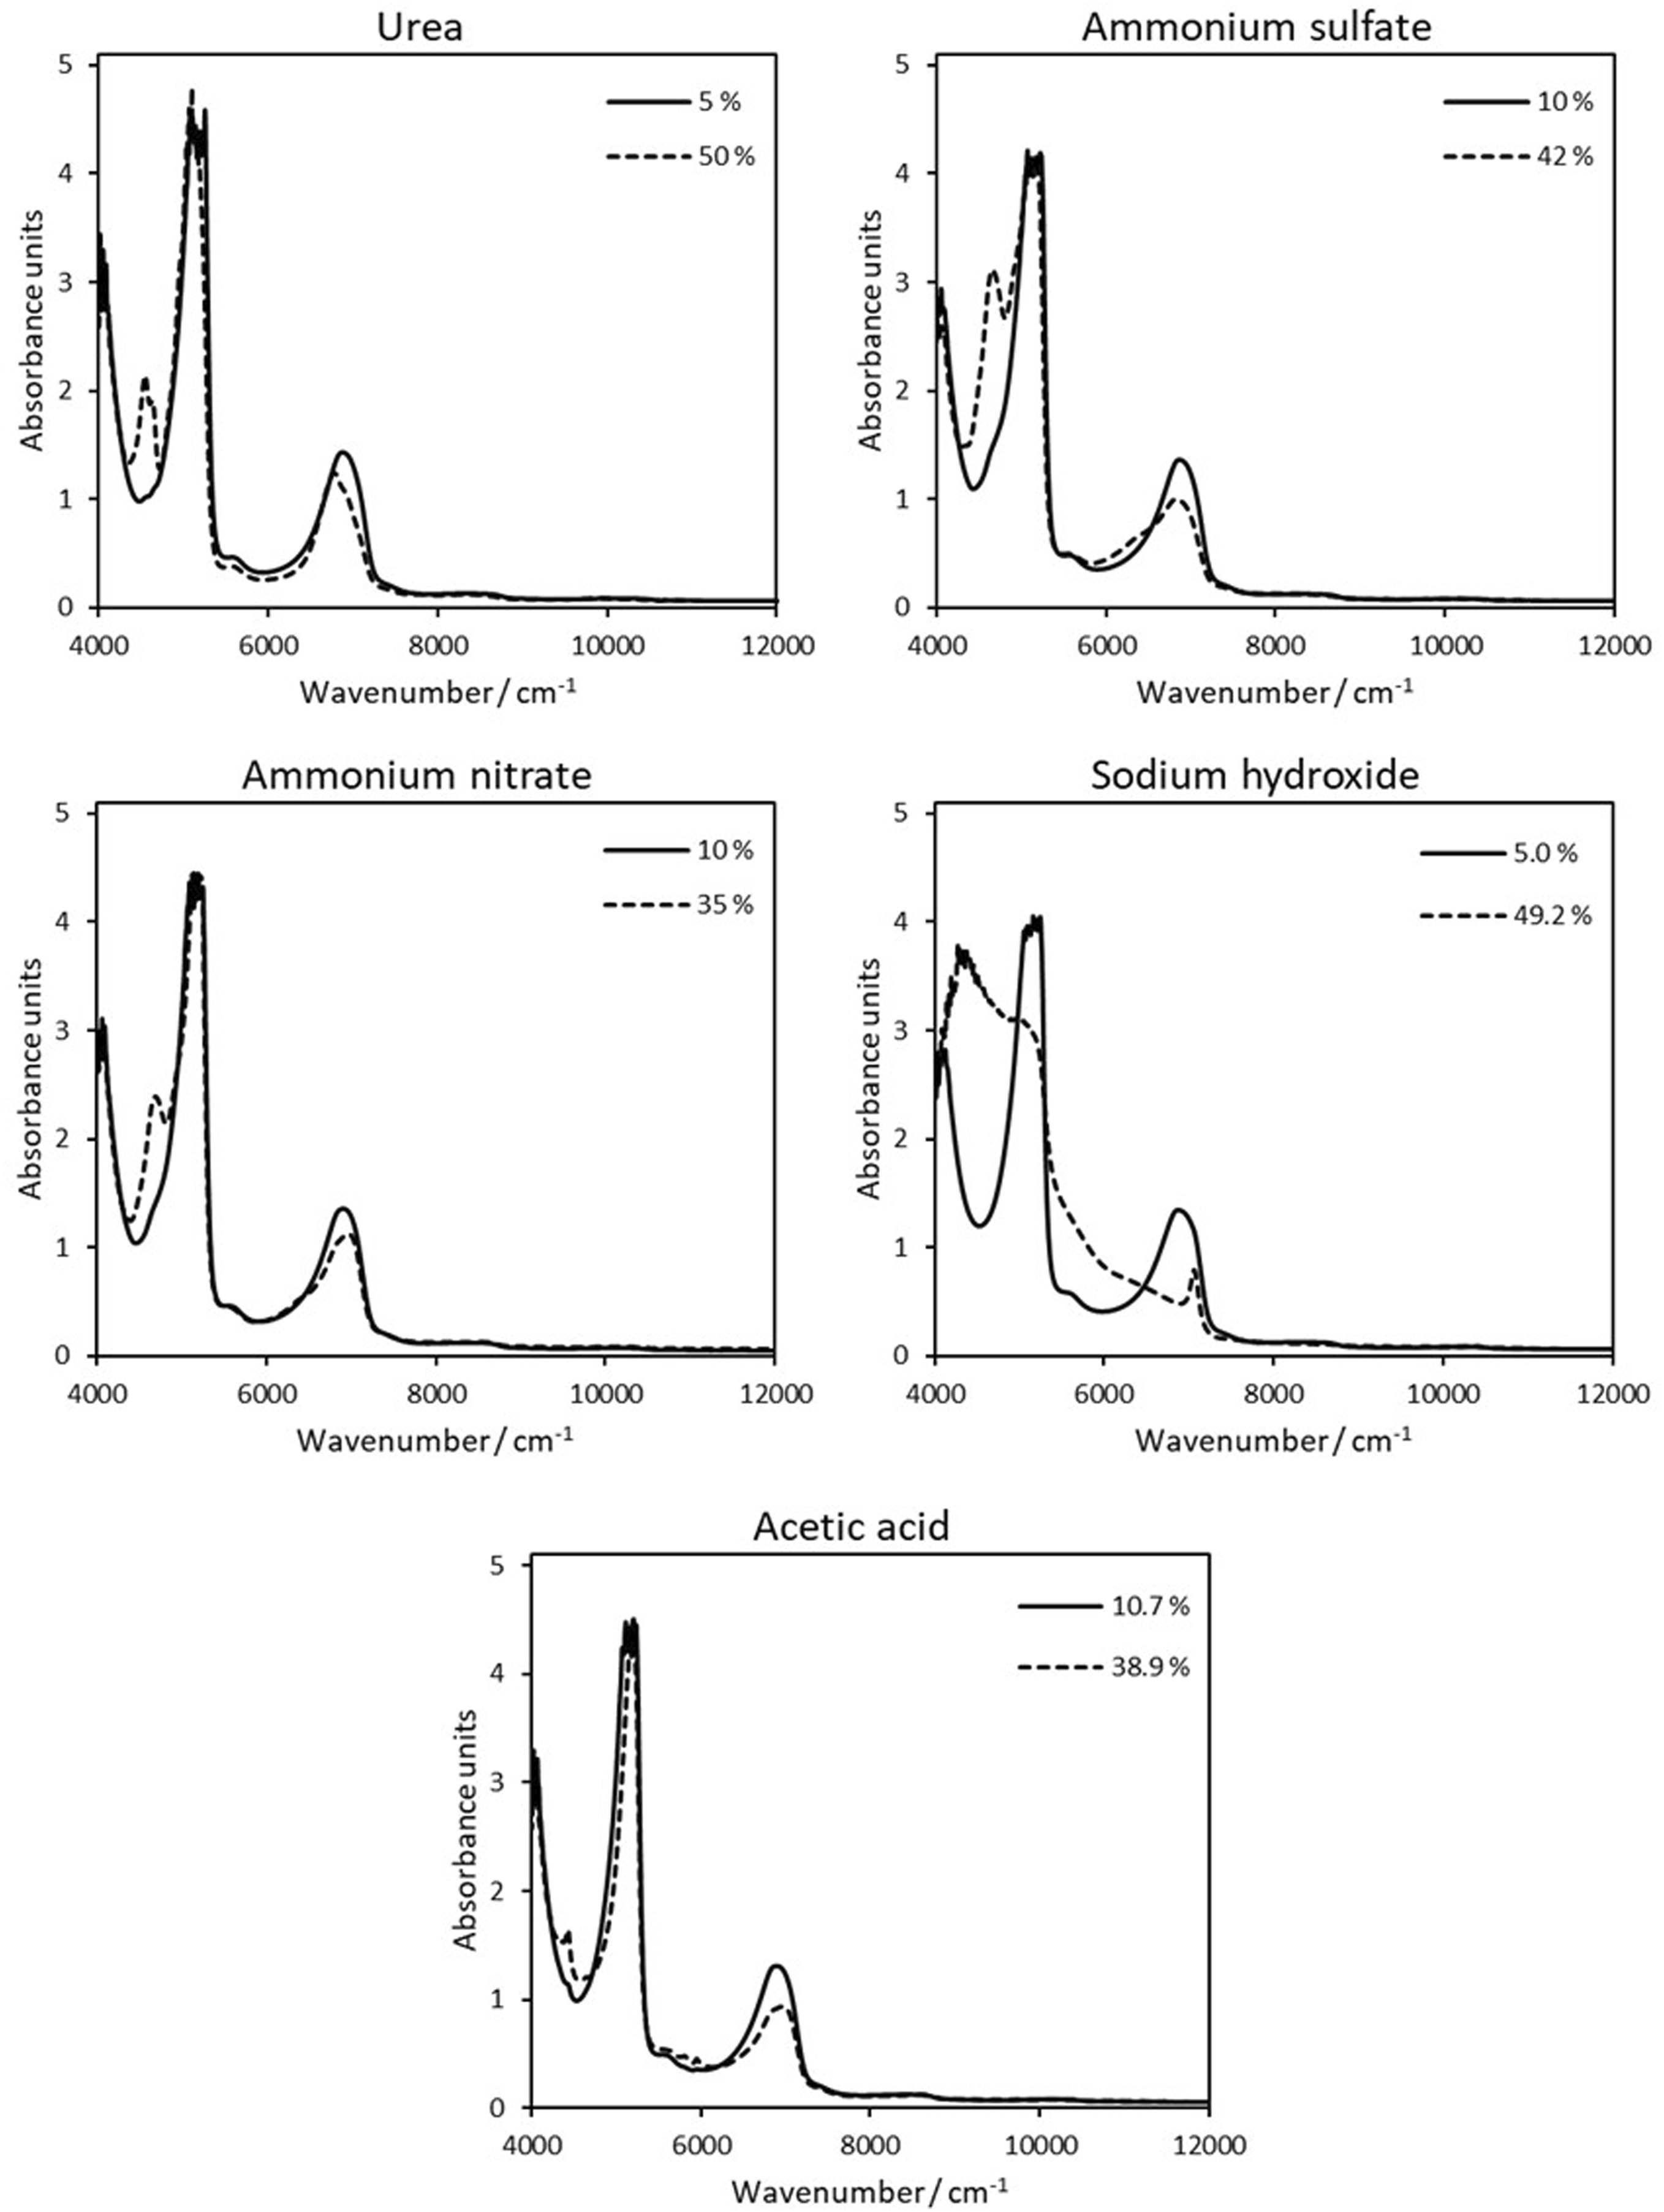
NIR spectra were acquired in two distinct configurations to develop quantitative models for the concentration of major feedstock used in the production formaldehyde-based resins and WBP, namely: urea, ammonium sulfate, ammonium nitrate, sodium hydroxide, and acetic acid.
Results and discussion
Table 2 presents the number of measured spectra for each sample, as well as the reference range of concentration.
The spectra show significant variation across the concentration range for every feedstock under analysis, indicating a likelihood of being correlated with concentration and subsequently applied to develop NIR-based quantitative models.
RMSECV and MAE obtained by training PLS regression models on three spectra datasets for each sample.
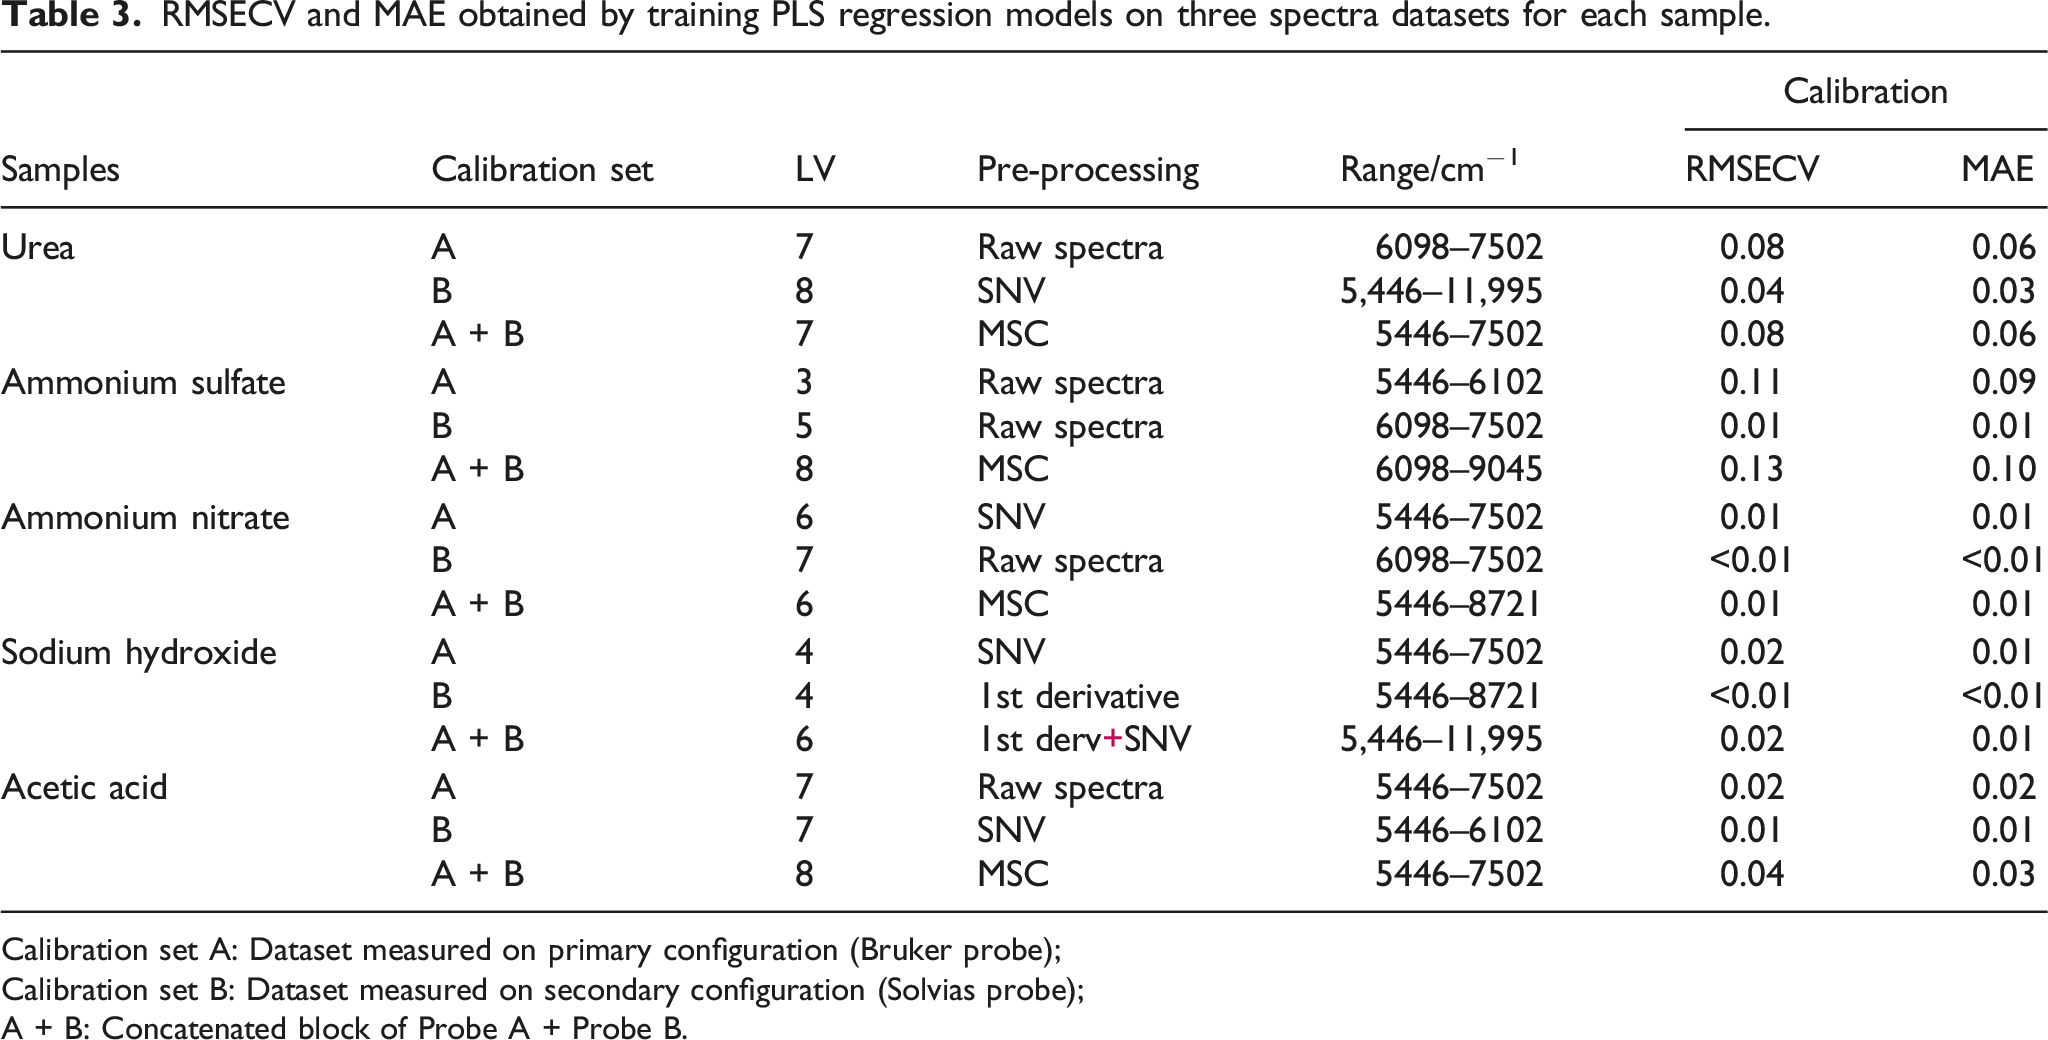
Calibration set A: Dataset measured on primary configuration (Bruker probe);
Calibration set B: Dataset measured on secondary configuration (Solvias probe);
A + B: Concatenated block of Probe A + Probe B.
From the results presented in Tables 3, it is unclear which of the models (calibrated with A, B, or A + B datasets) is preferable, given all the samples have lower MAE than the reference methods, shown in Table 1.
The region of 7500–6250 cm−1 is the first overtone region for water. This wide band results from the overlapping of two absorption bands and it is included in the selected range of almost all models shown in Table 3. Although this spectral region is predominantly affected by solid content, it is important to emphasize that the industrial application is primarily concerned with single-solute aqueous solutions. As a result, determining the precise amounts of individual compounds within a multi-component mixture has limited industrial application.
After optimizing a quantitative model using the calibration set, a test set is used with the purpose for evaluating the performance of the model on an independent dataset. This enables a more realistic assessment of the model’s capacity to generalize and produce accurate predictions on new (unseen) data.
Mean absolute error (MAE) obtained on the test sets for each sample.
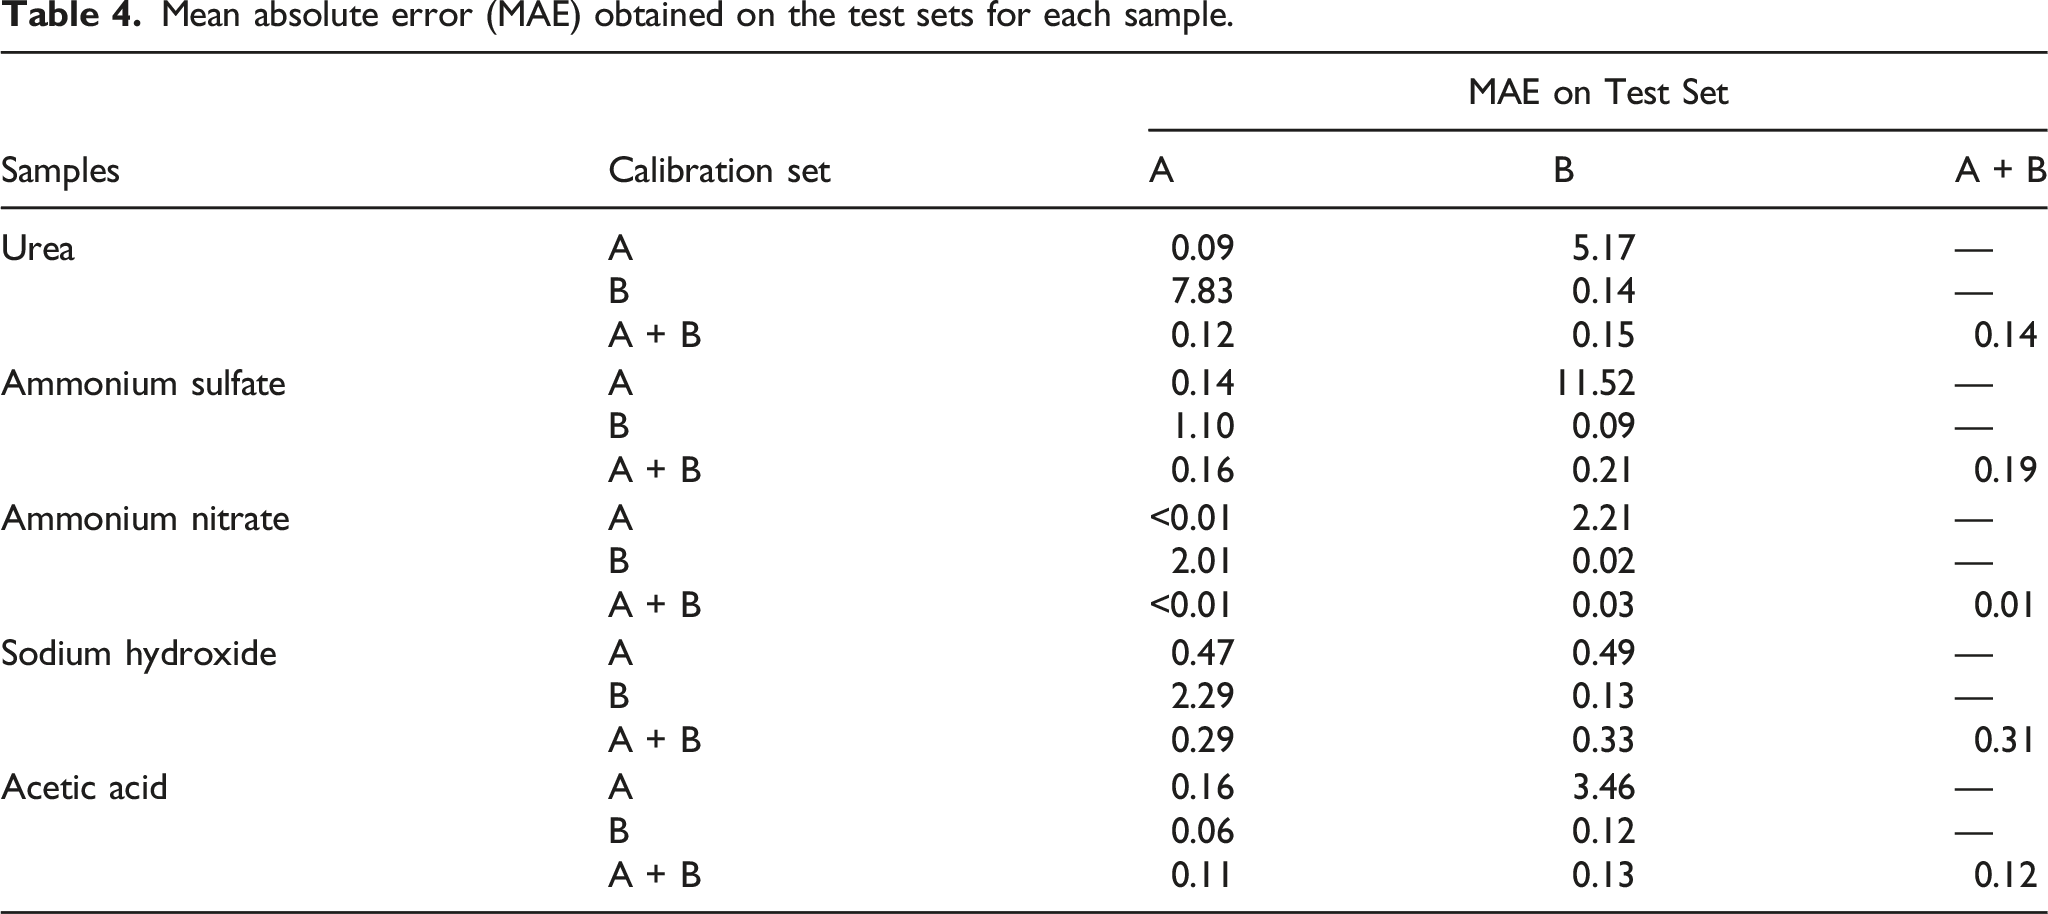
Test sets A and B were combined to form the test set A + B, which was used to evaluate the performance of the A + B model. Thus, for A + B models, the MAE on test sets A and B are shown individually to demonstrate that the prediction errors on probes A and B contribute similarly to the average value given on the A + B test set.
The single-probe models demonstrate considerable bias in their predictions when using spectra from the test set obtained on a probe different from the one used for training the model.
The predicted concentrations for the test samples, for all the datasets except for sodium hydroxide, presented a lower MAE than the corresponding reference methods.
For example, when applying the calibration model trained on spectra measured on probe A to predict the spectra of the test set measured on probe A, MAE was 0.09% for urea. Similarly, the calibration model trained on probe B performed well using the test set spectra obtained on probe B (example: 0.14% for urea). However, the MAE was much higher when directly using the model trained on probe A to predict the spectra of the test set obtained on probe B, indicating that if the model of the main instrument is directly transferred to the secondary instrument, a considerable prediction error will be obtained. As an example, for urea, model trained on probe A with test set measured on probe B presented 5.17% MAE, and model trained on probe B with test set measured on probe A presented a MAE of 7.83%.
The single-probe calibration model, for sodium hydroxide, shows a lack of agreement between the calibration and test sets. Even though, the combined probe model presents MAE of 0.31%, higher than the reference method, but enough for industrial implementation.
It can be said that the straightforward integration of the two datasets (A, B) with the goal of developing a model (A + B) compatible with the two probes appears to yield promising results.
This strategy enables the direct implementation of the same NIR-based model in two distinct equipment’s, using only the software provided by the spectrometer manufacturer and without any further spectra manipulation.
Figure 3 illustrates, for the sodium hydroxide samples, that the two probes (A, B) have distinct features. Model trained with probe B and tested with the test set measured on probe ‘A’ presented a MAE of 2.29%. Nevertheless, model A + B tested with A + B test set has MAE of 0.31%. Several samples, with similar concentrations, appear to be overlaid on the plot. Parity plots for the sodium hydroxide models tested on A, B and A + B datasets.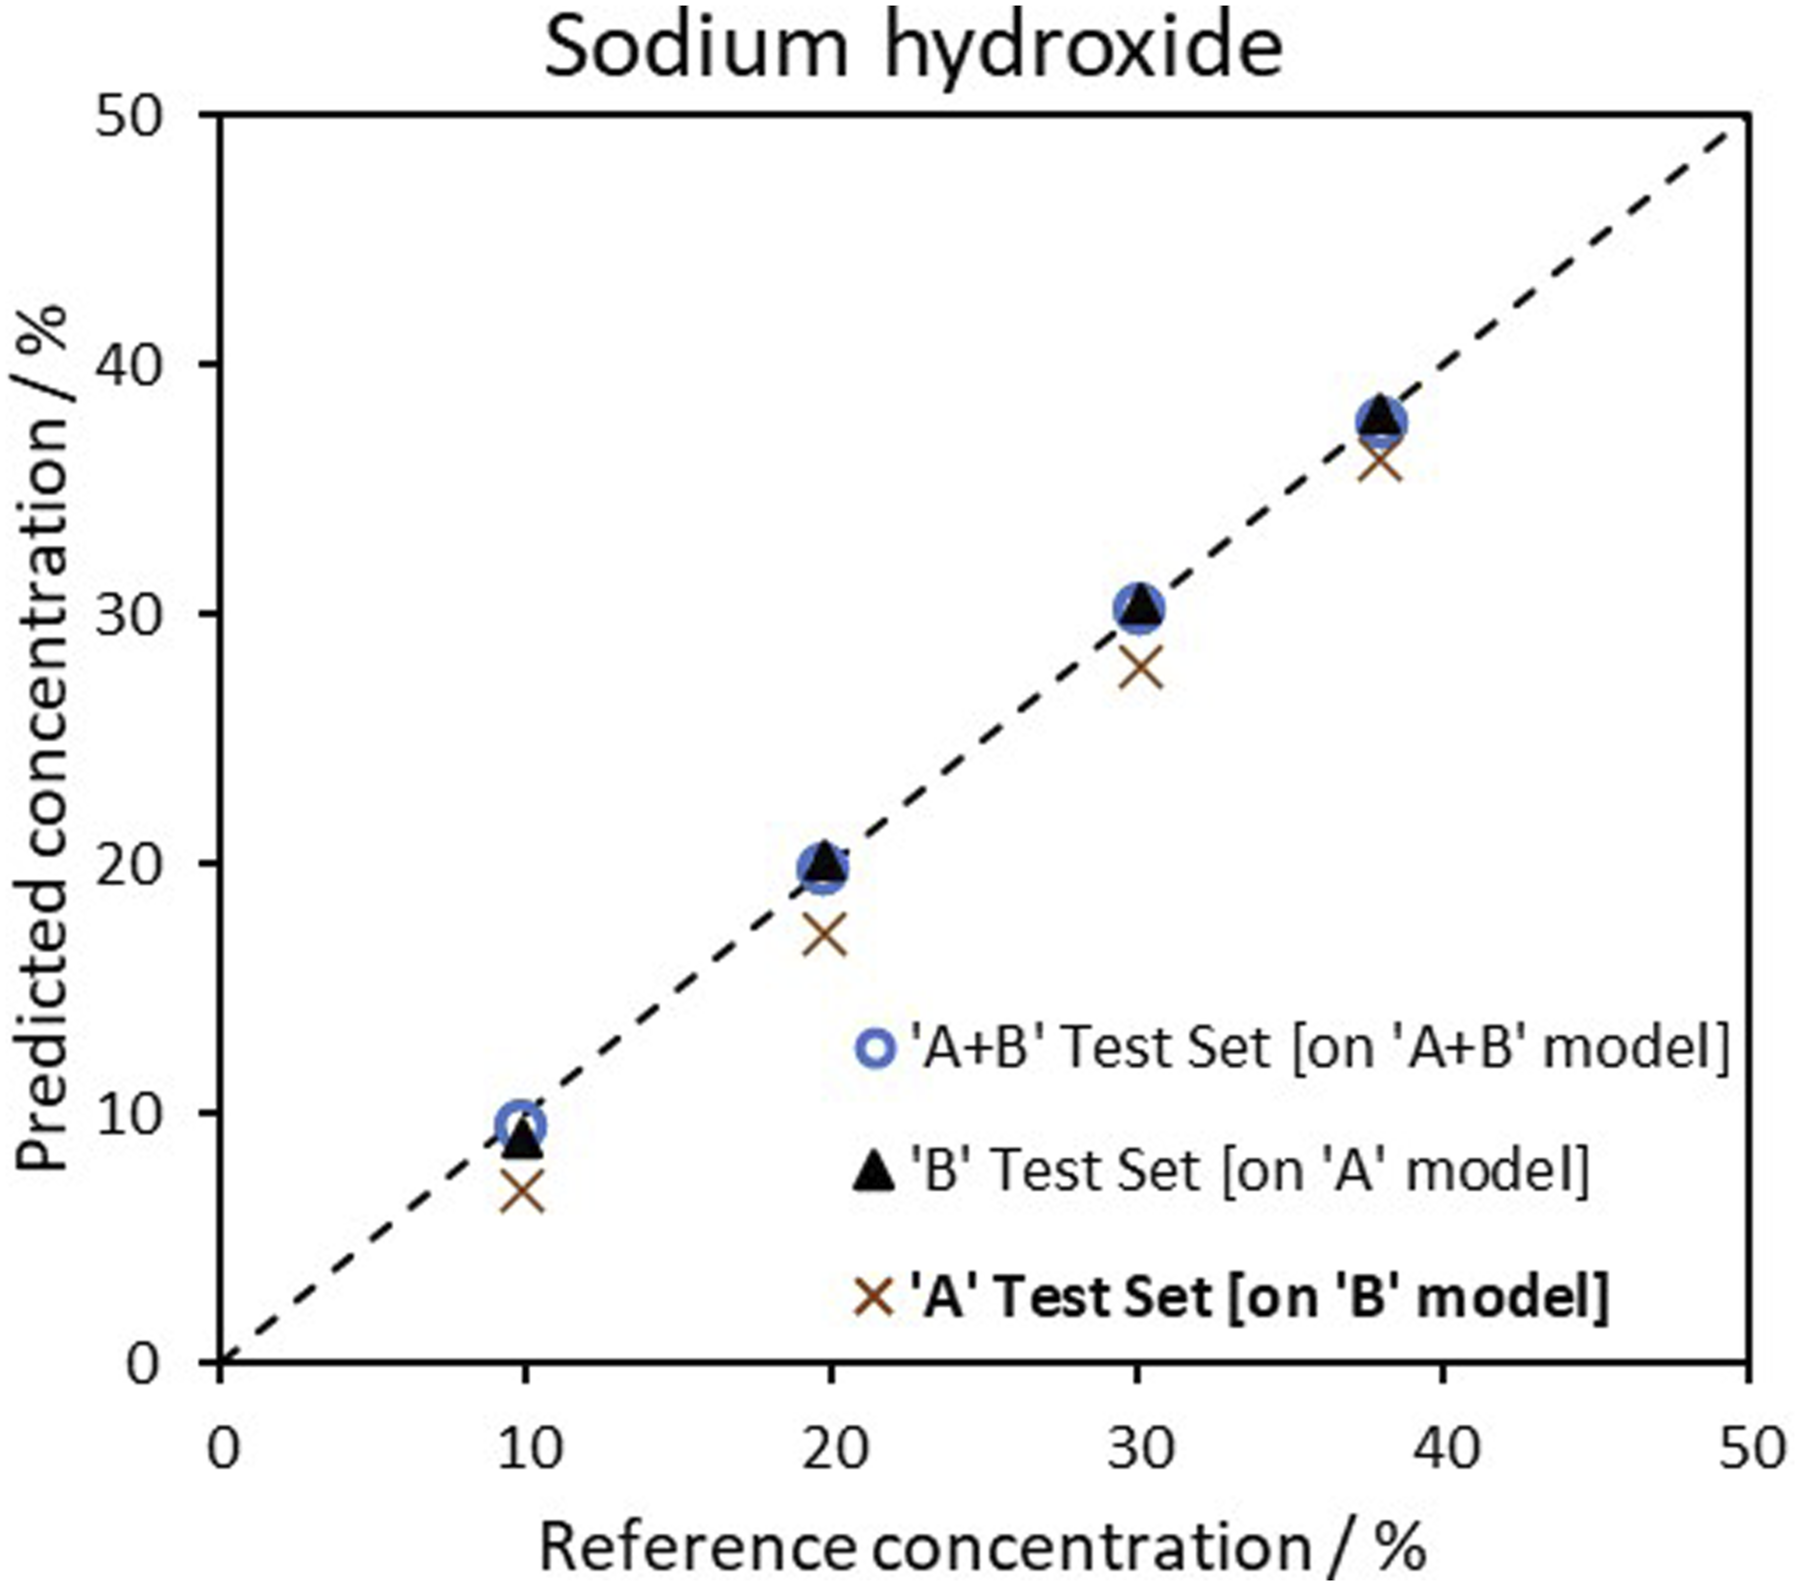
Figure 4 shows the relationship between the number of latent variables and the RMSECV for the models presented in Tables 3 and 4. The optimal number of latent variables can be determined by identifying the lowest point on the RMSECV plot, which in this study was found to be below 10 for all samples. Single-probe models converged faster to low RMSECV values. Despite this, the A + B models performed similarly (for the calibration set) in the optimal number of LV. Cross-validation based PLS modelling with the evolution of cross-validation error as a function of number of latent variables.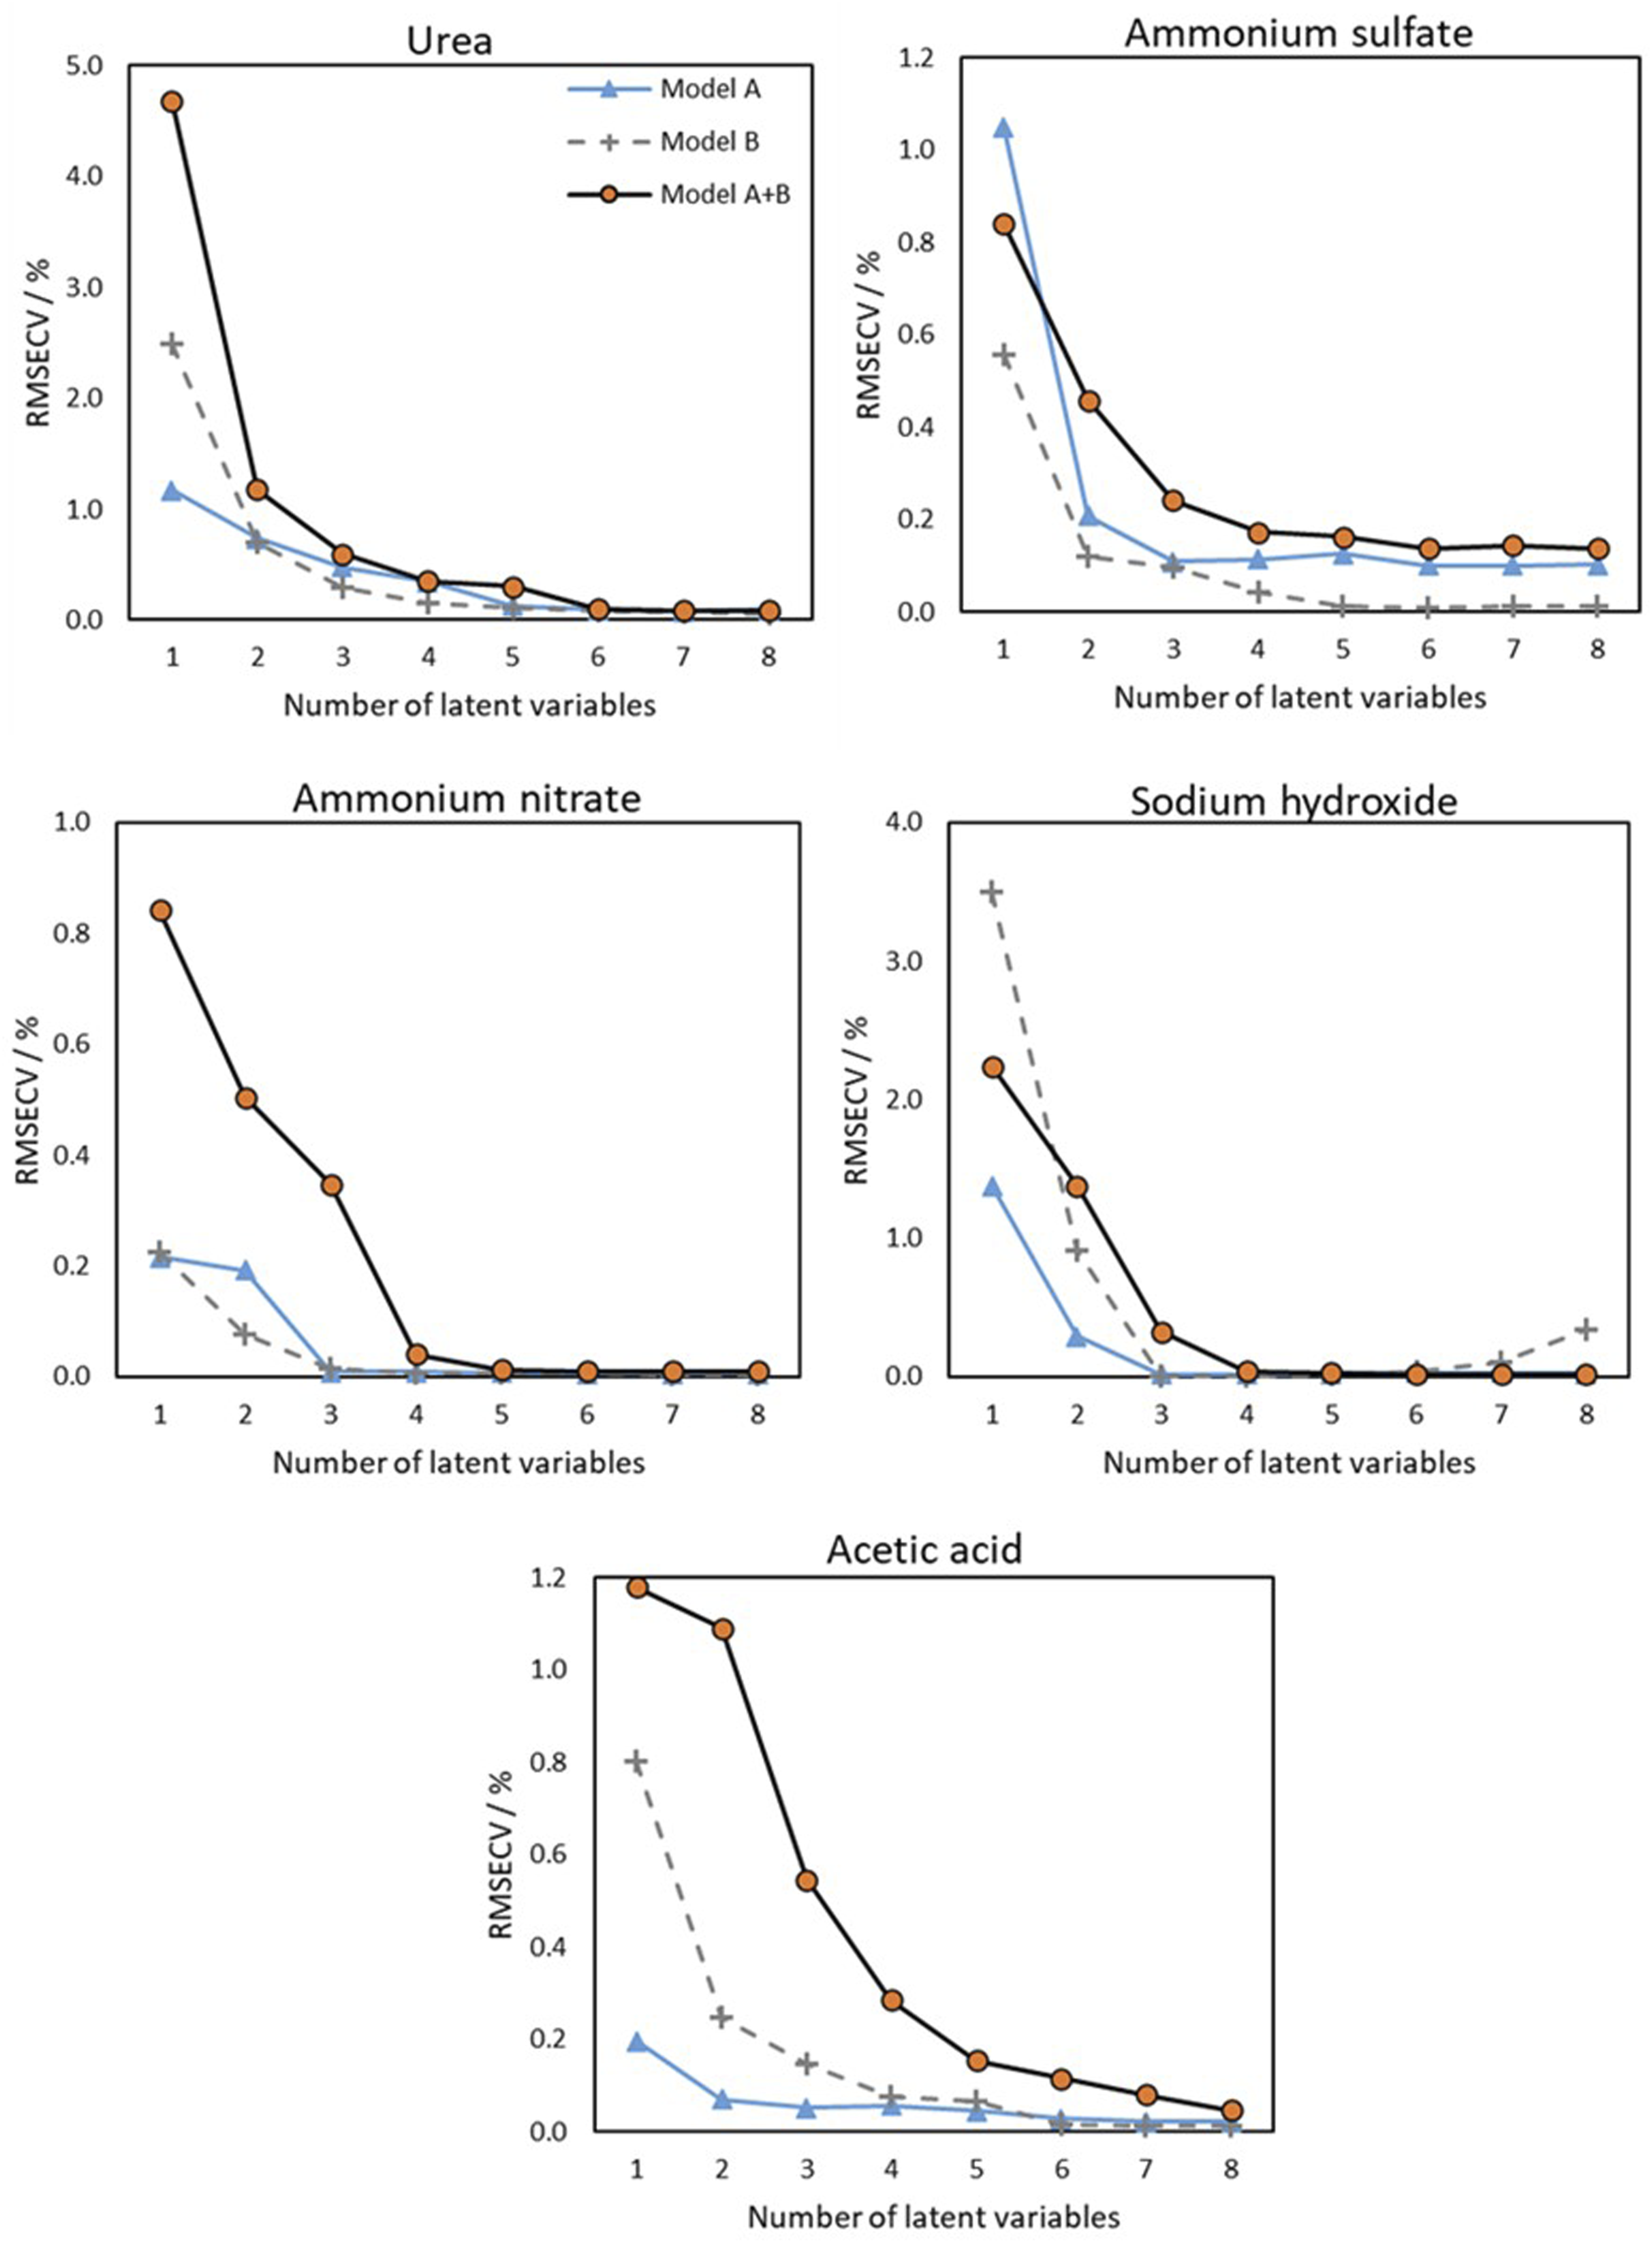
Conclusions
In this study, the use of NIR spectroscopy and multivariate analysis has been demonstrated for predicting the concentrations of aqueous solutions of urea, ammonium sulfate, ammonium nitrate, sodium hydroxide, and acetic acid.
With the main goal of applying one quantitative model at two different industrial sites, and because slight variations in NIR spectra due to different instrumentation affecting model accuracy, NIR spectra were acquired through two distinct configurations using two NIR transmission probes coupled with a Bruker Matrix-F FT-NIR spectrometer. Quantitative models were constructed by combining the spectra acquired with the two probes, which achieved comparable prediction errors as the single-probe based models. On combined probe models, the effect of the probe in use was reduced and the NIR model used to determine the properties of interest became less affected by the equipment.
The quantitative model for sodium hydroxide achieved a MAE on the test samples of 0.31%. All the other samples achieved MAE lower than 0.20%, which is consistently lower than the correspondent reference methods.
The results of this study suggest that NIR spectroscopy has the potential to be a valuable tool for quality control and process optimization in the production of formaldehyde-based resins and wood-based panels. Along with reducing testing time, this technology allows to minimize consumption of chemicals required in the conventional reference methods. Further research is needed to evaluate the performance of the proposed models under different industrial conditions, namely the feasibility of implementing in-line monitoring.
Footnotes
Author contributions
Roberto Magalhães: Investigation, Formal Analysis, Writing - Original draft; Nádia T. Paiva and João M. Ferra: Conceptualization and project administration; Fernão D. Magalhães and F. G. Martins: Supervision; All authors: writing - review and editing. All authors have read and agreed to the published version of the manuscript.
Declaration of conflicting interests
The author(s) declared no potential conflicts of interest with respect to the research, authorship, and/or publication of this article.
Funding
The author(s) disclosed receipt of the following financial support for the research, authorship, and/or publication of this article: This work was supported by the LA/P/0045/2020 (ALiCE), UIDB/00511/2020 and UIDP/00511/2020 (LEPABE), funded by national funds through FCT/MCTES (PIDDAC). Roberto Magalhães thanks the individual research grant SFRH/BD/151225/2021, funded by the Portuguese Foundation for Science and Technology (FCT).