
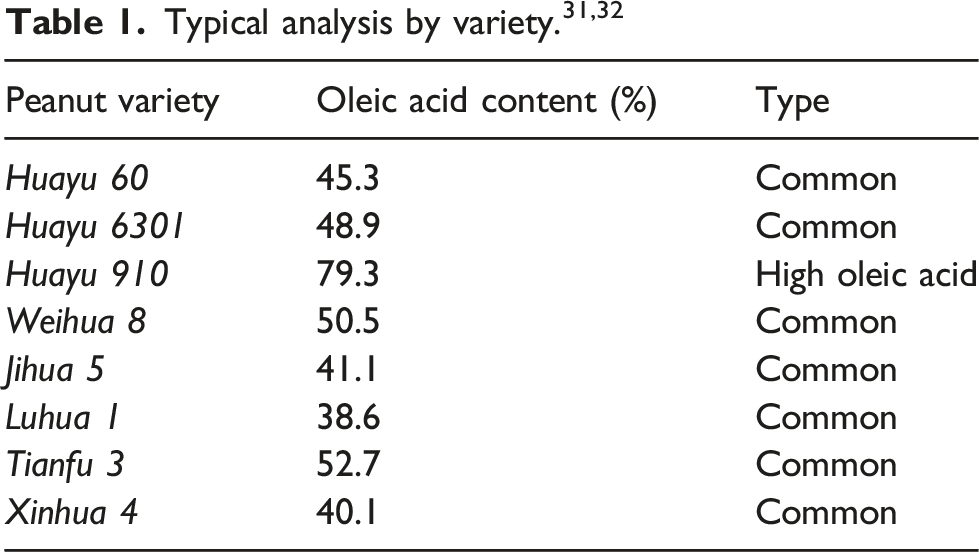
Abstract
High oleic acid peanuts have higher oleic acid content and stronger oxidation stability than common peanuts, but their appearances are similar, which imposes difficulties for classifying. Based on this, the study aims to classify high oleic acid peanut to ensure its purity by using hyperspectral imaging technology. However, classification accuracy and efficiency are limited given the large amount of redundant information of hyperspectral images. The band iteration algorithm (BIA) is proposed to select characteristic bands by reducing the redundant information between spectral bands for the peanut classification. Hyperspectral images with 616 bands (from 400 nm to 1100 nm) of 126 high oleic acid peanuts and 126 common peanuts were collected. Then, BIA selected optimal bands as characteristic bands from adjacent bands according to the classification accuracy of each band subsets. Thirdly, three classification models, namely linear discriminant analysis, support vector machine, and partial least squares-discriminant analysis (PLS-DA), were employed to compare the performance of BIA with successive projections algorithm and competitive adaptive reweighted sampling, respectively. The experimental results show that BIA can effectively improve the classification ability of spectral data. The BIA-PLS-DA model had the best classification efficiency, and the accuracy of the test set reached 93.26%. For peanut individuals, only one peanut sample was misclassified with a classification error rate of 1.43%.
Introduction
Peanut is a valuable oil and cash crop, known for its abundant protein content, unsaturated fatty acids, and other beneficial nutritional compounds. 1 Based on the oleic acid content, peanut can be categorized into two types: common peanut, which consists of around 45% oleic acid and 35% linoleic acid, 2 and high oleic acid peanut, which must have over 74% oleic acid content. 3 High oleic acid peanut contains abundant nutrients and bioactive ingredients, which can help reduce the risk of cardiovascular diseases and regulate blood glucose levels. 4 Moreover, it possesses stronger oxidative stability, extending the shelf life in the food processing industry, thus leading to widespread promotion.5,6 However, it is difficult to identify and segregate high oleic acid peanuts from mixed peanuts during industrial production, for high oleic acid and common peanuts are similar in appearance. Therefore, an accurate and rapid non-destructive testing method is needed to ensure the purity of high oleic acid peanuts during production and processing.
Spectral imaging technologies can record images at hundreds of contiguous wavelengths, 7 offering a more comprehensive information compared to traditional red, green, and blue imaging technology. 8 With significant recent evolution in imaging technology, the application of hyperspectral imaging sensors has become increasingly promising in recent years, such as seed purity and vigor testing,9,10 fruit variety identification and growth monitoring,11,12 and crop quality evaluation. 13 Previous research has attempted to utilize near infrared reflectance (NIR) spectroscopy to predict the oleic acid content in peanuts, providing an effective non-destructive quantitative detection method for the early screening of peanuts.14,15 Yu et al. 16 employed NIR spectroscopy to classify high oleic acid peanuts and predict the content of the main fatty acids. Davis et al. 3 used a novel instrument (QSorter Explorer) to evaluate the purity of high oleic acid peanuts. Fox and Cruickshank 17 predicted fatty acid content in peanuts with NIR spectroscopy. NIR spectroscopy has also been applied to analyze peanut qualitatively for the rapidity and convenience of industrial production. O'Connor et al. 18 employed partial least squares-discriminant analysis (PLS-DA) to classify the oleic acid content of peanuts based on peanut spectra, achieving an overall classification error rate of 3.3%. Yu et al. 19 constructed a peanut varietal classification model based on machine learning algorithms with NIR spectroscopy.
However, the high dimensional spectral data introduces information redundancy, which leads to the Hughes phenomenon in data processing, that is, the deterioration of classifier performance as feature dimensions increase beyond a critical threshold.20,21 This not only affects the efficiency of data processing but also limits the accuracy of classification models.
Therefore, research is progressing to extract valuable information from spectral data with machine learning algorithm. Various dimension reduction methods are employed to identify the most representative bands, aiming to enhance the efficiency and accuracy of detection and analysis. Sun et al. 22 proposed the successive projections algorithm (SPA) and combined it with stepwise regression, as well as competitive adaptive reweighted sampling (CARS) with stepwise regression, to select characteristic wavelengths for retrieving moisture content distribution of tea leaves. Shao et al. 23 employed SPA to select characteristic wavelengths from spectral data to establish a regression model for predicting the overall quality of tomatoes. Pham et al. 24 utilized principal component analysis (PCA) to select effective spectral bands within the wavelength range from 468 nm to 760 nm for online detection of jujube surface defects. Xu et al. 25 applied uninformative variable elimination (UVE) to extract characteristic wavelengths, enabling the construction of a classification model for identifying the vigor of maize seeds. Moreover, combining multiple wavelength selection algorithms can enhance the integrity of characteristic wavelengths that reflect the original data. He et al. 26 employed SPA, CARS, and UVE to select a total of 31 optimal wavelengths for classifying diploid and triploid maize.
Band selection algorithms are based on various theories, which will impact the selected bands for specific application. Ranking-based methods, such as PCA, 27 identify the most informative bands by spatial projection, replacing the original data. But these approaches change the spatial structure of the original spectral data, potentially leading to the loss of crucial information. Search-based methods, like SPA, 28 iteratively search for the least redundant wavelengths. Nevertheless, the chosen bands may only capture strong characteristic information, which usually not represent the complete band information. In recent years, intelligent optimization algorithms have been increasingly employed for band selection, including the simulated annealing algorithm and genetic algorithm.29,30 These algorithms address wavelength combination optimization problems by simulating natural processes. However, the optimization process of these algorithms is highly complex and prone to getting trapped in local optima.
The main objectives of this study were to propose a band selection algorithm, namely band iteration algorithm (BIA), to eliminate the redundancy of adjacent bands while preserving the spatial structure and spectral details of the original spectrum, and to construct an optimal model for classifying high oleic acid peanuts based on classification accuracy.
Materials and methods
Experimental sample preparation
Peanut sample composition of training set and test set.
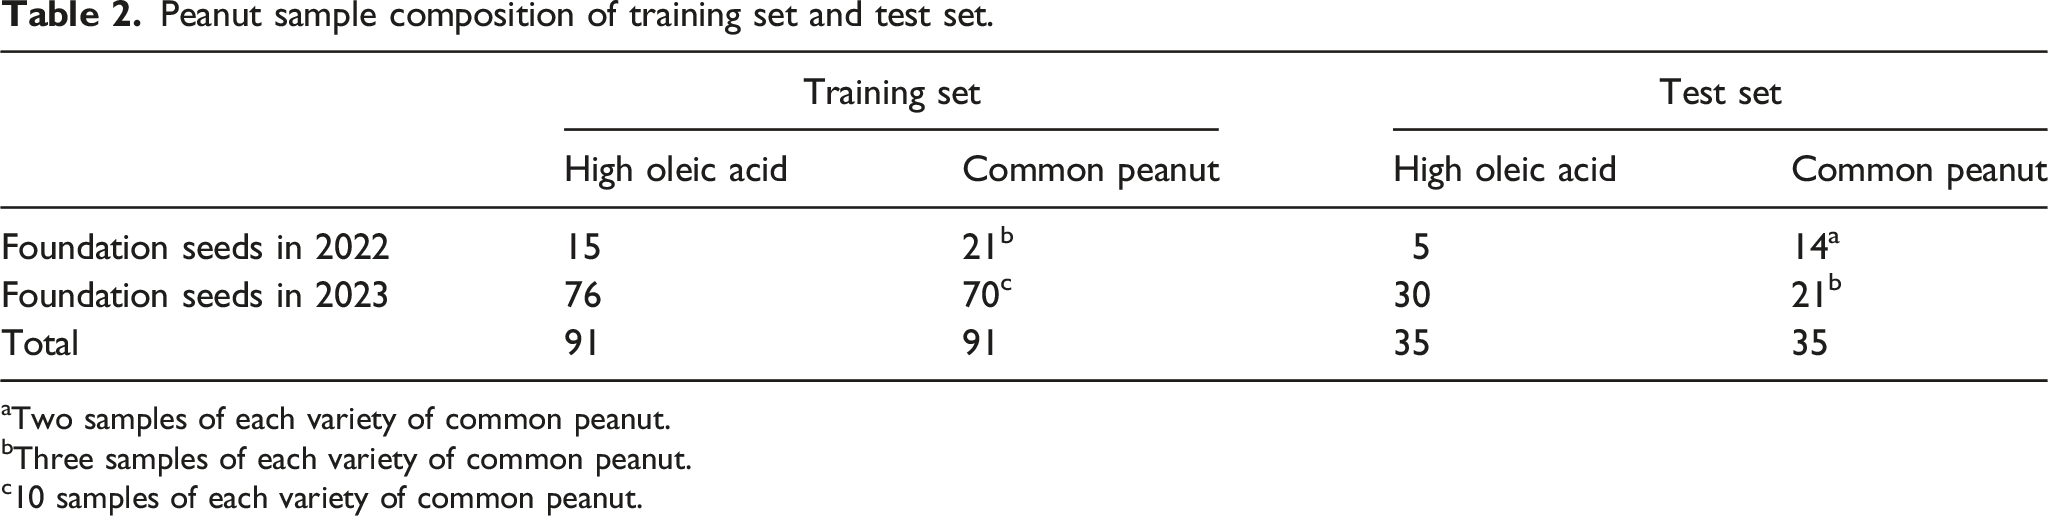
aTwo samples of each variety of common peanut.
bThree samples of each variety of common peanut.
c10 samples of each variety of common peanut.
Spectral image acquisition and preprocessing
Peanut spectral data was collected using a hyperspectral imaging system (ISUZU-HSI-VNIR, Isuzu Optics Corp., Taiwan, China) with a dark background, which acquires spectral information from 280 nm to 1167 nm, with 616 spectral bands and an average spectral resolution of 1.44 nm.
Due to limitations of the experimental instrument, the spectral data below 400 nm and above 1100 nm suffered from significant noise. 33 Thus, the actual spectral wavelength range from 400 nm to 1100 nm was selected, resulting in a total of 481 bands for further analysis.
The spectral images were calibrated with formula (1).
34
To eliminate the interference caused by background noise, spectral reflectance is applied to mask peanut spectral images with a threshold of 0.06 (dimensionless). It ensured that the spectral reflectance value of the sample peanuts remained stable while setting the background’s spectral reflectance value to zero. Figure 1(a) shows the average spectra of the eight varieties of peanuts after removing background noise. The average spectra (a) after removing background noise, and (b) after moving average preprocessing.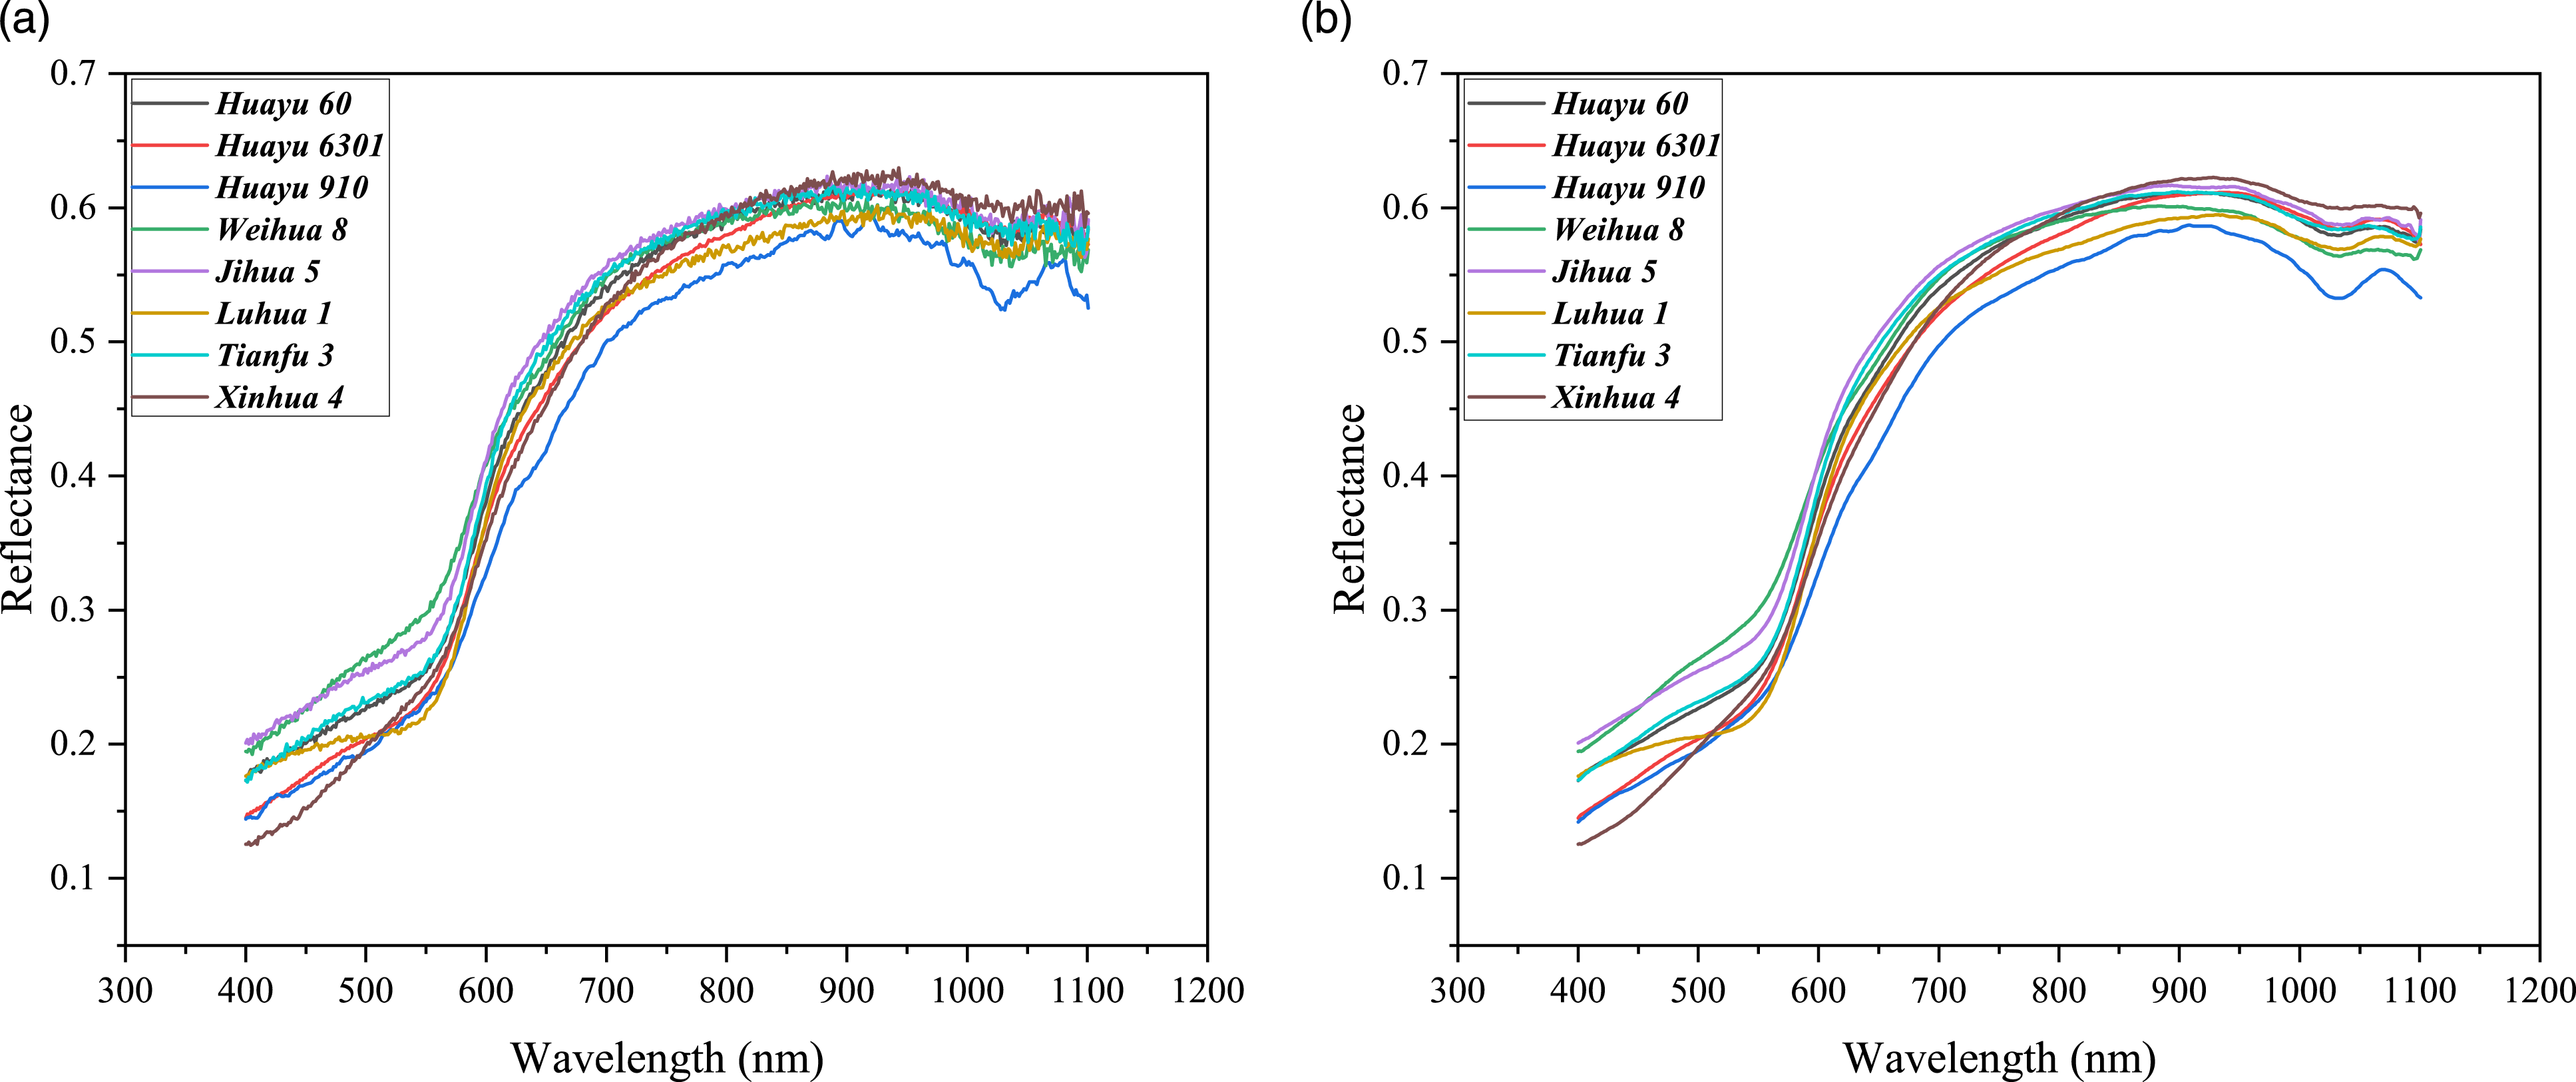
In this study, 50 spectral data points were extracted from the corrected spectral image of each peanut, and these collection points will be guaranteed to be in the normal spectral images of the peanuts. Consequently, there are 9100 points in the training set and 3500 points in the test set.
To further alleviate noise and improve the availability of data, the corrected spectral data was preprocessed by moving average (MA) with 21 smoothing points. 35 Figure 1(b) shows the average spectra after preprocessing. There are no significant differences in the spectral reflectance curves of different peanut varieties. Within the spectral range of 400 nm to 900 nm, the reflectance increases rapidly with increasing wavelength. Subsequently, the reflectance decreases gradually, accompanied by the appearance of an absorption valley within the range of 950 nm to 1070 nm.
The absorption region in the NIR spectroscopy curve is influenced by the stretching vibrations of various chemical groups, and the intensity of absorption is proportional to the content of these chemical groups.36–38 In the spectral region of 950 nm to 1070 nm, the appearance of absorption valleys can be attributed to the third overtone C-H stretches. 39 Peanut oil composition contains a significant number of C-H groups, explaining the presence of these absorption valleys. Notably, Huayu 910 has a deeper spectral absorption valley than other peanut varieties, which indicates there is a higher oil content in Huayu 910 than others.
Band iteration algorithm
Proposed method
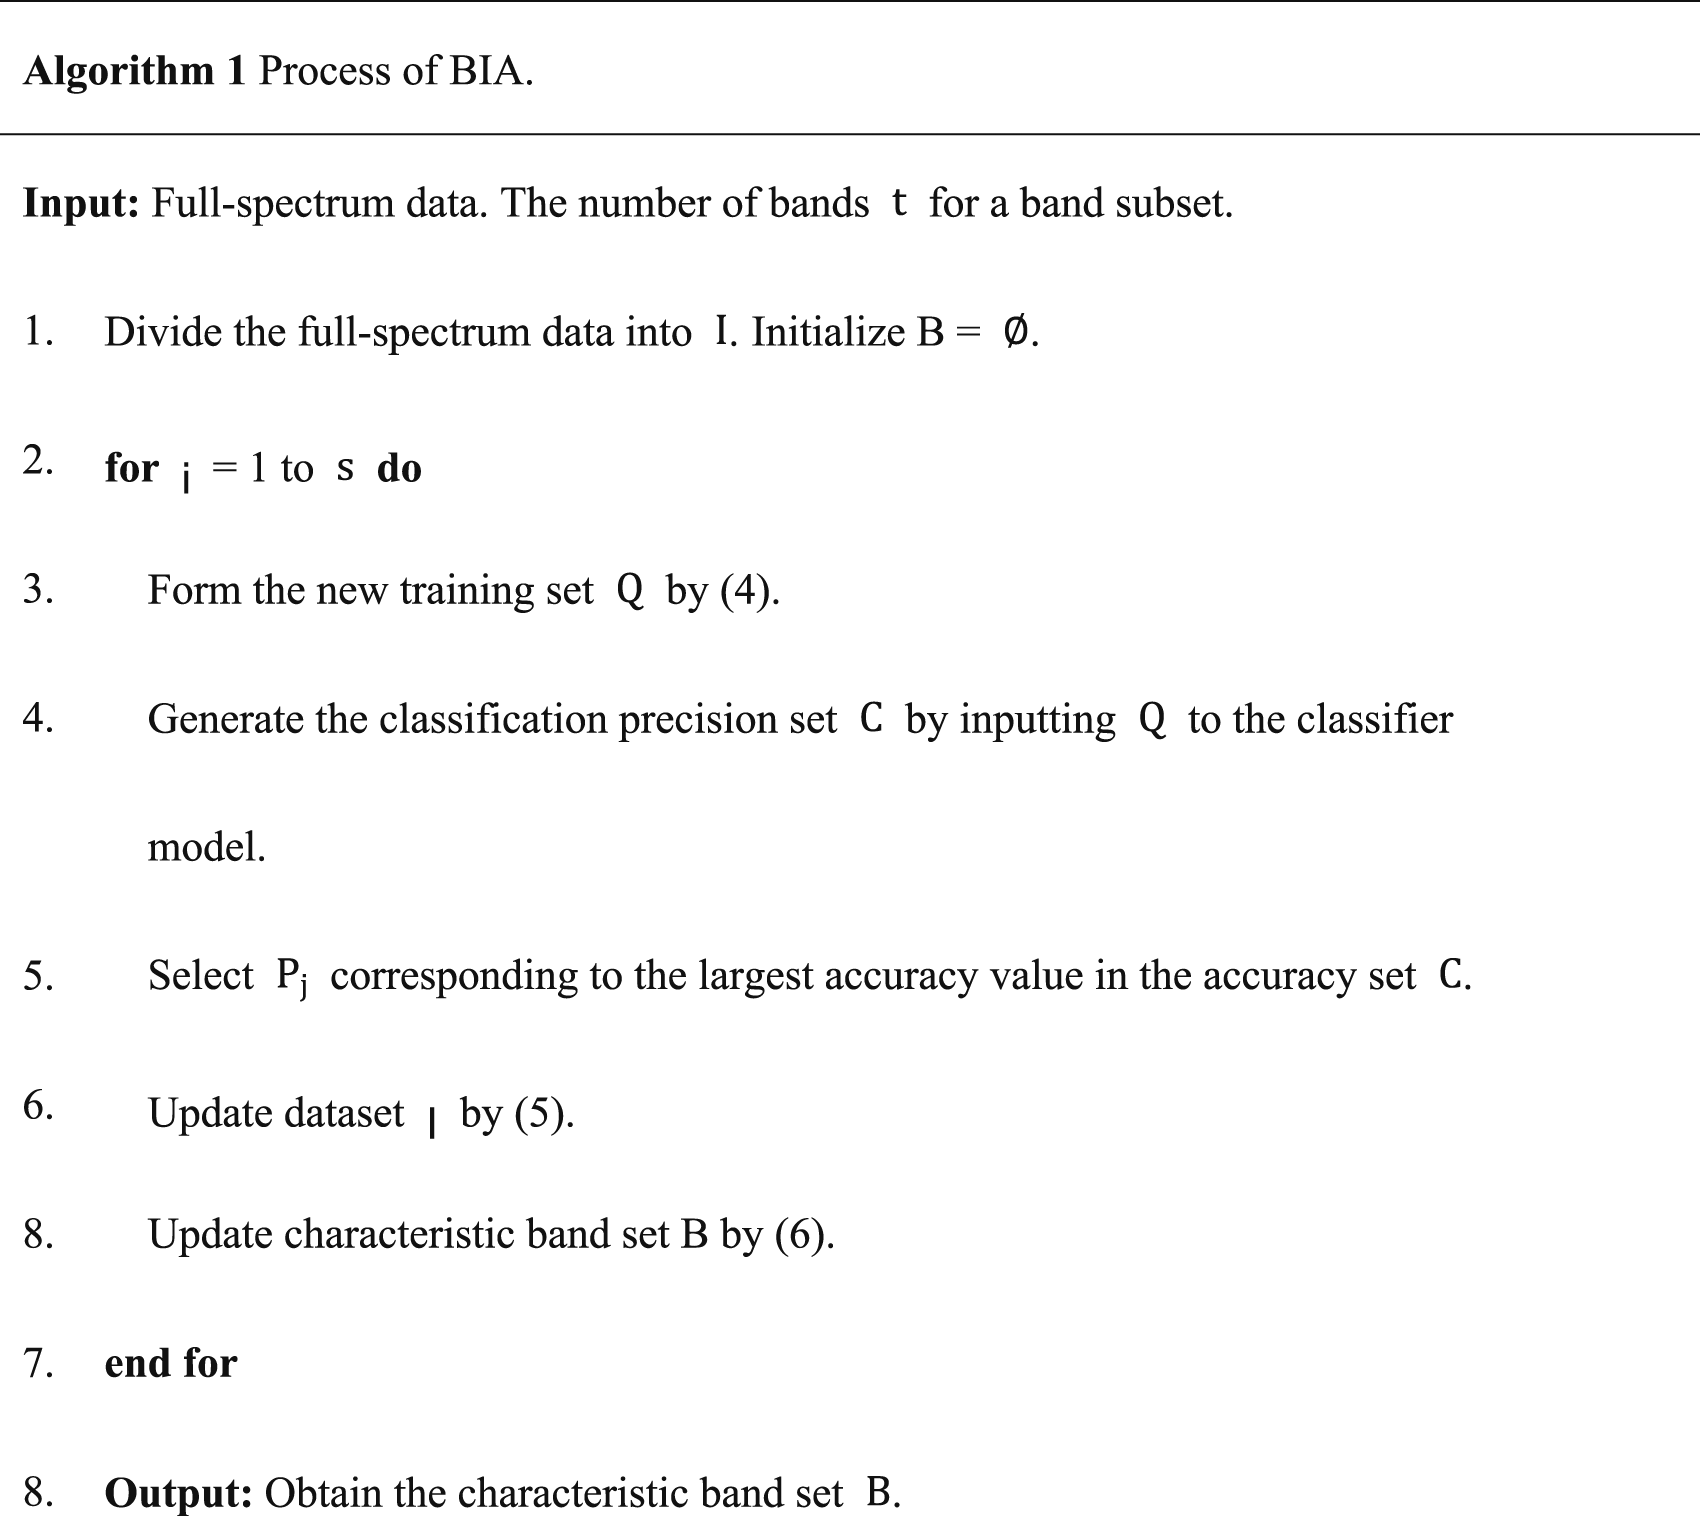
The flowchart of the BIA is depicted in Figure 2. The algorithm’s main principle is to evaluate the classification performance of the training sets corresponding to individual bands within a set of candidate bands. It selects the bands which can achieve the highest classification accuracy, called characteristic bands. In each iteration, the training data incorporates the previously selected characteristic bands, accumulating their effects as the number of iterations increases. The flowchart of the band iteration algorithm.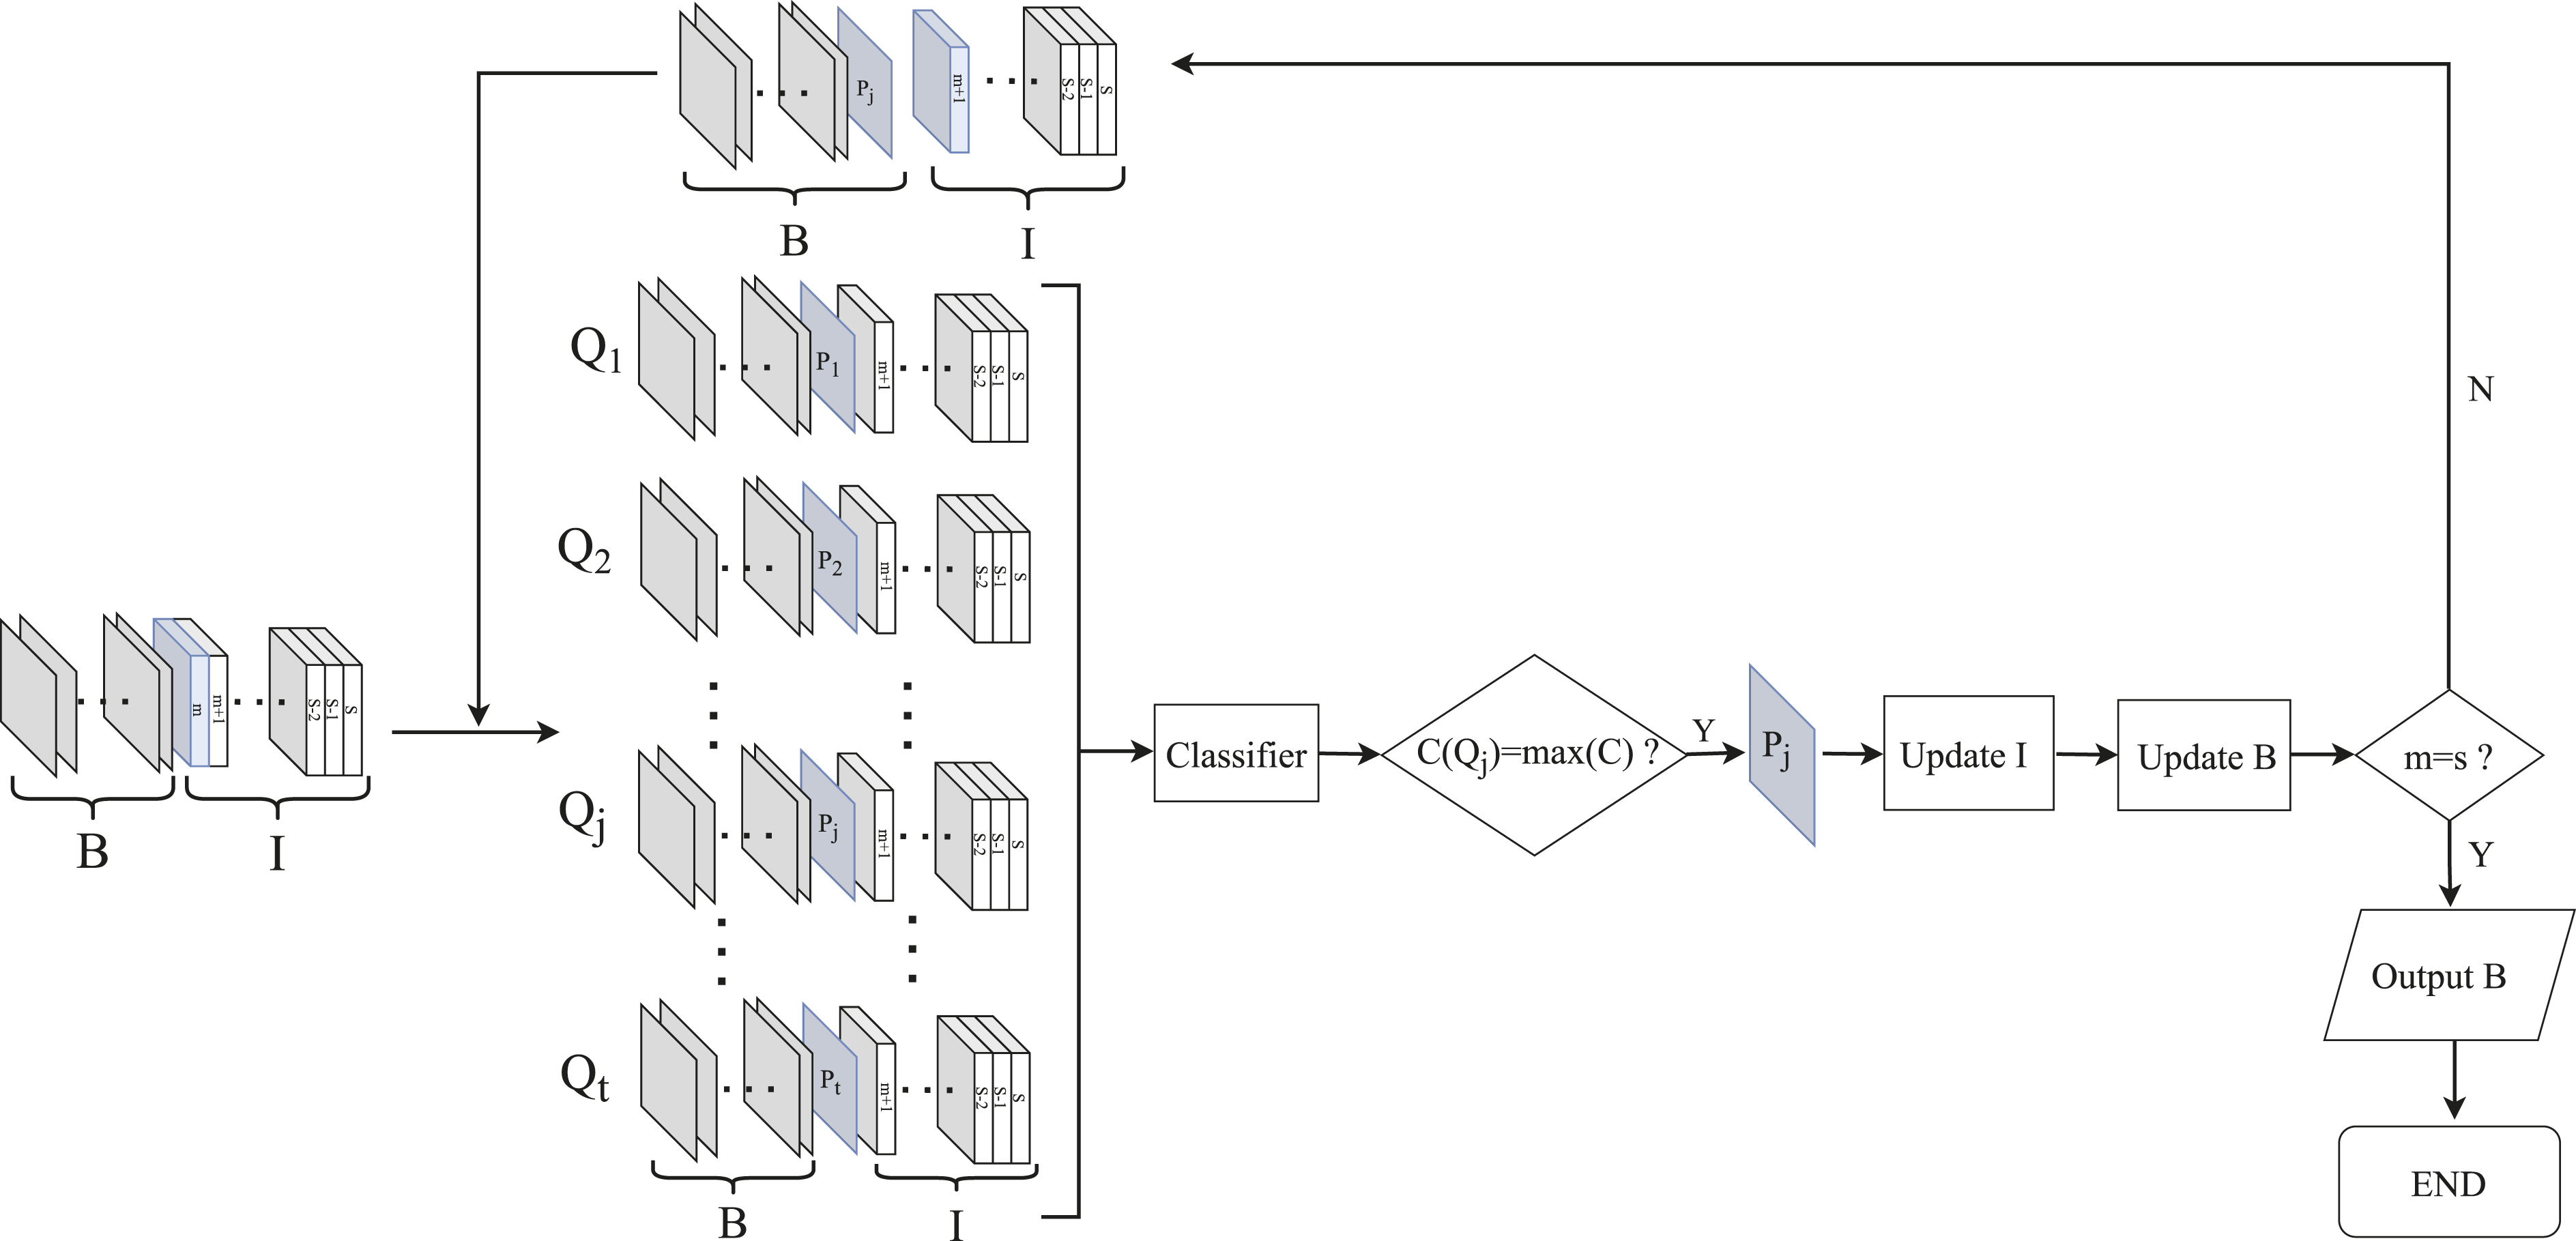
For the full-spectrum bands 
The characteristic band set B is initialized to an empty set.
So,
First step, 
Each subset
Then, update dataset 

Each subset is processed in turn according to the above steps, and the selected characteristic bands are iteratively processed.
After several iterations, the characteristic bands corresponding to the whole dataset
Building classification model
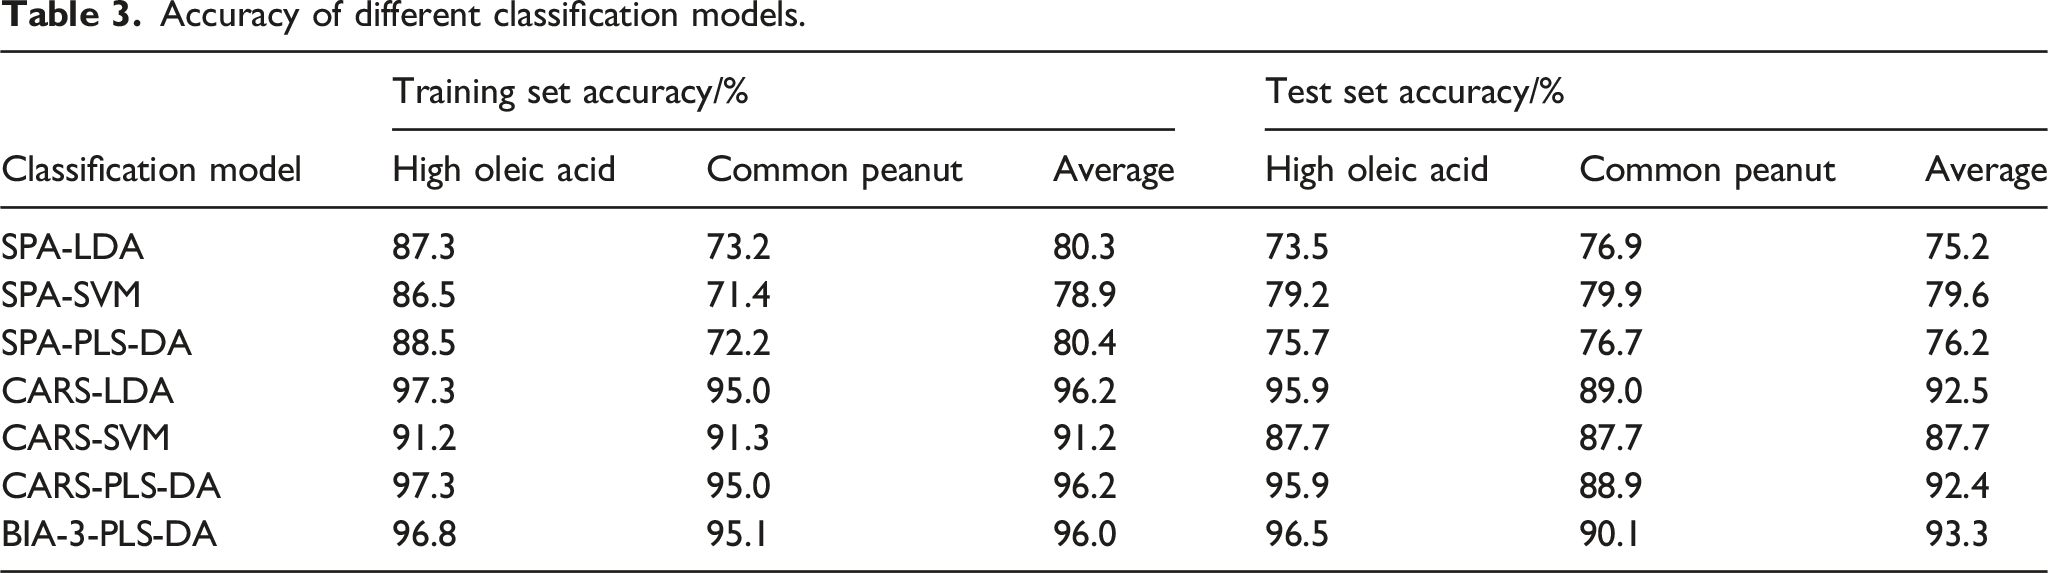
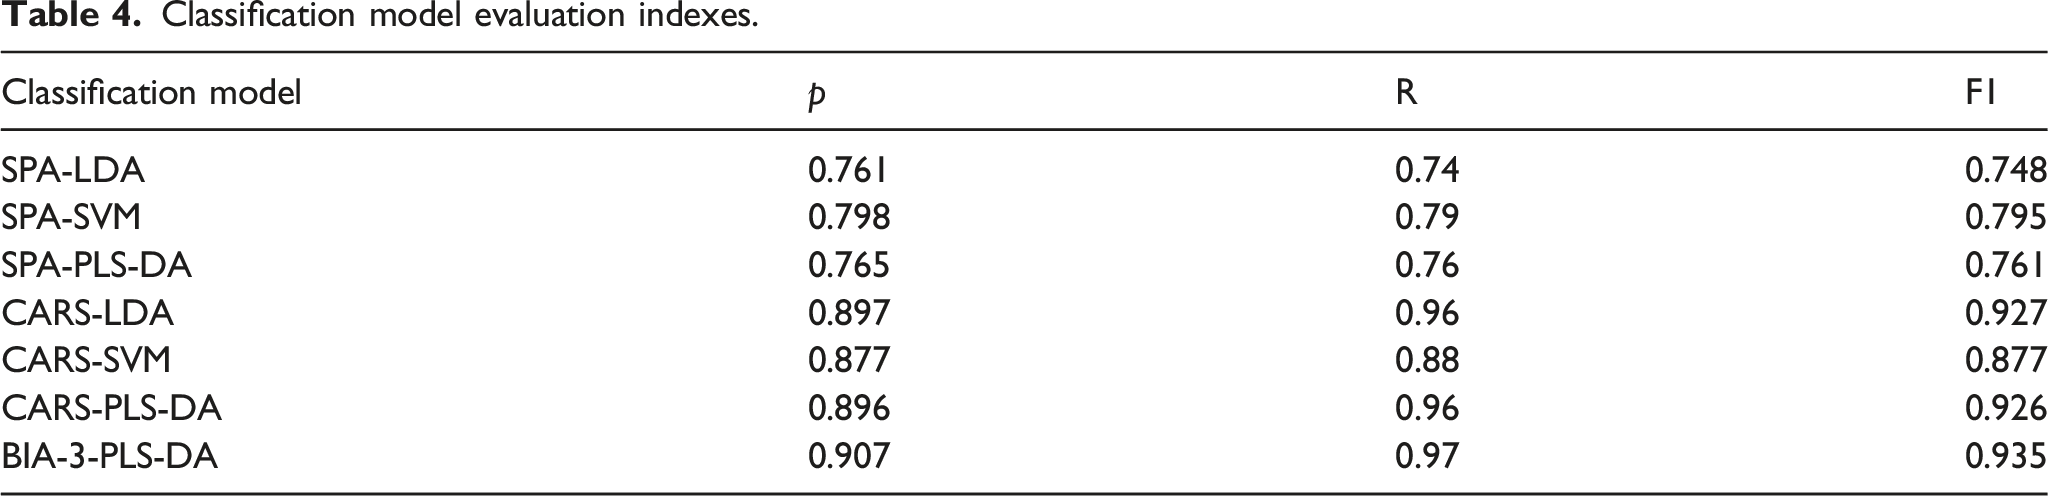
To validate the effectiveness of BIA in selecting characteristic bands, a comparison was made with SPA and CARS. Three classification algorithms, namely linear discriminant analysis (LDA), 40 PLS-DA, 41 and support vector machine (SVM), 42 were employed to establish the classification models. These algorithms are based on different principles, resulting in variations in their classification performance. Based on the classification results, the best-performing classification model was determined.
Model evaluation method
To analyze the effectiveness of classification models more accurately, four evaluation indexes, accuracy (ACC), precision (P), recall (R), and F1 score (F1), are introduced:
Results and discussion
Band iteration algorithm characteristic bands selection
The BIA can select characteristic bands at different band intervals, when it is combined with LDA, PLS-DA and SVM classifiers. The band intervals (the value of t), include 0, 1, 2, 3, 4, 5, 6, 7, 8, 9, and 10. Figure 3 illustrates the experimental results of each classifier using different band numbers in the subset. It can be observed that the classification accuracy initially increases and then decreases for each algorithm. This trend indicates that the selection of characteristic bands by BIA effectively reduces redundancy between adjacent bands, which is conducive to enhancing the classification accuracy. However, if the number of bands in the subset is too large, the band selected by BIA may not fully represent the information of the entire band subset, leading to a loss of spectral data and reduction of accuracy. Among the different band subsets, the combination of PLS-DA with BIA, specifically utilizing three bands (named BIA-3) achieved the highest classification accuracy. Hence, it can be concluded that the optimal number of bands in the subset is 3, the optimal classifier for selecting characteristic bands is PLS-DA, and their combined classification model is termed BIA-3-PLS-DA. Classification accuracy of different classifiers based on different band intervals.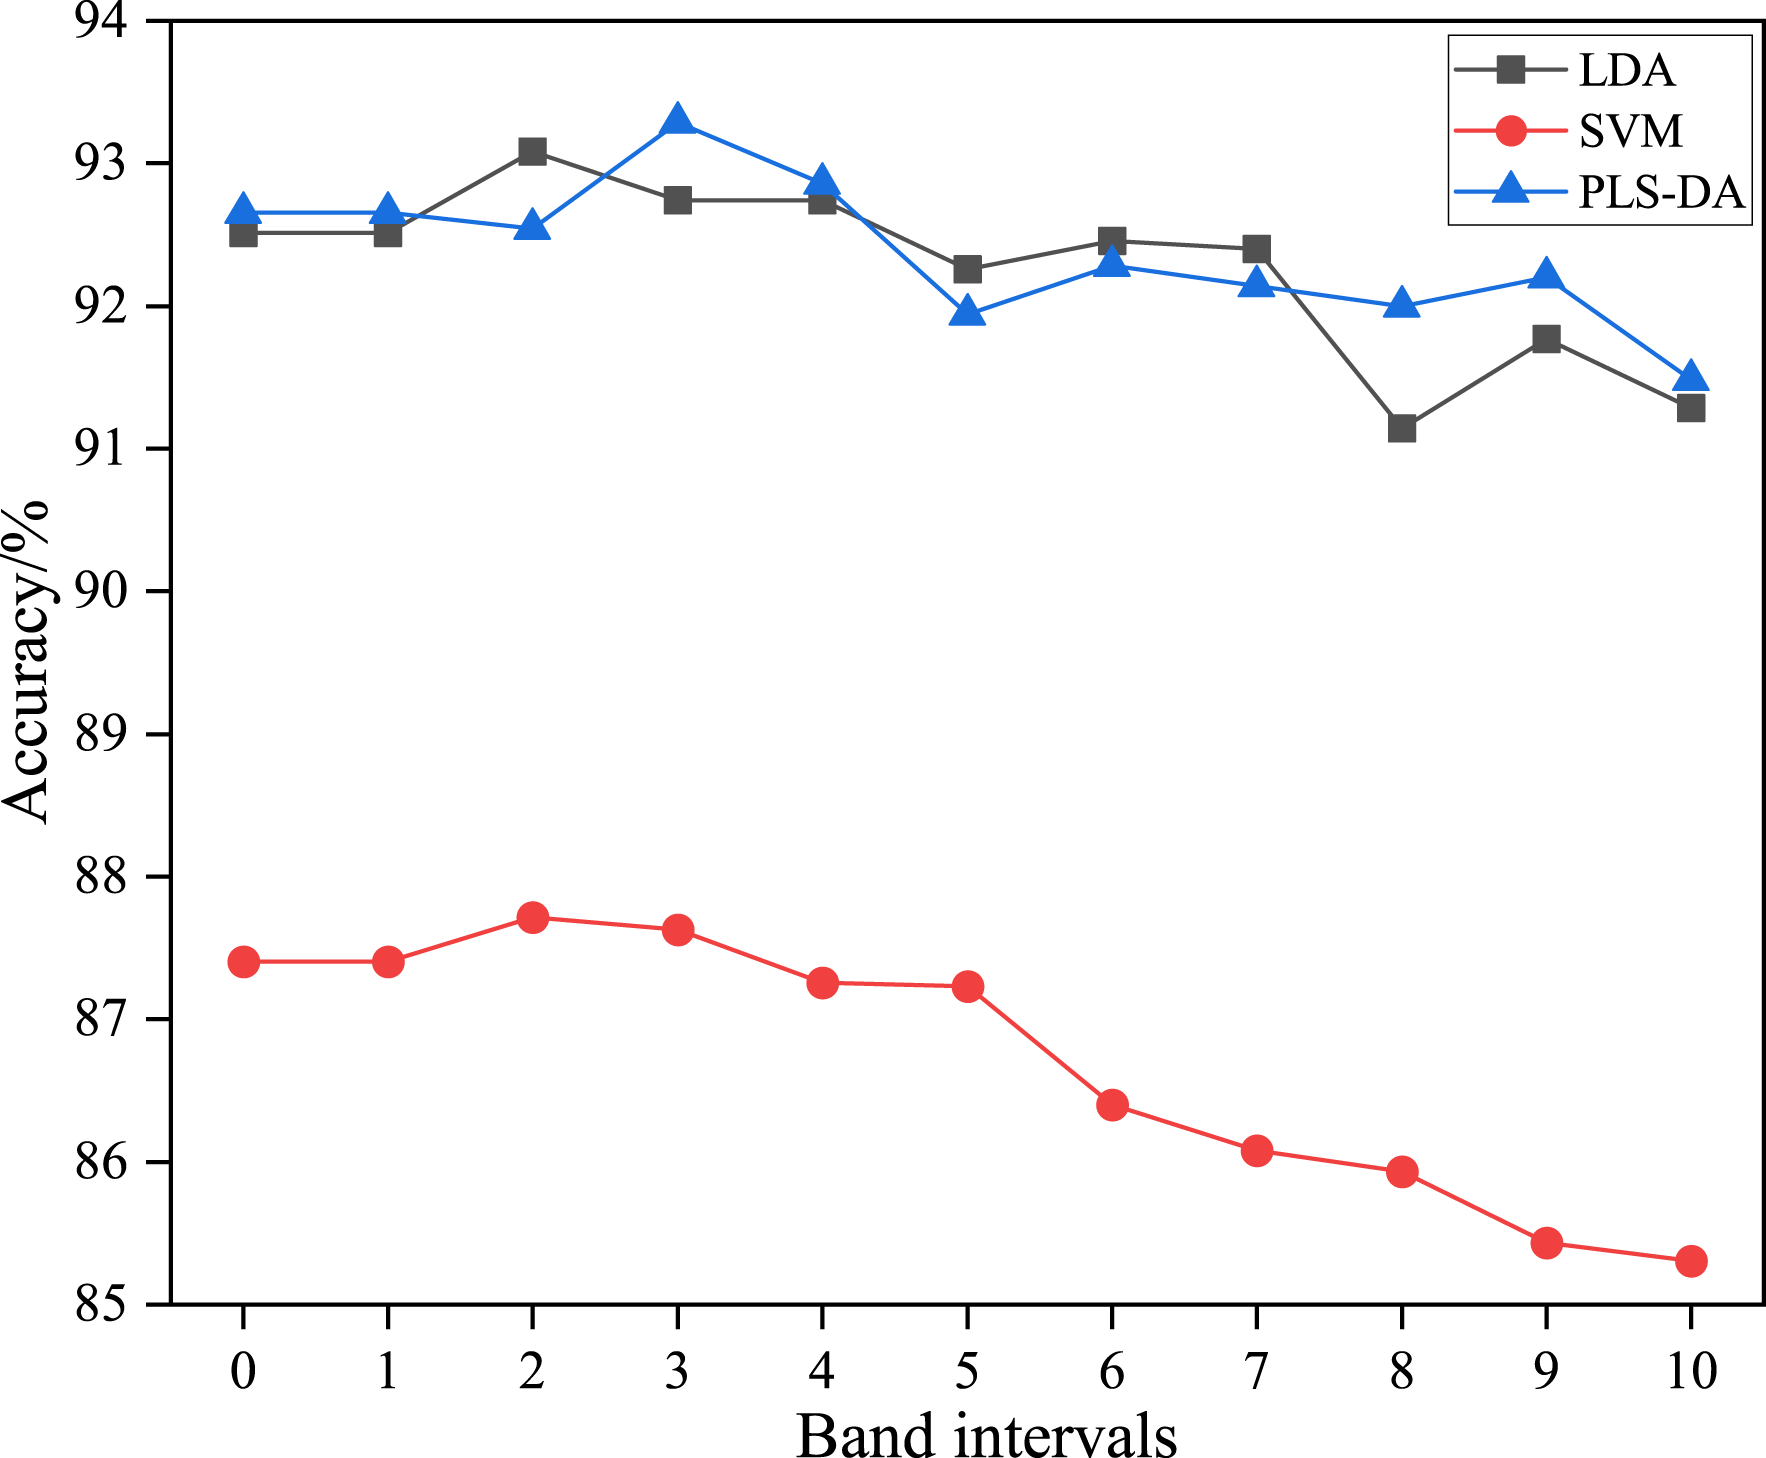
Classification results
Accuracy of different classification models.
Classification model evaluation indexes.
The classification accuracy of single peanuts is a key metric to evaluate the accuracy of the overall model. The average classification results of 50 spectral data points for each peanut were calculated to reflect the classification of peanut individuals. The classification effect of the BIA-3-PLS-DA model for the single peanut in the test set is shown in Figure 4. Only one common peanut was misclassified, with a classification error rate of 1.43%. BIA-3-PLS-DA prediction of the test set (35 high oleic acid and 35 common peanuts).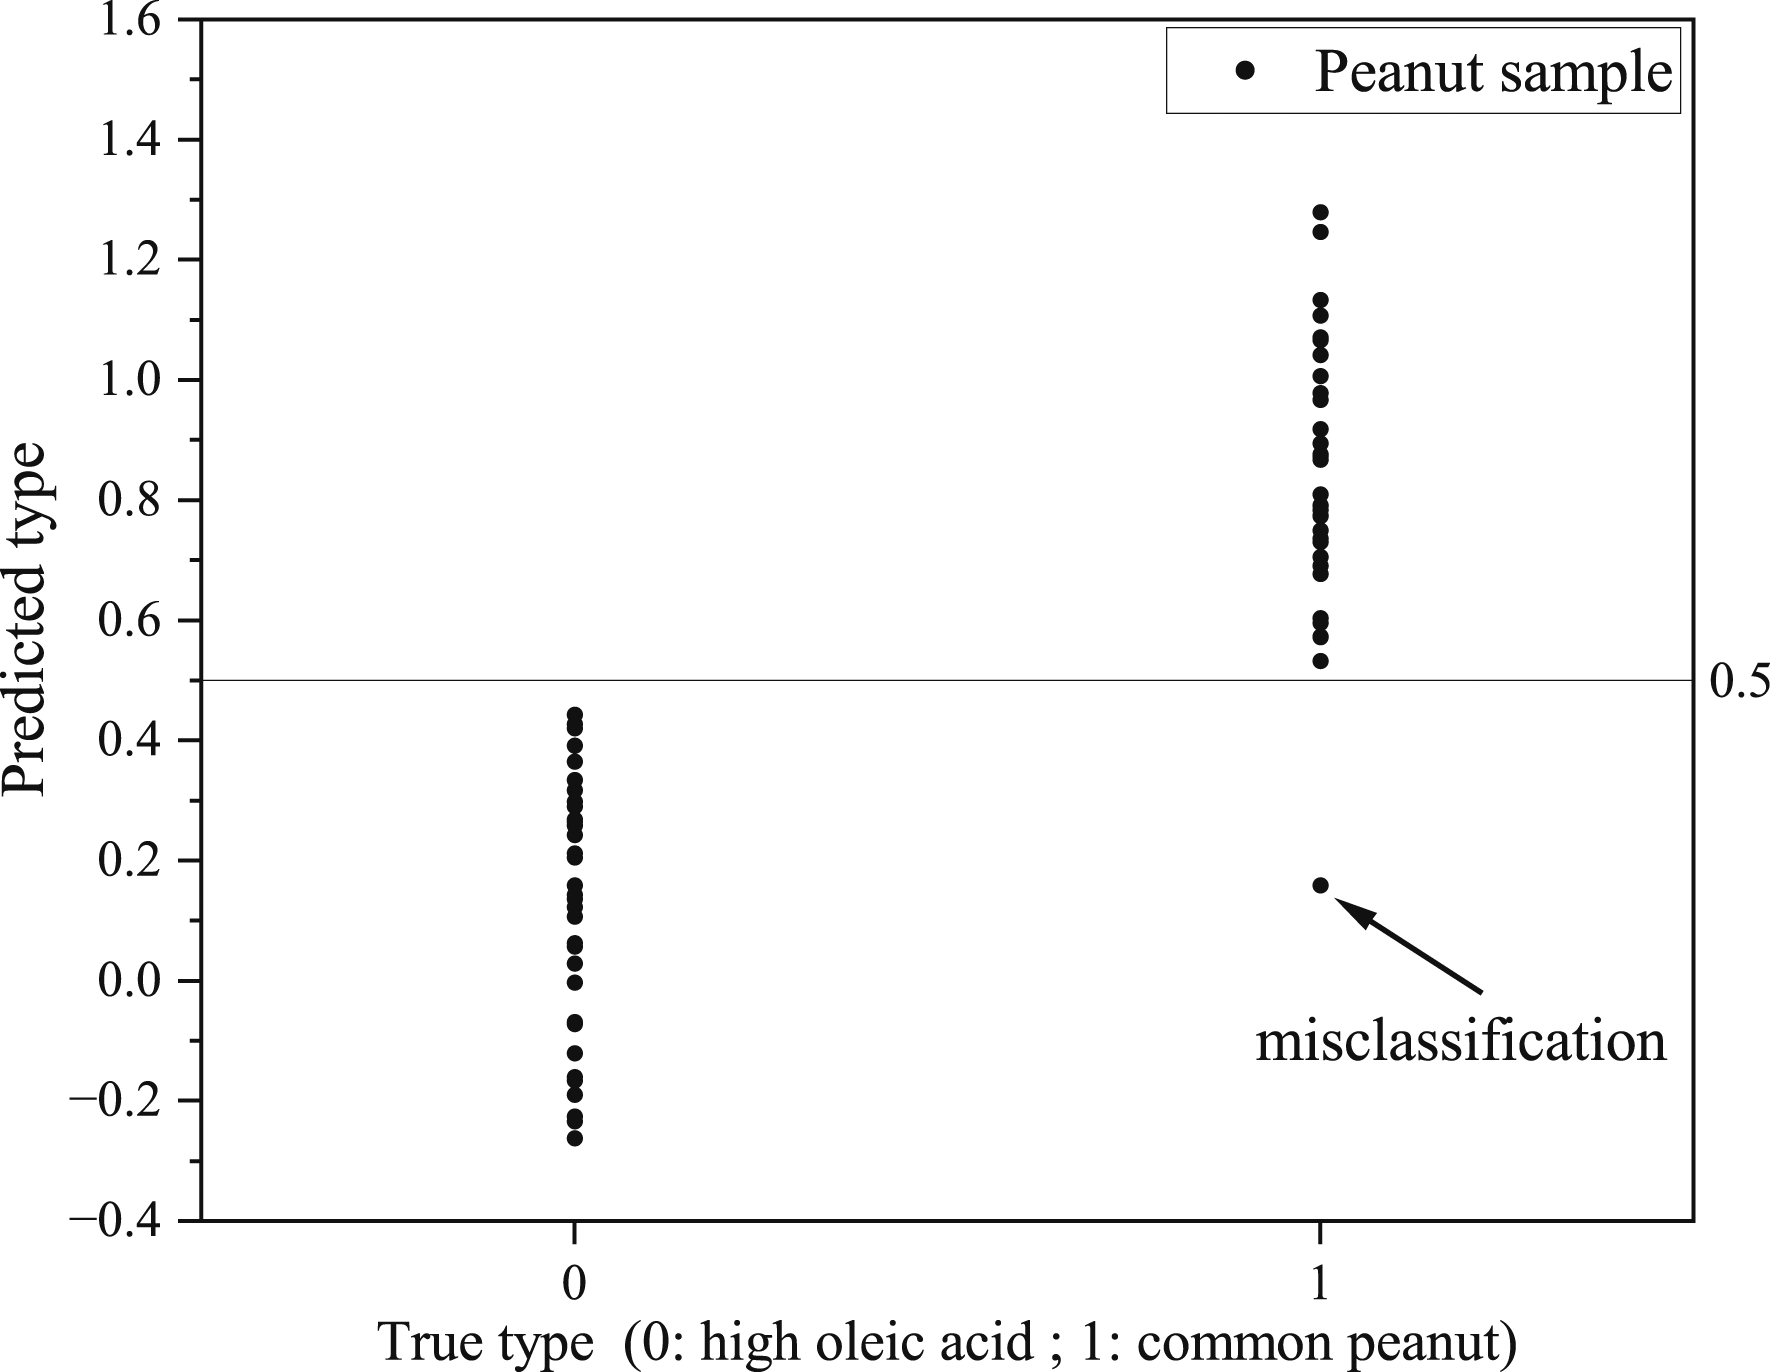
Classification results visualization
Figure 5 shows visualization results of the best model built by the three band selection algorithms. The visualization sample set consists of 45 peanuts and is divided into sample 1 and sample 2. Sample 1 consists of peanut foundation seeds in 2022 (5 high oleic acid and 15 common peanuts), and sample 2 consists of peanut foundation seeds in 2023 (10 high oleic acid and 10 common peanuts). Visualization of classification effect. (White boxes indicate misclassified peanuts).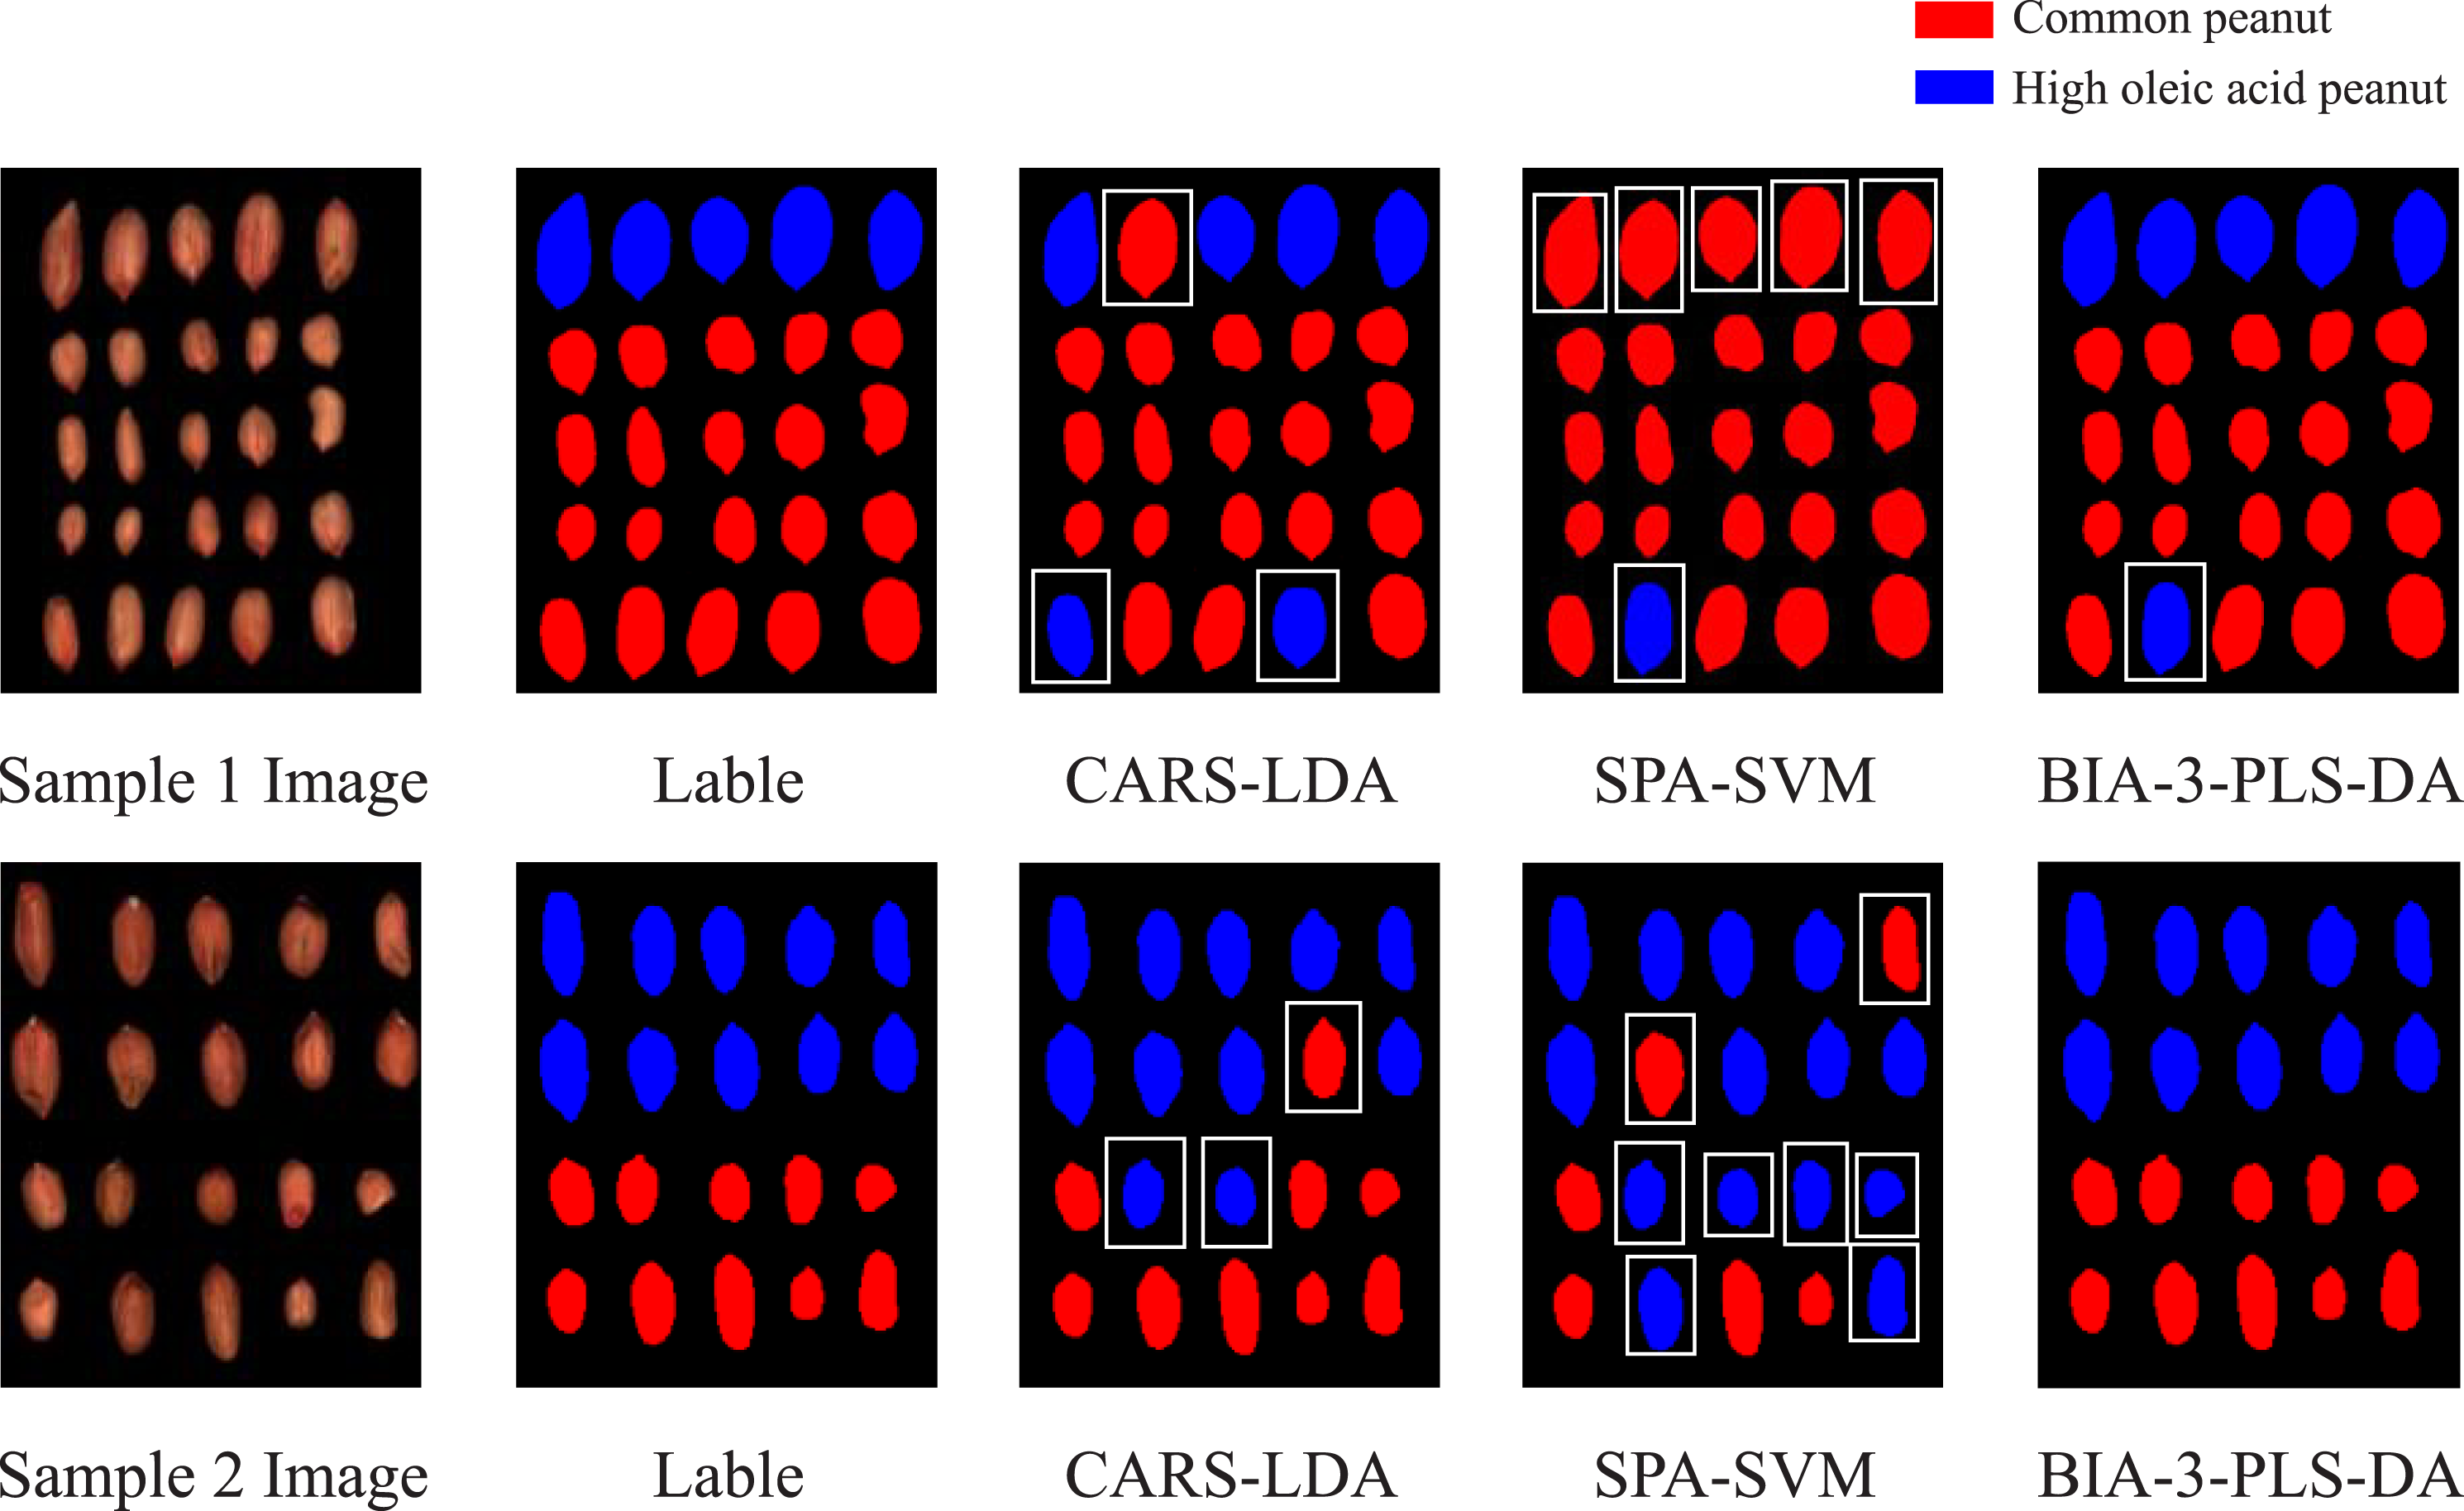
The pixel-wise classification is applied to each peanut, and a high oleic acid peanut is identified based on the pixel number of high oleic acid class in a peanut area. Specifically, if the ratio of pixels classified as high oleic acid is greater than a given threshold (α), the peanut is classified as high oleic acid peanut.43,44 The value of threshold directly influenced the classification outcome, and α is determined to be 0.8 based on empirical values.
In Figure 5, common peanuts are represented by red, high oleic acid peanuts are represented by blue, and misclassified peanuts are indicated by white boxes. The results show that BIA-3-PLS-DA has a superior correct classification rate than other models.
Conclusions
In this study, a novel band selection algorithm was proposed, named BIA, which was employed to select characteristic bands for the classification of high oleic acid peanuts. Compared with two other characteristic band selection algorithms (SPA, CARS), the PLS-DA model based on BIA can obtain the highest accuracy on the test set, and the low misclassification rate of peanut individuals. In conclusion, this study offers an effective band selection method to enhance the efficiency and accuracy of identification of high oleic acid peanuts with spectral images. However, the experiment employed a limited number of sample varieties, which could adversely affect the classification performance of high oleic acid peanuts. It is necessary to increase more numbers and varieties of samples to assess the feasibility of BIA and the stability of the classification model in the further studies.
Footnotes
Declaration of conflicting interests
The author(s) declared no potential conflicts of interest with respect to the research, authorship, and/or publication of this article.
Funding
The author(s) disclosed receipt of the following financial support for the research, authorship, and/or publication of this article: This work was supported by Open Fund of Infrared and Low Temperature Plasma Key Laboratory of Anhui Province [grant number IRKL2023KF04]; Anhui Provincial DOHURD Science Foundation [grant number 2022-YF077]; Hubei Key Laboratory of Optical Information and Pattern Recognition [grant number 202204]; and Doctoral Starting up Foundation of Anhui Jianzhu University [grant number 2020QDZ05, 2022QDZ03].