
Abstract
With the continuously growing world population in the 21st century, the agri-food industry is in dire need of adopting rapid, eco-friendly, and reliable technologies to improve the quantity, quality, and safety of agri-food products to fulfill the world's future food needs. Hyperspectral imaging (HSI), a technique to glean a sample's spectral and spatial information, is an emerging non-destructive technique that can characterize the quality parameters of agri-food products such as Fusarium damage. Despite its vast potential, HSI systems suffer from enormous data sizes, requiring high computational time and power. One potential solution to overcome the aforementioned challenge is to reduce the data size by removing redundant information. However, detecting small optimum features from a large dataset is not trivial. To this end, an exploratory novel HSI data reduction and analysis technique was investigated and validated to identify Fusarium damage in wheat kernels. Wheat samples at three moisture contents (19, 27, and 35%, wet basis) and seven infection levels (ranging from 0 to 56 days after infection) were imaged at 256 equally spaced wavelengths from 820 to 1666 nm. Firstly, complete HSI data was utilized to successfully characterize sound and Fusarium-damaged wheat kernels using independent component analysis (ICA) algorithm. Then, a genetic algorithm optimization approach was used to reduce the data to ten wavelengths for ICA-based analysis. This data reduction approach reduced the computation time to approximately 1.31% of the original time taken for analyzing the full HSI data without compromising the performance of the system. This preliminary study suggests that such wavelength tailoring could reduce the complexity and price of the imaging hardware, e.g., the use of inexpensive non-tunable filters, and less expensive computational hardware, thereby enabling fast and affordable real-time exploration and sorting of grains. This study, while exploratory, fosters advancements in HSI data processing and identifies certain limitations that open new avenues for future research.
Introduction
Over the past decade, non-destructive techniques such as imaging and spectroscopy have gained growing interest in monitoring agri-products quality.1–5 More recently, hyperspectral imaging (HSI), a technique that merges the features of conventional imaging and spectroscopy by providing simultaneous spectral and spatial information of samples, has been widely researched for assessing defects and diseases in grains.6–10 In this regard, scholars have explored the capability of HSI for detecting Fusarium damage (one of the prominent causes of loss of grain yield and quality) in wheat. For instance, Delwiche et al. 11 identified Fusarium-damaged kernels (FDKs) in wheat using visible-near infrared (VIS-NIR) HSI (400–1700 nm) and linear discriminant analysis (LDA). Shahin and Symons 12 detected FDKs in Canadian Western Red Spring (CWRS) wheat utilizing VIS-NIR HSI (400–1000 nm) with a combination of LDA and principal components analysis (PCA) techniques. Singh et al. 13 identified sound and fungi-infected wheat kernels using short-wavelength NIR HSI (700–1100 nm) deploying LDA, quadratic discriminant analysis (QDA), and Mahalanobis discriminant analysis. Serranti et al. 14 utilized NIR HSI (1000–1700 nm) with PCA, partial least squares discriminant analysis (PLS-DA), and interval PLS-DA to detect FDKs in wheat. Barbedo et al. 15 employed VIS-NIR HSI (528–1785 nm) to identify scab in wheat kernels using a new algorithm/measure (Fusarium index). Delwiche et al. 16 discriminated between healthy wheat and FDKs using NIR HSI (938–1654 nm) with LDA. Nadimi et al. 7 used NIR HSI (960–1700 nm) together with k-nearest neighbour algorithms to detect FDKs in CWRS wheat.
The above-mentioned works confirm the capability of VIS and NIR HSI-based techniques for FDK detection in wheat kernels. However, they also provide evidence that, (1) the performance of HSI systems heavily depends on the data analysis algorithms, and (2) the data computation of HSI systems suffers from enormous data size. In the latter case, the presence of redundant data complicates data analysis and increases the required computational time and power for analysis and hence the overall system cost. Owing to these reasons, the exploration of novel mathematical algorithms that are computationally efficient has become an area of important research in analyzing HSI data. To this end, the objective of this exploratory study was to develop a novel data reduction and analysis algorithm to identify Fusarium damage in wheat using HSI data. A genetic algorithm optimization tool was implemented to select a subset of the HSI data for Fusarium detection without comprising performance. An independent component analysis (ICA) algorithm was used to examine pixels of sound and Fusarium-damaged wheat kernels once with full data and then using the proposed genetic algorithm.
The proposed approach in analyzing HSI data for assessing defects in agri-food commodities has not been reported in the literature. Therefore, it can open a promising pathway toward resolving the HSI data size challenge and contribute to integrating this state-of-the-art technology into the agriculture industry.
Materials and methods
To develop a new data reduction and analysis approach for detecting Fusarium damage in wheat, samples with and without Fusarium damage were prepared (Sample preparation section). Then HSI system was used to acquire data (Hyperspectral data acquisition section). Thereafter, an ICA classifier (Independent component analysis Hyperspectral data acquisition section) was utilized to distinguish pixels of sound and Fusarium-damaged wheat kernels under two different scenarios: once over the entire bands and then over the reduced number of selected bands (identifiedusing the Genetic Algorithm (Dimensionality reduction using Genetic Algorithm optimization section). In either case, the contrasts of HSI images were enhanced to improve the disparity between the independent components for ICA analysis (Image contrast enhancement section).
Sample preparation
The CWRS wheat samples selected for this study were obtained from the Industry Services Division of the Canadian Grain Commission. The initial moisture content of samples varied between 12 and 14% (wet basis). The samples were sterilized using a 1% sodium hypochlorite solution before being rinsed with distilled water. The grains were then allowed to dry under a fume hood before being conditioned through the addition of calculated quantities of distilled water based on equation (1) to attain the pre-determined moisture levels of 19, 27, and 35%.
After conditioning, the samples were stored in a refrigerator at 5°C for 7 days to allow the moisture to equilibrate. For each moisture level, conditioned samples were split into two portions: a control group and FDKs.
A spore suspension of Fusarium graminearum, the wildtype strain Q6–11, was prepared at the Department of Plant Science at the University of Manitoba, MB, Canada. An initial spore suspension count was carried out using a hemocytometer and adjusted to a concentration of 105 spores mL-1. The artificial infection was conducted in a fume hood by misting the spore suspension on sterile conditioned wheat samples and mixing them thoroughly. Samples were then stored in an environmental chamber at 25 ± 1°C to provide a conducive environment for the growth of the Fusarium. Figure 1 shows infected kernels with different moisture contents on the 14th day and the 56th day after infection. Fusarium infected kernels after the 14th day with (a) 19%, (b) 27% and (c) 35% moisture contents. Fusarium infected kernels after the 56th day with moisture contents of (d) 19%, (e) 27% and (f) 35%.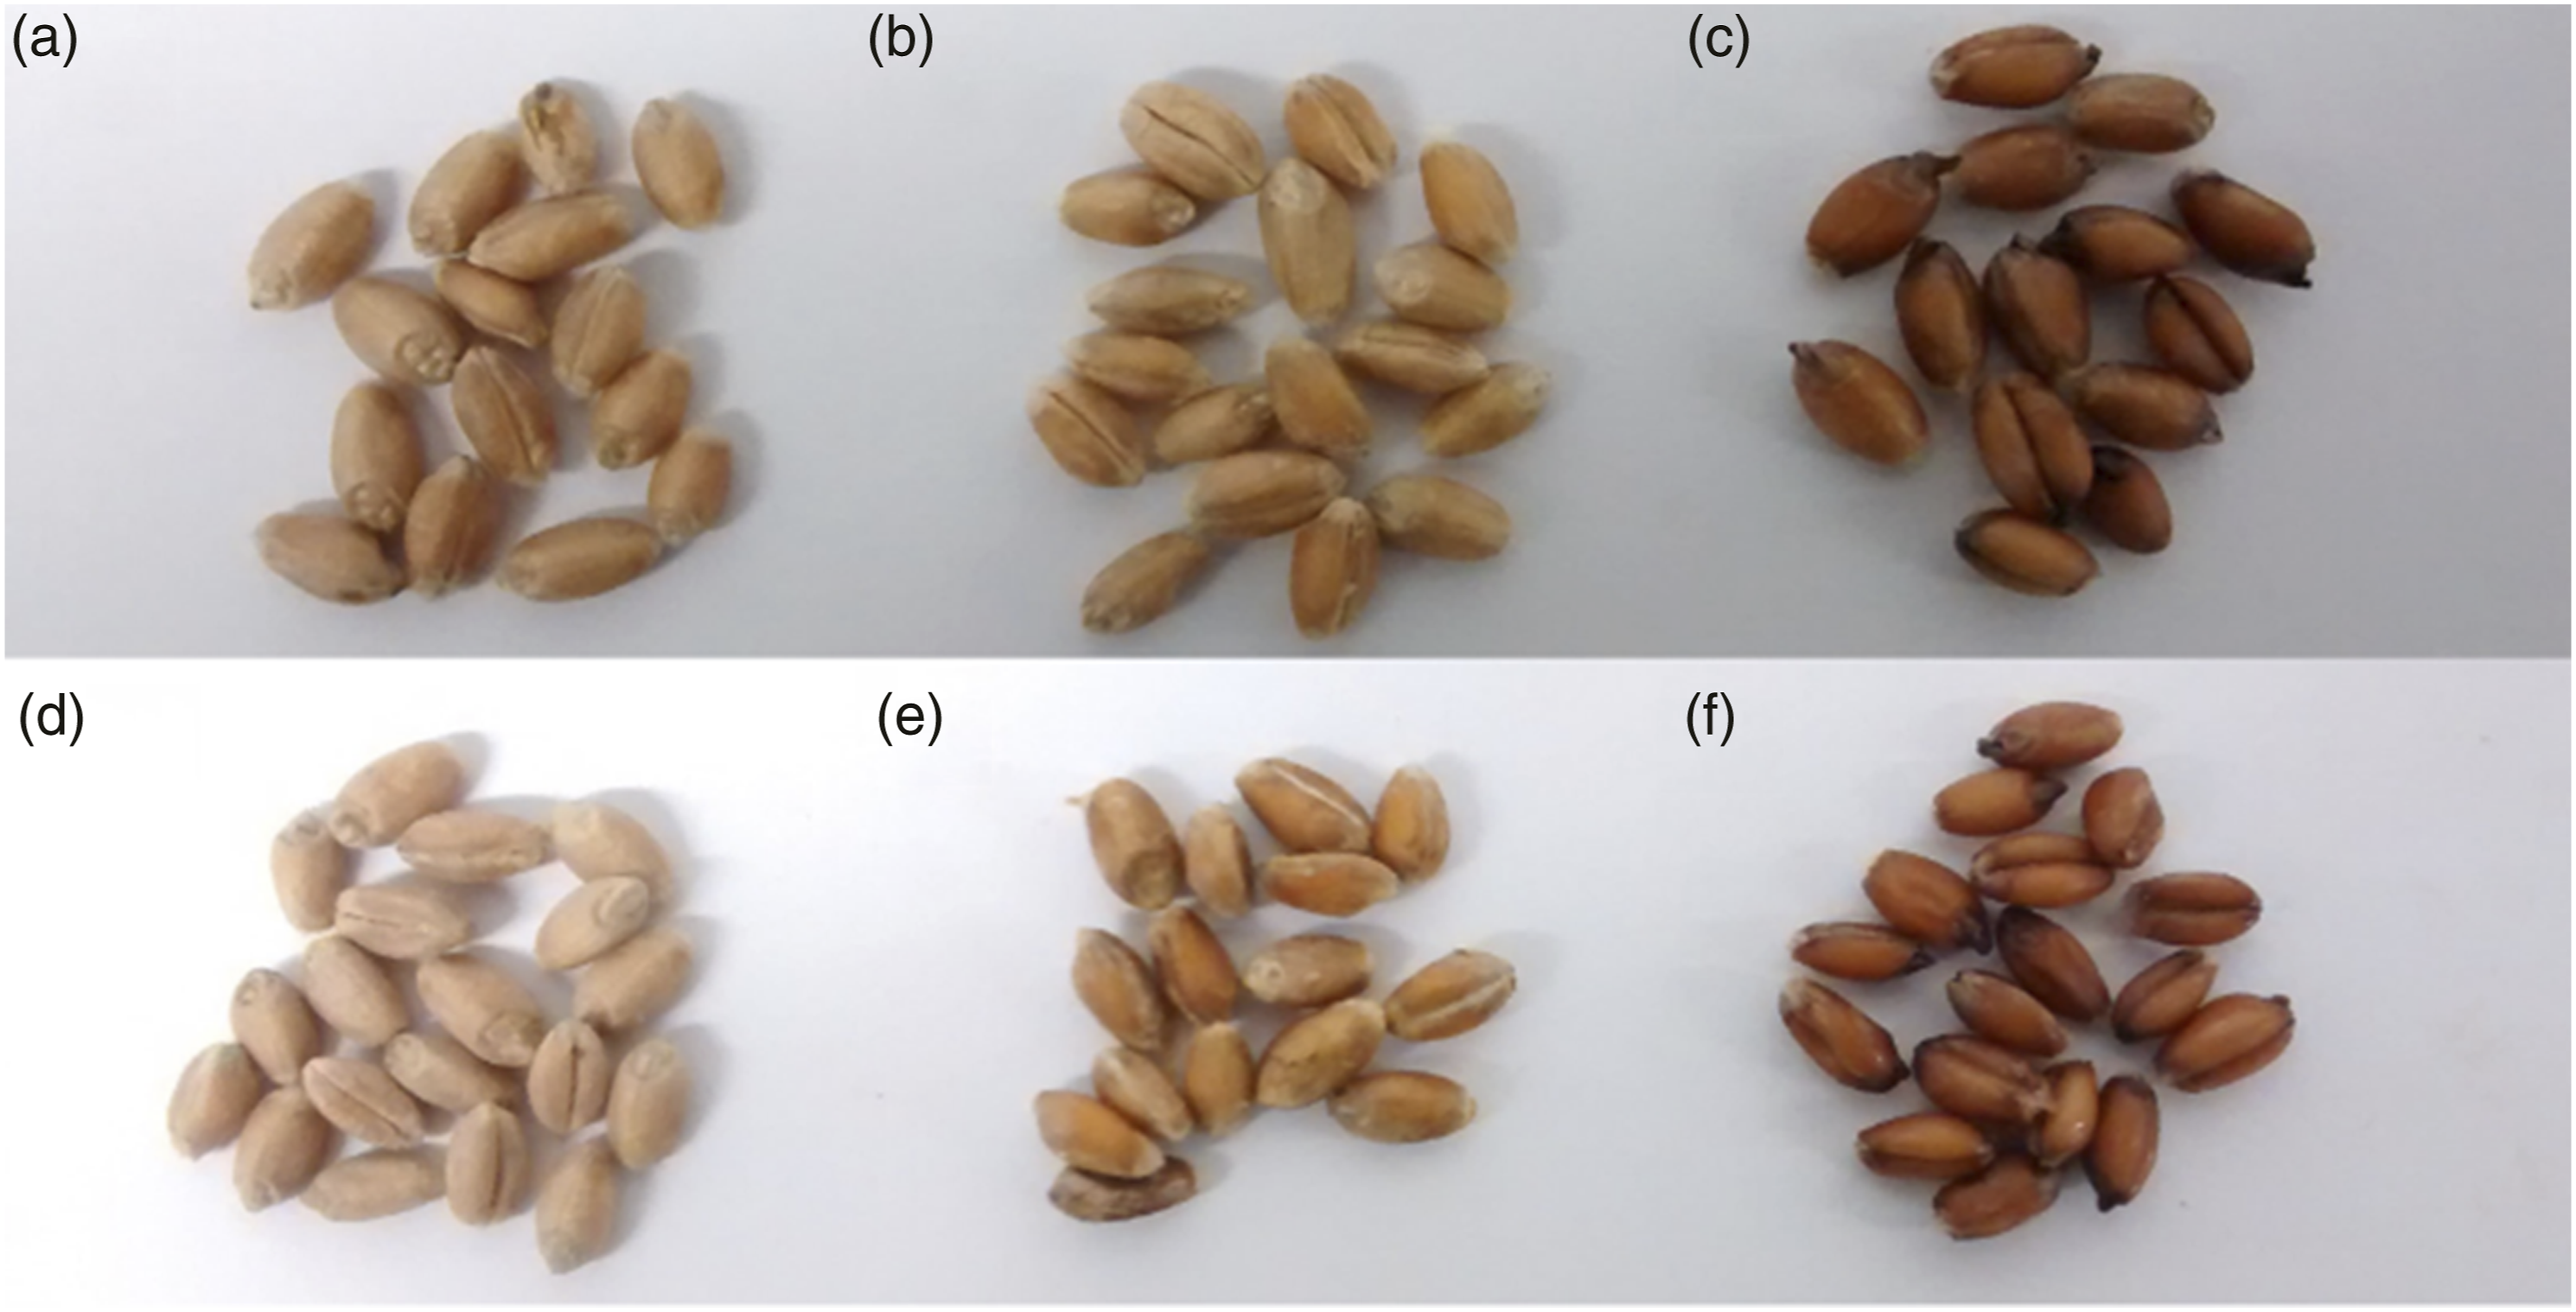
The experiments were carried out with grains from the 0th, 14th, 21st, 28th, 35th, 42nd and 56th days after manual infection. All samples were randomly selected from the relevant groups. Sound grains were kept in the same environment as the FDKs (the same controlled temperature and humidity) and were placed alongside them in a sample holder containing nine grains – five controls and four FDKs, using a 3 × 3 column arrangement. The control samples were placed at the edges and the center of the matrix, while FDKs formed a diamond pattern at the remaining positions, as shown in Figure 2(a). This grain distribution was repeated for different moisture levels and each infection level. Overall, 189 samples were tested (9 (3 × 3 column arrangement of wheat kernels) (a) Wheat grains with 27% moisture content, comprising both sound and Fusarium-damaged kernels (FDK) 56 days post-infection, evaluated by NIR hyperspectral imaging, where FDKs are highlighted. (b) The 125th independent component when the whole hyperspectral cube is used is displayed in Matlab’s ‘jet’ colormap, where FDKs (blended with the background) are separated from healthy kernels. (c) The second independent component, where only ten wavelengths are used. Again, FDKs (blended with the background) are separated from healthy kernels.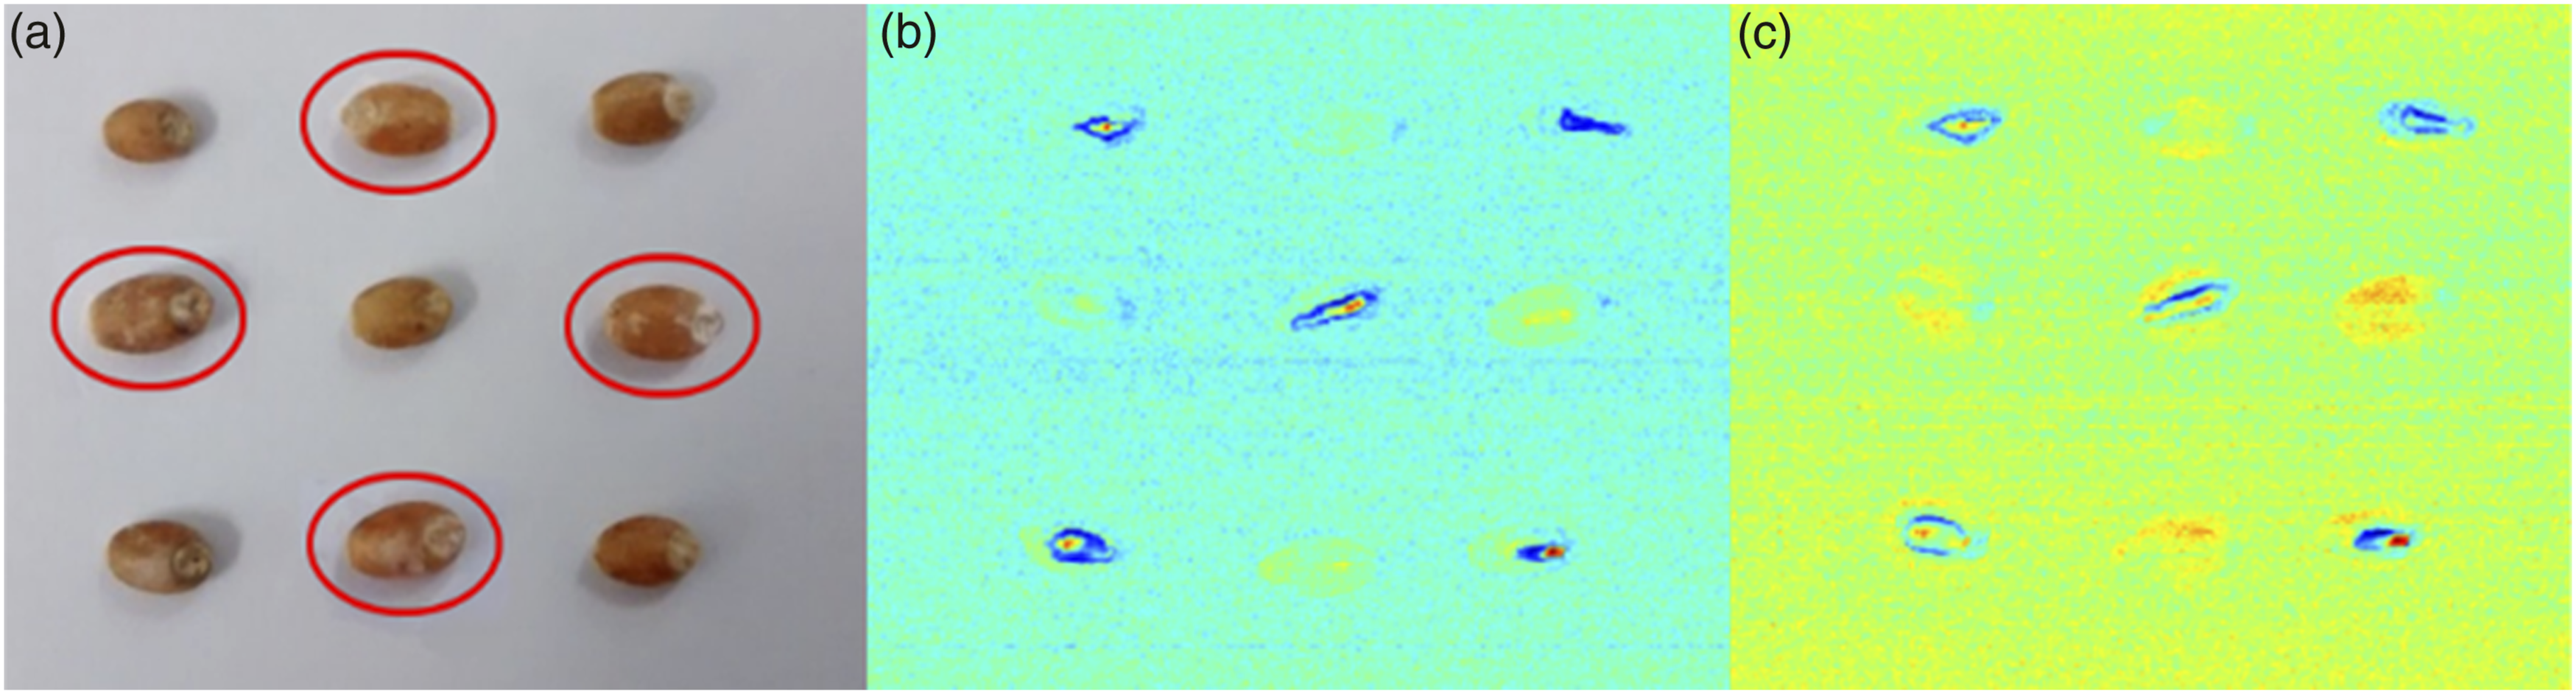
Hyperspectral data acquisition
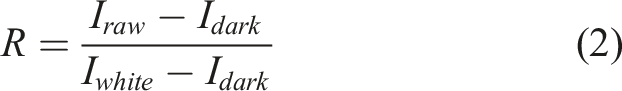
The NIR hyperspectral imaging system used in this study was an InGaAs camera (Xenics Xeva 1.7-320), a spectrometer (Specim Imspector N17E) and a spectrometer lens (Specim S22.5-f/2.0). This system was able to acquire 256 wavelengths between 820 and 1666 nm, resulting in increments of 3.3 nm, and an approximate spatial resolution of 0.15 mm in the first spatial dimension, due to the field of view of 5 cm. A translation stage mounted under the sample holder scanned a 5 cm path in 441 steps or 0.1 mm of spatial resolution in the second spatial dimension. The output from a halogen lamp was guided to the sample through an optical fibre bundle. A warm-up period of 2 hours was allowed before any measurements were taken. For normalization and correction procedures, white and dark reference hyperspectral cubes were collected. For the white reference hyperspectral cube, a Spectralon panel with 99% reflection was used in place of the sample, while the dark reference hyperspectral cube was recorded by closing the lens cap. The reflectance was calculated by the equation,
Independent component analysis
Hyperspectral imaging spectral unmixing
Spectral unmixing can be described as the procedure that segregates spectral pixels of the HSI data cube into its pure spectral signatures (also known as endmembers) and a set of their fractional ratios (abundances). Typically, per pixel, there will be a set of endmembers and abundances. Hence, the combination of pure spectral constituents (endmembers) can be used to analyze the observed spectrum of a pixel. In this regard, a pure pixel can be identified as one that contains only one constituent material, while a mixed pixel consists of more than one constituent material. To conduct unmixing, a mathematical model is required to identify/relate the endmembers and abundances to the spectra pixels. Herein, the ICA approach was used as the unmixing tool.
Background on independent component analysis
Independent component analysis is a technique that can be used to separate a mixture of independent signals into its individual signal components. ICA assumes that a set of separate independent signals

The objective of ICA is to find all the signals

Implementation of independent component analysis
In this study, the ICA routine utilized is the Fast ICA algorithm as it has a faster convergence time than traditional gradient-based methods.
17
Also, the symmetric orthogonalization method was used, where vectors

Dimensionality reduction using Genetic Algorithm optimization
Background
The importance of optimum band selection in HSI data analysis has been discussed in the Introduction section. Genetic algorithm is one of the techniques that has the potential to identify optimum bands. Using an information-theory-based criterion as the fitness function, genetic algorithm could determine sub-optimum combinations of wavelengths that maximize the entropy of the corresponding subset of the hyperspectral data cube.18,19
Entropy is a measure of information included in the data obtained using the selected bands. A thorough overview of the principles and theory of entropy calculations can be found elsewhere.
20
As the discretization of signals into

Genetic algorithm optimization
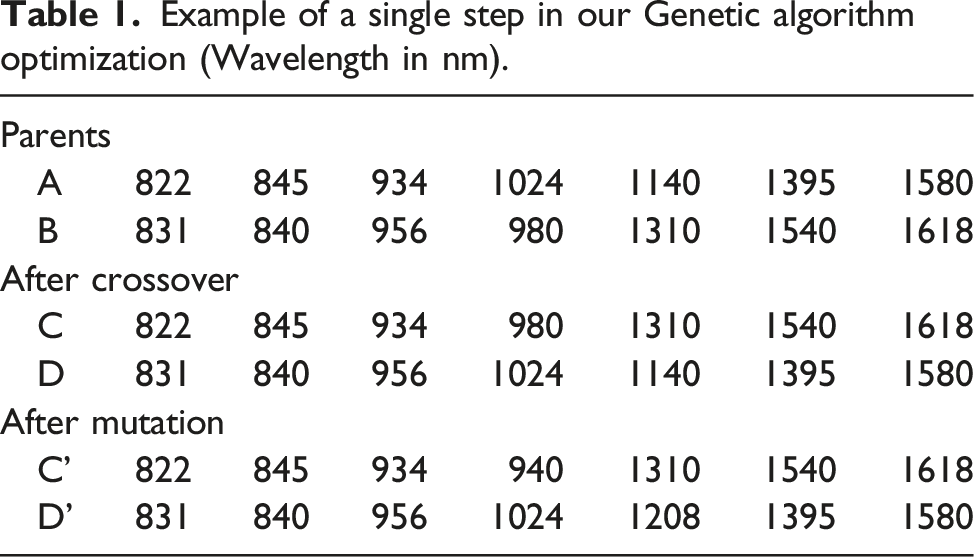
Example of a single step in our Genetic algorithm optimization (Wavelength in nm).
Genetic algorithm-based band selection
Designating entropy as the objective (fitness) function, a genetic algorithm was used to search for the best combination of a desired number of wavelengths without considering all possible cases. This is an instance of a broader technique known as stochastic optimization. If the algorithm is appropriately applied, while there is no guarantee of detecting the global optimum, at least a number of critical near-optimal solutions could be identified.
From the initial 256 wavelengths, a set of ten wavelengths was selected according to the entropy of the hyperspectral data cube. In the first generation, 40 groups of 10 different wavelengths (parents) were randomly chosen from all the available wavelengths, and their entropy was calculated. The 20 offspring with the highest entropy were combined into 40 pairs and subject to crossover. From the offspring resulting from the crossover step, 40 vectors were randomly selected to undergo mutation. This evolution algorithm iterated until convergence occurred, and the set with the highest entropy was sent to the ICA routine.
Image contrast enhancement
An adaptive switching median (ASWM) filter can be used to improve the contrast between the independent components. The filtering procedure confirms removing noises without affecting the grain pixels. A basic switching median filter determines if a pixel is contaminated by impulse noise. To do so, the absolute difference between the median value in the pixels’ neighbourhood and the value of the current pixel is measured and compared to a threshold. This threshold could be based on a priori statistics of the data, as the average difference between the median and the center value of the window. However, because the threshold would be the same throughout the image, this median filter affects both noise and noise-free pixels.
A different approach is to use local statistics to adapt the threshold. There is no need for a priori statistics since the threshold is locally calculated for image pixels. The ASWM filter uses the standard deviation for the pixels in the neighbourhood window to adjust the threshold. While uniform regions have small standard deviations, textured or edge regions will have high standard deviations. This adaptability can facilitate preserving image details.
A thorough overview of the principles and operations of ASWM filters can be found elsewhere.22–25 In this work, an ASWM filter was used to enhance contrast and remove noise from the ICA-generated independent component images. The implementation of the ASWM filter was based on the work of Akkoul et al.
26
For the median filter statistics calculation, a
Results
Considering the study was aimed at evaluating the capability of the genetic algorithm to reduce the HSI data size without comprising the performance, the results are presented in two subsections, once using the complete data and then using the reduced data set.
Detection results using all available bands
Figure 2(a) shows an image of sound and FDKs, circled in red, and placed in the pattern described in Sample preparation section. Although the Fusarium suspension was mannully applied over all grains, not all of them developed superficial mould. This is likely due to either a small progression of the fungi or asymptomatic infection.
Independent component images displayed several combinations when the entire hyperspectral cube was used in the ICA algorithm. While some of those images were mainly composed of noise, where no grains were displayed (i.e., just background), others displayed only sound grains, and other groups showed only infected grains. However, the majority of independent component images displayed all the grains within the scene. This behaviour is reasonable since all grains share certain common characteristics. The best discrimination between pixels of healthy kernels and FDKs was achieved under the 125th independent component. Figure 2(b) displays wheat grains under the 125th independent component. Herein, all of the 256 bands were included in the analysis. In Figure 2(b), the sound kernels are observable while FDKs are hidden. From all the independent components calculated, 20 exhibited a noticeable separation between sound and infected grains.
To identify the infected grains using ICA, it is necessary to have at least one representative reference grain from each class of healthy and diseased seeds. When the independent components are generated, if a reference grain is displayed, all the grains displayed in that image are considered to belong to the same class as the reference grain. However, this reference could be emulated through a calibration process, which means that grain does not need to be physically present in the analyzed batch. Pixels containing the reference spectra are concatenated to the acquired hyperspectral cube, thereby emulating the presence of the grain. As seen in Figure 2(b), not all the pixels from the sample are recovered after transformation, that is, some of the pixels that belong to the grains are mixed with the background. The same behaviour occurs for the independent components that exhibit only healthy grains, as well as those displaying FDKs. Mainly, the omitted pixels do not reflect back as much light as those highlighted pixels, even though they may represent infected grains. When the independent component is plotted using a normalized colormap, those pixels do not have enough contrast and merge with the background.
Detection results using optimum bands
The ten wavelengths obtained using genetic algorithm optimization (nm).
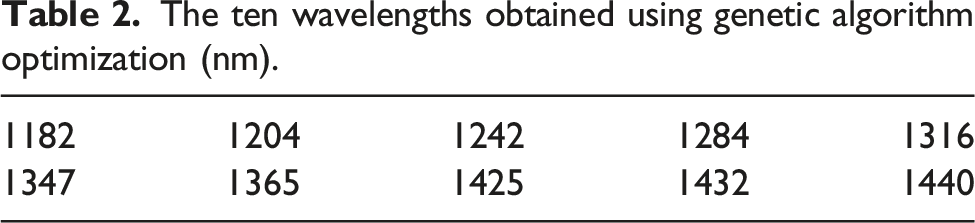
One should note that the base intensity level for this independent component image is different from the one shown in Figure 2(b), as the background has a different colour when displayed using MATLAB’s ‘jet’ colormap. The calculated entropy for this subset was 5.73 bits, compared to the entropy of the original hyperspectral cube of 6.70 bits.
This procedure was repeated with six different hyperspectral cubes composed of different grains that were arranged in the sample holder using the same pattern. Similar performance was achieved in all cases.
As a comparison between full and reduced HSI data, the former and latter took approximately 61 and 0.8 s to calculate independent components. This means that the computational time of applying the ICA algorithm is reduced to approximately 1.31% of the original time taken for analyzing the full HSI data, without compromising the performance.
Discussion
To distinguish between sound samples of CWRS wheat and those infected with Fusarium, ICA was applied to the NIR hyperspectral data cubes. The wheat samples had moisture contents of 19, 27, and 35%, and the infected samples had seven levels of infection ranging from 0 days to 56 days after manual Fusarium infection. Because the growth rate of Fusarium depends on the moisture of the grain, the system’s sensitivity is influenced by this parameter. 27 Samples with 27 and 35% moisture enabled the separation of sound and FDK samples on the 14th day after infection, whereas grains with 19% moisture content could only be separated after the 35th day.
The proposed technique could successfully separate the pixels of sound kernels from Fusarium-damaged ones using the complete hyperspectral data (820 to 1666 nm) through ICA. This study established that images obtained using only ten specific wavelengths would be sufficient to successfully separate these classes in approximately 1.31% of the original computational time. The required computational time and resources saved by using the identified wavelengths are desirable for the real-time industrial application of our Fusarium damage detection technique.
It is important to note that the goal of the present work was not to perform a pure classification task but to demonstrate a new approach to identifying Fusarium damage in wheat. It should also be noted that except for applying the ASWM filter for noise removal (see Image contrast enhancement section), no other spatial data analysis was utilized for examining pixel spectra. Nevertheless, the results of the proposed ICA-based approach showed reliable performance by differentiating between the majority of pixels of healthy and FDKs under both full and reduced HSI data.
It is worth mentioning that unlike the majority of HSI-based FDK analyses,7,16 there are no mean spectra of regions of interest (ROIs) in our analysis, as the spatial dependence between pixels in desired ROIs was not considered. Indeed, the obtained result opens doors for future work to consider applying unmixing on ROIs, which can limit analysis to seeds. Excluding spatial background from the analysis will drastically reduce computational time and power enabling real-time analysis, a major impediment to the uptake of such techniques in commercial equipment. Moreover, defining ROIs allows quantifying the mean abundance of endmembers for each ROI to perform a pure classification task.
Although a direct comparison of our work with previous relevant research is not possible due to differences in sample types and/or conditions, a few previous studies have applied wavelength selection on NIR HSI data for identifying wheat FDKs that can be discussed. For instance, Delwiche et al. 16 applied LDA-based techniques on NIR HSI data and identified four wavelengths of 1100, 1197, 1308, and 1394 nm as key wavelengths for FDK identifications in hard wheat with high visual contrast kernels. Compared to that work, we used a different approach on different samples, and our model is not limited to kernels with high visual contrast. Serranti et al. 14 employed PLS-DA over NIR HSI data to separate FDK, yellow berry and vitreous durum wheat. The authors reported on the capability of interval PLS-DA for identifying 12 key wavelengths to successfully classify the damaged seeds. Compared to their work on Italian durum wheat kernels, we used different algorithms to detect FDKs on CWRS wheat samples.
Our thorough literature review indicates that the research toward implementing effective algorithms for optimum wavelength selection from HSI data is ongoing. Hence, further studies/tests are needed to reach a standard, fast, accurate, and automated data processing model under various experimental settings. Such tools can facilitate the adoption of NIR HSI by the agri-food industry for FDK identification.
Limitations and future work
It is important to recognize that the provided experimental investigation in applying ICA for modeling Fusarium damage in wheat kernels using HSI presents certain limitations that are worth addressing in future research. These limitations offer opportunities for refinement, expansion, and further exploration of this innovative approach, providing avenues for future research to contribute to and enhance researchers' understanding of this complex problem.
Region of interest analysis
The present study analyzed spectral pixels independently of their spatial properties. The application of ICA to all pixels, including those outside conventional ROIs, allowed us to navigate and examine the entirety of the hyperspectral data. This holistic approach could be particularly beneficial when analyzing bulk sample images, where the entire image is composed of relevant pixels and background removal isn't required.
While this approach minimizes potential spatial bias, it also represents an area of expansion for future research. Future studies can focus on performing ICA-based unmixing on identified ROIs, enabling the elimination of spatial background followed by more localized and specific analysis. This could simultaneously reduce computational time and power requirements, making the method more feasible for real-time analysis.
Additionally, a further layer of investigation could be added by studying specific spectral characteristics of wheat kernels. For instance, upon defining ROIs, future studies might involve an exploration of differences in mean spectra between sound and damaged kernels. Such targeted investigations could enrich our understanding of spectral signatures related to Fusarium infection, providing additional depth to HSI analysis and making it even more effective in the detection and analysis of FDKs in wheat.
Development of a classification model
Although the primary objective of this study was to demonstrate the utility of the ICA-based method in identifying Fusarium damage, a logical next step would be to develop a robust classification model. By defining ROIs, followed by combining the spectral unmixing approach with machine learning techniques, it is possible to classify sound and damaged kernels more accurately, which will have remarkable practical applications for the grain industry.
Investigation of effects of moisture content and infection levels
In this preliminary study, samples with different infection levels and moisture contents were considered but did not delve into how these variations might affect the spectral characteristics and, subsequently, the efficacy of the ICA-based approach. Future research could focus on these factors in a more detailed manner, investigating their impact on the detection and analysis of Fusarium damage. This would contribute to a more comprehensive understanding of the use of HSI in detecting FDKs under varying conditions.
Comparative analysis
The current study concentrated primarily on showcasing the potential of the ICA-based method in identifying Fusarium damage in wheat kernels. Nevertheless, a detailed comparative performance analysis with traditional PCA methods could elucidate further nuances. To address this, future studies could undertake a comprehensive comparative analysis between the two methods, evaluating factors such as computation time, accuracy, and the percentage of correctly identified sound and damaged kernels. Such an analysis could provide deeper insights into the strengths and potential areas of improvement for the ICA-based approach.
Specificity of Fusarium species and generalization of the model
The present research, specifically focused on the detection of F. graminearum in wheat kernels. While the method demonstrated success in this context, it is yet to be determined how it performs with different Fusarium species or other fungal genera. It is also uncertain if the spectral signatures identified by our model are exclusive to F. graminearum or could be indicative of other pathogens.
Future studies could address this limitation by testing our ICA-based approach on wheat samples infected with different Fusarium species or other fungal pathogens. This would require a comprehensive collection of hyperspectral data from wheat samples infected with a variety of fungal pathogens. The ability to generalize the model to detect other pathogens is an important factor for its practical applications. This information could lead to a more universal application of the method and contribute to its robustness, thereby increasing its potential utility in the agricultural industry.
Conclusion
An ICA-based spectral data analysis technique that exploits the power of a genetic algorithm to reduce data redundancy could be effectively deployed to differentiate between the majority of pixels of healthy and Fusarium-damaged wheat kernels in near infrared hyperspectral images. These results establish that using this novel technique, a set of 256 wavelengths in the NIR range of 820 to 1666 nm could be effectively reduced to only ten wavelengths (viz., 1182, 1204, 1242, 1284, 1316, 1347, 1365, 1425, 1432, 1440 nm), without compromising the classification performance. The obtained results open doors for future work to consider spatial dependence between image pixels on desired regions of interest (i.e., seeds) to further reveal the full potential of the proposed unmixing approach. The proposed method could have far-reaching benefits to the agricultural industry as it will drastically reduce the cost of imaging and computing hardware. A multi-spectral imaging system, using inexpensive non-tunable wavelength filters, could be tailored to acquire only a few pre-determined wavelengths instead of using a full hyperspectral imaging system leading to real-time and inexpensive grain quality monitoring. This study opens up a new pathway in hyperspectral imaging data analysis for assessing grain quality. The authors believe, upon further research, the proposed approach has the potential to revolutionize hyperspectral imaging data analysis.
Footnotes
Acknowledgments
The authors would like to thank Channel Systems Inc. and Mitacs-Accelerate for financial support for this work. They would also like to thank Dr. Dilantha Fernando (Department of Plant Science, University of Manitoba) and Ms. Tasneem Vahora for their help in preparing the Fusarium-infected wheat samples.
Declaration of conflicting interests
The author(s) declared no potential conflicts of interest with respect to the research, authorship, and/or publication of this article.
Funding
The author(s) disclosed receipt of the following financial support for the research, authorship, and/or publication of this article: This study is supported by Channel Systems Inc. and Mitacs-Accelerate.