
Abstract
The contamination of maize, a major staple food in South Africa, with fumonisin B1 (FB1), has become a major food safety concern. The regulation of this mycotoxin is extremely important and requires efficient detection methods. Near infrared (NIR) spectroscopy has gained widespread interest as a rapid and non-destructive mycotoxin analysis method. The purpose of this study was, therefore, to determine the NIR absorbance bands of FB1. The spectra of 30 FB1 solutions, constituted in methanol, as well as 30 methanol-only samples were recorded in the spectral range of 1000–2500 nm (10,000 – 4000 cm−1). The data was pre-processed with multiplicative scatter correction (MSC) and a partial least squares discriminant analysis (PLS-DA) model was computed. The variable importance in projection (VIP) scores and selectivity ratio (SR) values were used for wavelength selection. A new PLS-DA model was computed with 454 chosen wavelengths and the regression vector of this model was investigated to further identify and remove irrelevant wavelengths. The final model was computed with 150 wavelengths and nine latent variables (LVs) and obtained a classification accuracy of 100% for both the calibration and external validation sets. By investigating the regression vector of the final PLS-DA model, potential FB1 absorbance bands were identified at 1446 nm, 1453 nm, 1891 nm, 2036 nm, 2046 nm, 2148 nm, 2224 nm, 2262 nm and 2273 nm. This study was therefore able to identify the previously unknown NIR absorbance bands of FB1 at 100 ppm.
Keywords
Introduction
Fumonisins are toxic secondary metabolites produced by the fungi Fusarium verticillioides and Fusarium proliferatum and are the most common mycotoxins which accumulate in maize and maize by-products.
1
Since its discovery in 1988, more than a thousand fumonisins have been identified, with the most important being fumonisin B1 (FB1) and fumonisin B2 (FB2) of which FB1 is the most toxic and the most abundant in maize.2,3 FB1 has a main chain of 20 carbon atoms to which one amine group and several carboxylic acid, ester, hydroxyl, methyl and methylene groups are attached.
2
The chemical structure of FB1 is presented in Figure 1. The chemical structure of Fumonisin B1.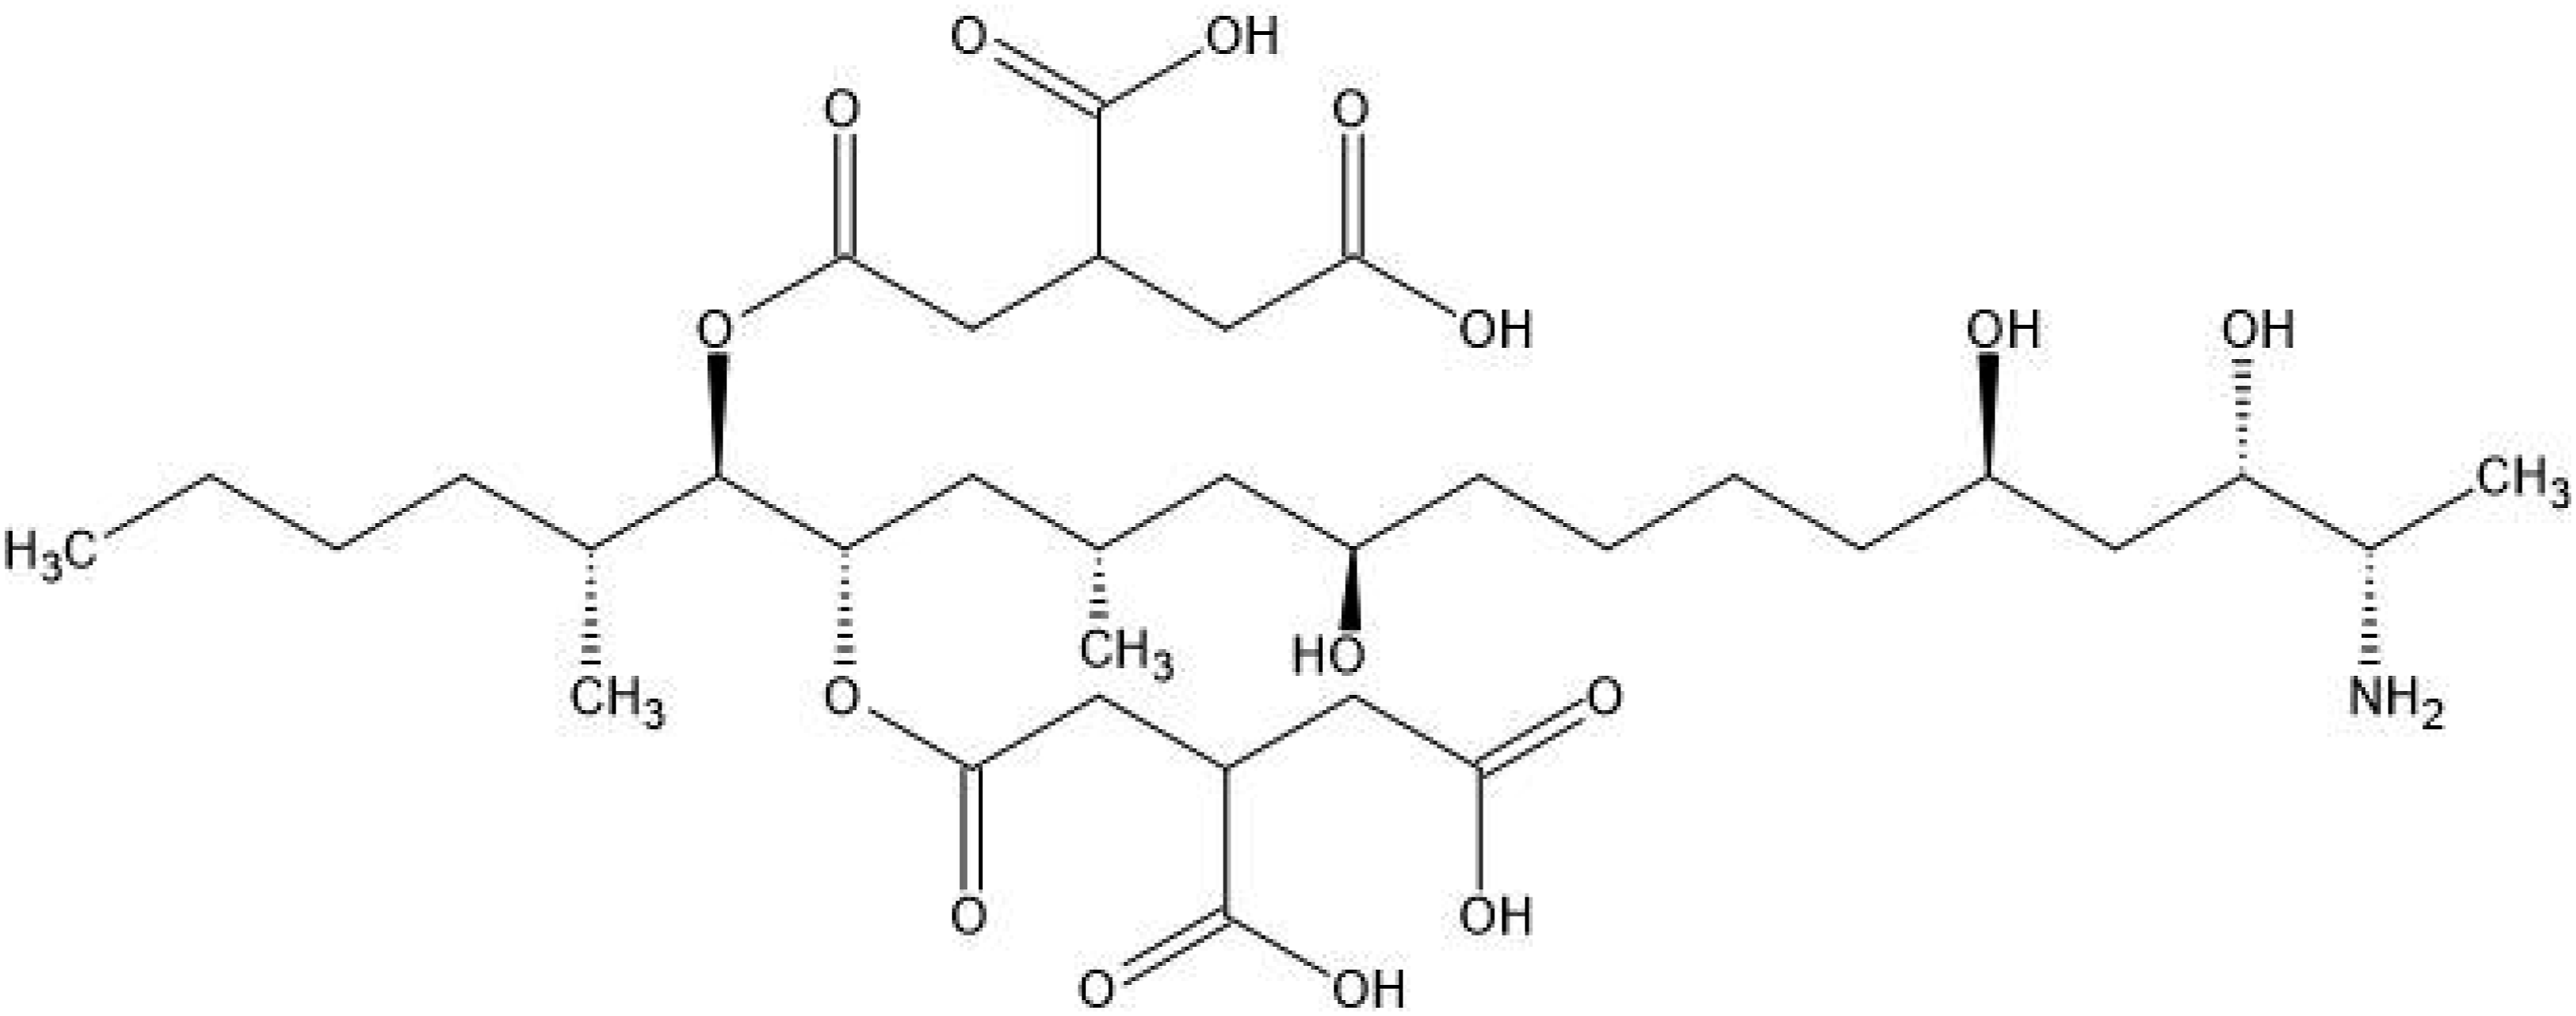
Fumonisins are toxic to both humans and animals. In animals it has been responsible for various chronic illnesses such as pulmonary edema in pigs, leukoencephalomalacia in horses, and liver cancer in rats.2,4,5 In humans, fumonisins have been associated with an increase in oesophageal cancer cases in certain regions of South Africa, China and Iran, and has been classified as a group 2B human carcinogen by the International Agency for Research on Cancer.6–11 Due to its toxicity, its presence in maize, which is a major staple food for many South Africans, must be closely regulated. 12 The Codex Alimentarius Commission has set maximum levels (MLs) for FB1 and FB2 to 2 ppm in maize flour and maize meal and 4 ppm in raw maize. 13 These levels have been legislated in South Africa. 14 To ensure that regulations are met, rapid and accurate mycotoxin analysis methods with the possibility of automated monitoring are required.
Currently, the most popular conventional analysis methods include high performance liquid chromatography (HPLC) coupled with fluorescence detection and/or mass spectrometry (MS) and enzyme-linked immunosorbent assay (ELISA).15–17 Although these methods are accurate and precise, they are unable to provide real time feedback and require extensive sample preparation which is destructive, time consuming, expensive and results in a large amount of chemical waste.18,19
Near infrared (NIR) spectroscopy has gained attention due to its ability as a rapid, non-destructive detection method which provides real time feedback and reduces chemical waste. NIR spectroscopy exposes food constituents to electromagnetic waves in the region of 780–2500 nm. 18 The food constituents interact with the electromagnetic waves and these interactions are recorded as a spectrum. To obtain quantitative and/or qualitative information from the spectra, different mathematical and statistical techniques are used which are defined as chemometrics. 18
In 2002, NIR spectroscopy was used to successfully differentiate between fumonisin positive (>100 ppm) and negative (<10 ppm) maize kernels, but was unable to discriminate between kernels which were contaminated at the regulatory limits (4 ppm). 20 However, in 2022, a smartphone controlled portable NIR spectrometer, combined with chemometric models, was used to classify naturally contaminated samples of ground maize at the FB1 regulatory limit and achieved a classification accuracy of 86%. 21 The improved classification results at lower detection levels within only 20 years, emphasises the rapid evolution of NIR spectroscopy. Thus, the further development of instrumentation and improvement of chemometric algorithms, will potentially result in the greater implementation of NIR spectroscopic methods for mycotoxin detection when compared to conventional analysis methods.
To develop NIR calibration models, the substance to be measured must be able to absorb in the NIR region. 22 These substances are organic in nature and can be detected with direct measurement. 22 However, if the substance is inorganic, or present at levels too low for direct measurement, indirect measurement can be used. 22 During this measurement, the substance of interest is predicted through covariation with other absorbing substances. 22
Although fumonisins are organic compounds, the first study that used NIR spectroscopy to detect it, stated that fumonisins absorb negligible amounts of NIR energy at the ppm level. 20 However, there was no basis for this statement, since the absorbance bands of fumonisins had not yet been determined and, therefore, it was not possible to conclude at which level fumonisins could be detected. Nevertheless, due to this statement, subsequent studies focussed their attention on the use of indirect measurement for the detection and quantification of fumonisins.15,16
One study used fungal count and ergosterol levels to classify maize kernels according to their fumonisin content. 15 The study reported that ergosterol levels were not proportional to the fumonisin content and could, therefore, not be used for classification. 15 The study also chose a threshold value of 200 000 CFU/g for the fungal biomass, beyond which the fumonisin content would most likely exceed 4 ppm. 15 By using this threshold, they were able to correctly classify 96% and 82% of maize kernels in the calibration and external validation sets, respectively. 15 Other studies depended on chemometric models for analysis and not spectral interpretation. These studies concluded that the wavelengths responsible for classification and/or quantification, were related to changes in the colour, vitreousness and nutrient content (protein, starch and fatty acids) of maize kernels.16,20,21
Although these studies obtained relatively good classification accuracies, the factors and conditions required by which fungi produces FB1, is not fully understood. Often the fungi can be present in maize grain without producing FB1 or the toxin is present without visible symptoms of infection, and this will decrease the accuracy of these methods. 23 However, direct measurement methods have the potential to increase the accuracy and allow the detection of FB1 in maize kernels even after the fungi is removed.
In 2009, Peiris et al. examined the spectra of another mycotoxin, deoxynivalenol (DON), in acetonitrile and on sound and infected maize kernels. 24 A dilution series of 0.5–2000 ppm deoxynivalenol in acetonitrile were prepared and after the spectra were pre-processed with second derivatives and spectral subtraction was applied, differences in the absorbance bands intensities were identified at 1408 nm, 1904 nm and 1919 nm. 24 Spectral shifts were observed at similar wavelengths (1425 – 1440 nm and 1915 – 1930 nm) when the spectra of sound and infected kernels were compared. The study was able to identify the absorbance bands of DON at the ppm level and confirmed that, contrary to previous published statements, certain mycotoxins can absorb detectable amounts of NIR energy at the ppm level. 24
Based on these findings, it was decided that the statement made against the direct detection of FB1, needs to be reinvestigated. The aim of this project was, therefore, to determine the feasibility of using NIR spectroscopy for the direct detection of FB1. This was done by determining the FB1 absorbance bands at the ppm level, which, to the best of our knowledge, has not yet been identified.
Materials and methods
Sample preparation
Forty milligrams (40 mg) of FB1 was obtained from Merck (Darmstadt, Germany) in pure crystalline form. Since the amount of FB1 purchased was not sufficient to obtain the absorbance spectra of the FB1 powder in the reflectance mode, it was dissolved in methanol and its spectra were obtained in transmittance mode.
FB1 was dissolved in 99.9% HPLC grade methanol (Merck, Darmstadt, Germany) to prepare a 5000 ppm FB1 stock solution. From the stock solution, two samples were further diluted with methanol to obtain two 100 ppm FB1 solutions. For each of the 100 ppm FB1 solutions, a vial containing methanol only was prepared and was used as a blank. The samples were prepared in a vacuum hood at room temperature in the Department of Food Science, Stellenbosch University. Both the methanol-only and the FB1 solution samples were stored at −20°C. These two repeats of the FB1 solution and methanol-only samples are referred to as the experimental repeats and were prepared to account for the variation introduced during sample preparation.
Before the spectra were recorded, the samples were removed from the freezer, the room temperature was set to 21°C and the spectrometer was switched on and allowed to heat up for an hour. From the first experimental repeat, the methanol was pipetted into a 0.5 mm quartz cuvette (Hellma, Germany), placed into the spectrometer and three scans were taken without removing the cuvette from the instrument. These scans were referred to as the instrumental repeats and were used to investigate the instrumental drift and the effect of NIR energy on the samples. After the spectra of the methanol instrumental repeats were obtained, the methanol was discarded, the cuvette was rinsed with distilled water and ethanol. The cuvette was then dried with a glass specific cloth and allowed to dry to ensure that no ethanol or water is left behind. The FB1 solution of the experimental repeat was then pipetted into the cuvette and the spectra were recorded in triplicate. This process was repeated five times (sample repeats) for each of the experimental repeats. The sample repeats ensured that the variation introduced by changes in the temperature and the volume of the samples between measurements, were accounted for. Thus, a total of 60 repeats were used in this study to ensure that the within sample variation was accounted for and to prevent the incorrect identification of FB1 absorbance bands. The samples were scanned at the Vibrational Spectroscopy Unit in the Department of Food Science, Stellenbosch University. The preparation of the repeats is illustrated in Figure 2. An illustration of how the experimental repeats, sample repeats and instrumental repeats were prepared and recorded. This illustration was created with BioRender.com.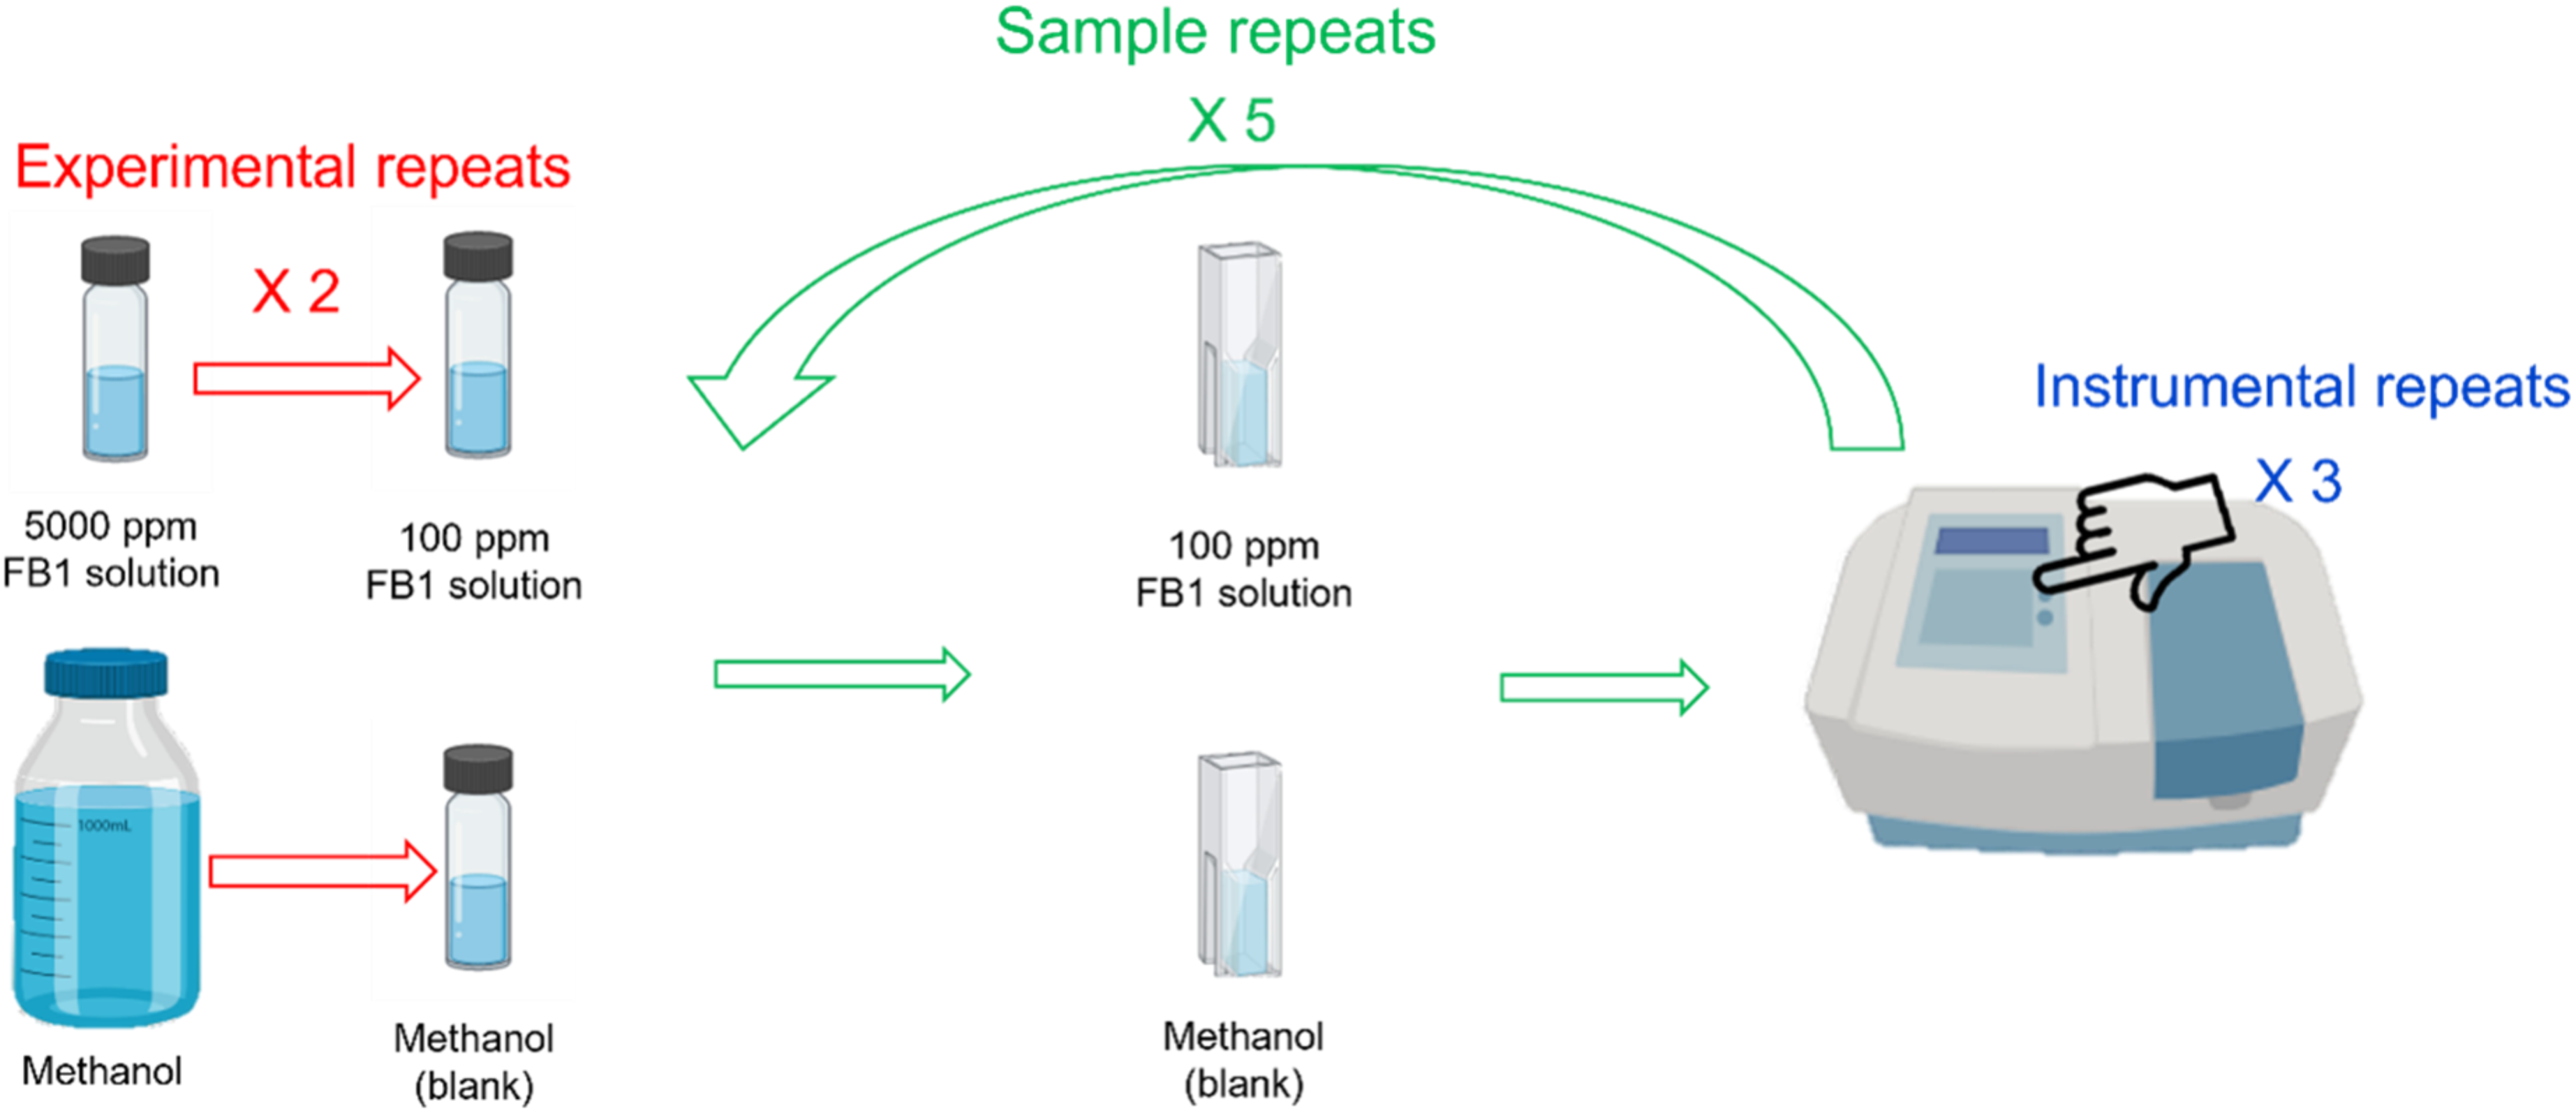
NIR instrumentation
A Büchi NIRFlex N-500 NIR spectrometer (BÜCHI Labortechnik AG, Switzerland) with an InGaAs (Indium Gallium Arsenide) detector and a tungsten halogen lamp was used. The spectrometer had a wavelength range of 1000–2500 nm (10,000 – 4000 cm−1) and a spectral resolution of 0.4 nm and 16 scans were taken and averaged to obtain the spectra. The spectrometer’s temperature was set to 35°C and a maximum temperature drift of ± 0.3°C was allowed. The spectrometer was connected to a computer and the NIRWare software package (BÜCHI Labortechnik AG, Switzerland) was used to import the data as transmittance and convert it to absorbance. The data was then exported as an excel file.
Data analysis
MATLAB R2021 (MathWorks Inc., Natick, MA, USA) was used to analyse and visualize the raw spectral data and the PLS_Toolbox 9.0 (Eigenvector Research Inc., Wenatchee, WA, USA) extension was used for multivariate data analysis.
Spectral analysis
The raw absorbance spectra of the FB1 solutions and methanol-only samples were evaluated and the differences between the spectra were investigated to determine if the presence of FB1 had a visible effect on the spectra. However, methanol is an organic molecule which absorbs NIR energy and, therefore, the changes in methanol may result in spectral changes which could affect the identification of the FB1 absorbance bands.
25
Thus, the bands affected by the changes in methanol were identified by subtracting the mean methanol spectrum from each of the methanol spectra using equation 1.

Where:
Muncan and Tsenkova
26
(2019) discussed the effect of NIR energy on the spectra of water and referred to this effect as illumination perturbation. It was observed that illumination perturbation affects the hydrogen bonds in water and since methanol also forms hydrogen bonds, it is likely that this phenomenon will also affect the methanol spectra.
27
Therefore, equation (2) was used to determine the effect of illumination perturbation on the methanol spectra by subtracting the mean methanol spectrum from the mean methanol spectra of each of the instrumental repeats.

After the absorbance bands affected by illumination perturbation were identified, the possible FB1 absorbance bands were determined by subtracting each methanol spectra from its corresponding FB1 solution spectra using equation (3).

Multivariate analysis
Spectral pre-processing
Several pre-processing methods were evaluated and the method which resulted in the best model performance was selected. In this study, standard normal variate (SNV) and multiplicative scatter correction (MSC) were used to reduce scattering effects.28,29 Savitzky-Golay (SG) second derivative pre-processing was used for the removal of noise, and the reduction of additive and multiplicative effects. 30 SG was used with a second order polynomial and a window width of 21 points.
Principal component analysis
The goal of principal component analysis (PCA) is to reduce data dimensionality by using a small number of principal components (PCs) to capture the variation present in a large dataset. 31 The PCA models were constructed for the raw as well as the pre-processed data. The models were then compared and the model which was able to achieve the best separation between the FB1 solution samples and the methanol-only samples in the score plots, using the lowest number of PCs, was selected. The loadings of the chosen model were investigated to identify which bands were responsible for the separation in the scores plot.
Partial least squares discriminant analysis
Partial least squares discriminant analysis (PLS-DA) combines the regression properties of PLS with the classification properties of DA and can provide information on the variables which are important for classification, making it perfect for this study. 32 PLS-DA was performed on the pre-processed as well as the raw data. The Kennard-Stone algorithm was used to split the data into 70% calibration and 30% external validation samples. 33 For both the calibration and the external validation sets, the samples were selected in a 1:1 ratio of FB1 solution to methanol samples. The venetian blinds cross-validation method was used to select the optimal number of latent variables (LVs) that corresponded with the lowest root mean squared error of cross-validation (RMSECV). The performance of the models was evaluated by calculating the classification accuracy, classification error, specificity, and sensitivity. 21 The model which obtained the highest classification accuracy with the lowest number of LVs, was selected.
The importance of each band on classification was investigated by inspecting the vector of the regression coefficients with respect to the FB1 solution samples. Bands which had a large positive regression coefficient were recognised as bands that can potentially be used for the identification of FB1. However, there is a possibility that these bands may not be related to FB1. This is because the use of LVs, instead of the original variables for classification, increases the model complexity.
34
The LVs are constructed by not only maximizing the covariance between the independent variables (
Variable selection
Variable selection methods can be used to remove irrelevant variables which will typically improve the model performance and interpretation, and reduce model complexity.
36
One of the most used variable selection methods is the variable importance in projection (VIP).
37
The VIP scores are useful for understanding the
Target projection (TP) with Selectivity Ratio (SR) is another variable selection method suggested for multivariate data.
40
SR ranks the

For this study, the threshold value of the VIP scores was set to one and a significance level of 0.05 was selected to determine the Fcrit value which was used as the threshold value for the SR. The automatic VIP and SR function of the PLS toolbox was used to select the wavelengths of interest. During the execution of this function, wavelength selection was performed using both the VIP scores and the SRs simultaneously and the wavelengths that produced the model with the best RMSECV, was included in the final model. In the first run of both the VIP and SR variable selection methods, the wavelengths with the lowest VIP or SR values were eliminated, this was repeated until the model showed no improvement. For each run, a certain fraction of the wavelengths had to be removed. To determine which fraction was the most appropriate to remove, the function evaluated the outcome of several fractions. These fractions included: 2%, 5%, 8%, 10%, 15%, 20%, 30%, 35%, 40% and 45%.
Results and discussion
Spectral analysis
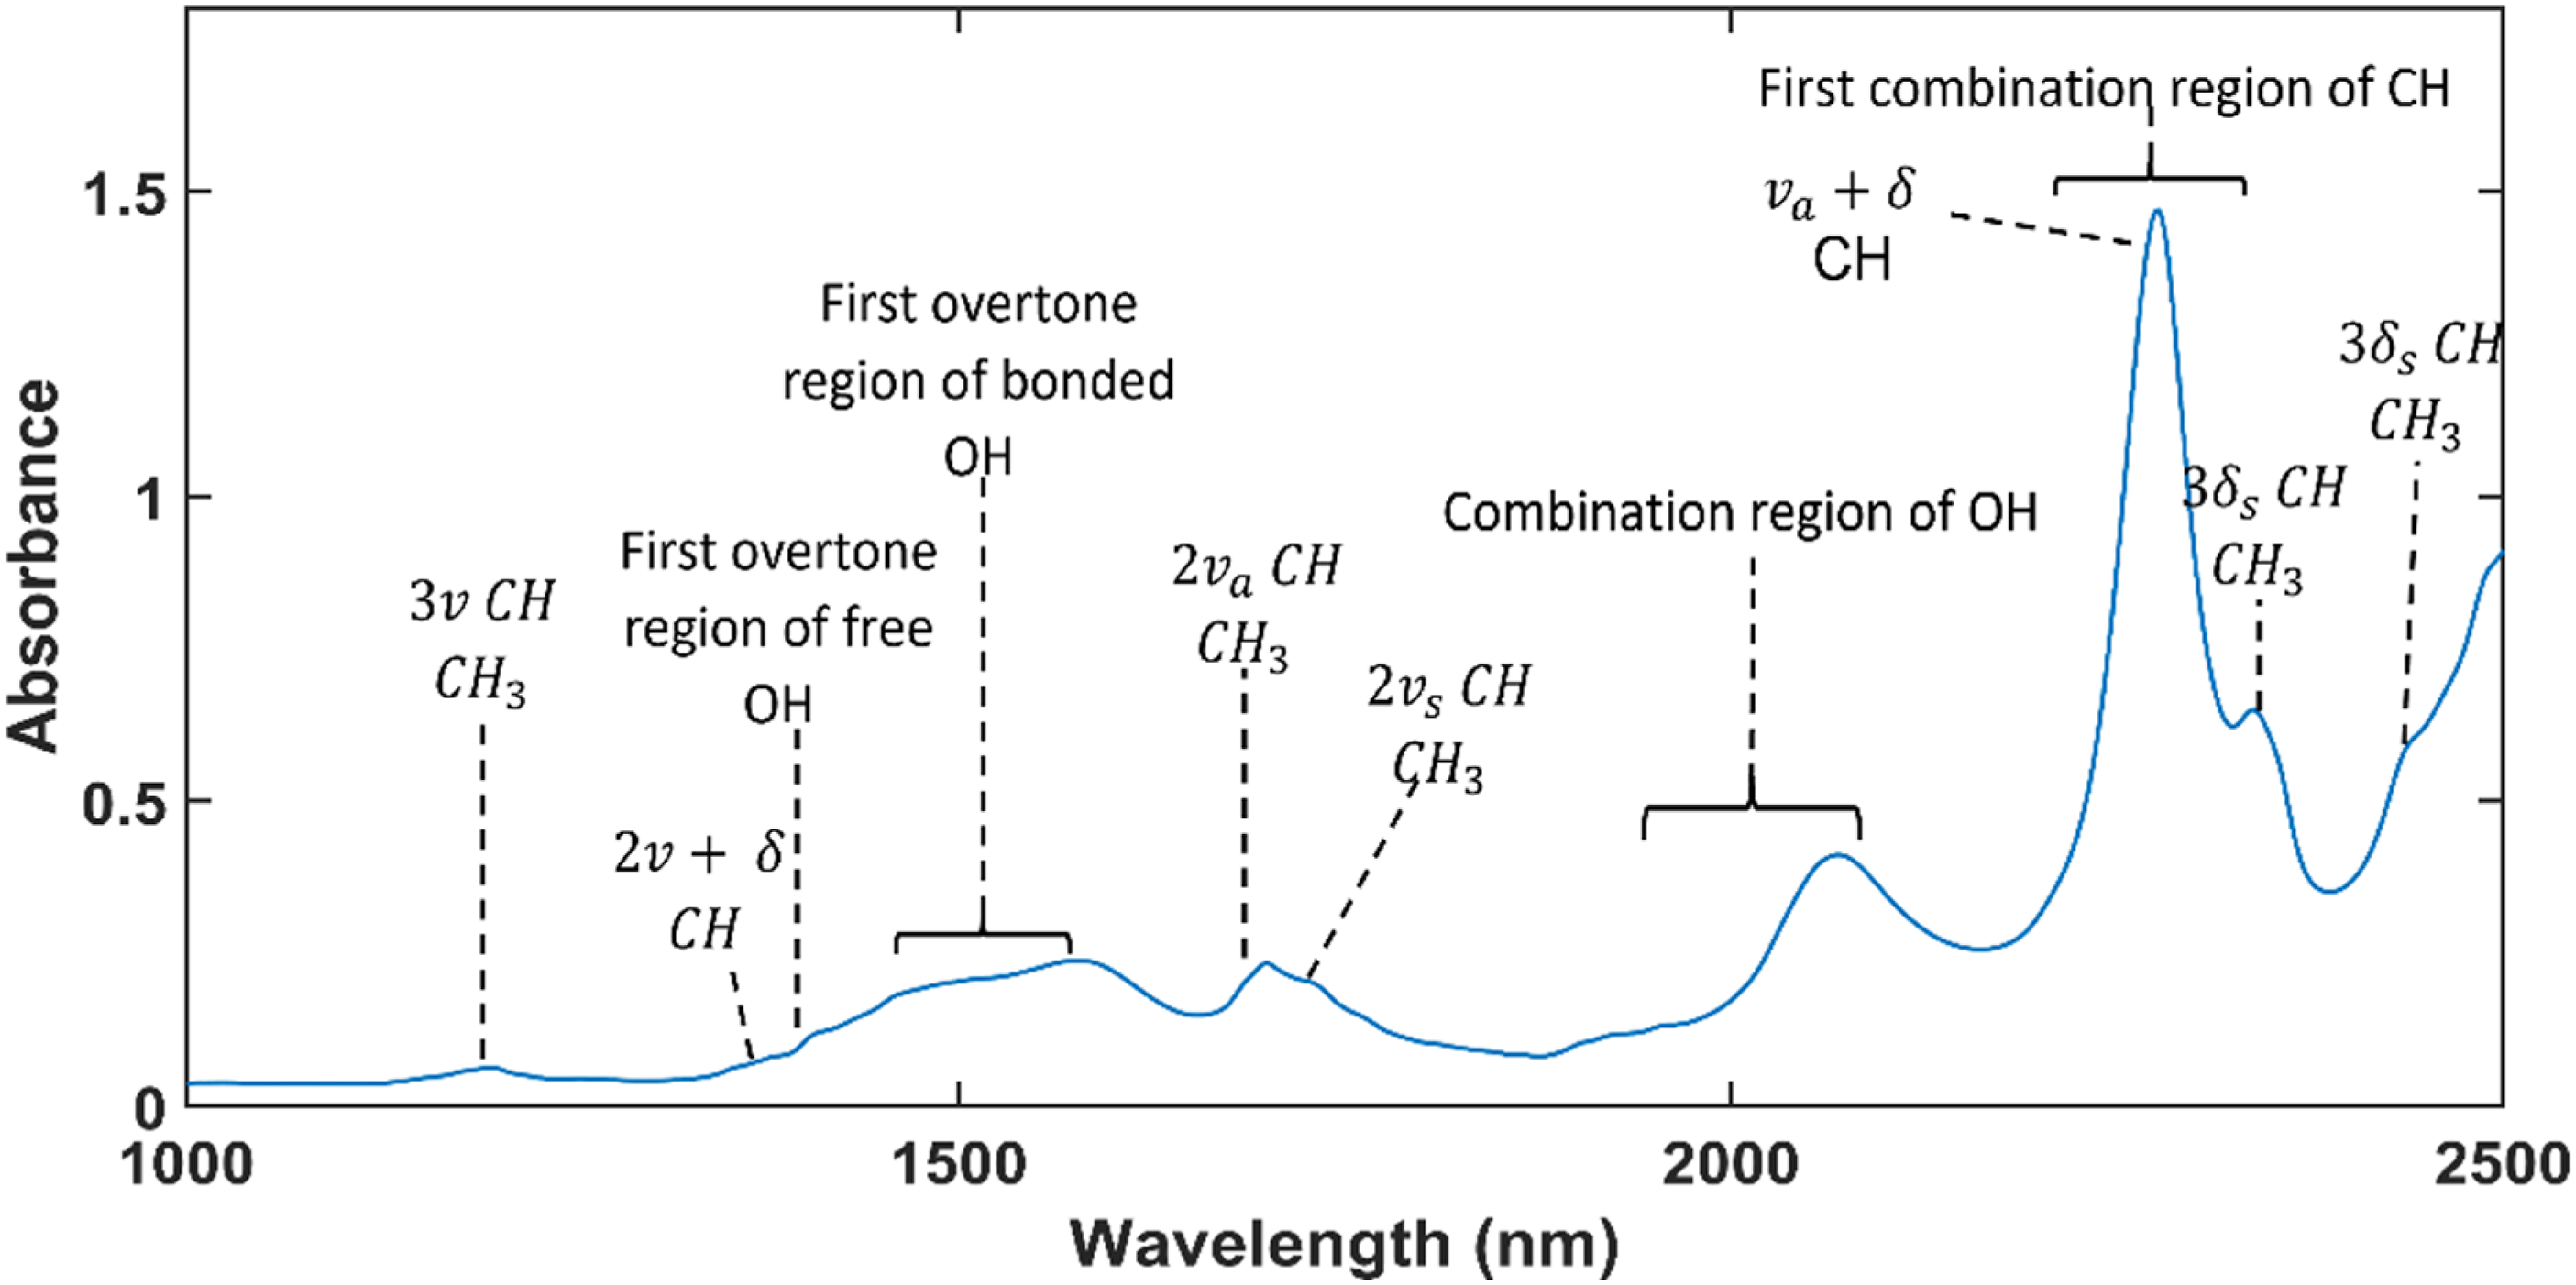
The raw absorbance spectra of the 100 ppm FB1 solution samples and the methanol-only samples are presented in Figure 3 and differences between these spectra were observed at approximately 1880–2020 nm and 2270– 2280 nm. These differences may have been caused by the presence of FB1 in methanol or by the changes of methanol itself. The spectra of the methanol-only samples were investigated to determine the cause of these spectral differences. The mean spectrum of the recorded methanol spectra is given in Figure 4 and the absorbance bands and its assignments, are indicated and summarised in Table 1. The raw absorbance spectra of the 30 FB1 solution samples and the 30 methanol-only samples. The mean absorbance spectrum of methanol and the assignments of its different absorbance bands. The symbols 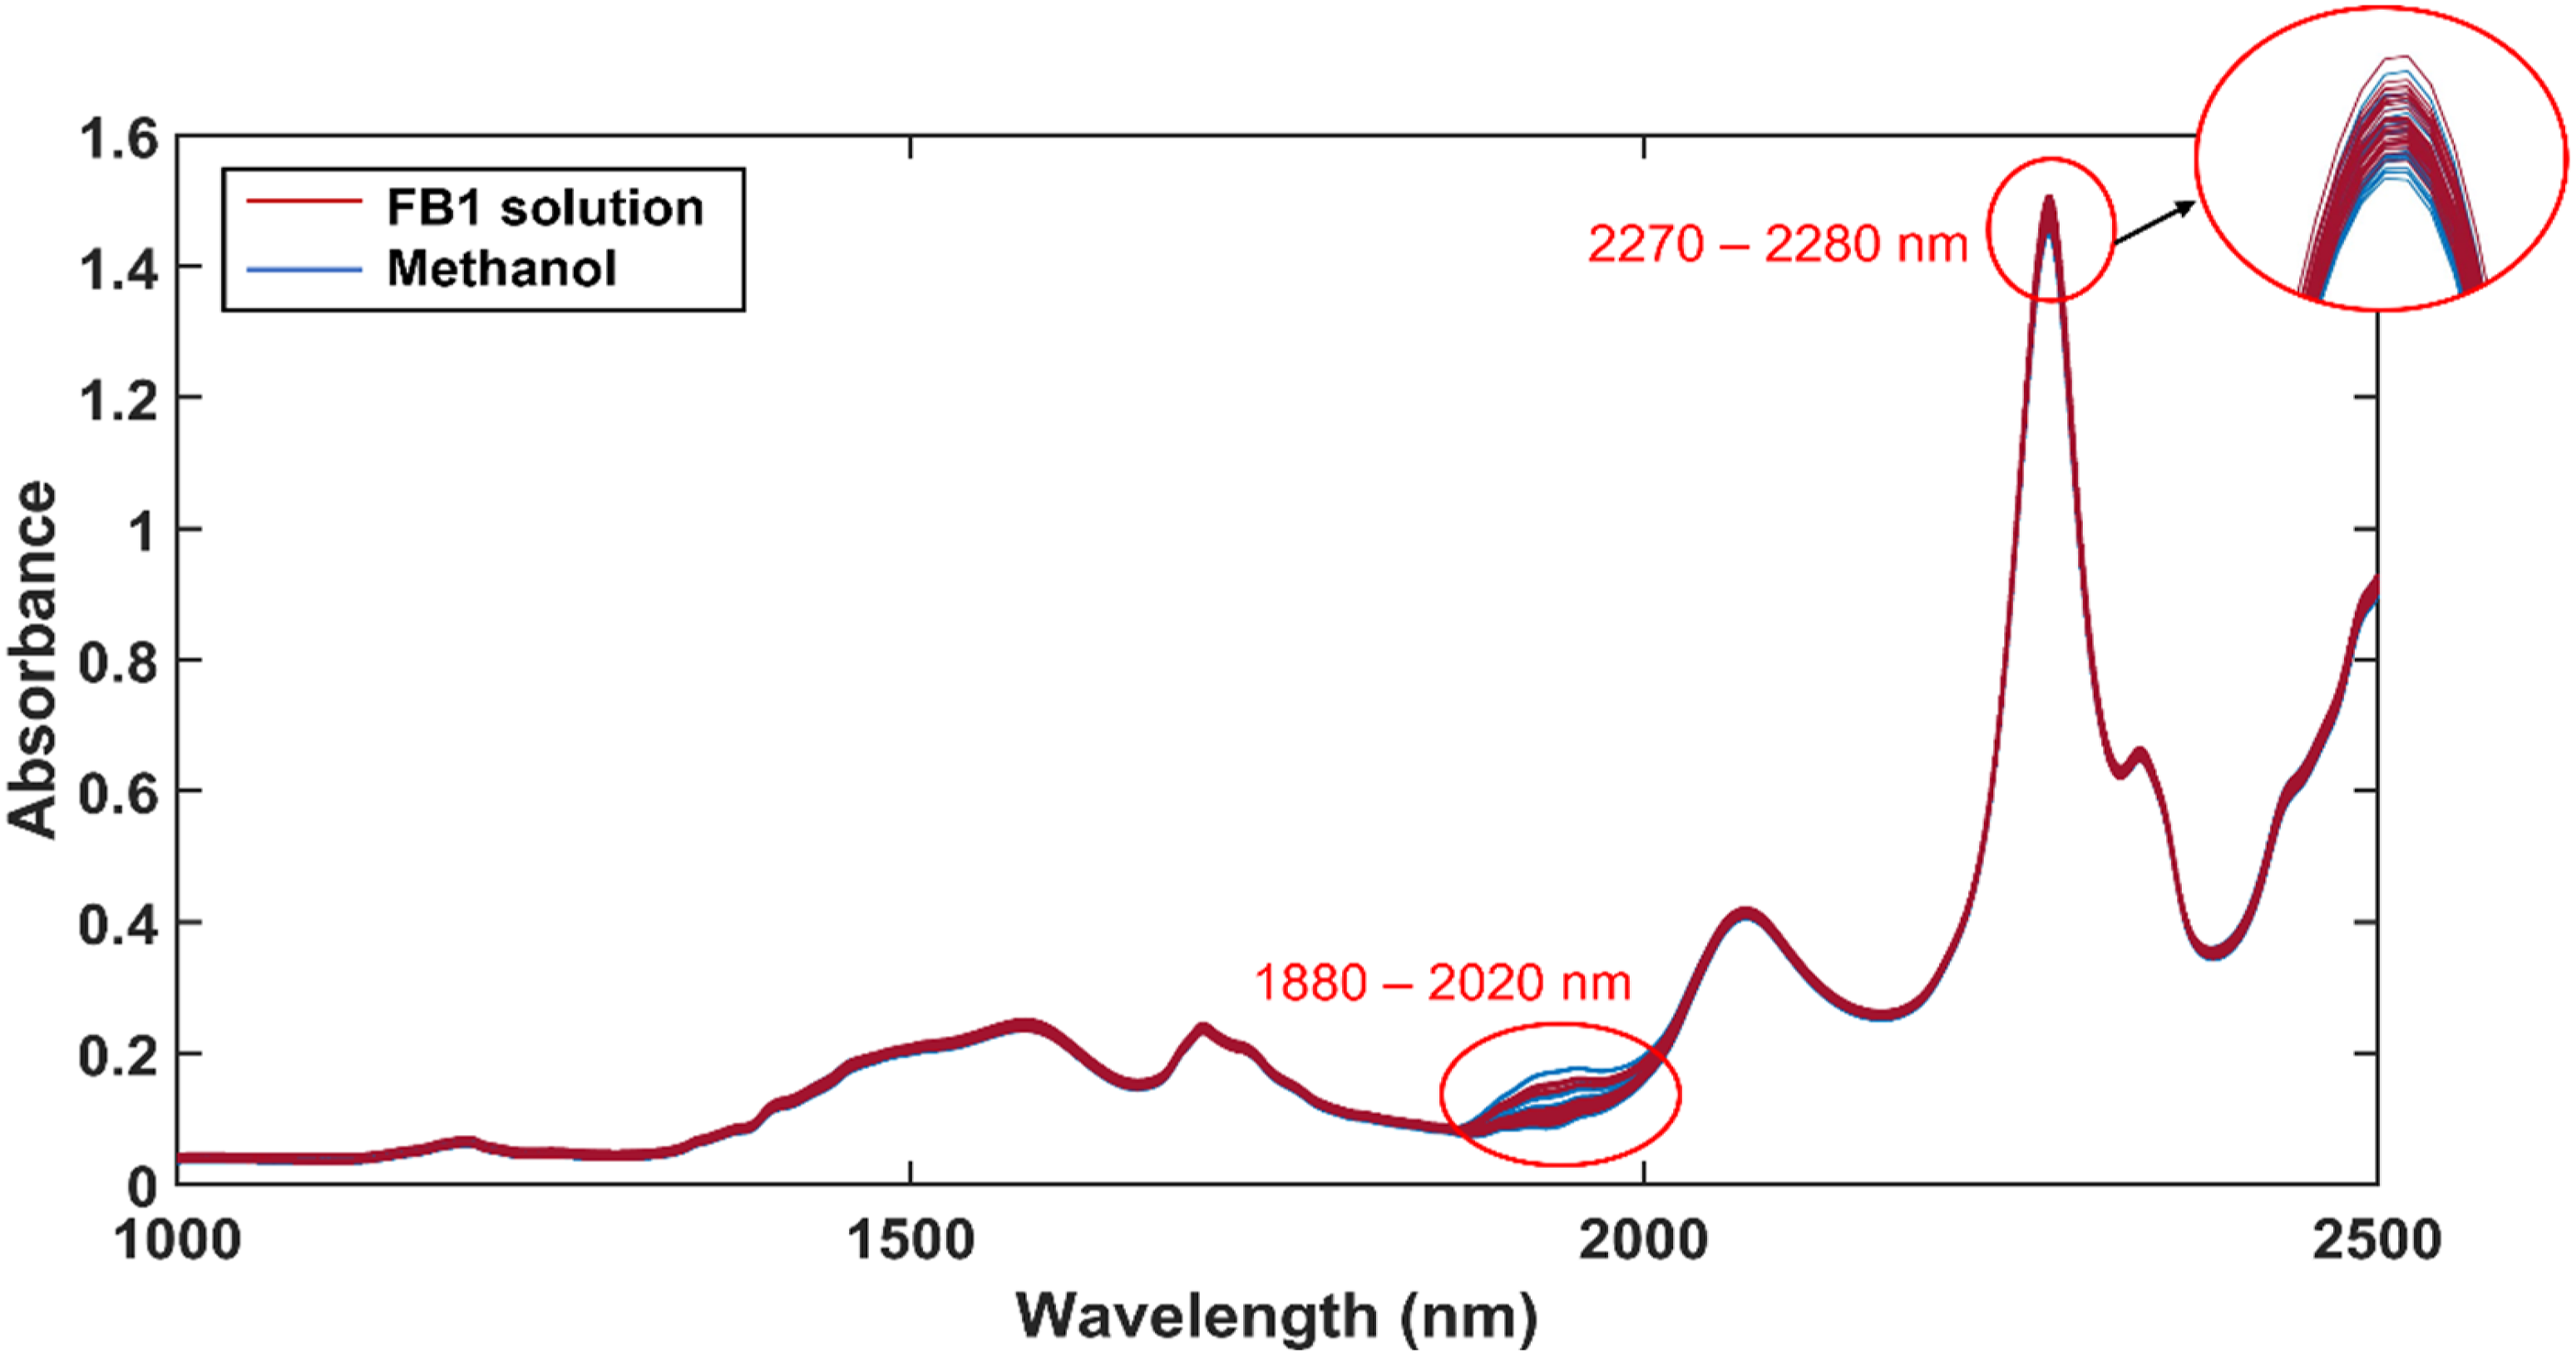
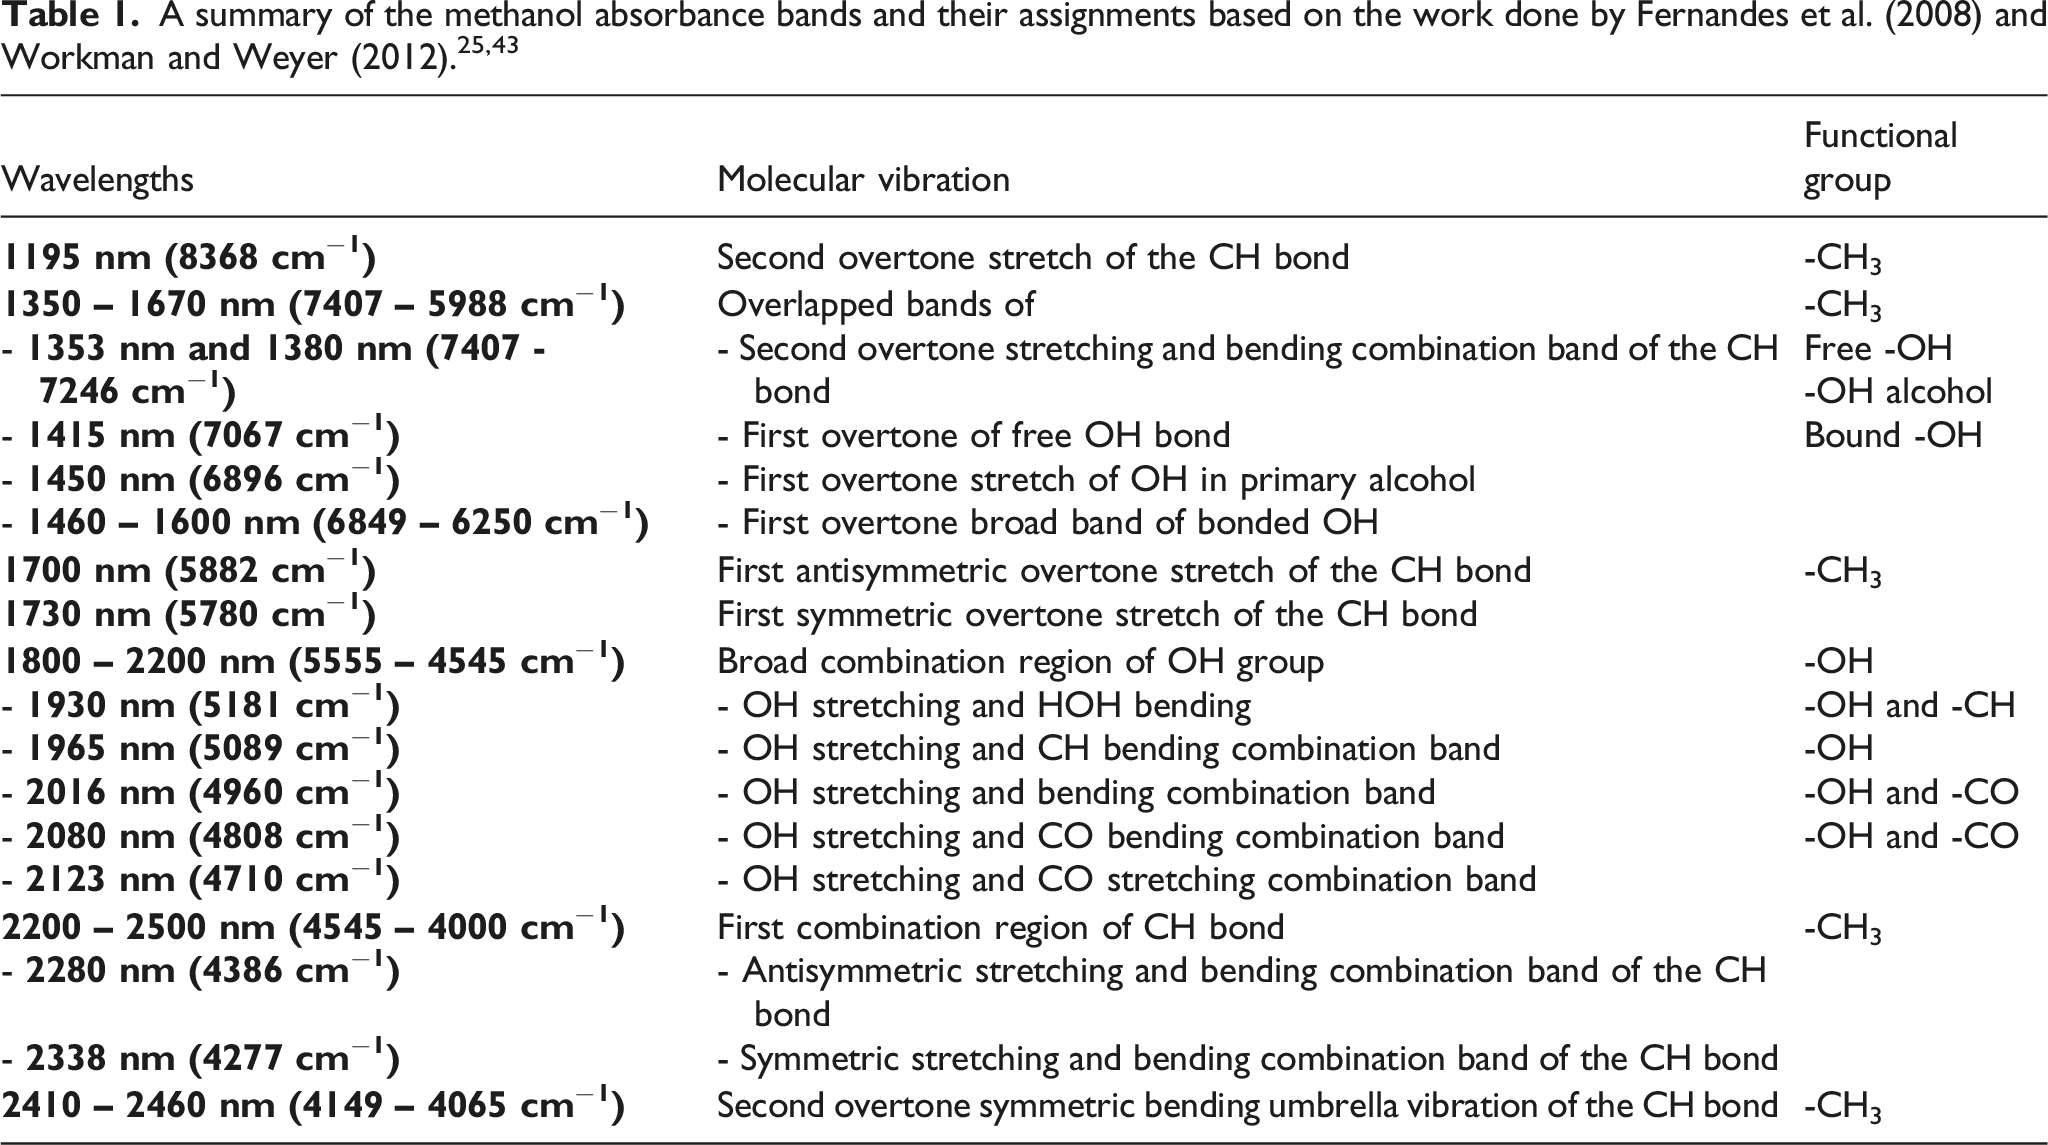
The absorbance spectra of the methanol-only samples are presented in Figure 5 and spectral differences were observed at approximately the same wavelengths as identified in Figure 3. To determine the specific wavelengths at which the spectra differed, a very similar method to that used by Peiris et al. was used.
24
The difference spectra in Figure 6 were calculated with equation (1). From the peaks of the difference spectra, it was determined that the largest differences between the raw methanol spectra occurred at 1450 nm, 1938 nm, 2277 nm, 2339 nm and 2432 nm. It was therefore concluded that these bands are affected by changes in methanol. The raw absorbance spectra of the methanol-only samples. For each instrumental repeat, 10 methanol-only samples were scanned. The different instrumental repeats are indicated. The difference spectra after the mean methanol spectrum was subtracted from each methanol spectra. For each instrumental repeat, 10 methanol-only samples were scanned. The different instrumental repeats are indicated.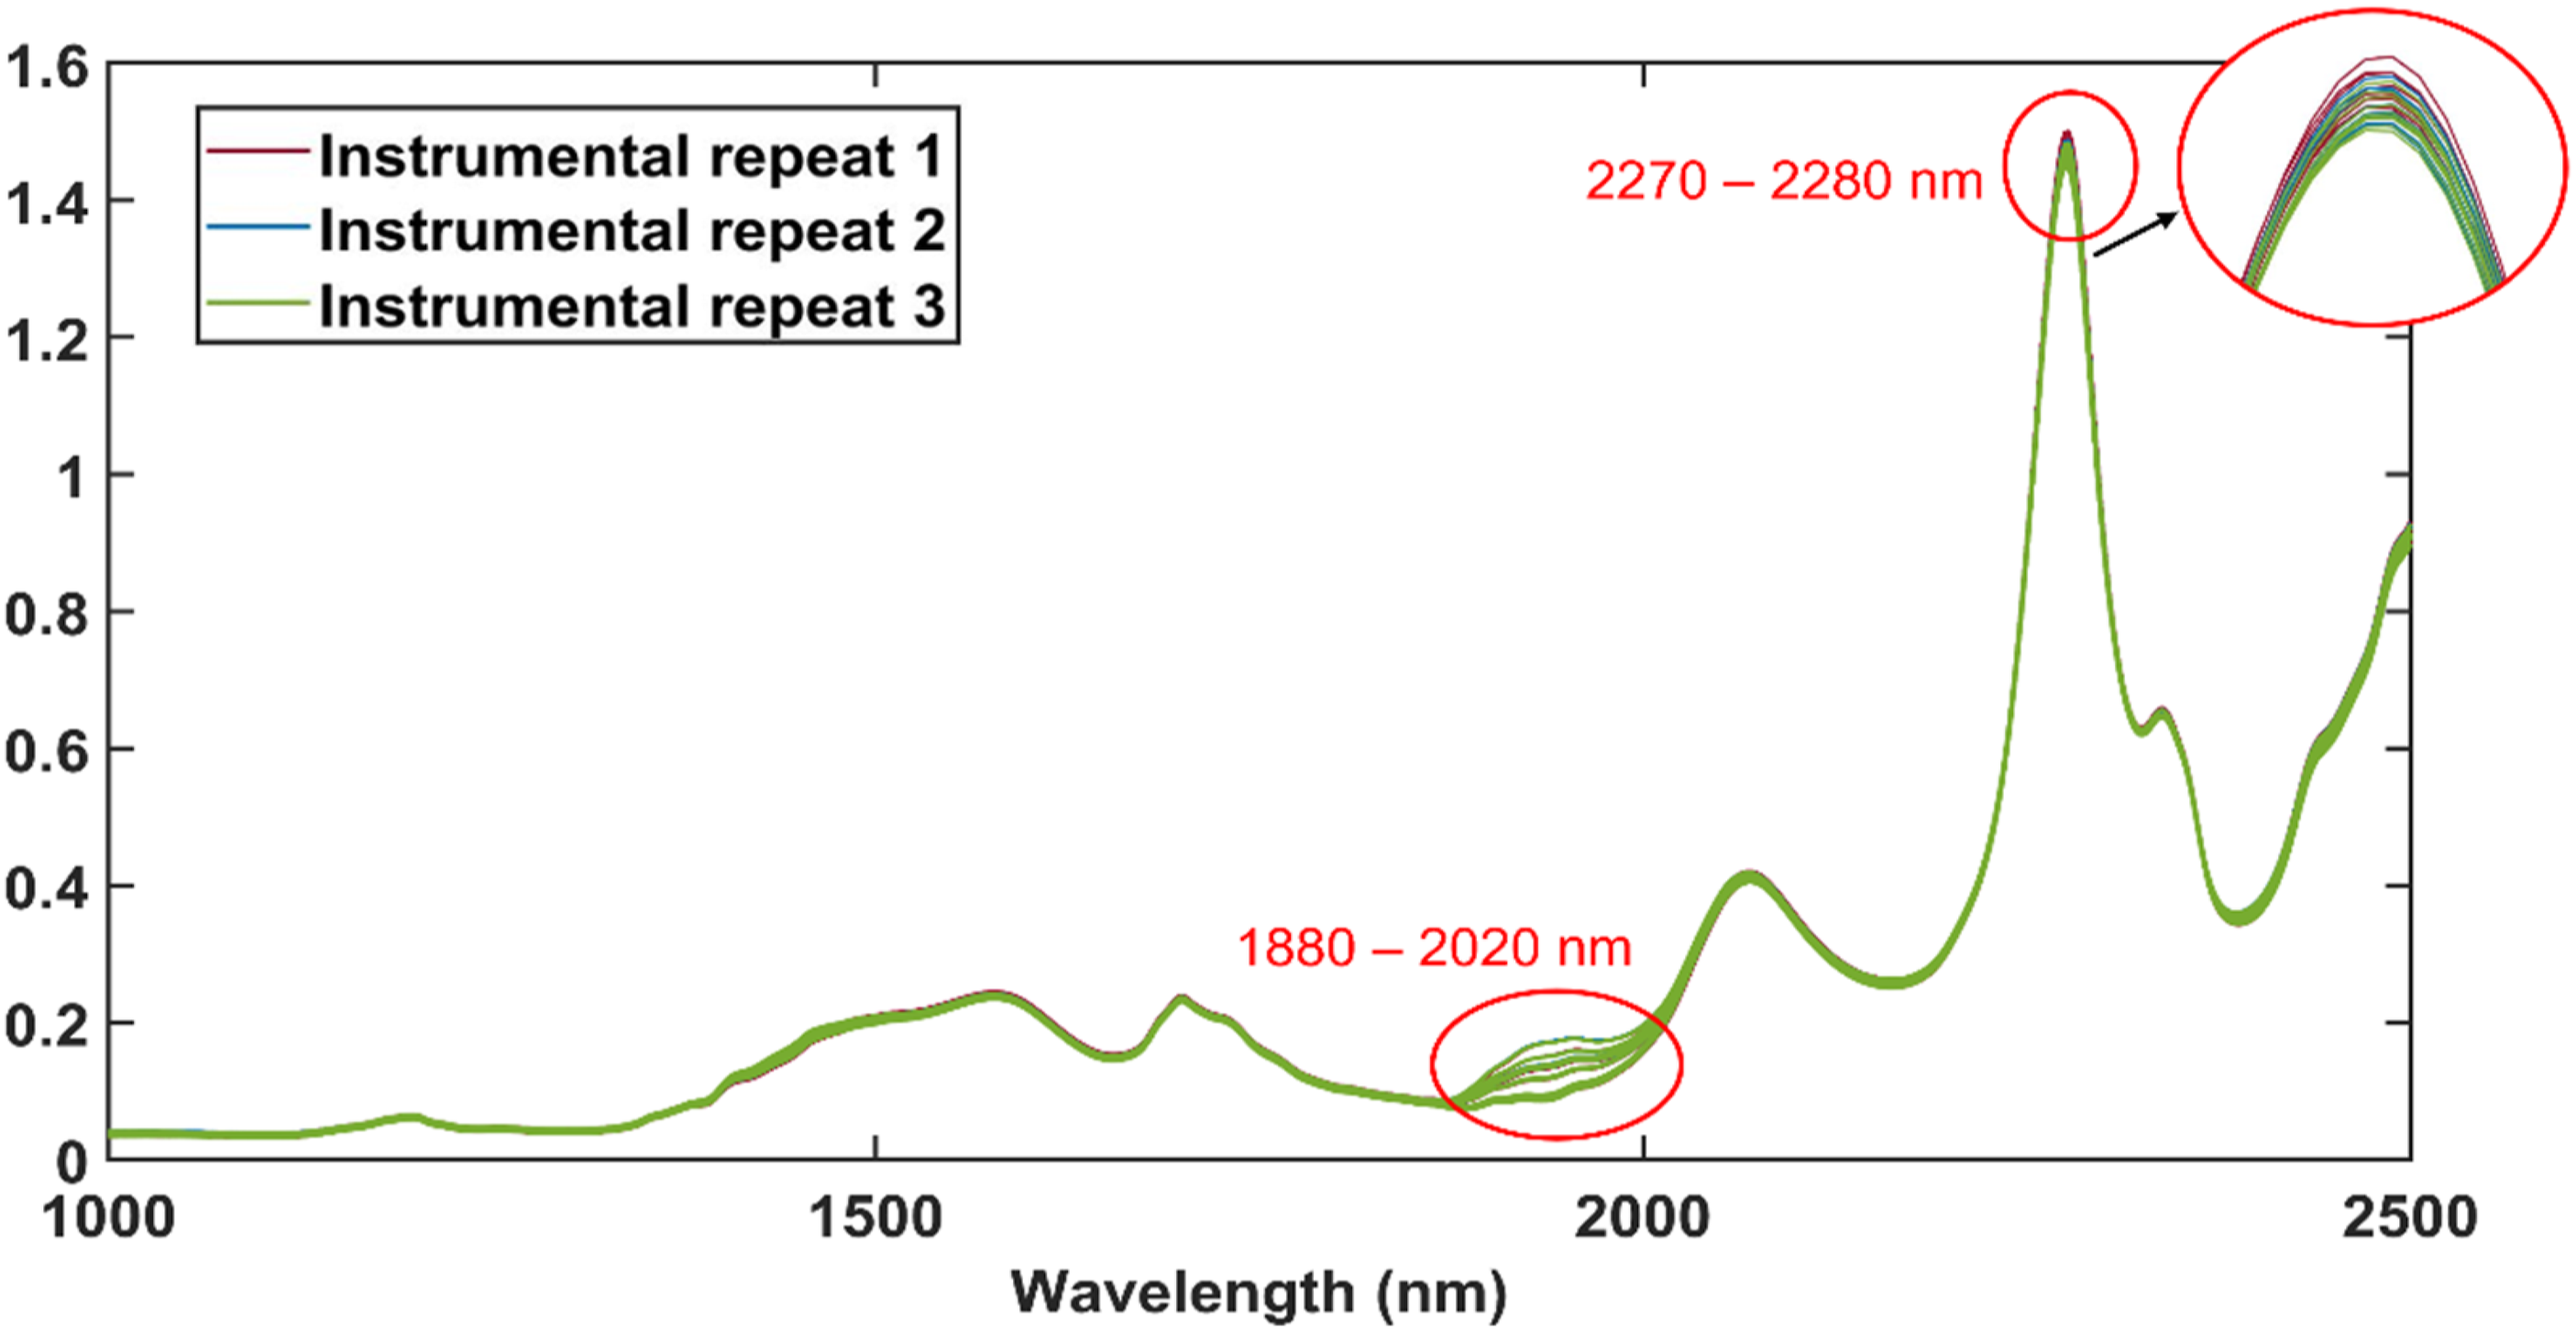
The spectral differences at 1450 nm, 1938 nm and 2277 nm were associated with the first overtone stretch of the OH bond, the OH stretching and CH bending combination band and the antisymmetric stretching and bending combination band of the CH bond.25,43 The symmetric stretching and bending combination band of the CH bond was responsible for the spectral differences at 2339 nm and the differences at 2432 nm were caused by the second overtone symmetric bending umbrella vibration of the CH bond.25,43 These differences between the methanol spectra may have been caused by changes in the volume of the samples, temperature, evaporation and/or the effect of illumination perturbation.
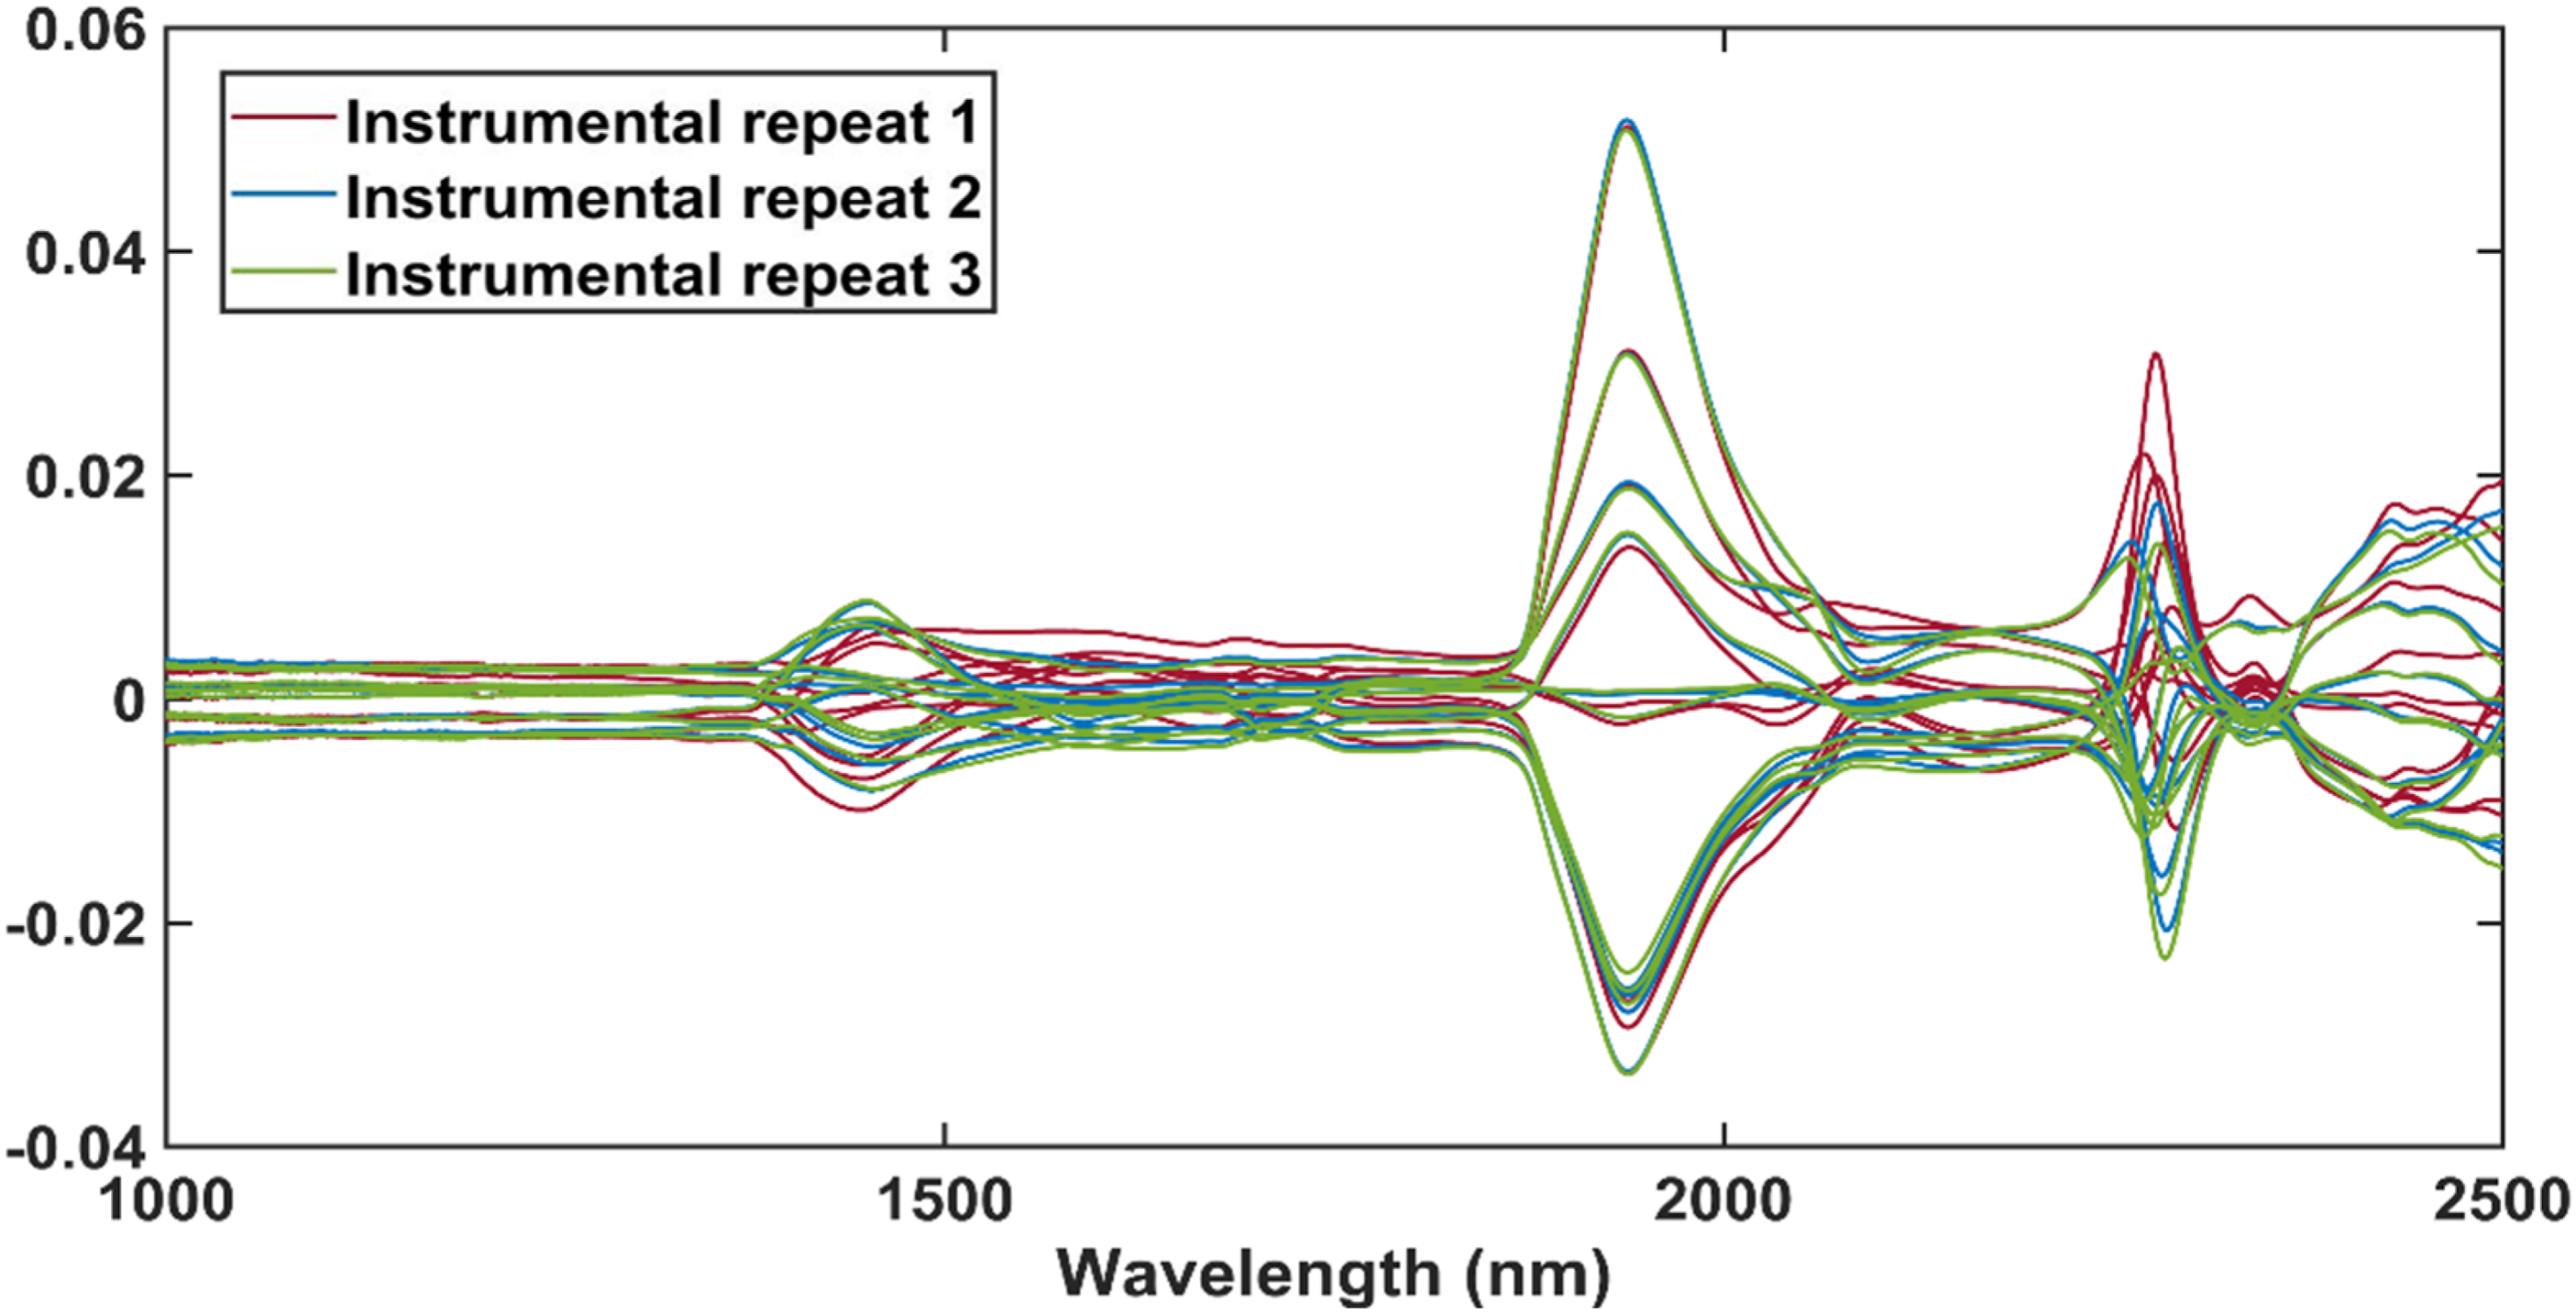
The spectra in Figure 7 were calculated using equation (2) and the peaks of the difference spectra illustrate the effect of illumination perturbation on the absorbance spectra of methanol. The methanol spectra changed with each subsequent exposure to NIR energy, and the largest change occurred between the spectra of instrumental repeat 1 (red) and instrumental repeat 2 (blue). The spectra of instrumental repeat one was taken before the sample was exposed to NIR energy and the spectra of instrumental repeat two was taken after the sample was exposed to NIR energy for the first time, which explained the larger difference between these spectra. With each exposure to NIR energy, the absorbance at wavelengths associated with bound OH groups (1595 nm) decreased and increased at the wavelengths associated with free OH groups (1420 nm).
43
These changes occurred in the first overtone band region of the OH group and subsequently the combination band region of the OH group was also affected. The changes in the combination region of the OH groups were visible at 2030 nm and 2094 nm.
43
Thus, the exposure of methanol to NIR energy could have resulted in the breakage of its hydrogen bonds. The difference spectra after the mean spectrum of methanol were subtracted from the mean methanol spectra of instrumental repeat 1, instrumental repeat 2 and instrumental repeat 3.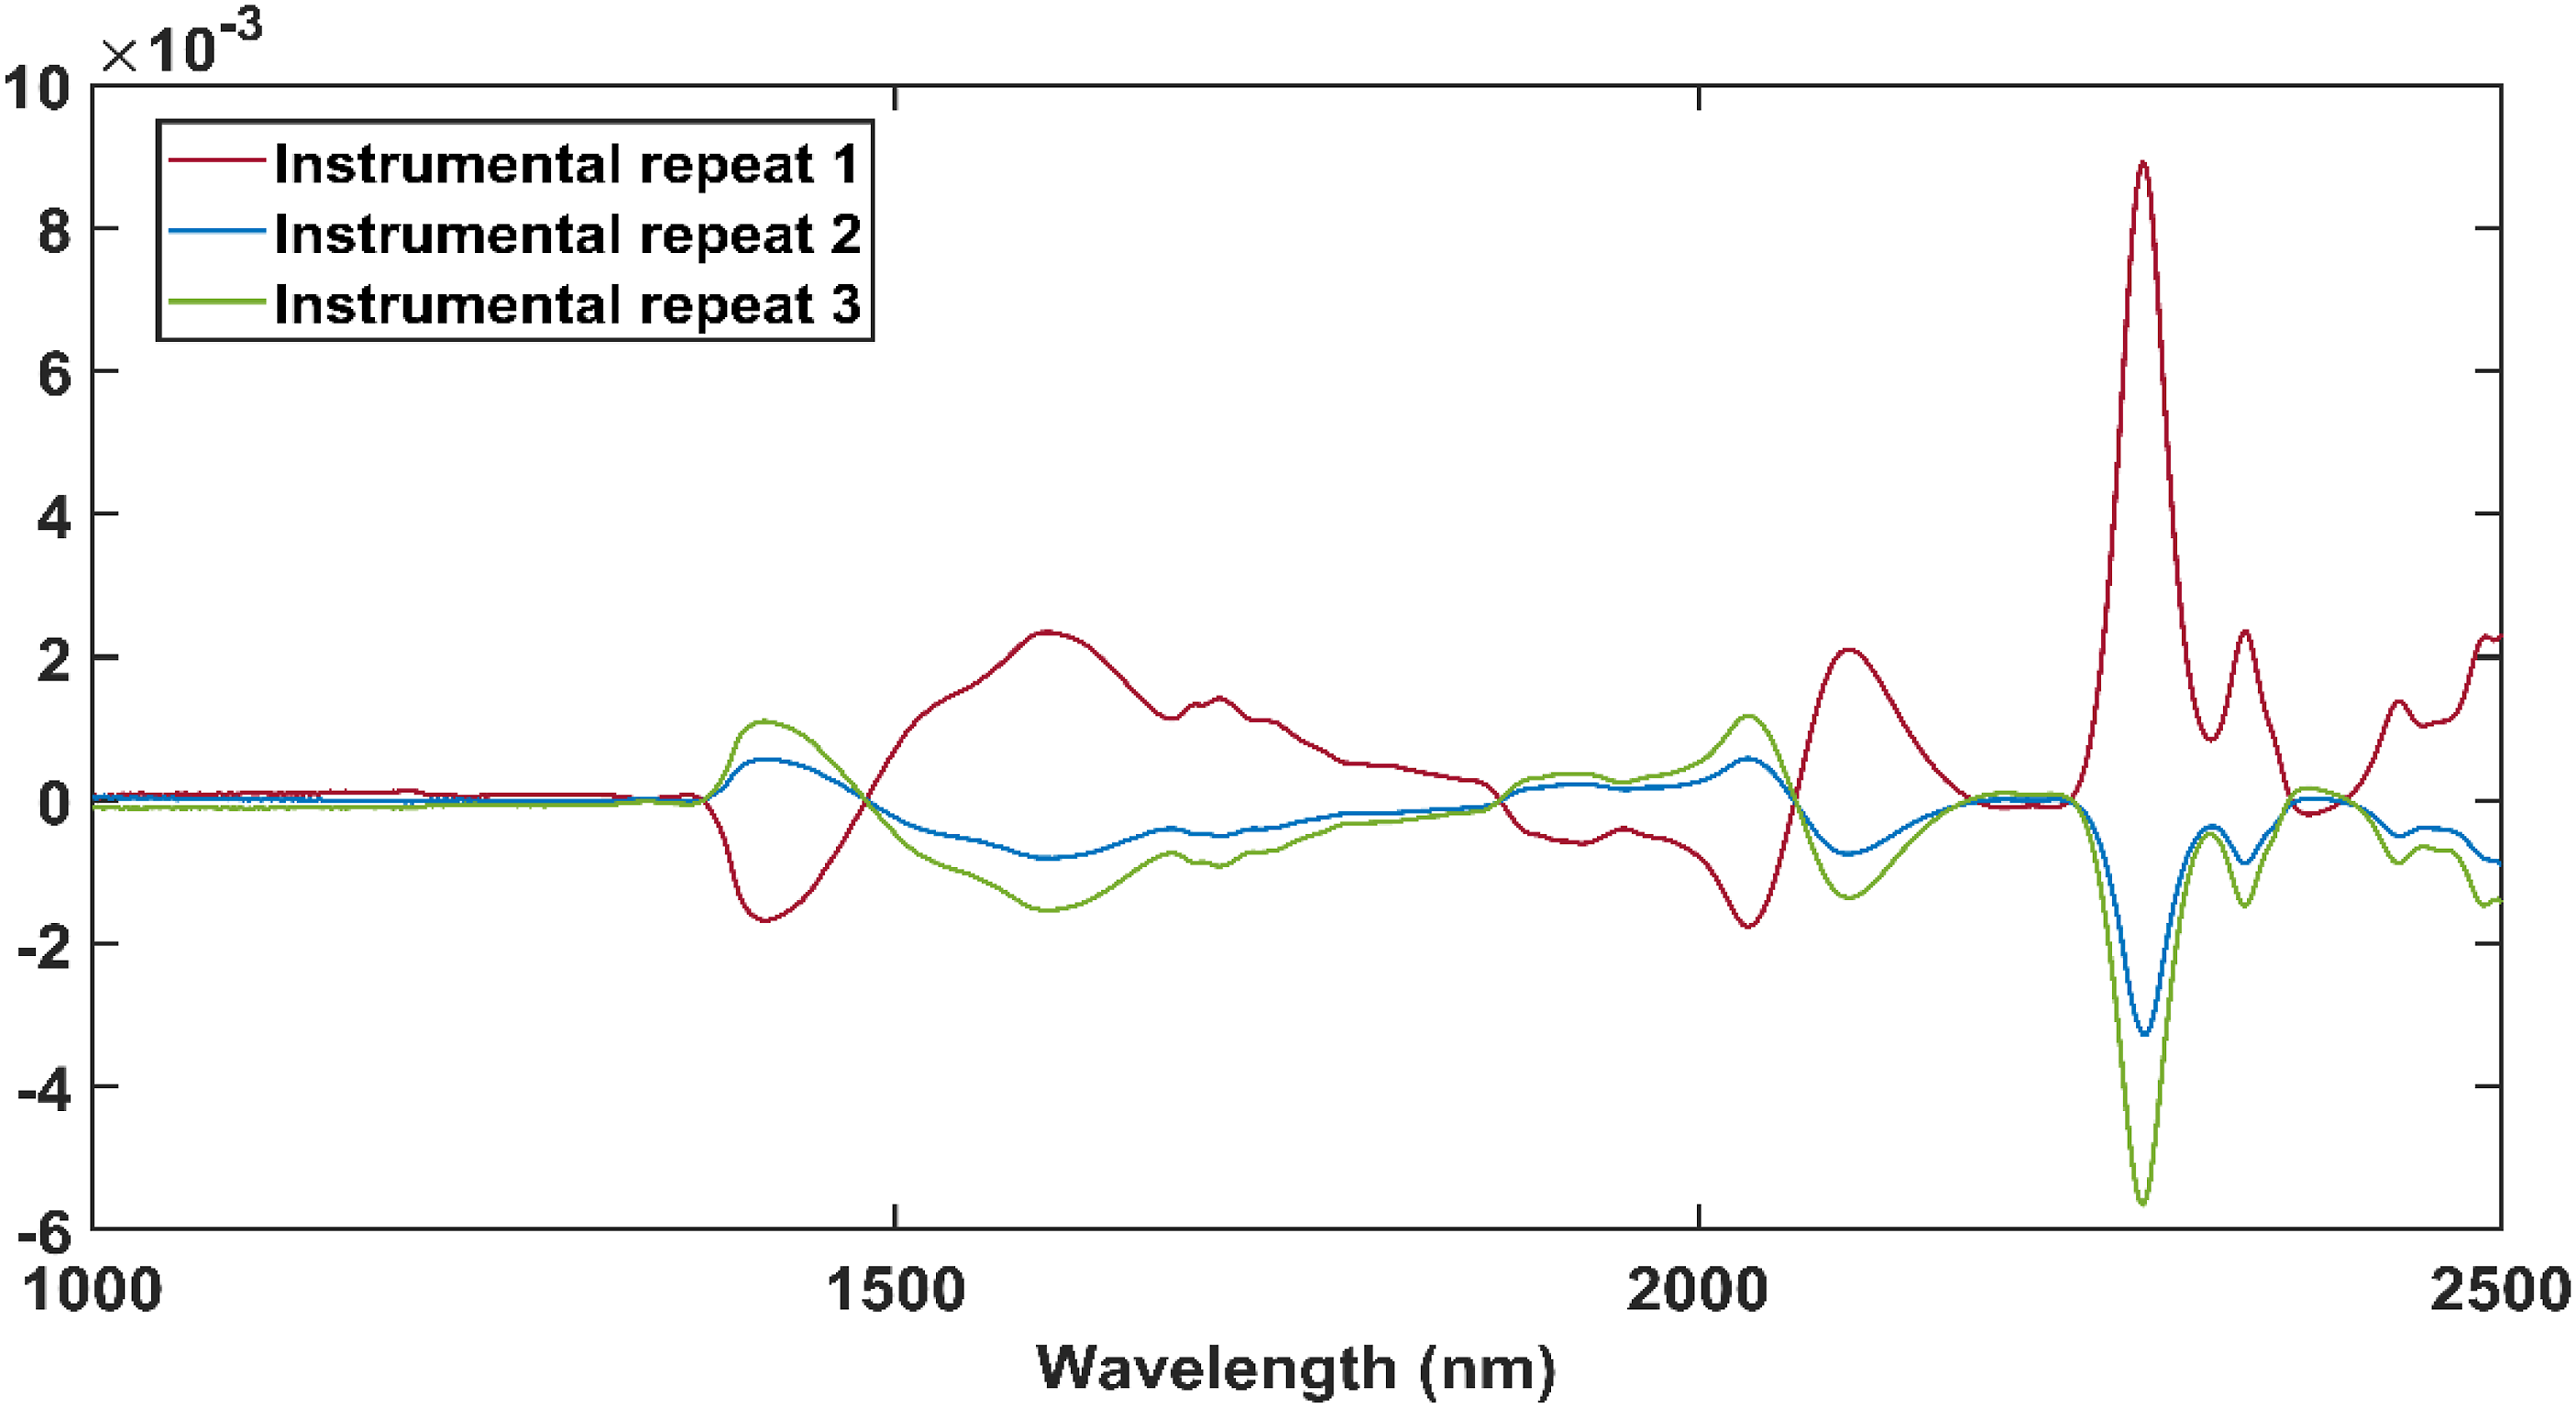
A decrease in absorbance at 2277 nm, 2341 nm and 2437 nm with each subsequent exposure to NIR energy was also observed and was associated with the change in the CH groups. 43 The change in these absorbance bands were caused either by the breakage of the CH bonds or a decrease in the amount of methanol due to evaporation. It was concluded that illumination perturbation could have influenced the methanol spectra and therefore these changes must be considered when the FB1 absorbance bands are identified.
The difference between the FB1 solution spectra and the spectra of the methanol-only samples were calculated using equation (3) and are presented in Figure 8. The difference spectra had peaks at 1442 nm, 1938 nm, 2277 nm and 2427 – 2460 nm. These peaks occurred at similar wavelengths as those affected by changes in methanol (Figure 6). It was therefore concluded that the spectral differences observed in Figure 8 were the result of the changes in methanol between the samples and not the presence of FB1. Thus, methanol was responsible for the largest variation between the spectra and the absorbance bands of FB1 could not be determined by simple spectral subtraction. More advanced chemometric methods were therefore required to identify the unique FB1 absorbance bands. The difference spectra after the spectra of each methanol-only sample were subtracted from its corresponding FB1 solution samples.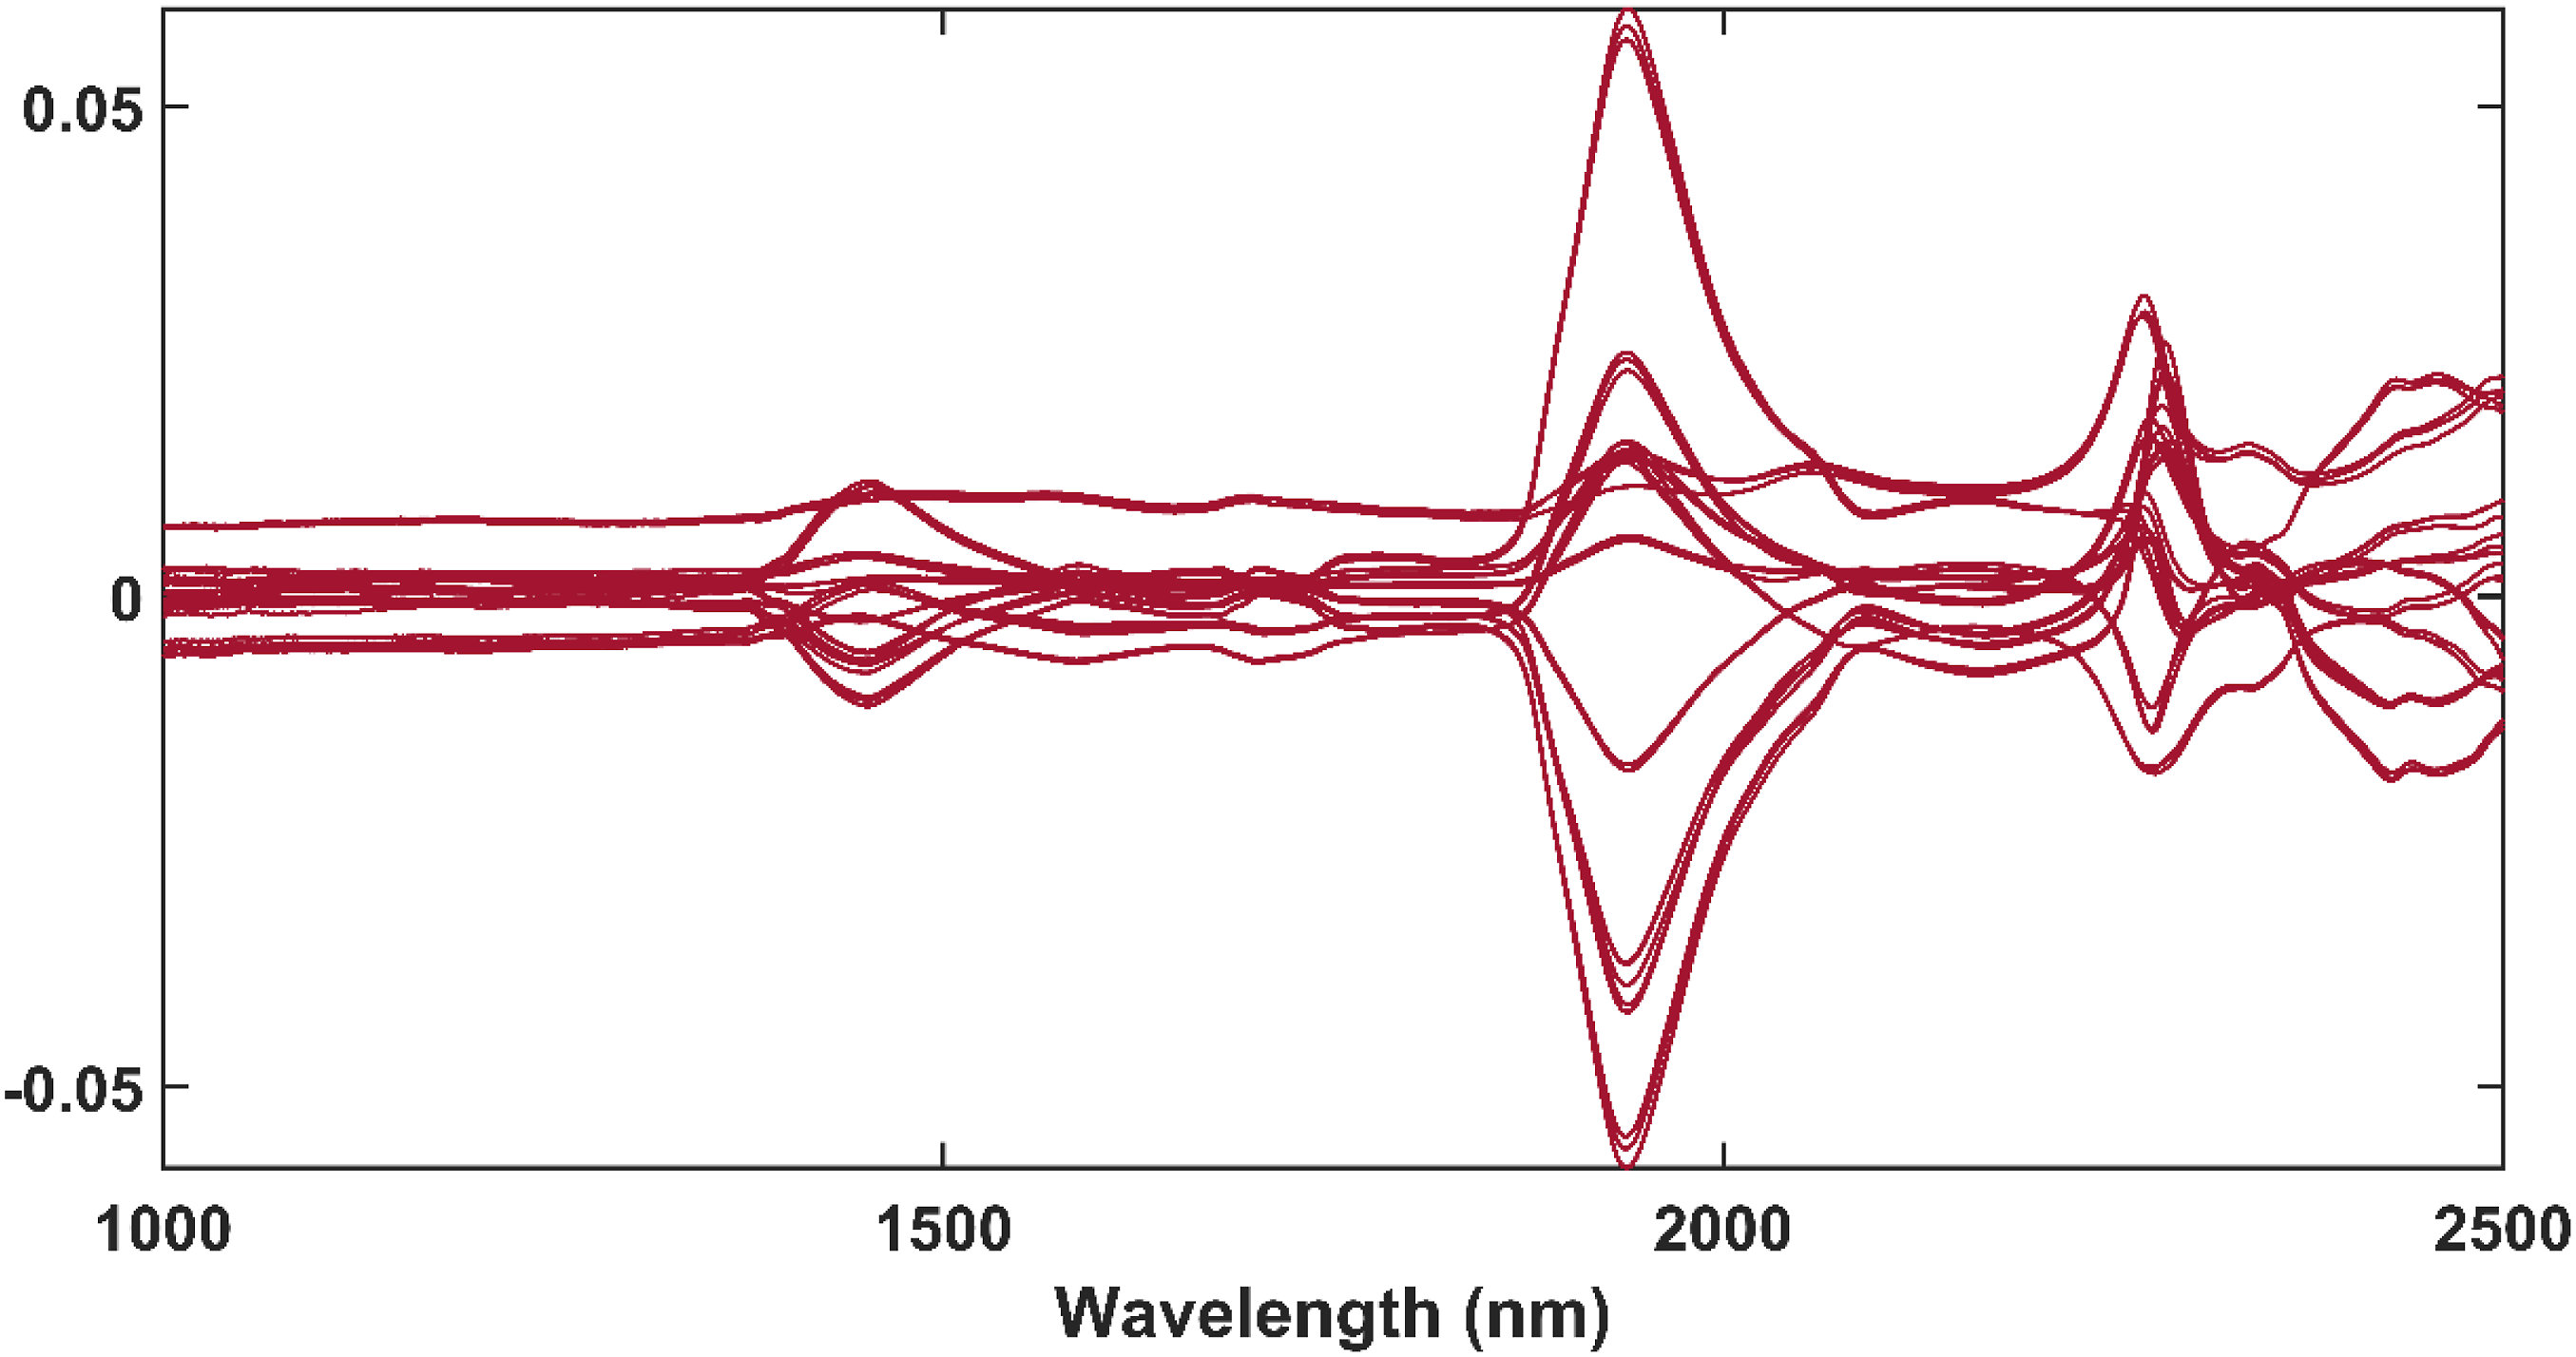
Principal component analysis
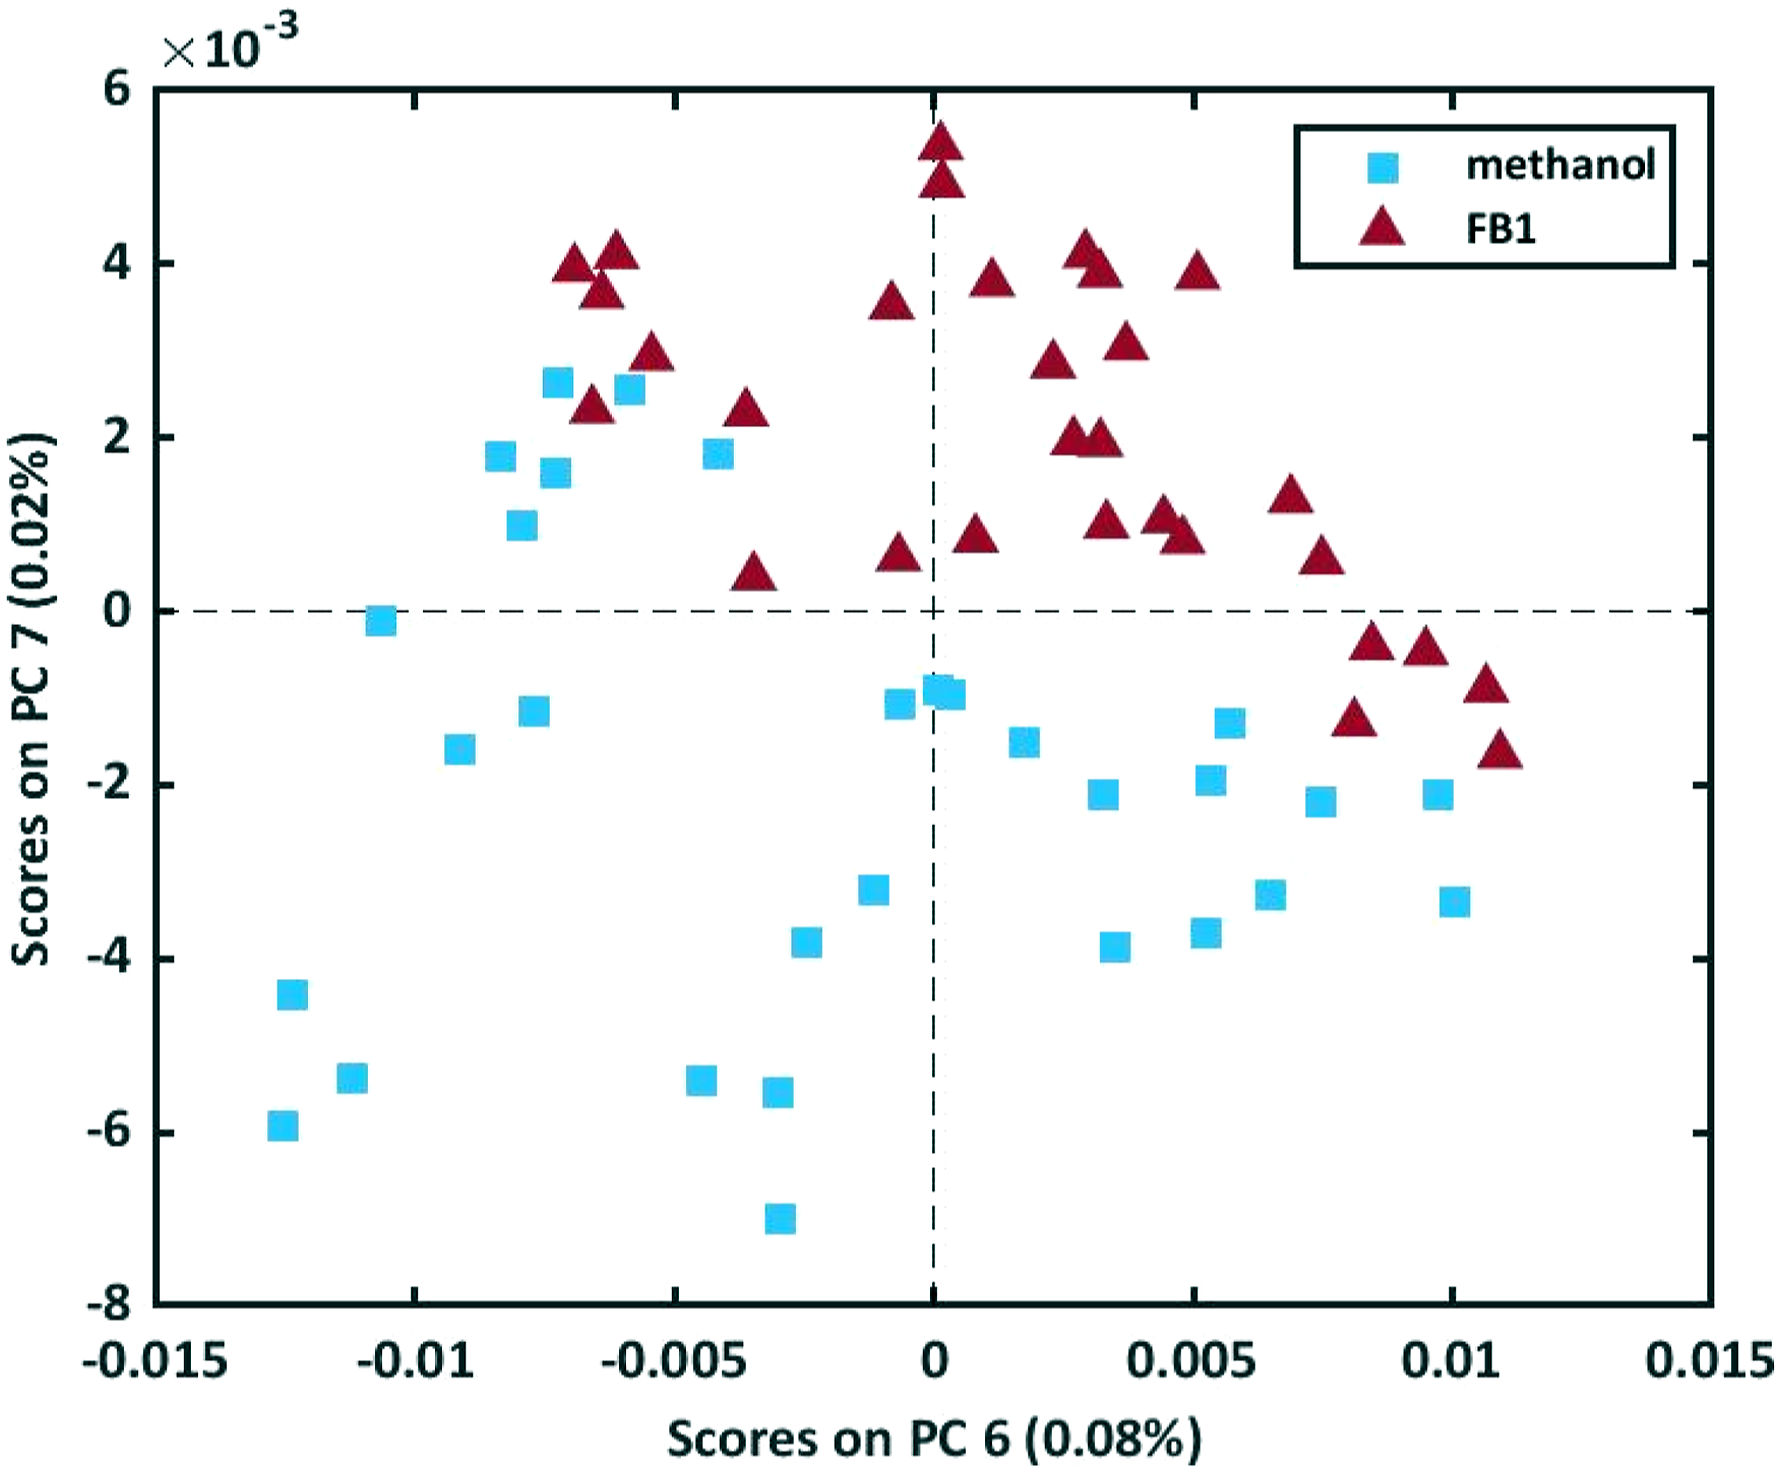
A PCA model was constructed on the raw spectral data and the scores plots of the model are presented in Figure 9. From the scores plots it was clear that PC 7 (0.02%) obtained the best separation between the methanol-only and the FB1 solution samples and the scores plot of PC 6 (0.08%) against PC 7 obtained an even better separation (Figure 10). The scores plot of PC1 against PC2 – PC7 of the PCA model computed on the raw data. The scores plot of PC 6 and PC 7 of the PCA model computed on the raw data of the 30 FB1 solution samples and the 30 methanol-only samples.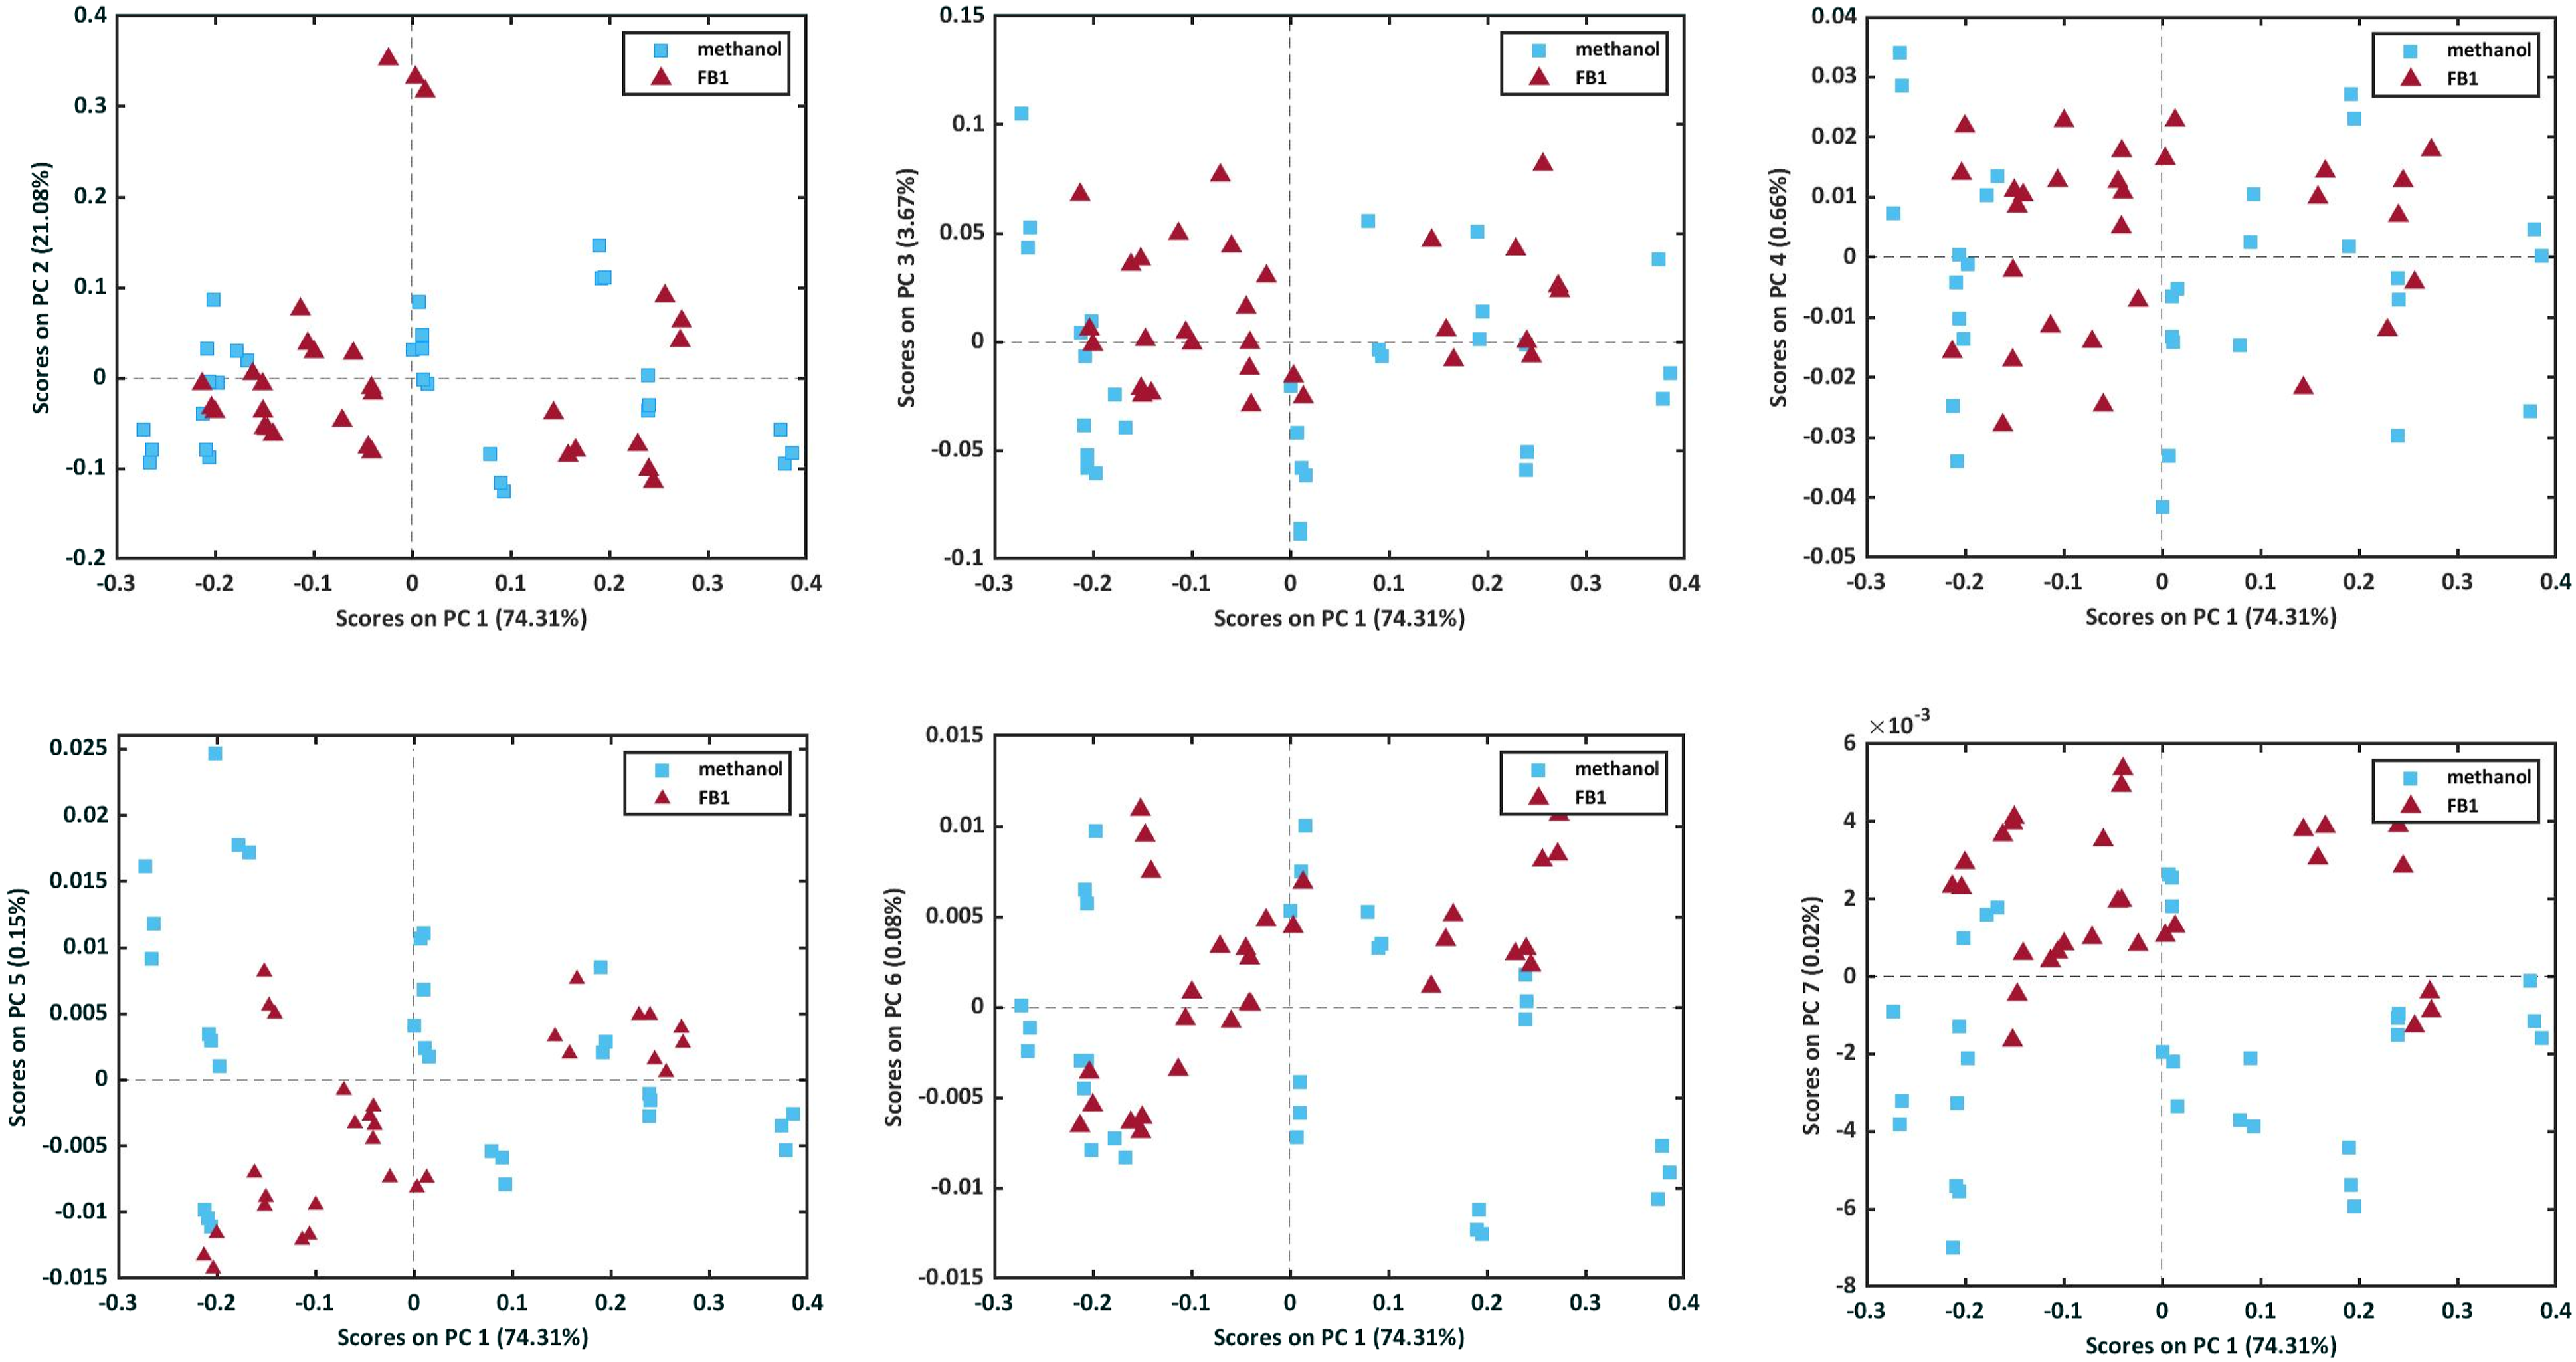
MSC, SNV and SG were applied to the data. The SNV and MSC pre-processed PCA models delivered very similar results and were able to obtain the best separation between the samples when plotting the scores of PC 5 (0.06%) against those of PC 6 (0.04%) (Figure 11). Three FB1 solution samples did, however, occur in the same area as the methanol-only samples and were identified as potential outliers, requiring further investigation. The scores plot of PC 5 and PC 6 of the PCA model computed on the MSC pre-processed spectra of the 30 FB1 solution samples and the 30 methanol-only samples.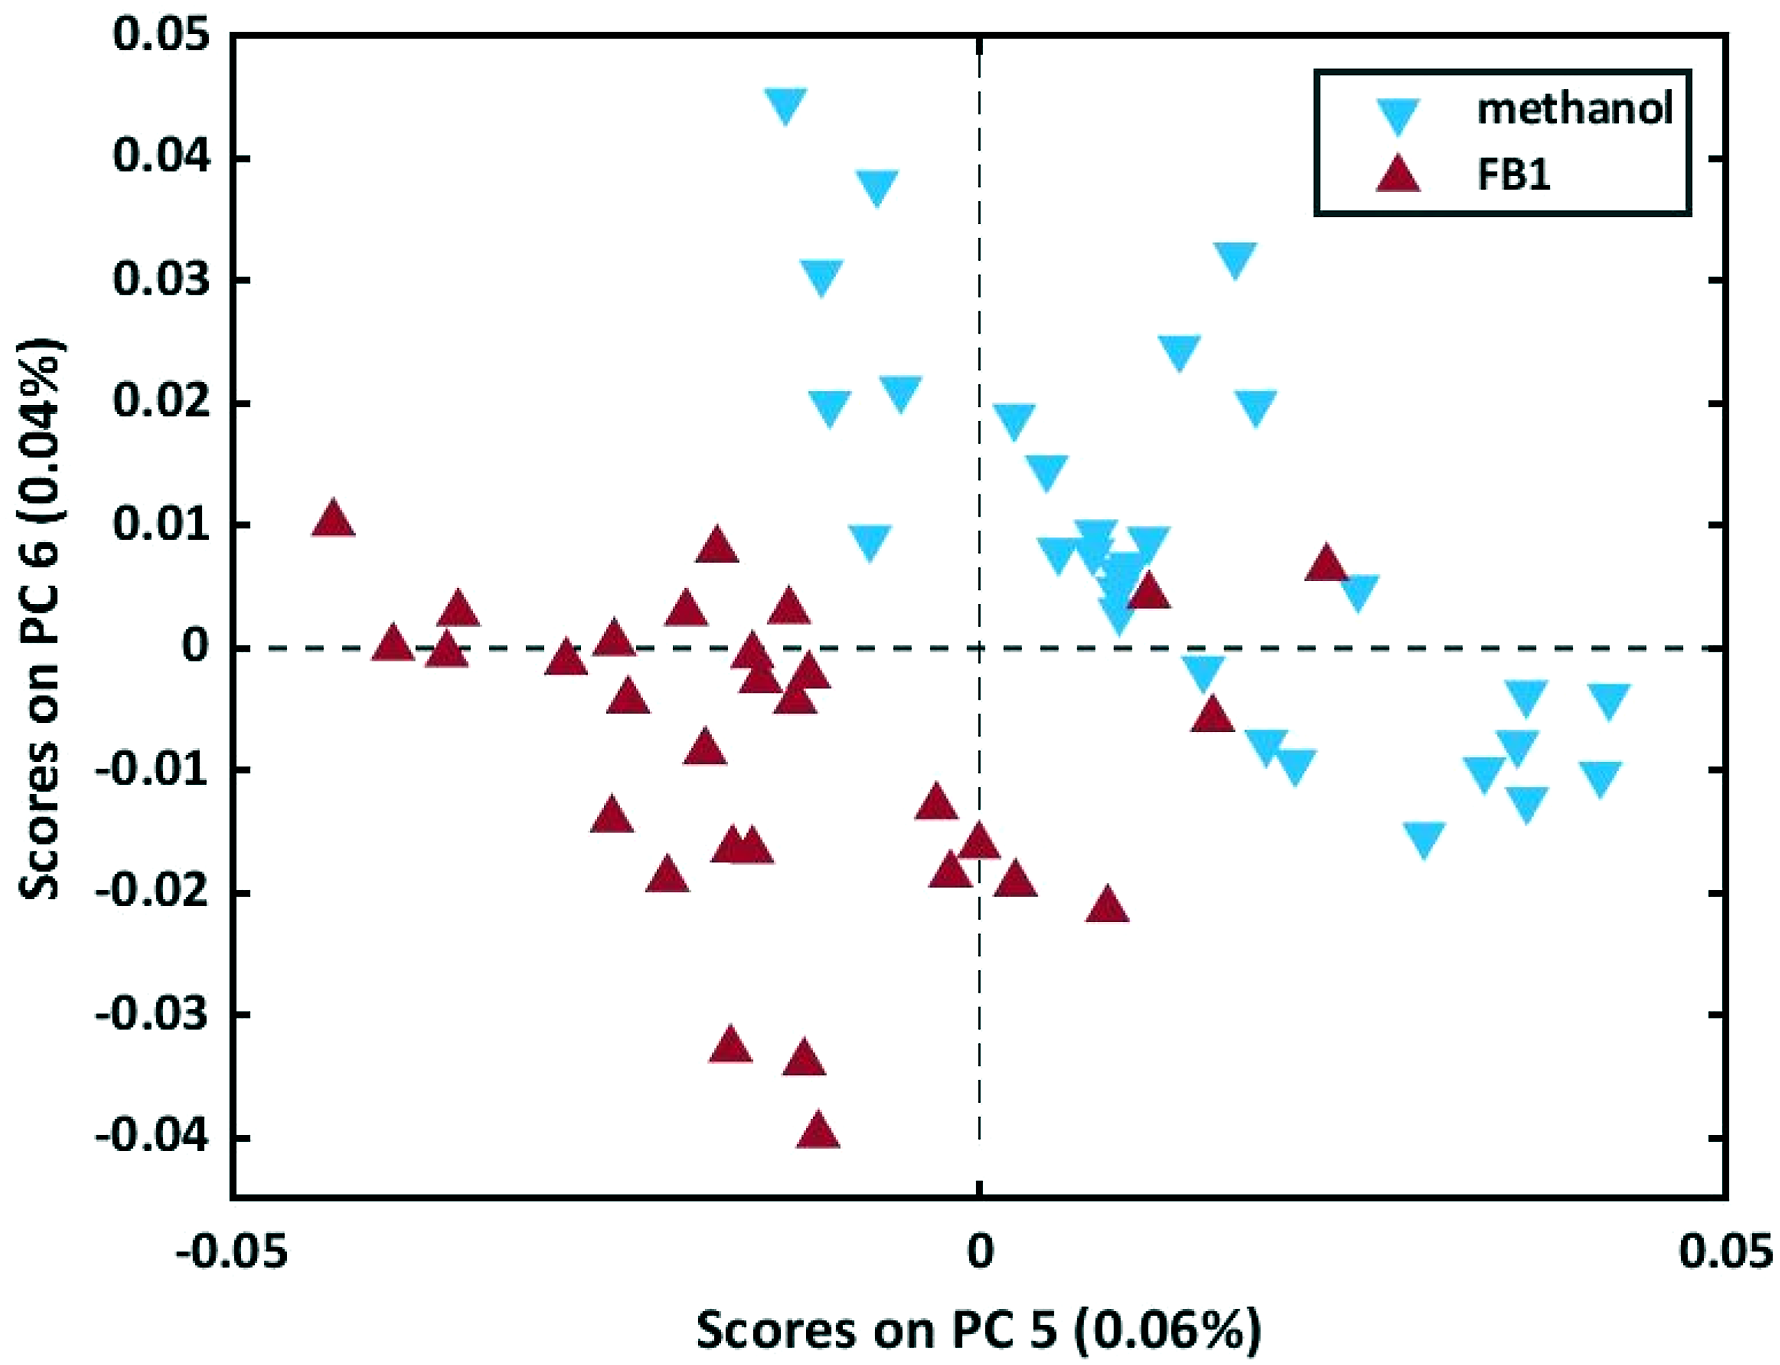
Despite the potential outliers, the MSC and SNV pre-processed models were still able to separate the samples well with a smaller number of PCs than the model constructed on the raw data. The SG pre-processed model was not able to separate the samples as well as the SNV and MSC pre-processed models and therefore the MSC pre-processed PCA model was chosen for further analysis. Although the PCs used for separation in this model explained a very small amount of the variation (0.10%), this was expected since FB1 was present at very low levels and the changes in methanol were responsible for the largest differences between the spectra.
The loadings of PC 5 and PC 6 are given in Figure 12. Since most of the FB1 solution samples had negatives score values for PC 5 and PC 6, the wavelengths which had negative loading values for each of these PCs, were identified as potentially important wavelengths at which FB1 absorbs NIR energy. These wavelengths included 1400 – 1600 nm, 2024 – 2082 nm and 2240 – 2274 nm. Both loadings had a large peak at 2262 nm, which indicated that this wavelength has a particularly strong correlation with FB1. To confirm that the FB1 bands does occur at these wavelengths, PLS-DA models were computed. The loadings of PC 5 and PC 6 of the PCA model computed on the MSC pre-processed spectra of the FB1 solution samples and the methanol-only samples.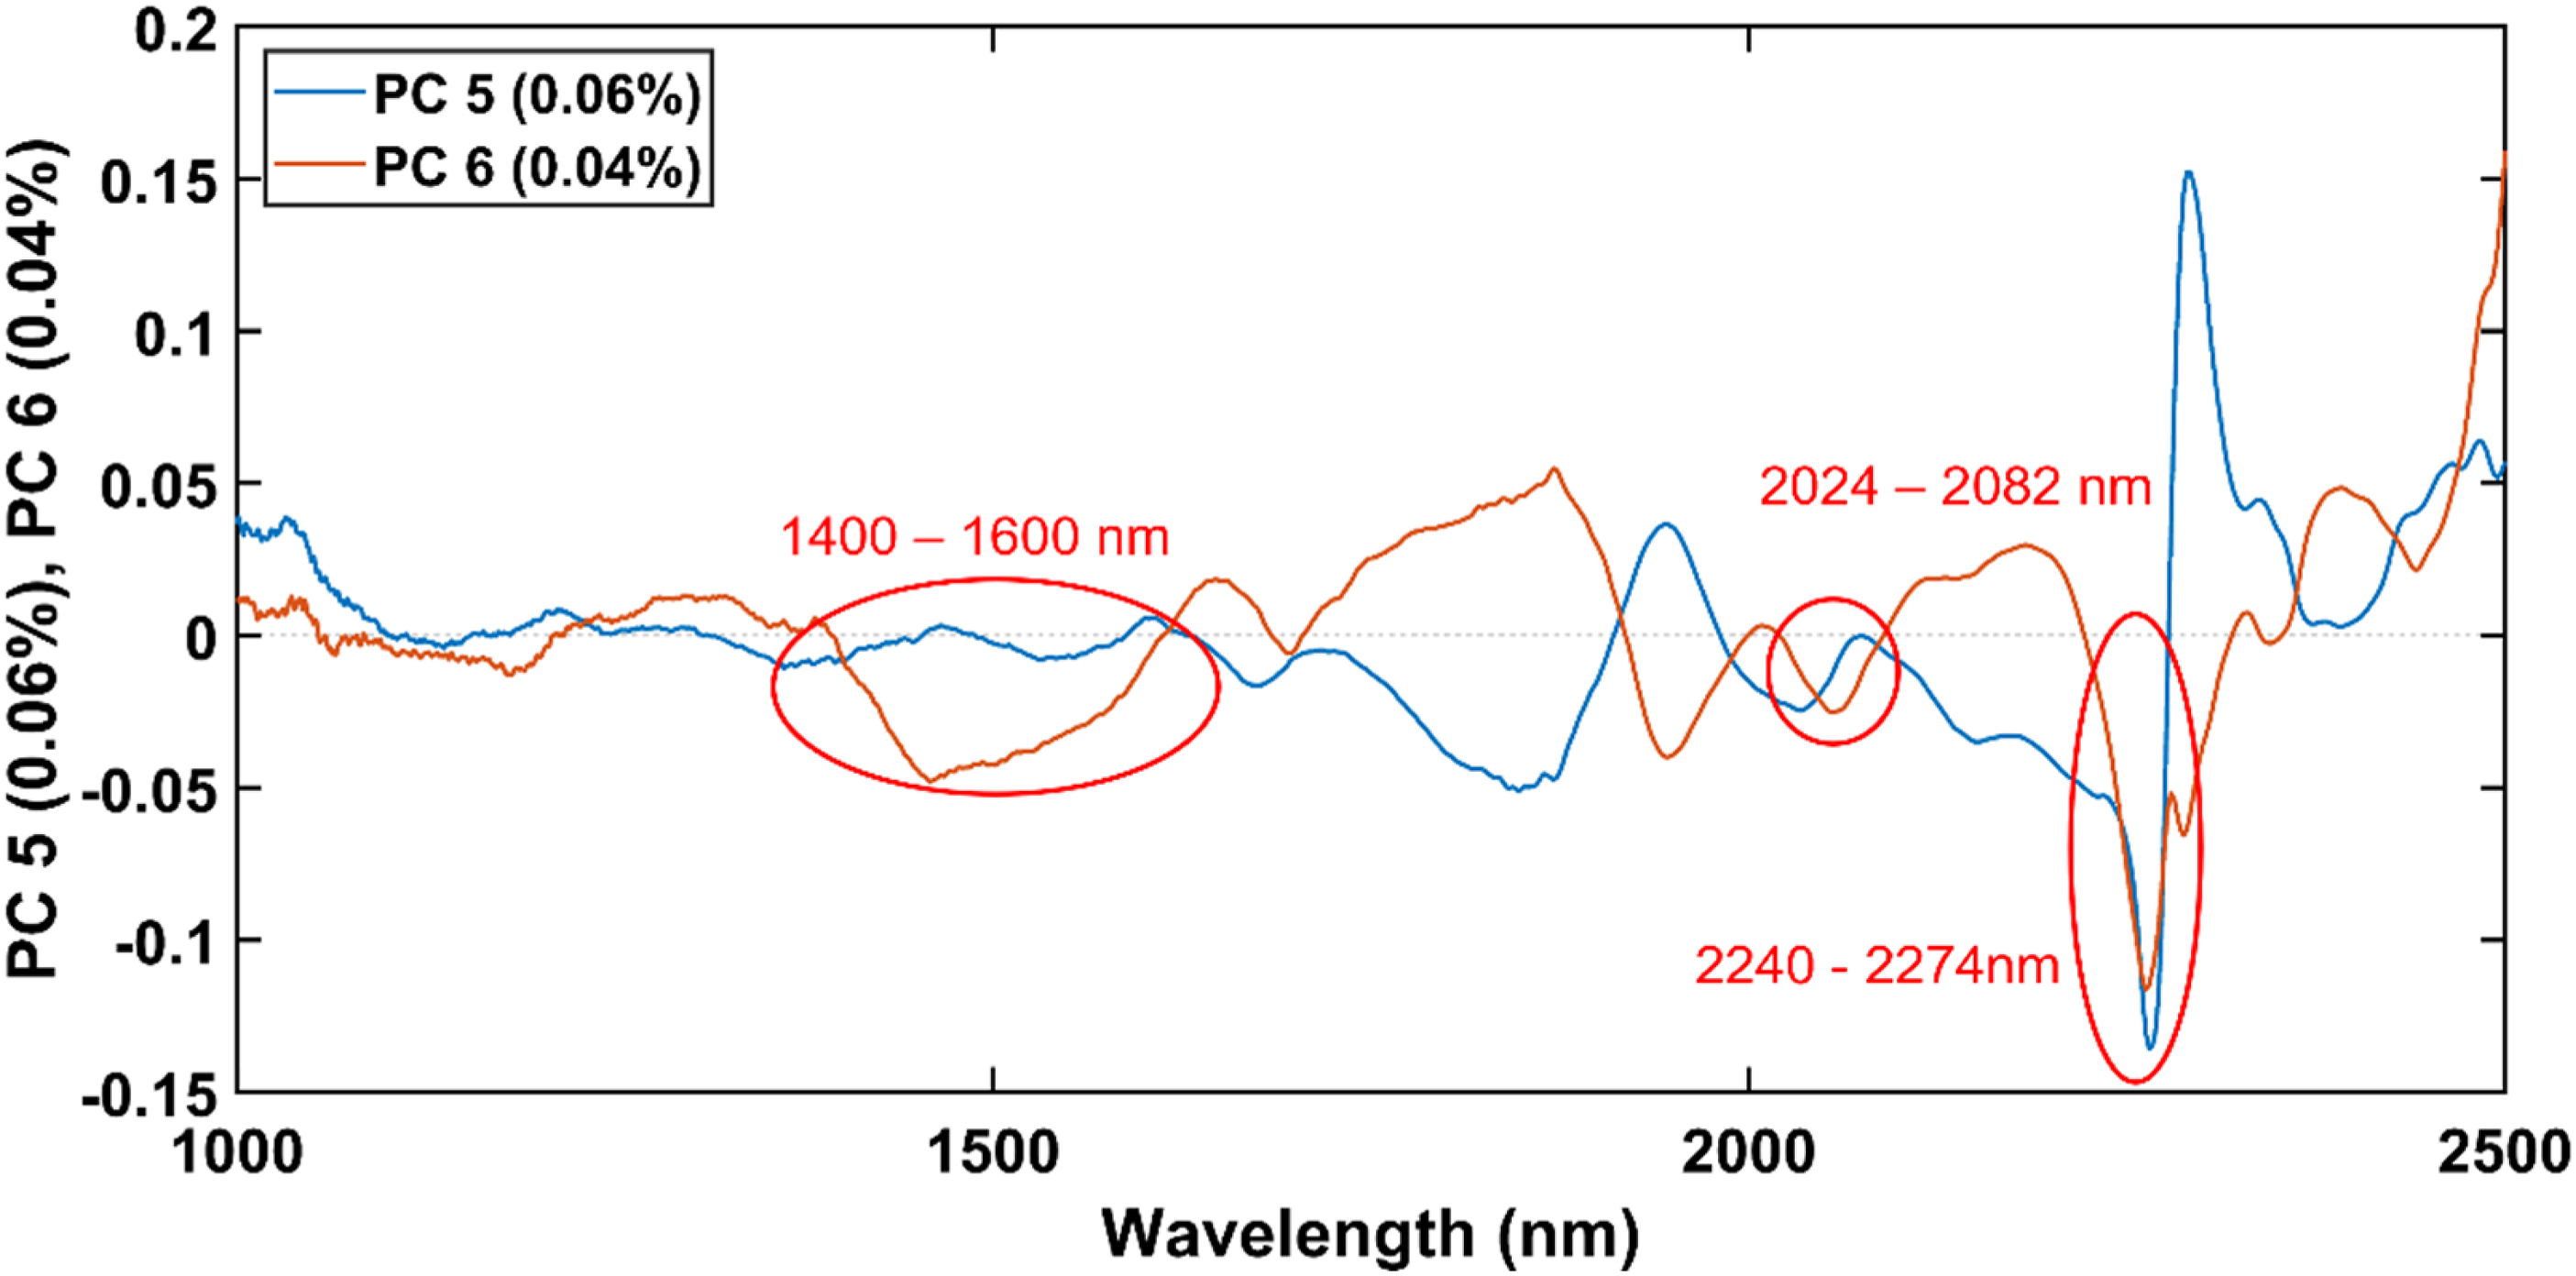
Partial least squares discriminant analysis
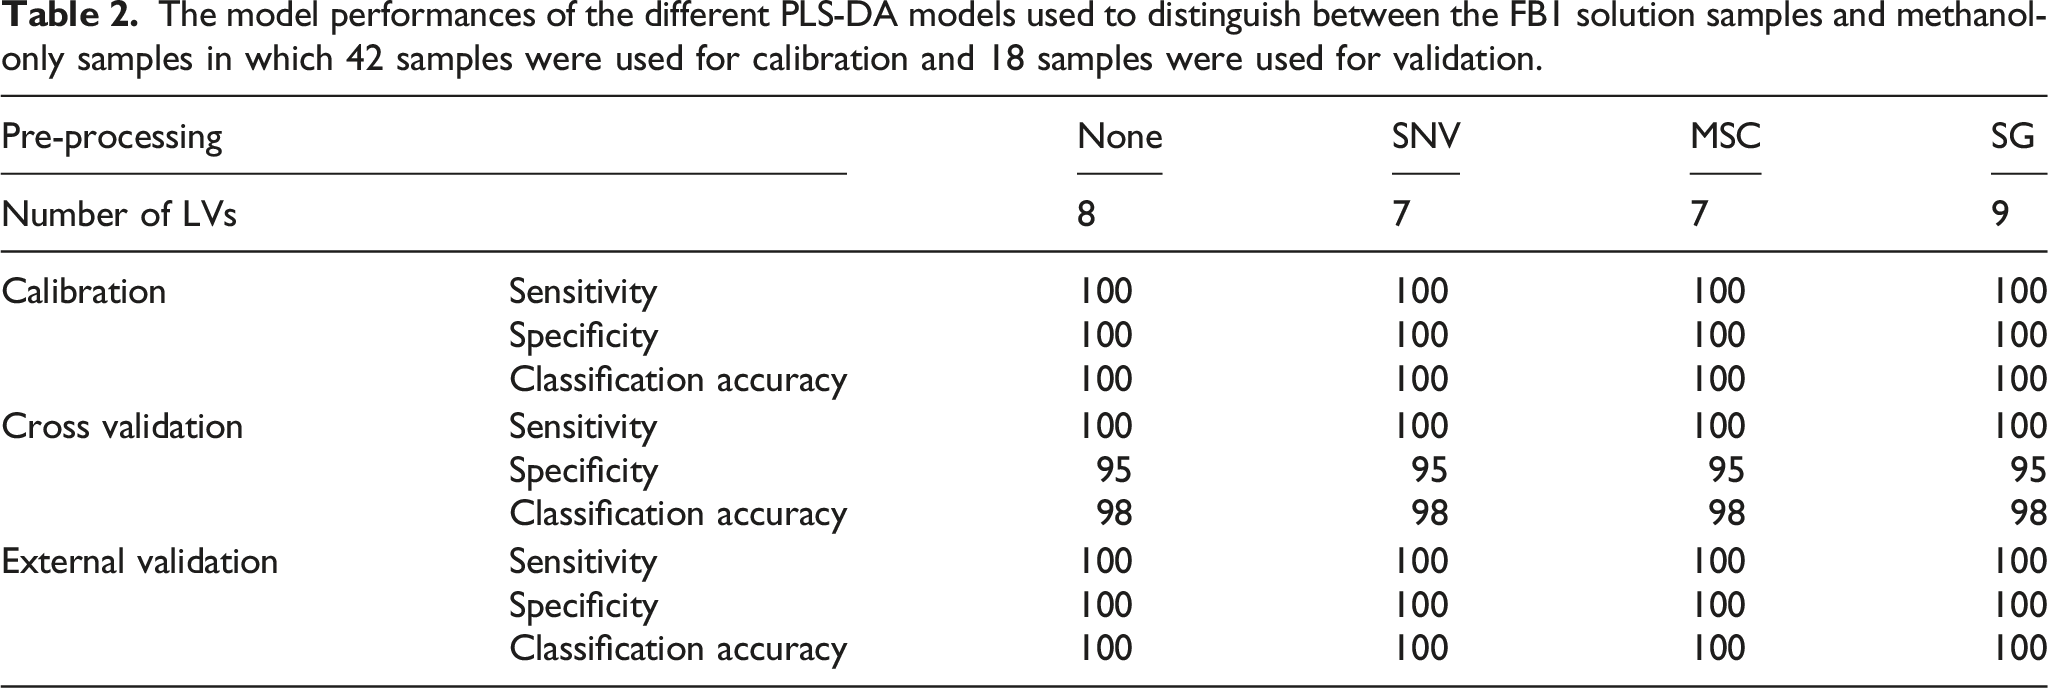
The model performances of the different PLS-DA models used to distinguish between the FB1 solution samples and methanol-only samples in which 42 samples were used for calibration and 18 samples were used for validation.
Three samples were identified as possible outliers in Figure 11 and the model was reconstructed without these samples. The new PLS-DA model was computed with 6 LVs and a perfect classification accuracy of cross validation was obtained. Due to the lower number of LVs and higher classification accuracy of cross validation, the samples were confirmed as outliers and the regression coefficients of the model computed without these samples (Figure 13), were used to determine the wavelengths at which FB1 absorbs. The regression vector of the PLS-DA model computed on the MSC pre-processed spectra of the FB1 solution samples and the methanol samples, after the three outlier samples of the FB1 solution were removed.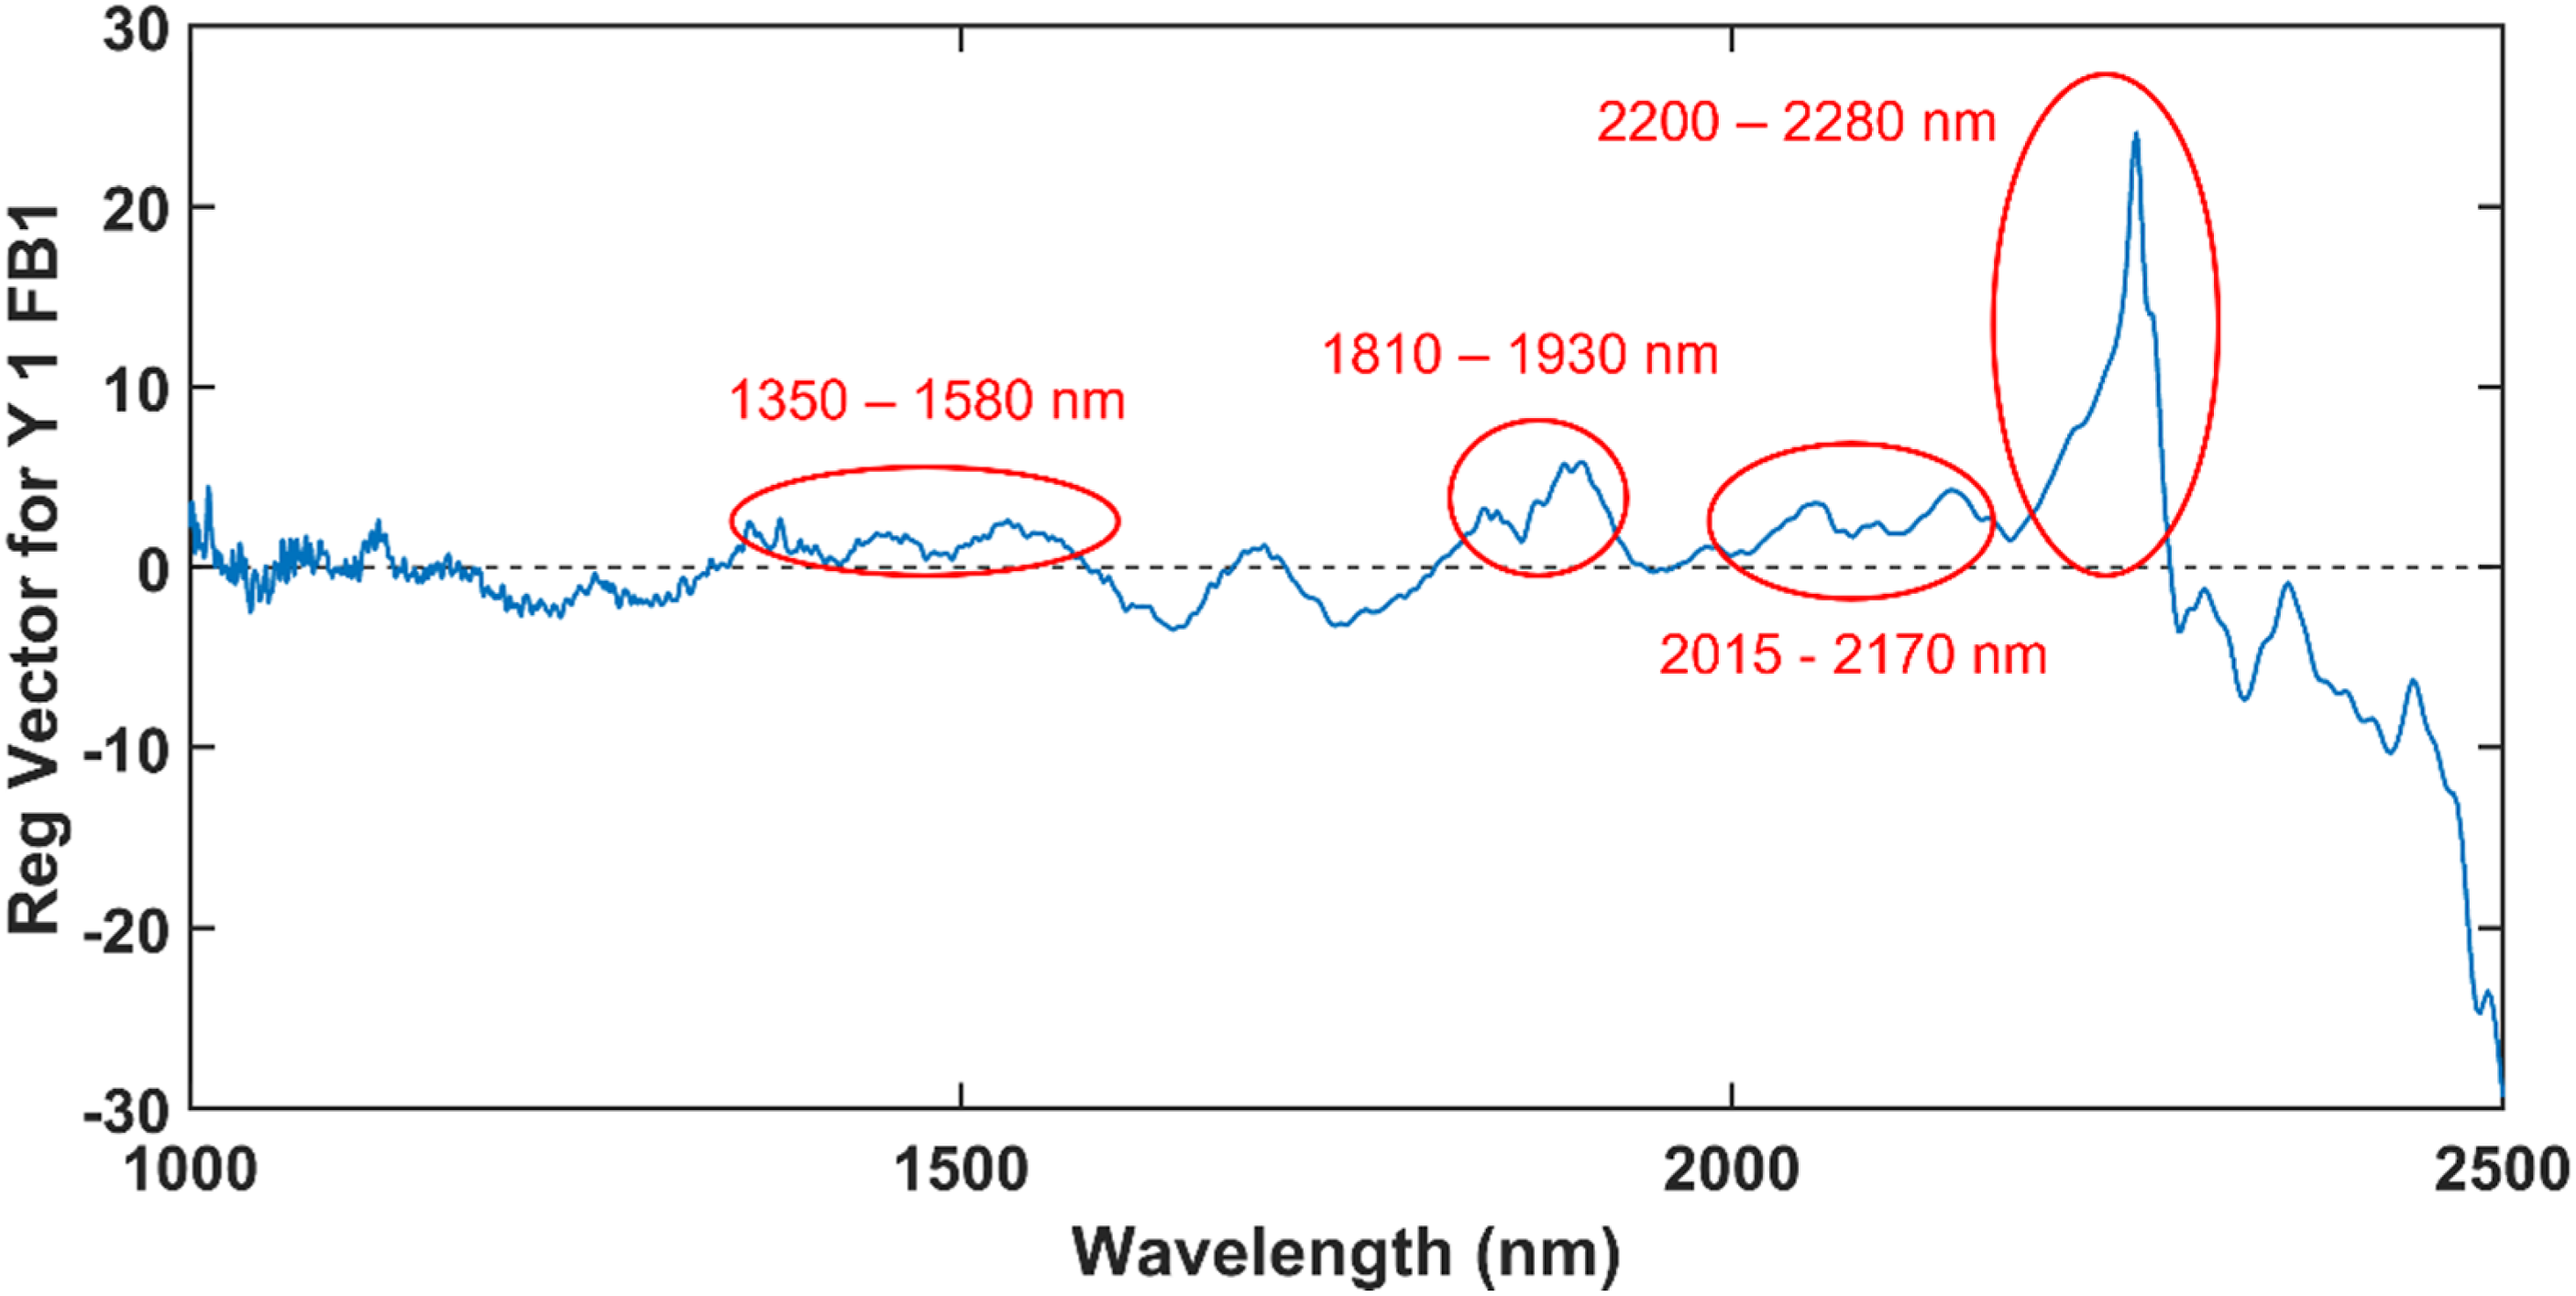
The wavelengths in the ranges of 1350–1580 nm, 1810 – 1930 nm, 2015 – 2170 nm and 2200 – 2280 nm was selected as possible FB1 band positions. Of these, 2262 nm was especially important since it had a very large regression coefficient and was also identified as an important wavelength in the loadings of both PC 5 and PC 6 (Figure 12). Although it was possible to identify that the band at 2262 nm played an important role in the detection of FB1, it was difficult to identify other important bands, since the regression vector included several irrelevant wavelengths. Variable selection methods were therefore required to discard irrelevant wavelengths and improve the identification of important bands.
Variable selection
The automatic VIP and/or SR ratio function successfully reduced the number of wavelengths from 1501 to 454 and selected the wavelengths: 1000 – 1048, 1050 – 1053, 1060, 1062 – 1064, 1408 – 1460 nm, 1788 – 1905, 2016 – 2056, 2134 – 2159, 2166 – 2168, 2191 – 2354, and 2374 – 2500. The function removed the wavelengths which had the lowest VIP score and/or SR ratio and whose inclusion resulted in a lower model performance. A new model was computed with the selected wavelengths. Six LVs were computed and a classification accuracy of 100% was obtained for both the calibration and external validation sets. The regression vector of the model after wavelength selection is presented in Figure 14. The regression vector of the PLS-DA model computed on the 454 wavelengths which were selected with the VIP and/or SR function.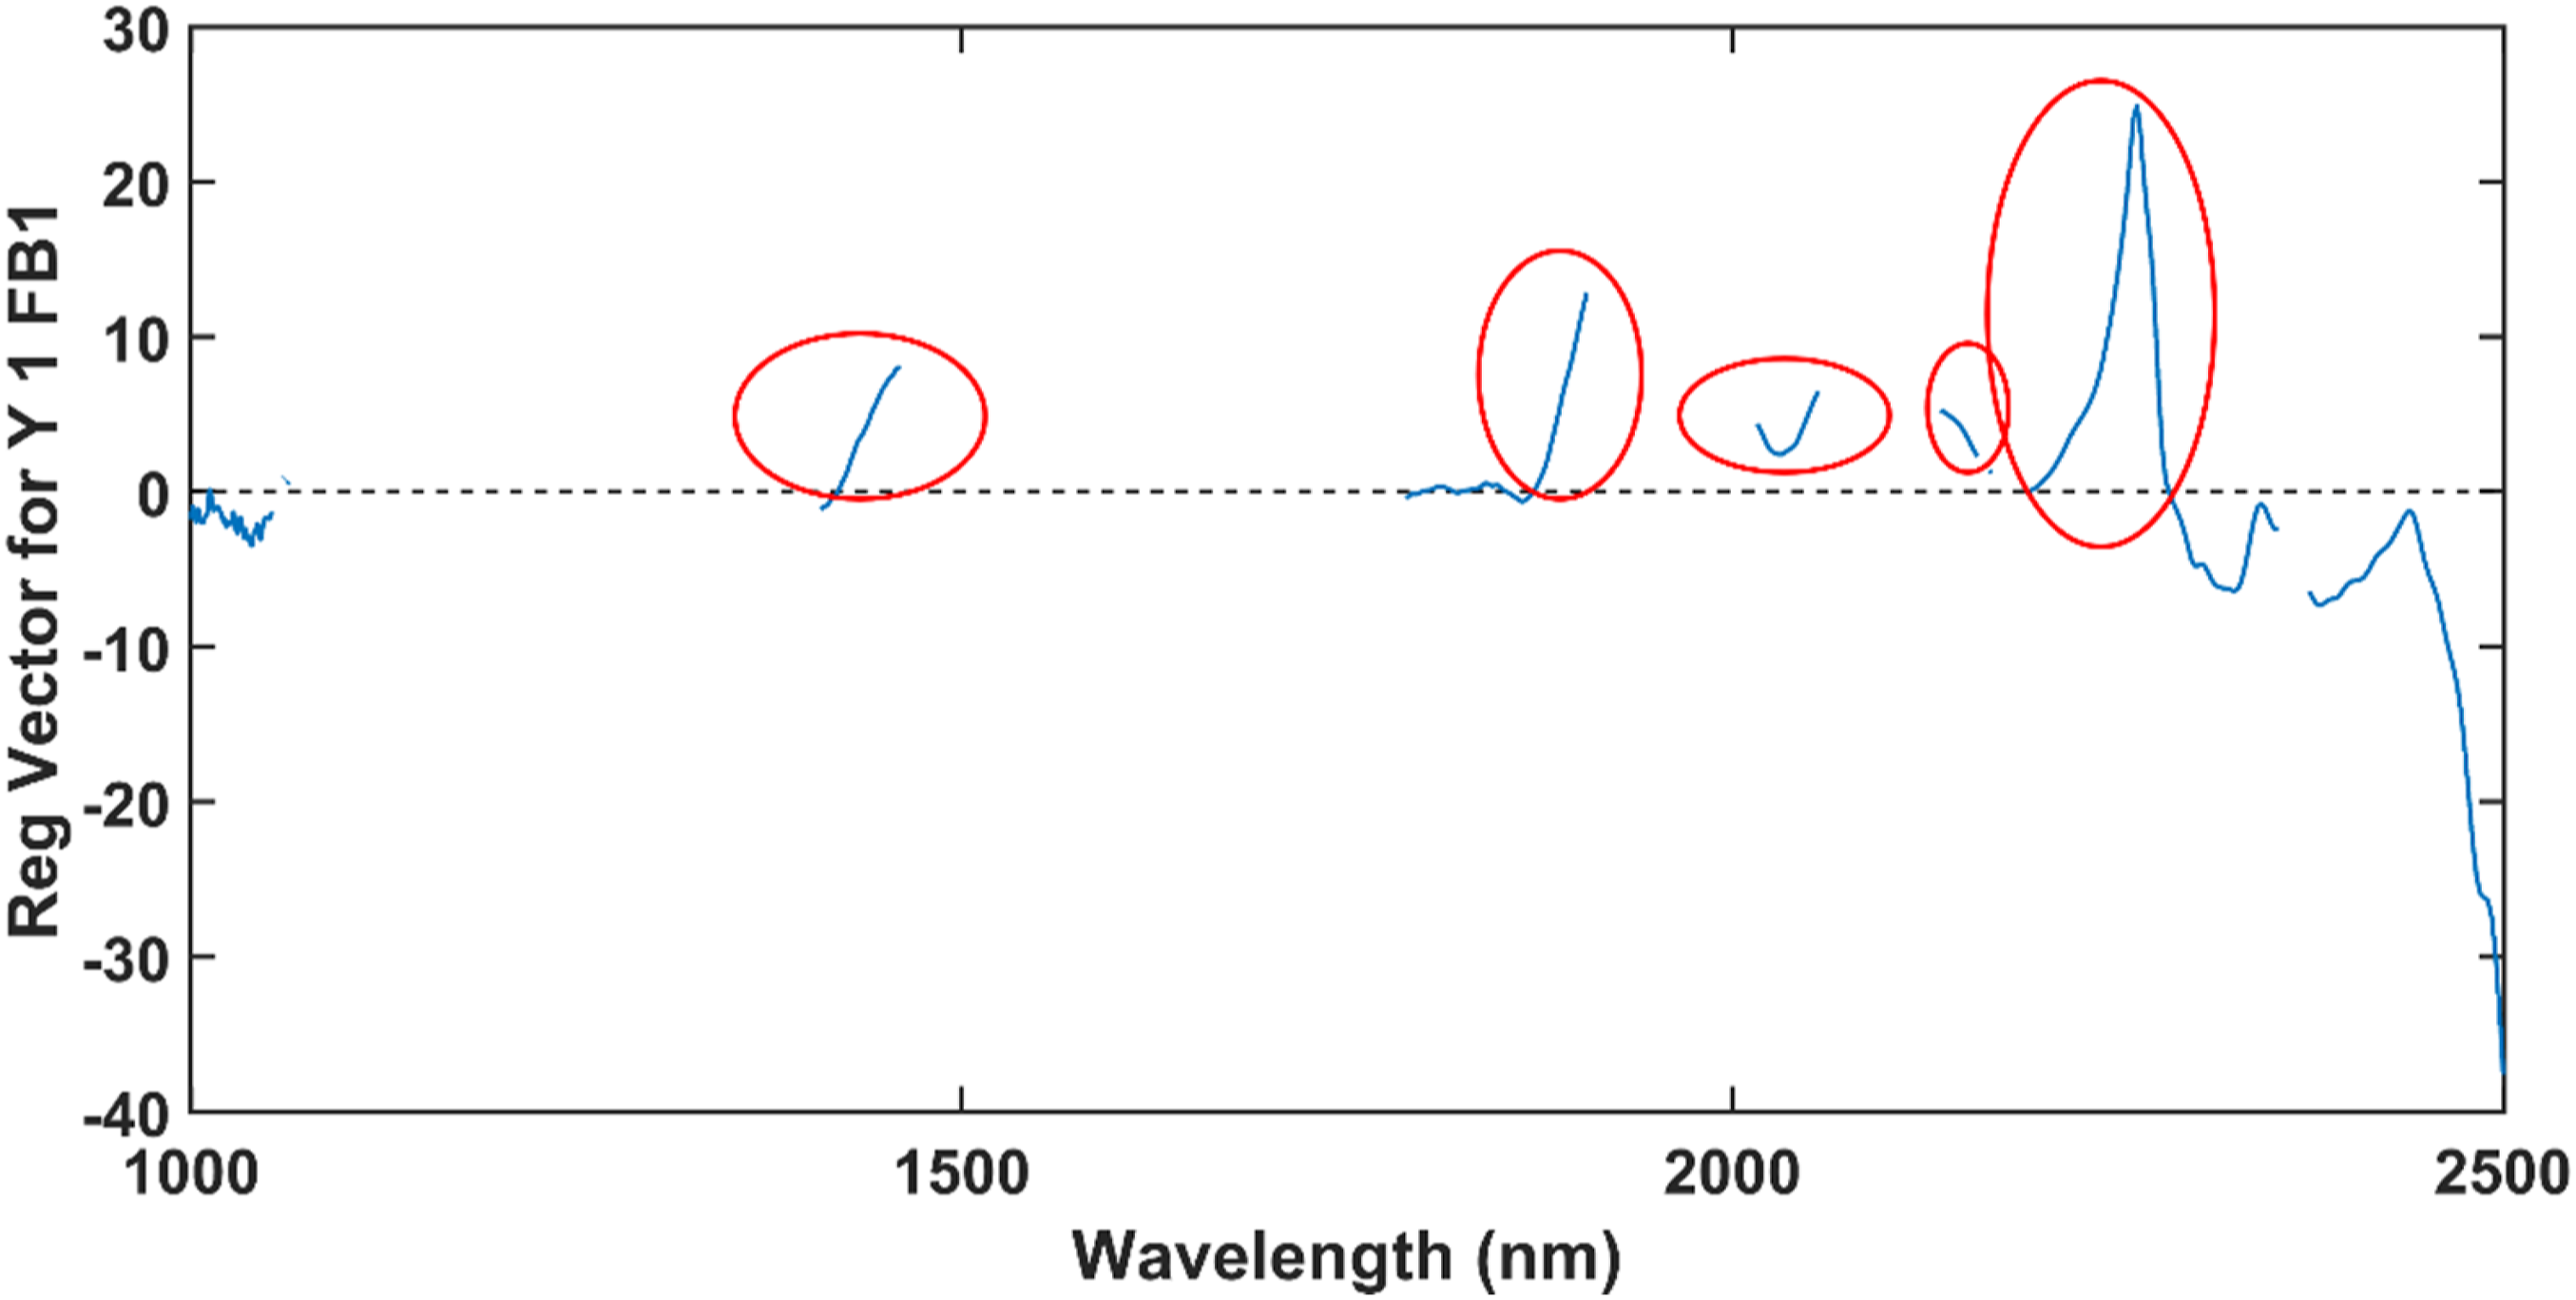
From the regression vector, it was determined that the wavelengths at 1424 – 1460 nm, 1871 – 1906 nm, 2016 – 2056 nm, 2135 – 2159 nm, 2167 – 2168 nm and 2203 – 2280 nm were related to FB1. To further investigate the relationship of these wavelengths with FB1, the final PLS-DA model was computed with only these wavelengths. The model was computed with nine LVs and obtained a 100% classification accuracy for the calibration and external validation sets. The excellent classification accuracy obtained by this model, with a relatively small number of LVs, confirmed that the essential wavelengths for FB1 detection were included in the model. The regression vector of this model is presented in Figure 15. The regression vector of the final PLS-DA model computed with the 150 wavelengths which had been selected from regression vector in Figure 15.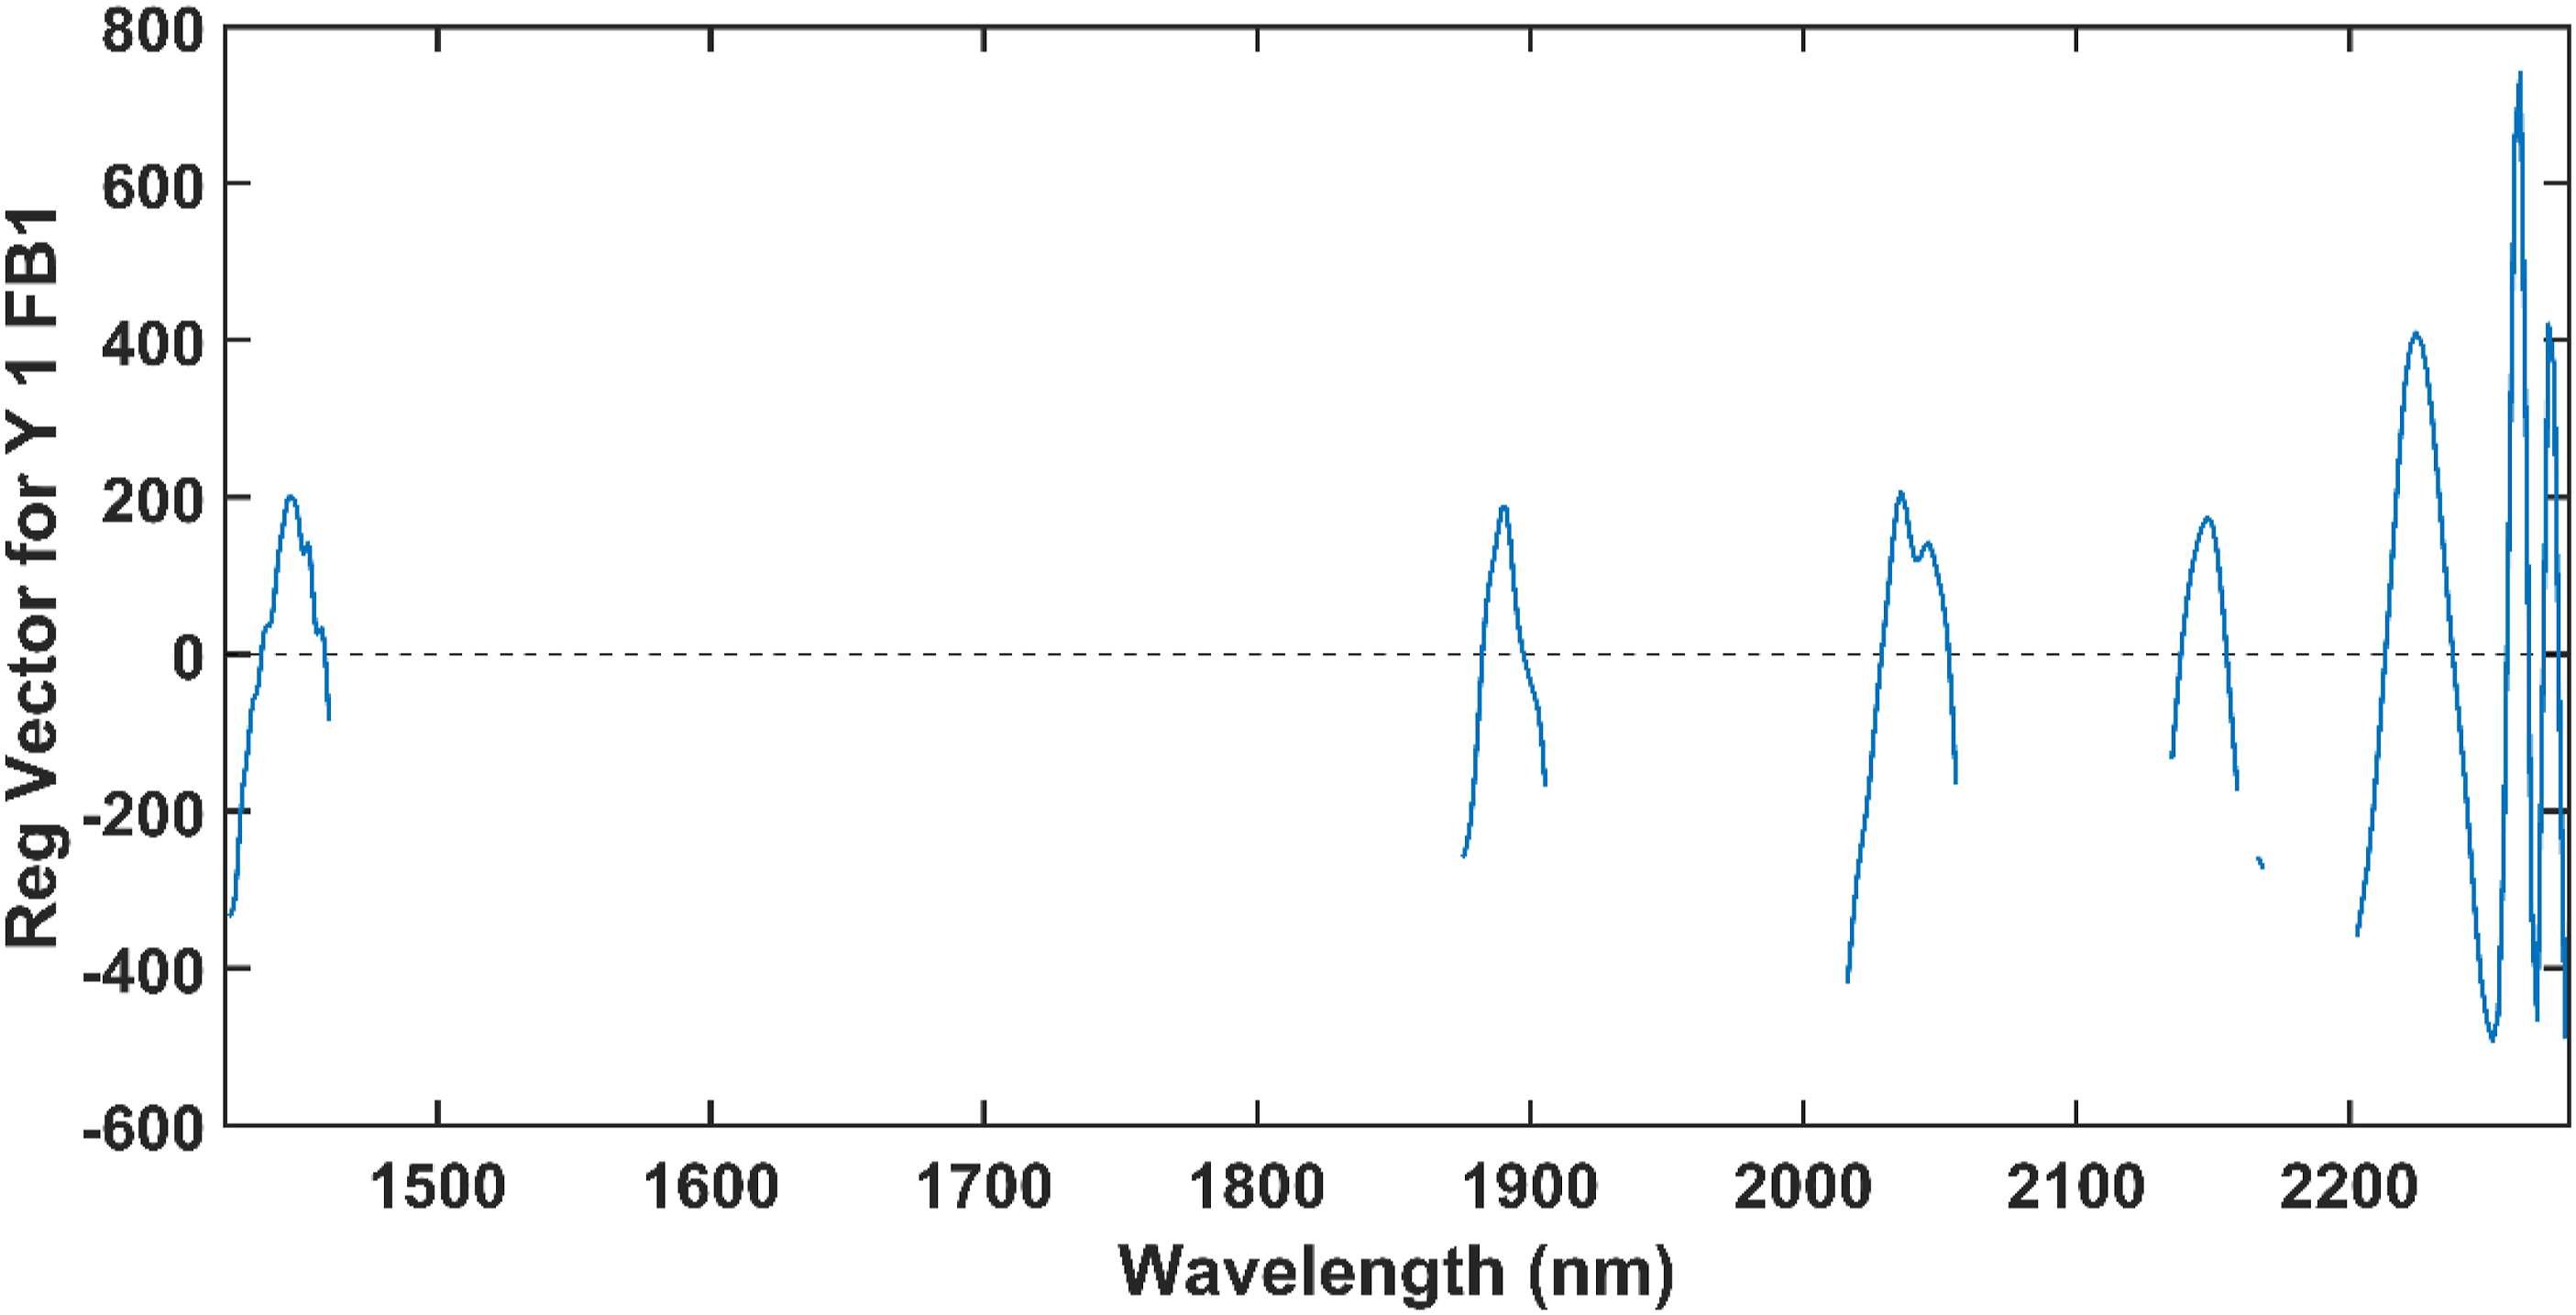
The regression vector had peaks at 1446 nm, 1453 nm, 1891 nm, 2036 nm, 2046 nm, 2148 nm, 2224 nm, 2262 nm and 2273 nm. These wavelengths differ from those which were influenced by the changes in methanol (Figure 6). Most of these wavelengths fell within the important wavelength ranges identified in the loadings (Figure 12), and all of them had a positive regression coefficient for the model before wavelength selection (Figure 13), indicating that they are related to FB1. Therefore, it was concluded that FB1 absorbs NIR energy at approximately these wavelengths.
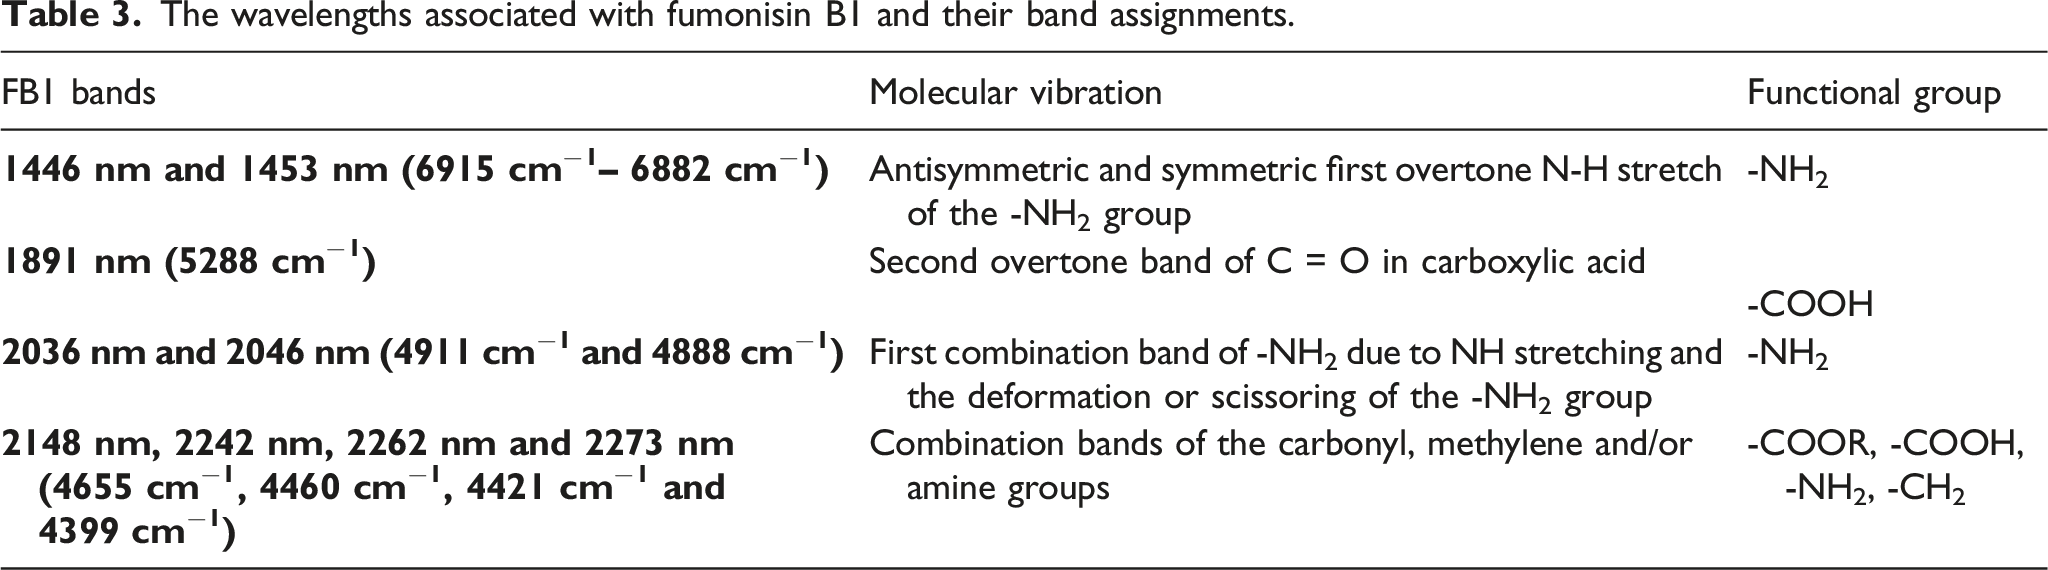
The amine, carboxylic acid, ester, hydroxyl, methyl and methylene groups of FB1 absorbs NIR energy. The NIR band positions of these functional groups are very dependent on the environment in which it occurs. Since FB1 is a very complex molecule and its interaction with methanol is not well known, the assignment of band positions was very complicated. To aid with band assignment, the NIR characteristics of the different functional groups were investigated. In addition, the band positions were compared to those of the same functional groups found in other materials. 43
Primary amines have doublet peaks in the first overtone region at approximately 1400–1700 nm and can either have a doublet or a single peak in its first combination region at 2000 nm, depending on the polarity of the solvent in which it was dissolved. 43 It is therefore most likely that the doublet peaks identified at 1446 nm and 1453 nm belongs to the first overtone band and the peaks at 2036 nm and 2046 nm are part of the first combination band of the primary amine group. The second overtone of the C = O bond in carboxylic acids have been identified at approximately 1900 nm and could therefore be responsible for the peak at 1891 nm. 44
The wavelengths associated with fumonisin B1 and their band assignments.
Conclusion
This study identified the potential absorbance bands of FB1, which were previously unknown. Furthermore, the bands of 100 ppm FB1, dissolved in methanol, were identified, demonstrating that FB1 does absorb detectable levels of NIR energy at the ppm level. Thus, NIR spectroscopy has the potential to be used as a rapid and non-destructive method for the direct measurement of FB1. The regulatory limits of FB1 in maize (4 ppm) is, however, much lower than the levels at which FB1 was detected in this study, and we also concluded that the band positions of the FB1 absorbance bands are extremely dependant on the environment in which it is measured. Therefore, further research will focus on the determination of the absorbance bands of FB1 in naturally and artificially contaminated maize kernels. It will also focus on determining the limits of detection and quantification of FB1 with NIR spectroscopy by creating dilution series.
Footnotes
Acknowledgements
The authors would like to acknowledge Dr T. Tait at the Department of Food Science, Stellenbosch University for his contributions to the project. The authors also acknowledge Dr J Colling from the Vibrational Spectroscopy Unit of the Central Analytical Facility at Stellenbosch University for use of the Buchi NIRFlex N-500.
Declaration of conflicting interests
The author(s) declared no potential conflicts of interest with respect to the research, authorship, and/or publication of this article.
Funding
The author(s) disclosed receipt of the following financial support for the research, authorship, and/or publication of this article: This work was supported by the National Research Foundation of South Africa [grant number 137998]; Postgraduate Scholarship Program of Stellenbosch University.