
Abstract
Multimodal measurements are increasingly becoming common in the domain of spectral sensing and imaging for fresh produce. Often multiple sensors are expected to carry complementary information which allows precise estimation of responses. In this study, a novel case of multimodal hyperspectral imaging is described where two different spectral cameras working in the complementary spectral ranges were integrated into a fully standalone system for spectral imaging for fresh produce analysis. Furthermore, a comparative analysis of different multiblock predictive modelling approaches for fusing data from these two complementary spectral cameras is demonstrated. Both multiblock latent space and multiblock variable selection approaches to identify key variables of interest was examined and compared with the analysis carried out on individual data blocks. Prediction of the soluble solids content in grapes was used to demonstrate the application. The presented approach can increase the applications of multimodal hyperspectral imaging for non-destructive analysis.
Introduction
Hyperspectral imaging (HSI) emerges as a versatile and powerful tool for a variety of applications in different fields such as pharmaceutical research, 1 agriculture, 2 forensic science 3 and food science. 4 Optical tools such as spectroscopy and imaging are particularly suitable for online inspection of products due to their fast speed and non-contact nature. Spectroscopy is deemed a promising method for determining the essential qualities of agro-food products based on their spectral signature. Nevertheless, spectroscopy technique is unable to generate information on spatial distributions, limiting its application to quantify spatial and structure related attributes. 5 As a hybrid technology, HSI integrates the advantages of spectroscopy and imaging technologies, providing both spatial and spectral information simultaneously. 6 The spatial information captured by HSI is of multiple uses, for example, it allows estimating average spectral response of the object to have a less noisy spectrum corresponding to a single point measurement which directly led to better predictive models. Secondly, it allows for the visualization of chemical constituents of a tested sample when the spectral signature is used to uniquely identify, characterize, and discriminate between classes/types of any given material(s) in each pixel of the image. 7
The basic principle of HSI is that sample materials continuously reflect, scatter, absorb and emit energy in distinctive patterns at specific wavebands due to the difference in their chemical composition and inherent physical structure. 8 In the food and agriculture areas, visible to near-infrared (VNIR) covering 400–1000 nm and shortwave infrared (SWIR) in the range of 1000–1700 nm are most commonly used. For SWIR hyperspectral imaging, typical InGaAs detectors made of an alloy of indium arsenide (InAs) and gallium arsenide (GaAs) are normally implemented as the material for the detector due to its advantages of fairly flat and high quantum efficiency in the SWIR region. 9 Meanwhile, silicon-based CCD cameras are commonly applied to collect VNIR spectra and it owns several benefits such as small size, high speed, low noise and good spectral response. 5 Furthermore, the silicon detector is not sensitive enough in the SWIR spectral range and due to the same fact, in the commercial markets most often the cameras that can be purchased either works in the VNIR range (using silicon detector) or in the SWIR range (using InGaAs detector). This limitation also means that if there is a need for measuring the spectrum in both the VNIR and the SWIR range, the user needs to perform multimodal measurements where two spectral cameras are required.
Multimodal sensing is increasingly becoming popular in the spectroscopy domain. This is since most often different spectral sensing techniques provides complementary information which when used together allows a better estimation of physicochemical properties of samples. For example, mid-infrared and Raman spectroscopy are highly complementary as they are sensitive to different vibration modes of molecular groups. Furthermore, both techniques cover each others drawbacks, for example, Raman works well in high moisture samples but suffers from fluorescence while mid-infrared signal compromises in case of high moisture samples but works well in fluorescent samples. Hence, a multimodal approach involving mid-infrared and Raman could allow a better predictive model as one technique will compensate for the drawbacks of the other. NIR and SWIR spectral ranges are also complementary and have been used in multiple studies for improved prediction of physicochemical properties of samples.10–12 For example, one of the complementary natures of NIR and SWIR can be explained as the difference in penetration depth of NIR and SWIR light in high-moisture samples such as fresh fruit. 13 In the case of fresh fruit, it has been found that due to low water absorption coefficients of water molecule in the NIR part, the penetration depth of the NIR light is higher which allows for capturing more subsurface bulk information. 14 While in the SWIR range the water absorption coefficient of water molecule is high thus may allow a better prediction of surface moisture in samples. Furthermore, as demonstrated analytically in a recent study the sequential fusion of NIR and SWIR improved the prediction of both moisture content and soluble solids in fresh fruit. 11 However, earlier works11,12 on the fusion of NIR and SWIR data were mainly limited to point spectral sensors which required each sample to be measured closely. Such a sensing approach cannot be implemented for the high-throughput scenario, however, on other hand a multimodal NIR and SWIR HSI measurement and fusion approach can allow a measurement of large number of samples in an automated way. Unlike the point based spectral sensors which are readily available in the market covering the complete spectral range (400–2500 nm) by having different detectors in the same device such as LabSpec spectrometer from Malvern Panalytical, United Kingdom, the multimodal HSI systems are lacking. Hence, this study is the first to present a fully integrated multimodal HSI system.
Optical spectral measurements are indirect techniques which require prior calibration to be used as prediction tools. In a single model sensing scenario, often multivariate calibration techniques such as partial least squares (PLS) regression15,16 are used. In multimodal sensing, there is also a necessity to perform a prior calibration modelling to link the multimodal spectral responses to the property of interest to be predicted. Considering multimodal data within the context of a data fusion framework. The fusion of multimodal information can be performed on three different levels, i.e., low, mid, and high. 17 However, in the domain of chemometrics there are dedicated data modelling approaches for multimodal data.18,19 The techniques are known as multiblock modelling techniques which can be considered as a mid-level data fusion technique as they consider the information extraction and fusion in the same step of model building. For spectral data, the most common multiblock techniques are the multiblock extensions of PLS techniques20,21 allowing to extract complementary latent spaces from multimodal data relevant for explaining the property of interest. Furthermore, to gain further insights into the role of key spectral bands, multiblock variables selection techniques can be used.22–25 Such techniques allow the selection of complementary variables while maintaining the predictive performance of the model. This study will demonstrate both the latent space multiblock modelling as well as multiblock variable selection to fuse multimodal HSI information.
In this study, a novel case of multimodal HSI is presented where two different cameras working in the complementary spectral range were integrated into a fully standalone system for spectral imaging. Furthermore, a comparative analysis of different multiblock predictive modelling approaches for fusing data from these two complementary spectral cameras is examined. Both multiblock latent space as well as multiblock variable selection approaches were used to identify key variables of interest. The HSI multiblock analysis results were compared to the analysis carried out on individual data blocks. The prediction of soluble solids content in grape was used to demonstrate the application.
Material and methods
Multimodal hyperspectral imaging setup and data acquisition
The multimodal HSI system developed in this study is the direct extension of a recently developed All-in-One spectral imaging setup.
26
In an earlier system, there was only one VNIR spectral camera (FX10, Specim, Finland) available for image acquisition. The camera mounting module and the associated lighting module was modified to capture images from two spectral cameras simultaneously. In Figure 1, the All-in-One spectral imaging module with a dual camera mount is shown. The second camera was a SWIR camera (FX17, Specim, Finland). It was found that mounting the cameras head to head was the best option to gain the maximum scan area in the cabinet. Six extra halogen lamps (25 W each) were mounted to illuminate the field of view for the new camera imaging system. The software to control the setup was also modified to acquire the simultaneous images from the new camera. Since the FX17 camera was also a GigE camera, it was directly controlled by the GigE image acquisition toolbox in MATLAB. The image acquisition was performed line by line with both cameras simultaneously. Both cameras used a 38 degree field of view (FOV) lens. Note that the setup has a linear translation stage on which both the cameras and the lights are mounted. During typical image acquisition the camera and light source moved to acquire the whole field of view line by line. The setup was standardised for optimal speed of the translation stage, number of frames to acquire, and optimal exposure times for both cameras to avoid any missed frame or FOV by play and adjust approach. Since, the system always has a fixed distance to sample and to travel, once the optimal translation speed, number of frames, and exposure times were optimised, they were set as default. The default translation speed was 30 mm/s. The number of frames were 872. The exposure time for the FX10 and FX17 were 27 and 17 m/s, respectively. The ASI setup with dual cameras. The two cameras (Specim FX10 and FX17) were mounted head-to-head.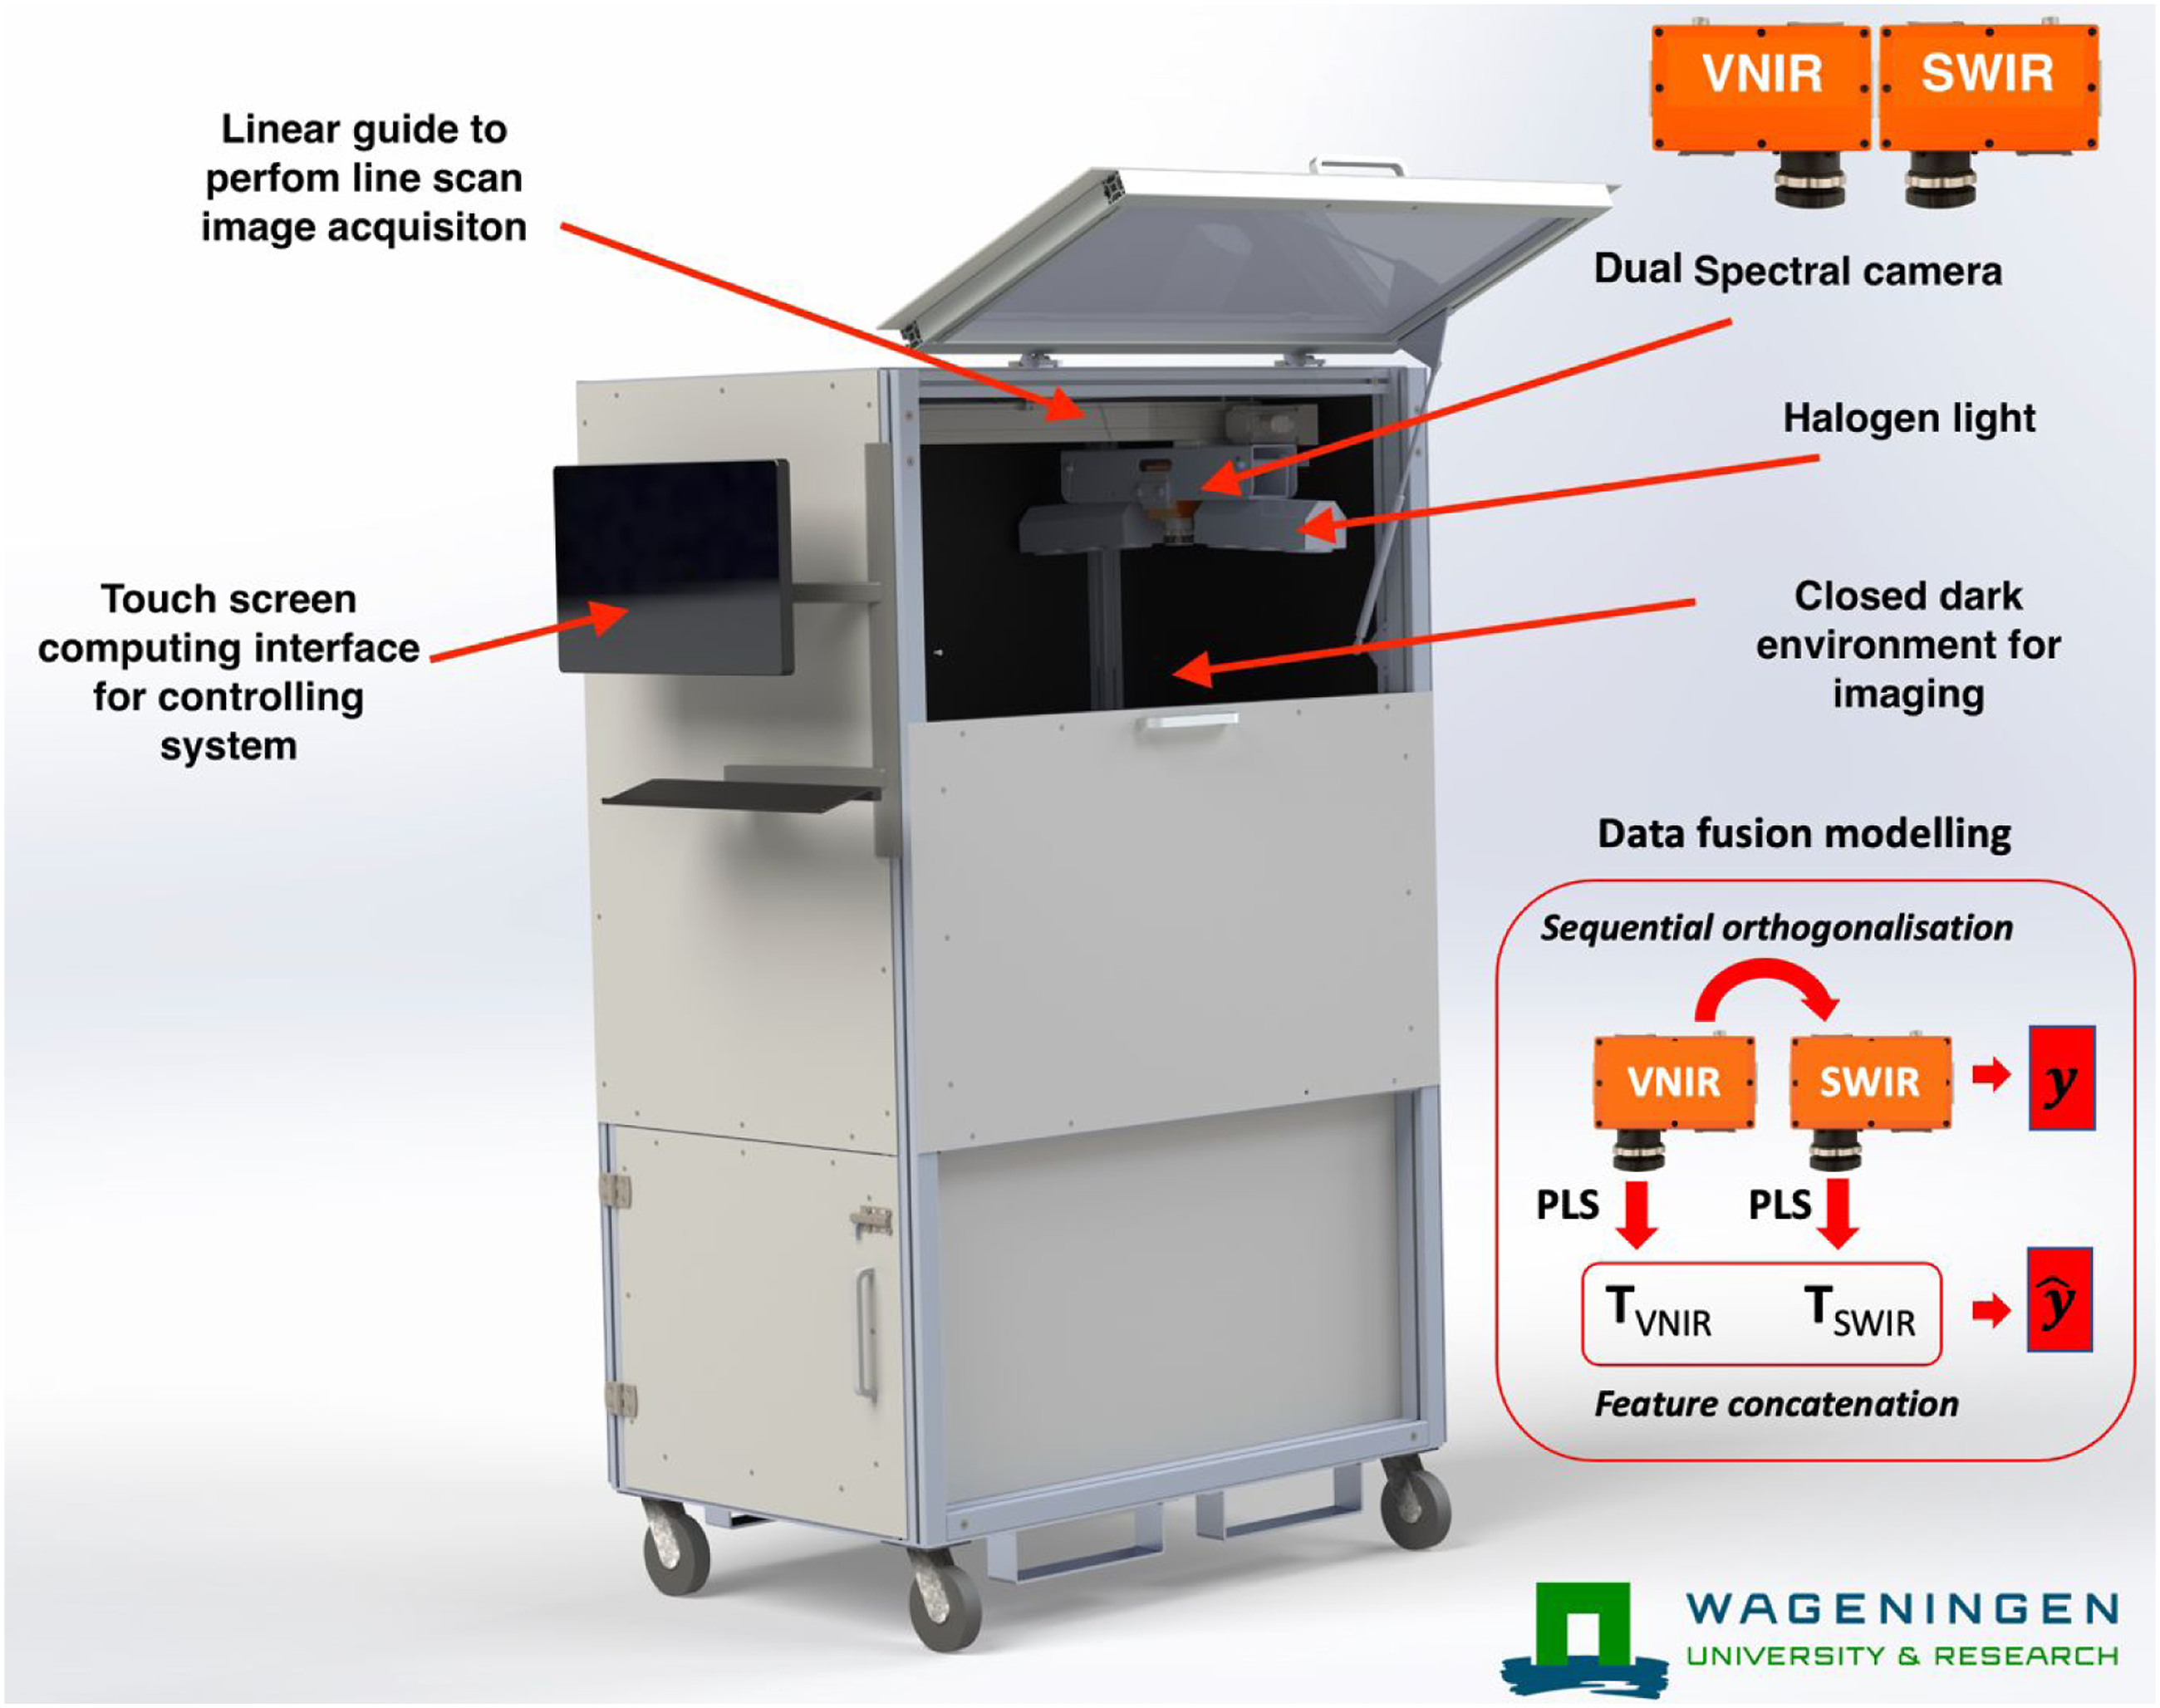
For this study, the developed multimodal system was tested to acquire images of grapes purchased from a local supermarket (Albert Heijn, Ede, The Netherlands). A total of 200 black grapes were measured with the multimodal device capturing images from both the FX10 and FX17 cameras. After imaging, the soluble solids content (SSC) was measured for each fruit. SSC of extracted grape juice was determined using a handheld refractometer (HI 96801, Hanna Instruments Inc, Woonsocket, RI, USA).
Data analysis
Deep learning based object detection and fruit spectra extraction
In this work, the object detection method based on you only look once (YOLO) was used to recognize and localize individual fruits. The object detection model was originally developed in our previous work 27 using YOLOv4 combined with transfer learning. It is worth mentioning that the object detector was previously trained to identify six types of fresh fruit samples, i.e., apple, pear, kiwi, black grapes, green grapes, and blueberry. For each identified object, the deep learning model generates a bounding box where the fruit of interest is expected to reside within the box and a label telling the fruit type, which allows us to localize individual fruits and identify the types of fruit in the image. The obtained bounding box is subsequently used to compute the centroid pixel. The mean spectrum obtained from a neighbouring region surrounding the centroid pixel is subsequently extracted to represent the entire fruit. Apart from this, it should be noted that the RGB images that were used for training YOLOv4 model were collected from the FX10 camera only and in this study we used the model directly on the FX17 images without needing any further training and adaption of the model. The extracted mean spectra for each fruit were pre-processed with the standard normal variate (SNV) 28 pre-processing to avoid any additive and multiplicative effects caused due to the curved surface of the grape berry. The data was further divided into calibration (60%) and testing set (40%) using the Kennard-Stone 29 algorithm on the spectral data.
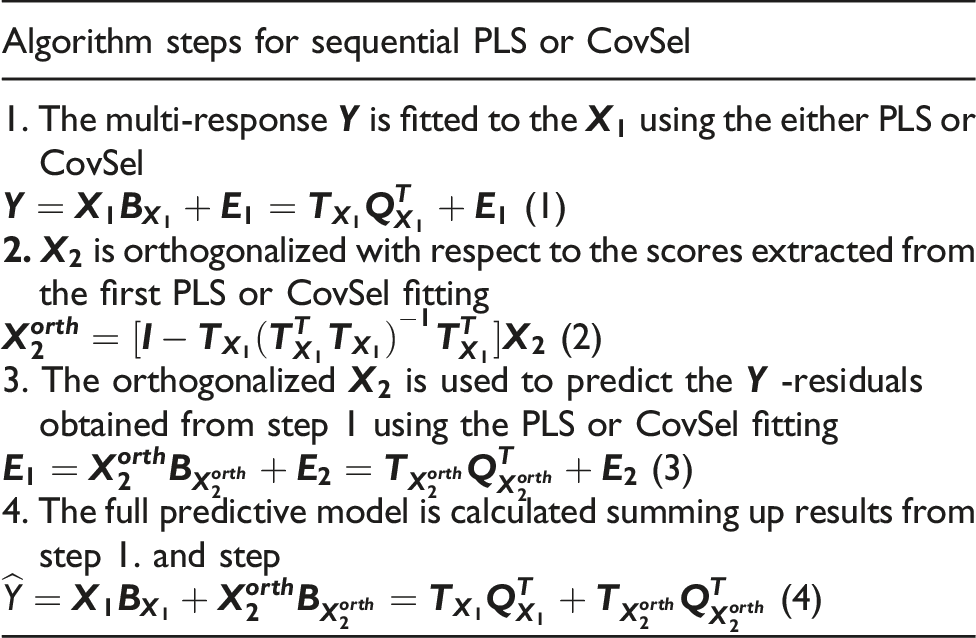
Sequential PLS and CovSel
Results and discussion
Deep learning based object detection for FX10 (NIR) and FX17 (SWIR) images
The results from testing the earlier developed deep learning
27
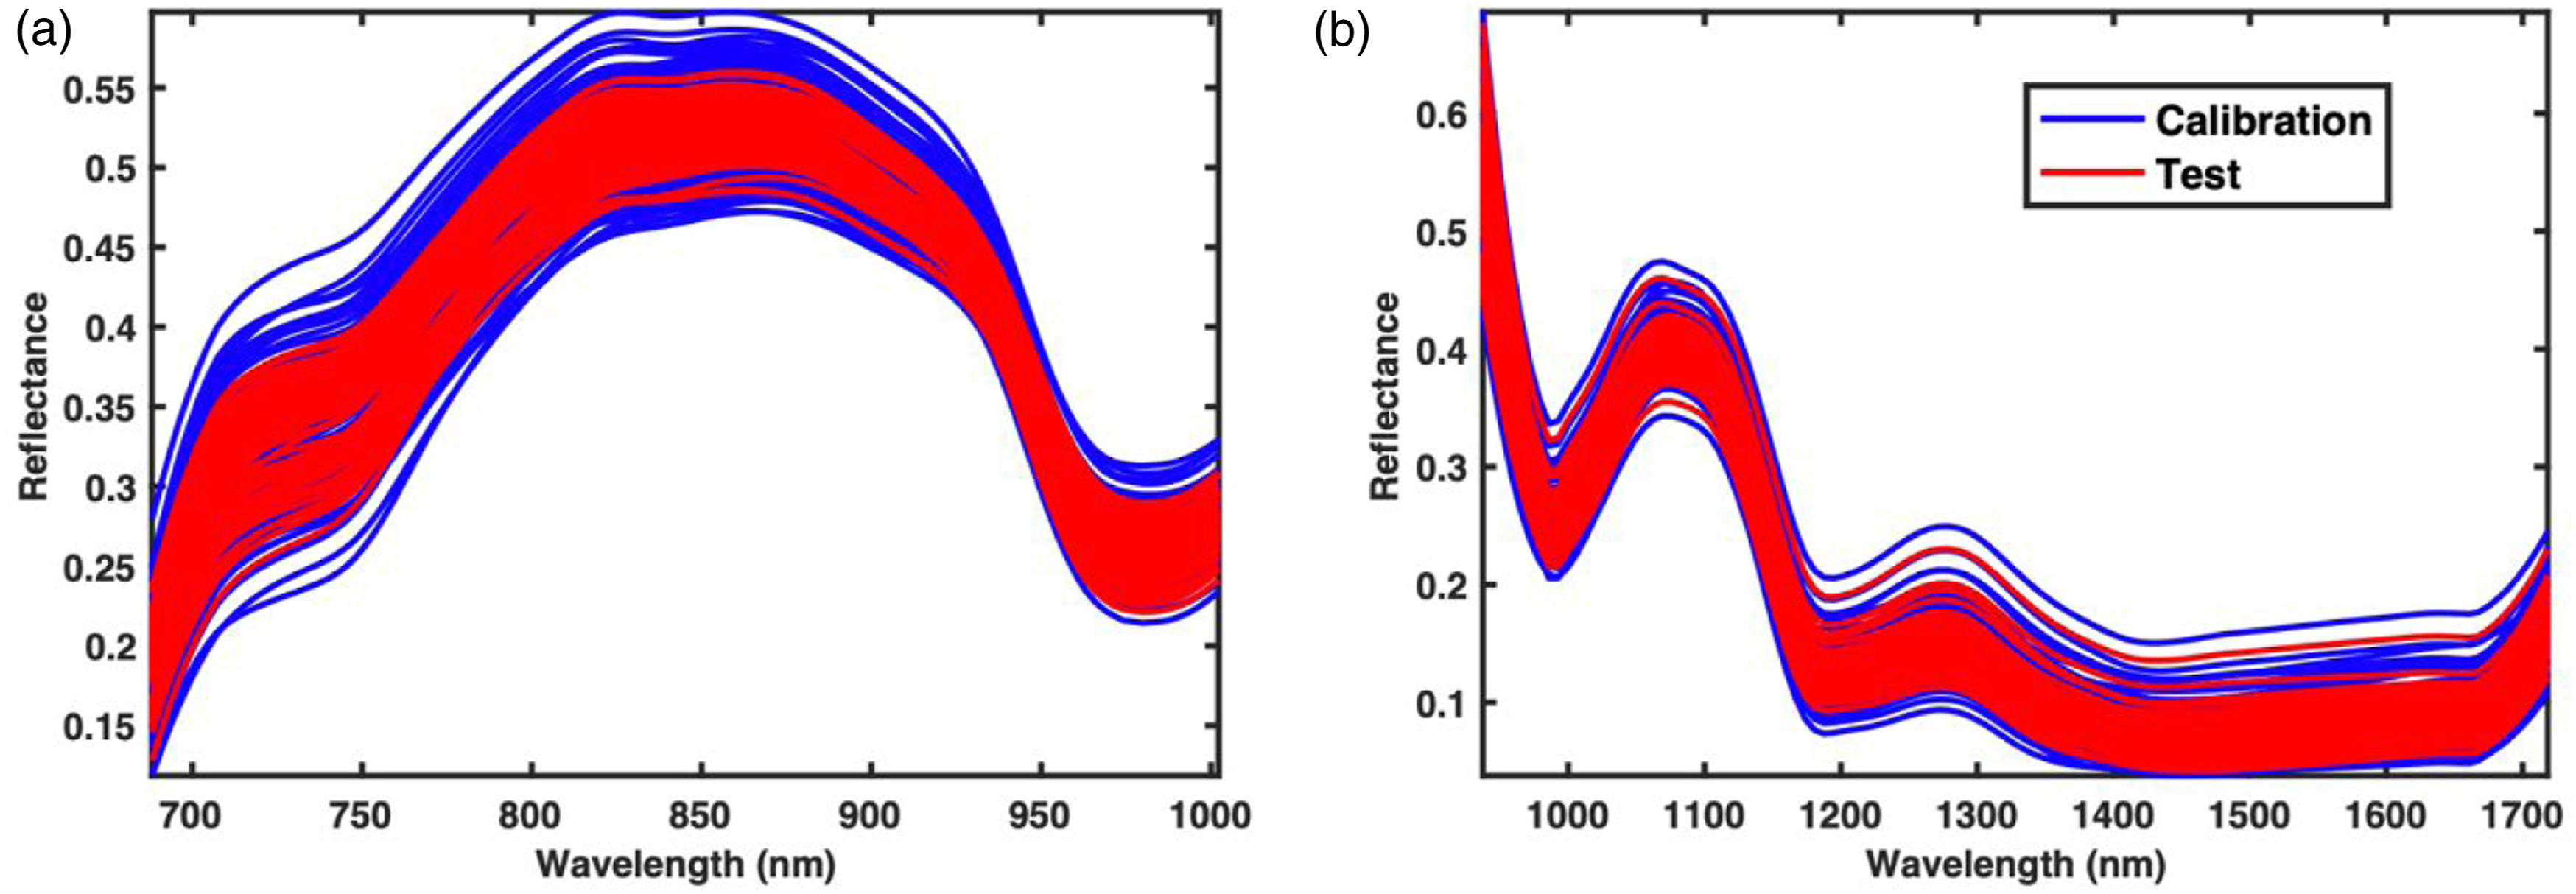
model for fruit detection are presented as the bounding boxes in Figure 2. The current the deep learning model on was tested both the FX10 (NIR) and FX17 (SWIR) images. Note that in the earlier study the deep learning model only using the FX10 (NIR). However, based on the results it seems possible to use the deep learning model also on the FX17 (SWIR) data without any adjustment. It is also noted that for the reference artificial circles (located in the lower-left corner in Figure 2(b)) in the FX17 image, the use of the deep learning lead to incorrect detection as grapes, however, since, the position of the artificial reference circles is always fixed at lower left, it was easy to remove such misclassification. For all fruit samples, the detection was 100% correct for both the FX10 and FX17 images. Using the centroid information from the bounding boxes, the mean spectra with the squared window of size 11 × 11 centred at the centroid were extracted. The window size was 11 × 11 as having a larger window size was getting bigger than some fruit samples. The mean spectra for FX10 and FX17 are shown in Figure 3. Please note that in the following part of the analysis only the NIR (>670 nm) region of the FX10 data was used as the colour information was removed to have the colour independent spectral model. Removal of colour information before data modelling is a common practice in the domain of fruit spectroscopy to avoid the model being dependent on the outer peel colour of fruit and to use only the chemical information for predicting fruit properties. Since fruits are usually 80–90% water and the NIR and SWIR light is highly absorbed by the water, the NIR and SWIR spectra (Figure 3) of fruit majorly have peaks related to water absorption. A strong absorption band at 980 nm, associated with the second overtone of the O–H stretching band of water,
33
is noticeable from both detectors (Figure 3(a) and (b)). Another water absorption due to the first overtone of –OH stretch
34
is also perceivable at 1450 nm. A notable absorption band centred at 1187 nm may be assigned to the second overtone of CH2 stretching of carbohydrates.
35
Detection of grapes using the deep learning model developed in our earlier study tested on FX10 (NIR) and FX17 (SWIR) images. Note that the deep learning model was never trained on the FX17 (SWIR) data but appears to perform well on FX17 (SWIR) data. The calibration and test spectra set for FX10 (NIR) (a) and FX17 (SWIR) (b) camera data. The mean spectra were extracted using the centroids predicted by the deep learning model.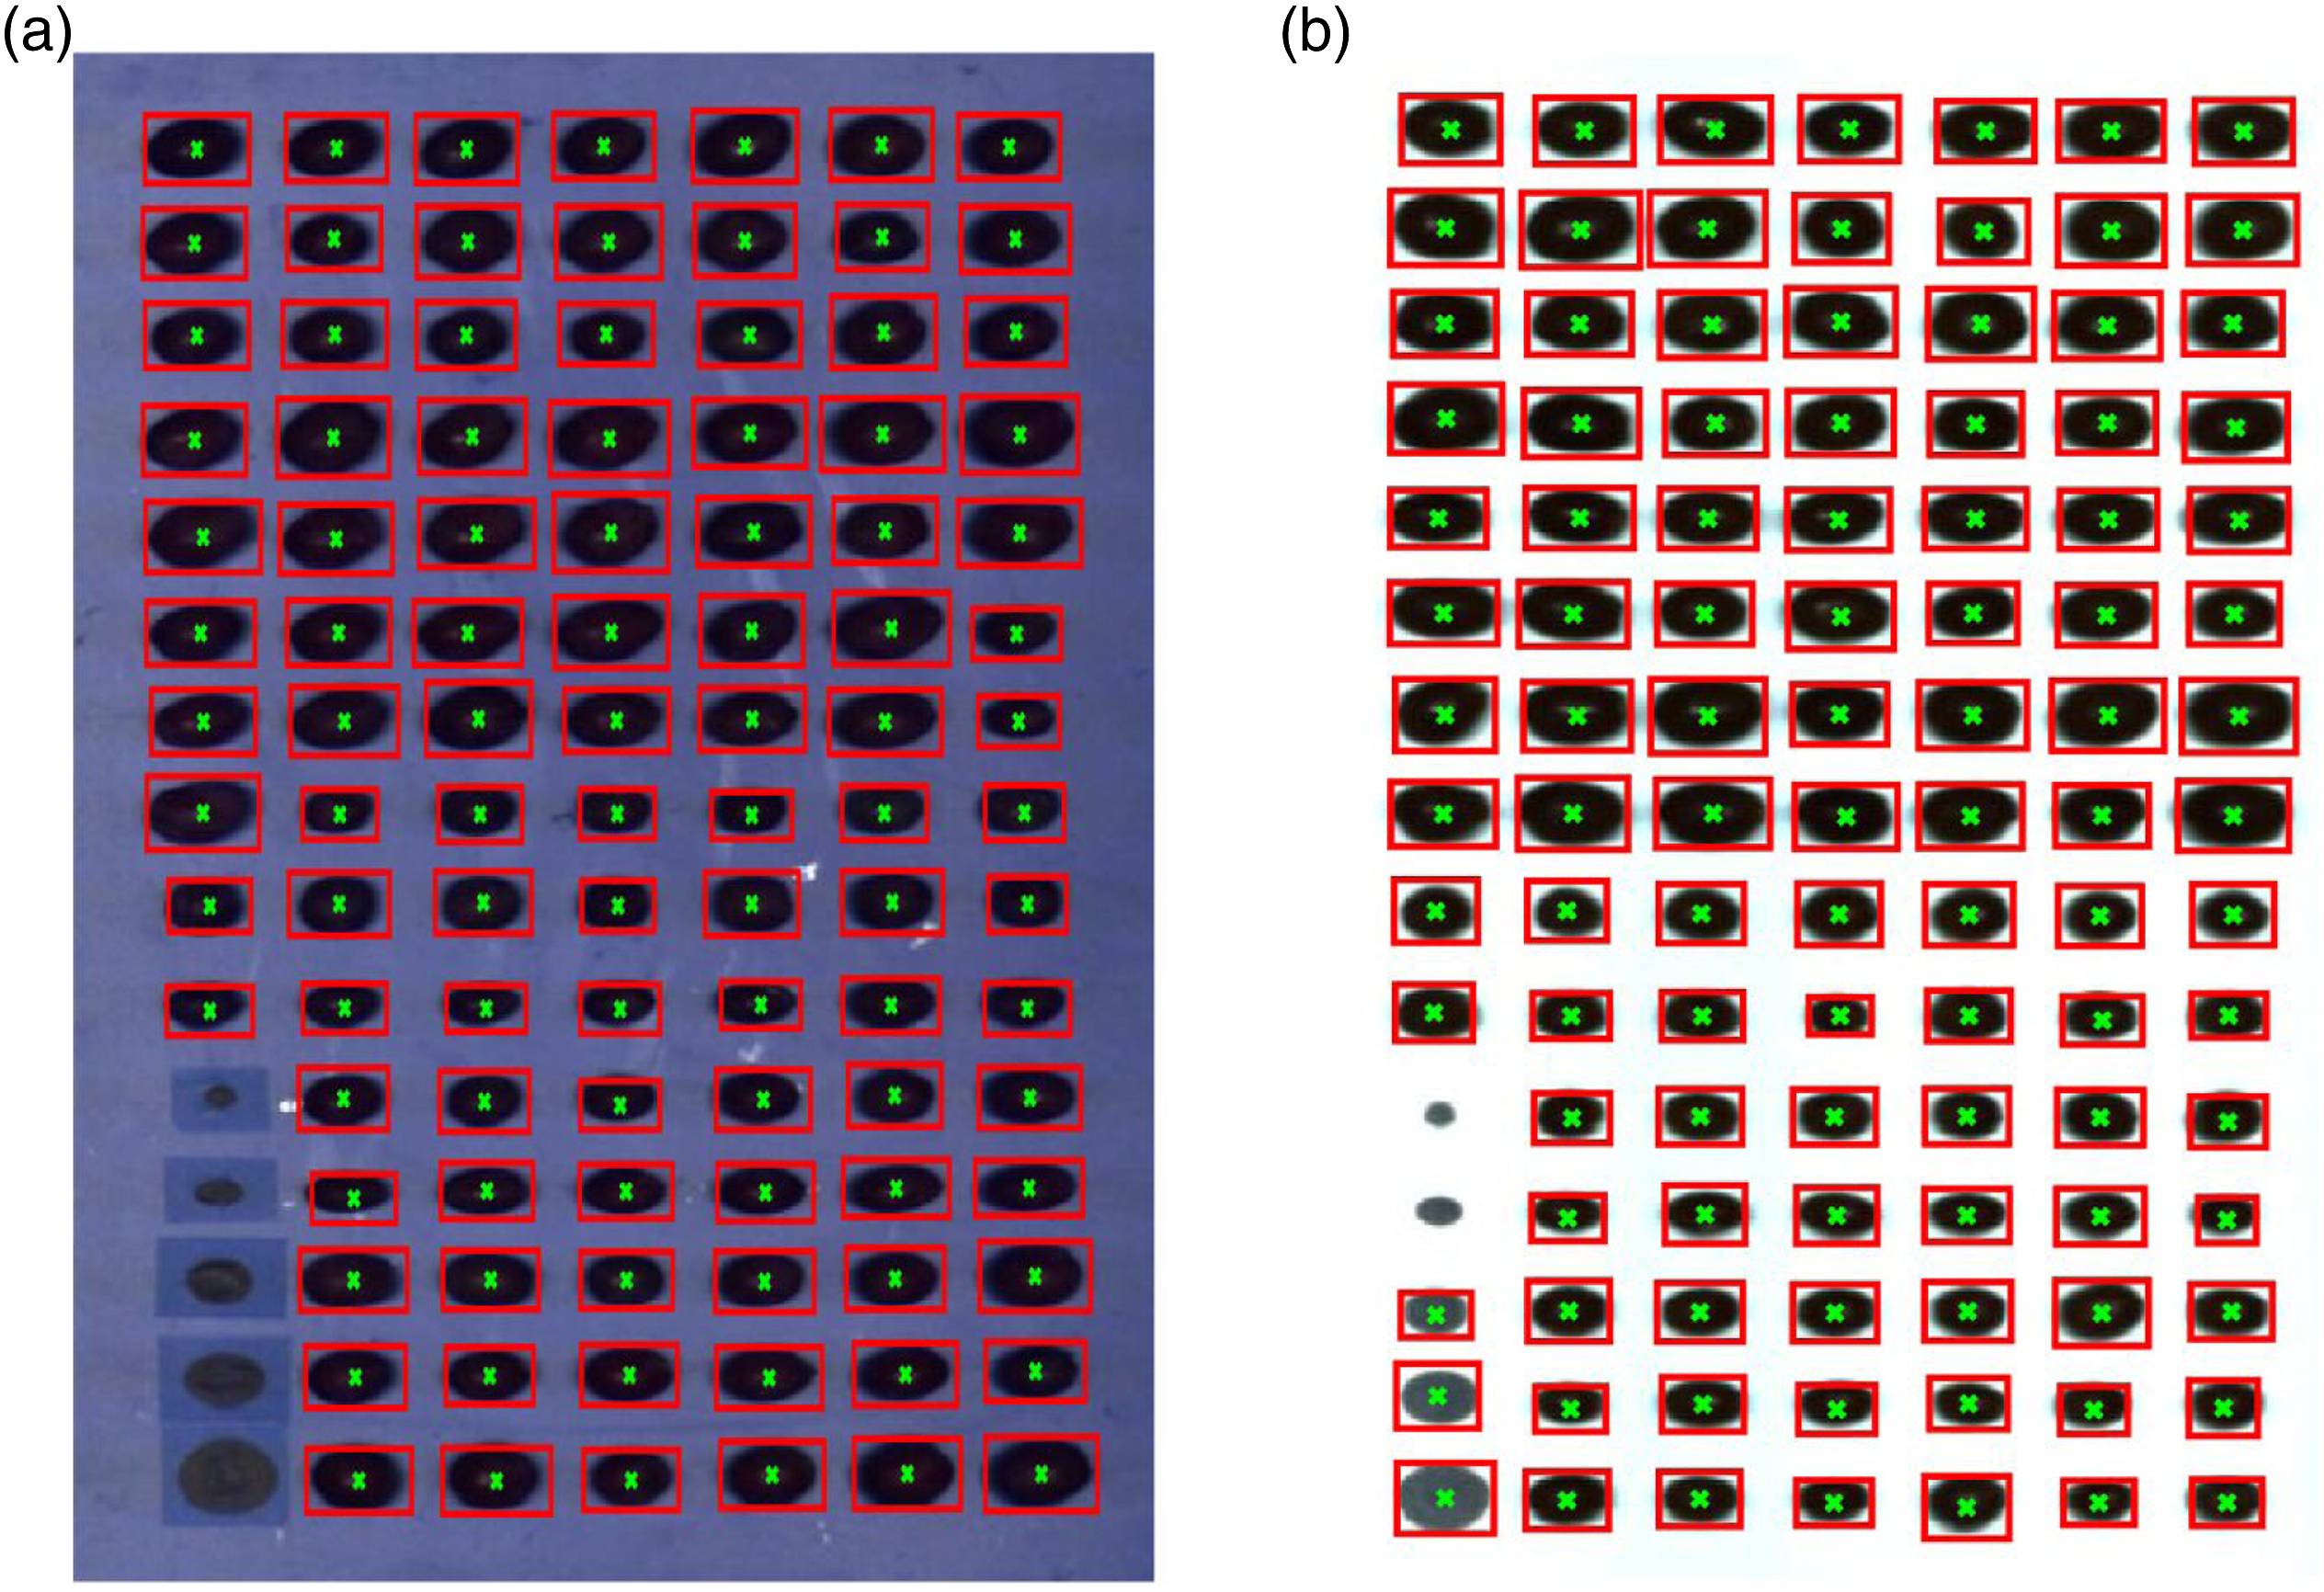
PLS and SO-PLS analysis
The predictive analysis was carried out to find out if there is a need for multimodal sensing or not. For that purpose, the first step was to perform PLS analysis on data from FX10 and FX17 independently to understand and set the baseline for comparison on how well each sensor predicted the SSC content in grapes. The FX10 and FX17 were able to predict the SSC in grapes with RMSEPs of 0.76% and 0.70%, respectively (Figure 4). The lower RMSEP achieved with FX17 indicates that it is better in predicting the SSC in grape fruit compared to the FX10. The prediction error is similar to that typically observed with NIR spectroscopy for predicting SSC in fresh fruit and has been reported in several earlier works. 26 After PLS analysis for individual camera data, the data fusion analysis with SO-PLS was carried out. Since SO-PLS is a sequential approach requiring the order of the sensors to be defined, two possible orders i.e., FX10 data followed by FX17 and later FX17 data followed by FX10 were trialled in this study. Different orders were trialled as it has been noted that the results of SO-PLS model are dependent on data block order. The result of SO-PLS analysis irrespective of the block order led to RMSEP of 0.65% which was lower than the RMSEP obtained with models developed using individual sensors (Figure 5). Such a low RMSEP demonstrates the potential of using the multimodal hyperspectral imaging approach for improving fruit property prediction. Note that the total number of LVs for the SO-PLS model was higher than that of the PLS analysis performed on individual data blocks, as it learned complementary information from both data blocks.
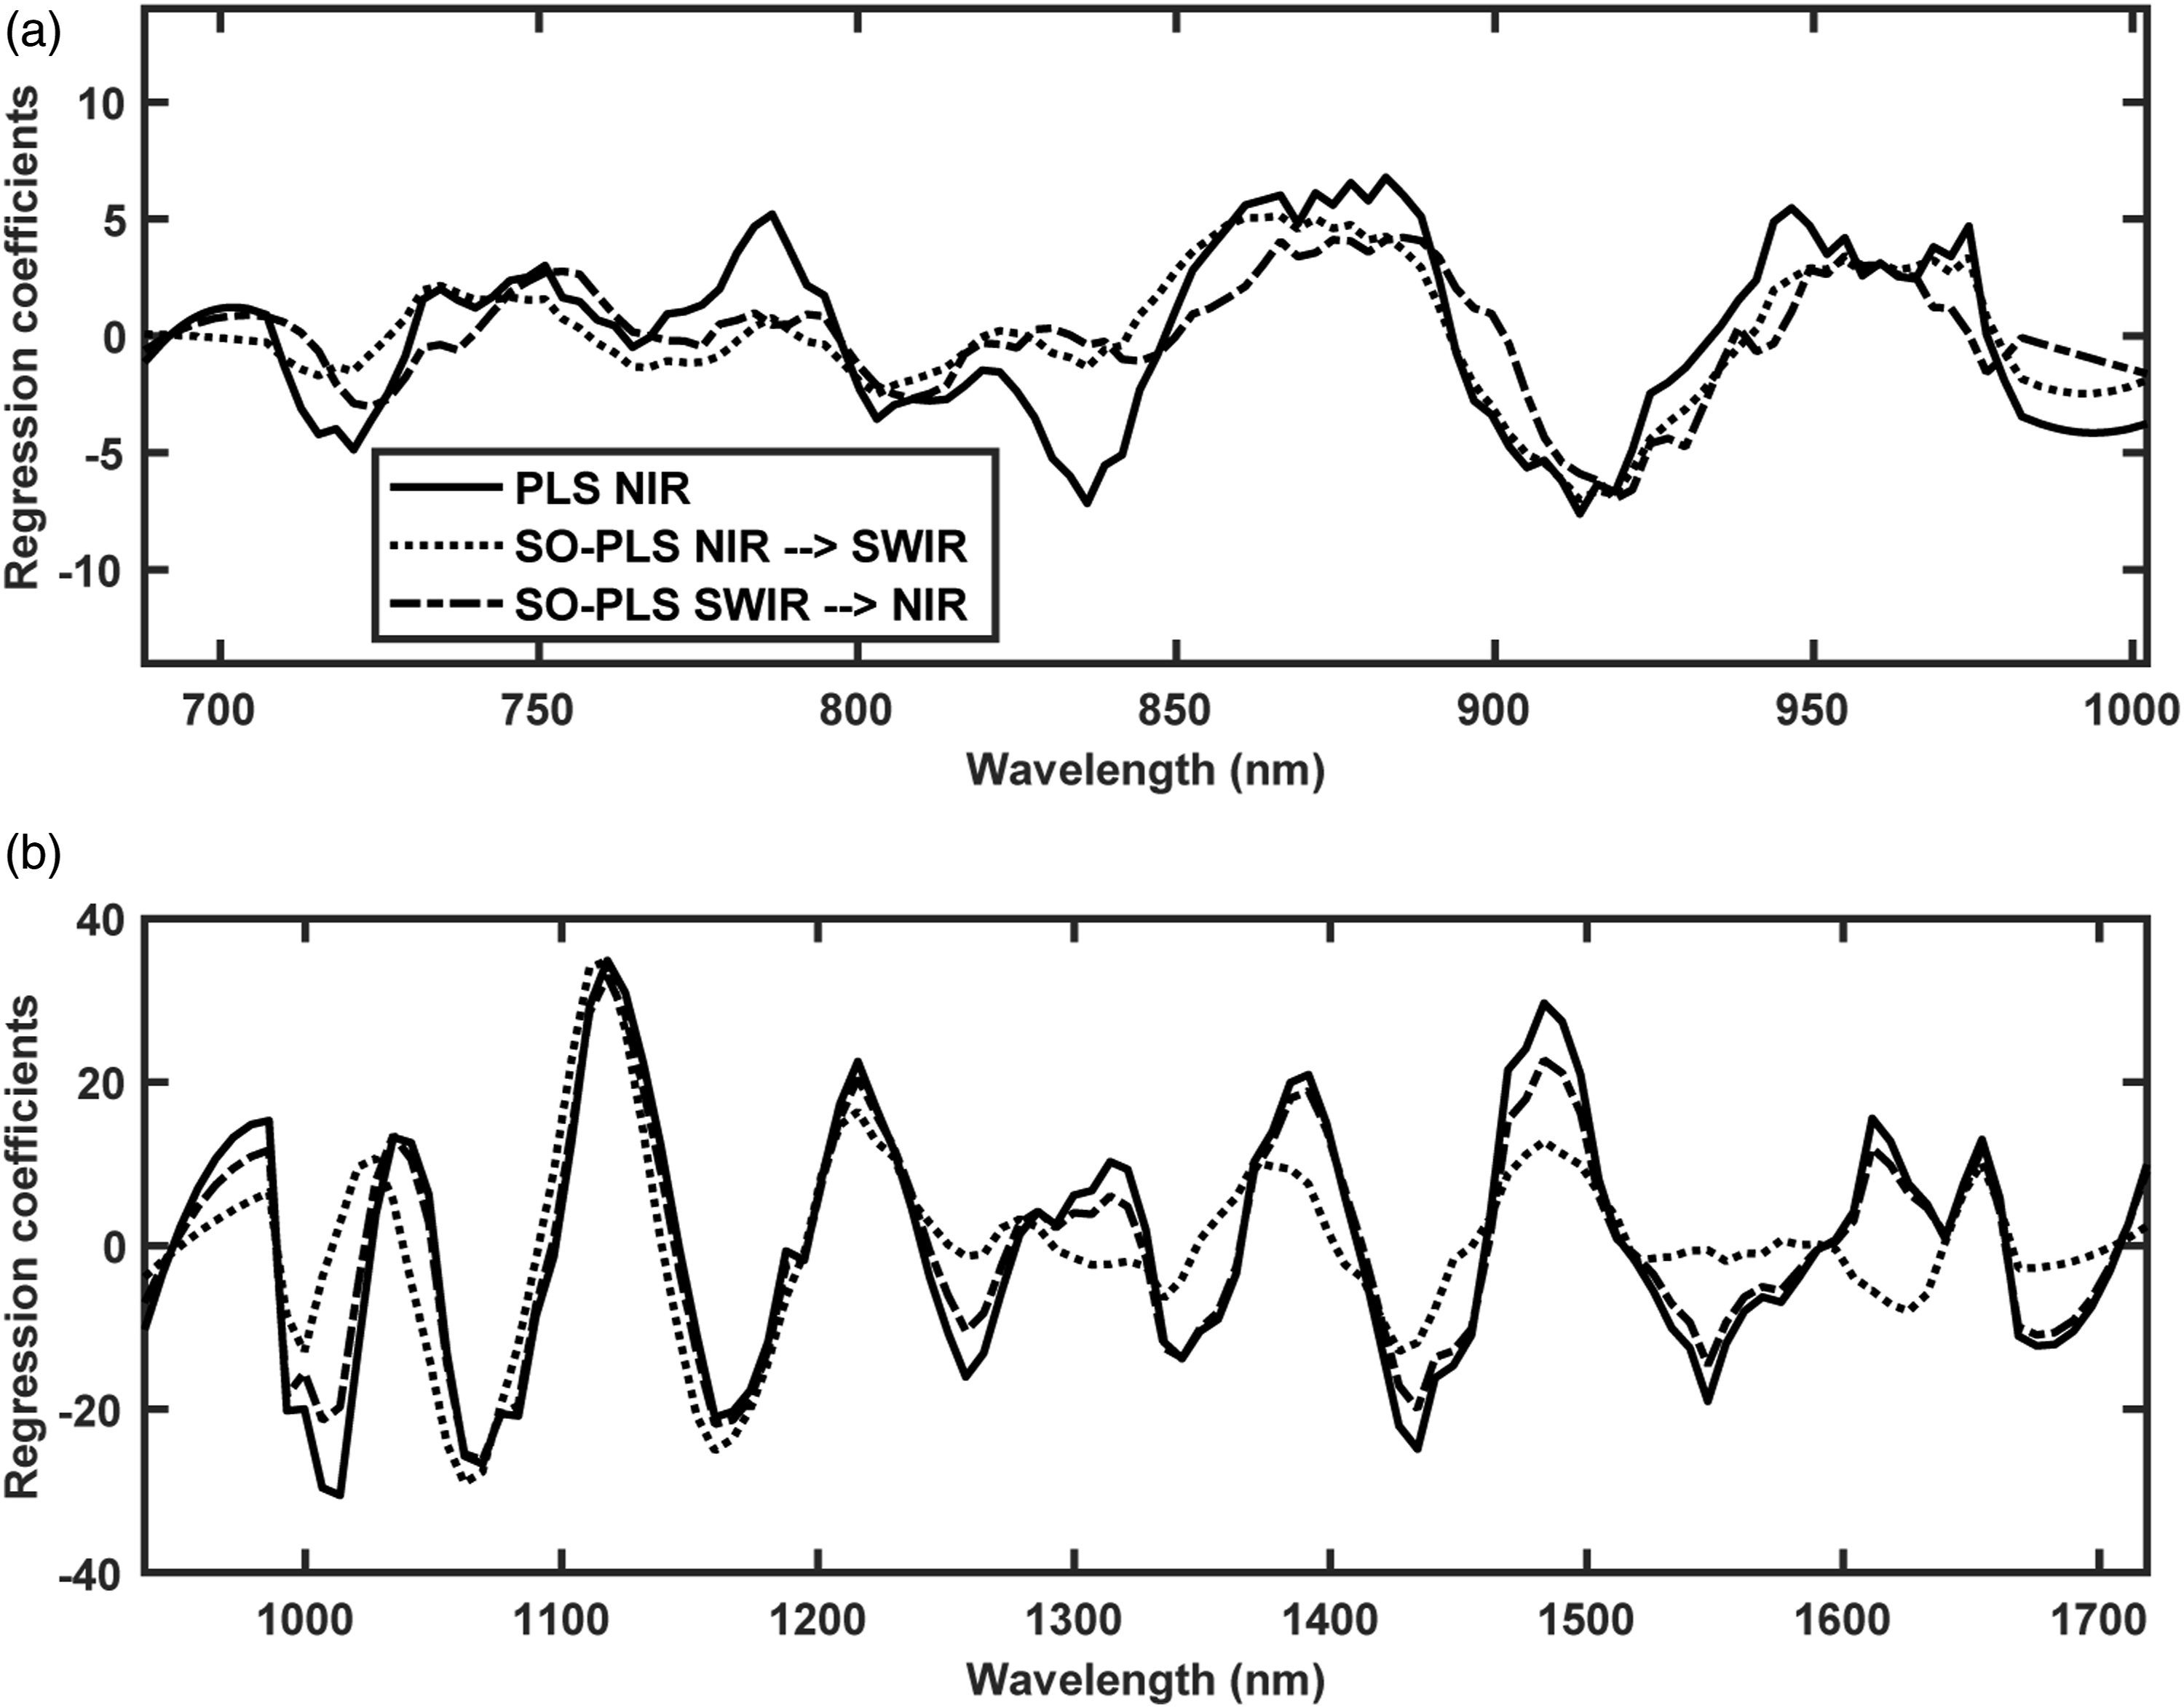
The regression coefficient for the PLS models made independently for FX10 and FX17 data sets and the SO-PLS fusion models are shown in Figure 6. In Figure 6, the regression coefficient for FX10 (NIR) is shown in Figure 6(a), and for FX17 (SWIR) is shown in Figure 6(b). It can be noted that all the regression vectors for different cases had similar overall shapes, however, had differences locally. The regression coefficient for the PLS modelling on the FX10 data had several peaks which are different compared to the regression coefficient obtained for FX10 data with the SO-PLS modelling. The difference is since different numbers of LVs were found optimal for different modelling scenarios. For example, the PLS modelling on the FX10 data used 9 LVs as optimal, while the SO-PLS modelling used 7 LVs. This is also the reason for extra peaks present at ∼720 nm, 790 nm, 840 nm in the regression coefficient of PLS analysis while absent in the regression coefficient for SO-PLS analysis (Figure 6(a)). In the case of FX17 (SWIR) (Figure 6(b)), the regression coefficient for the PLS model and the SO-PLS analysis considering the FX17 as the first block has a very close regression coefficient. This is since both regression coefficients were obtained with the same number of LVs = 13. The regression coefficients for FX17 obtained with the SO-PLS analysis while keeping it as the second block were different from other regression coefficient as the optimal model used only 11 LVs. Peaks at several locations (Figure 6) can be assigned to the overtones of OH and CH bonds,
36
which are presented in abundance in macromolecules such as water and sugar present in fresh fruit. Prediction plots for PLS modelling performed using (a) FX10 (NIR) data and (b) FX17 (SWIR) spectra.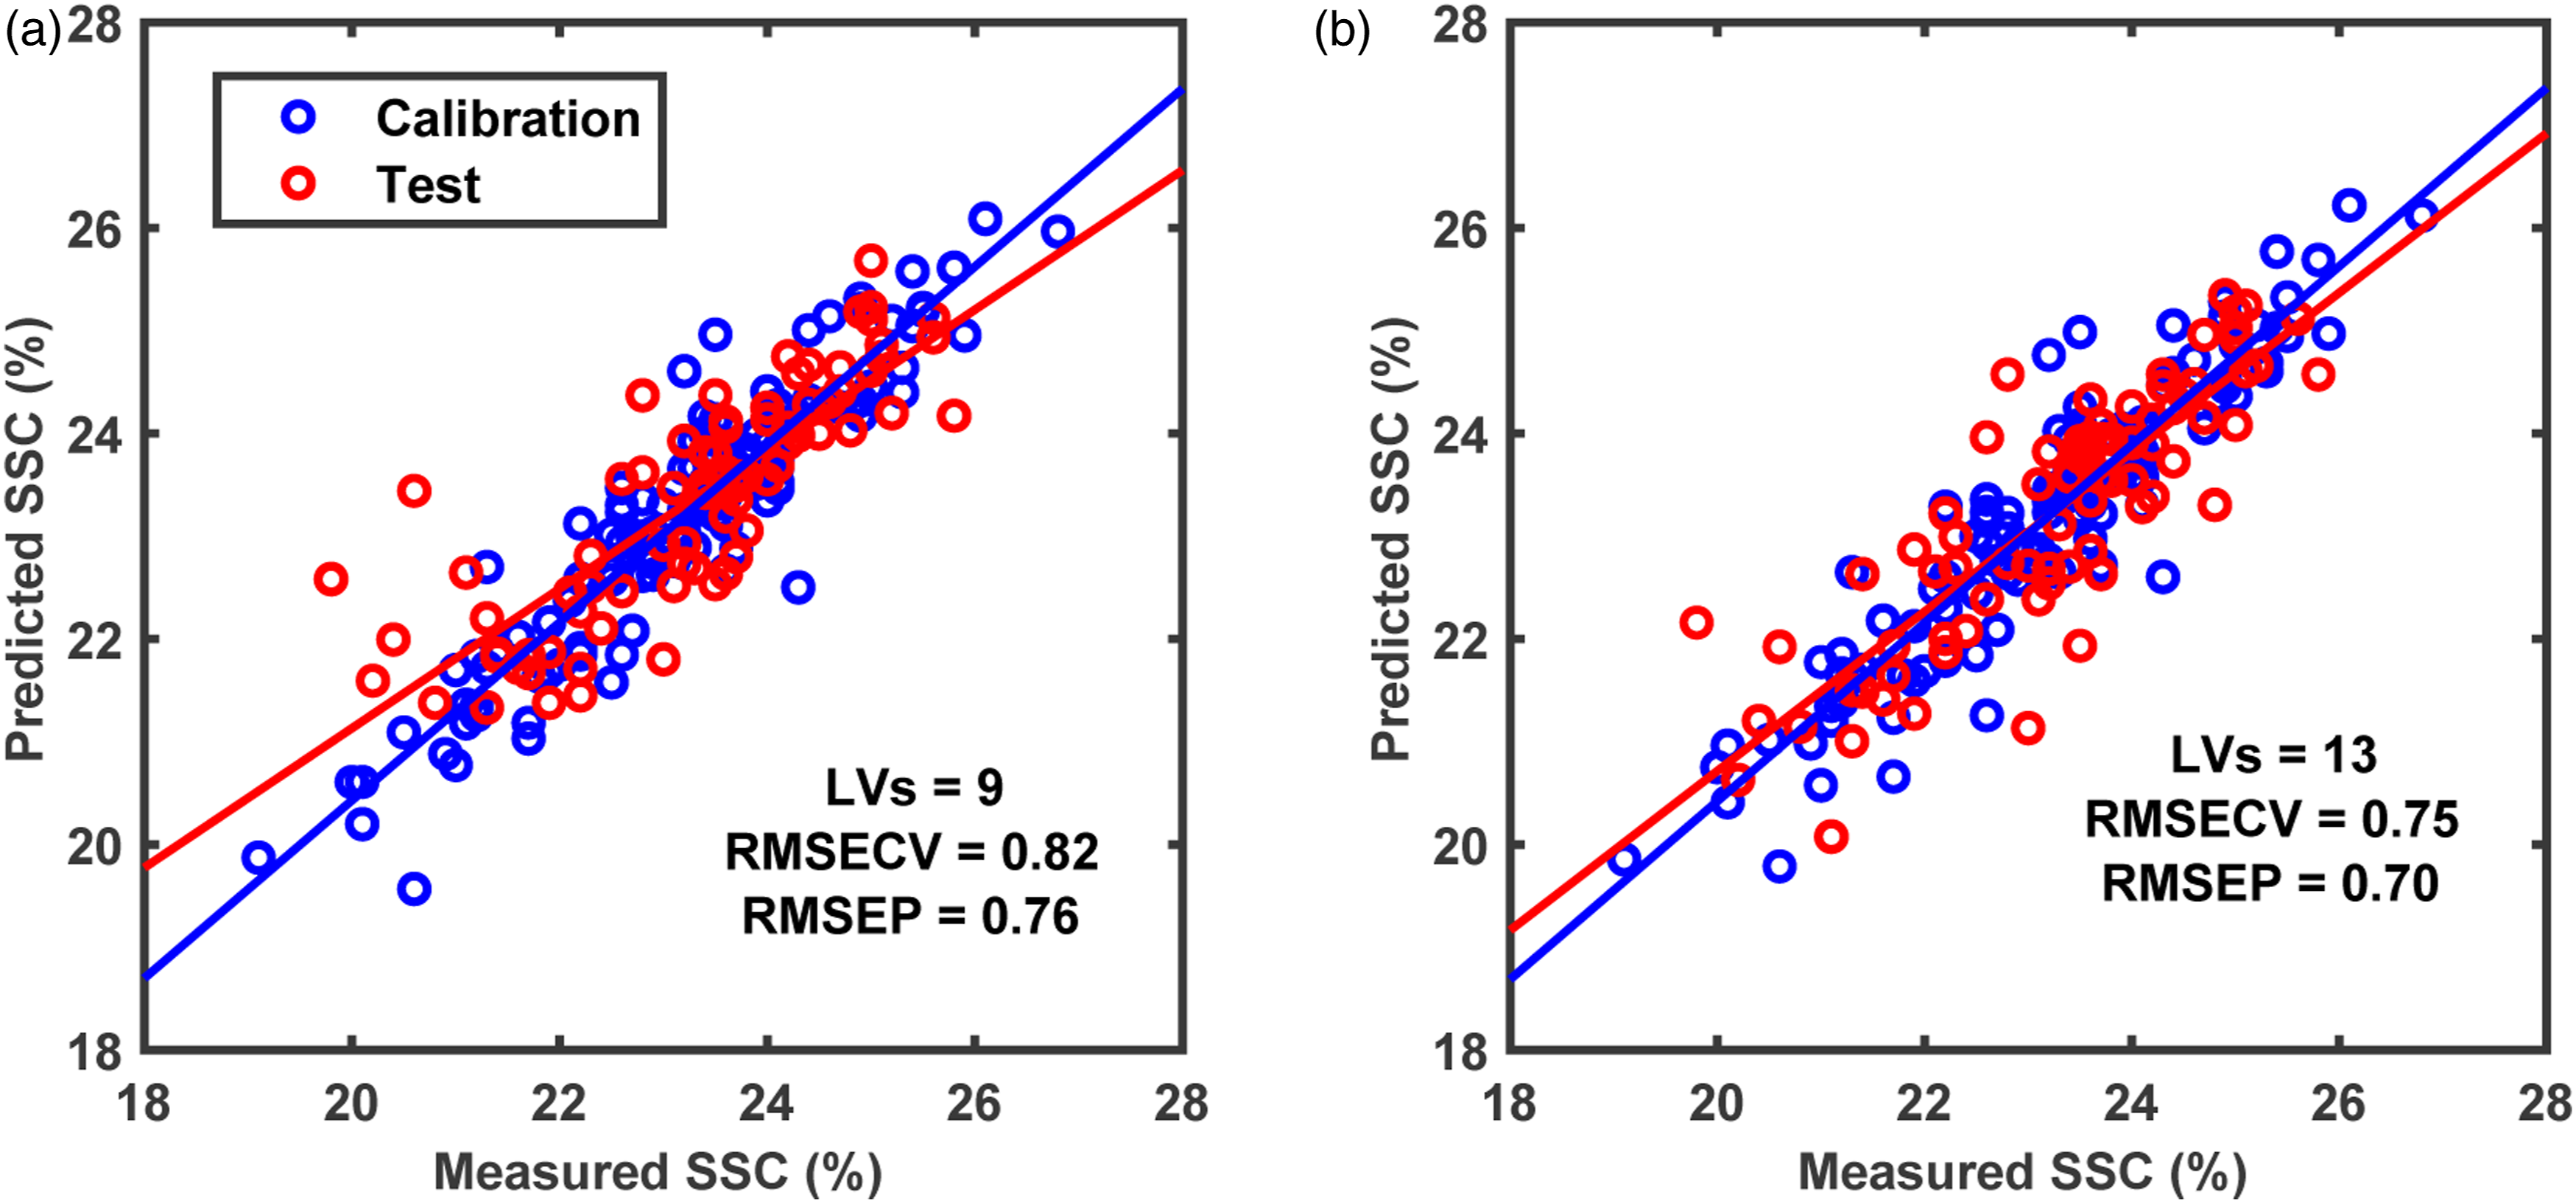
CovSel and SO-CovSel analysis
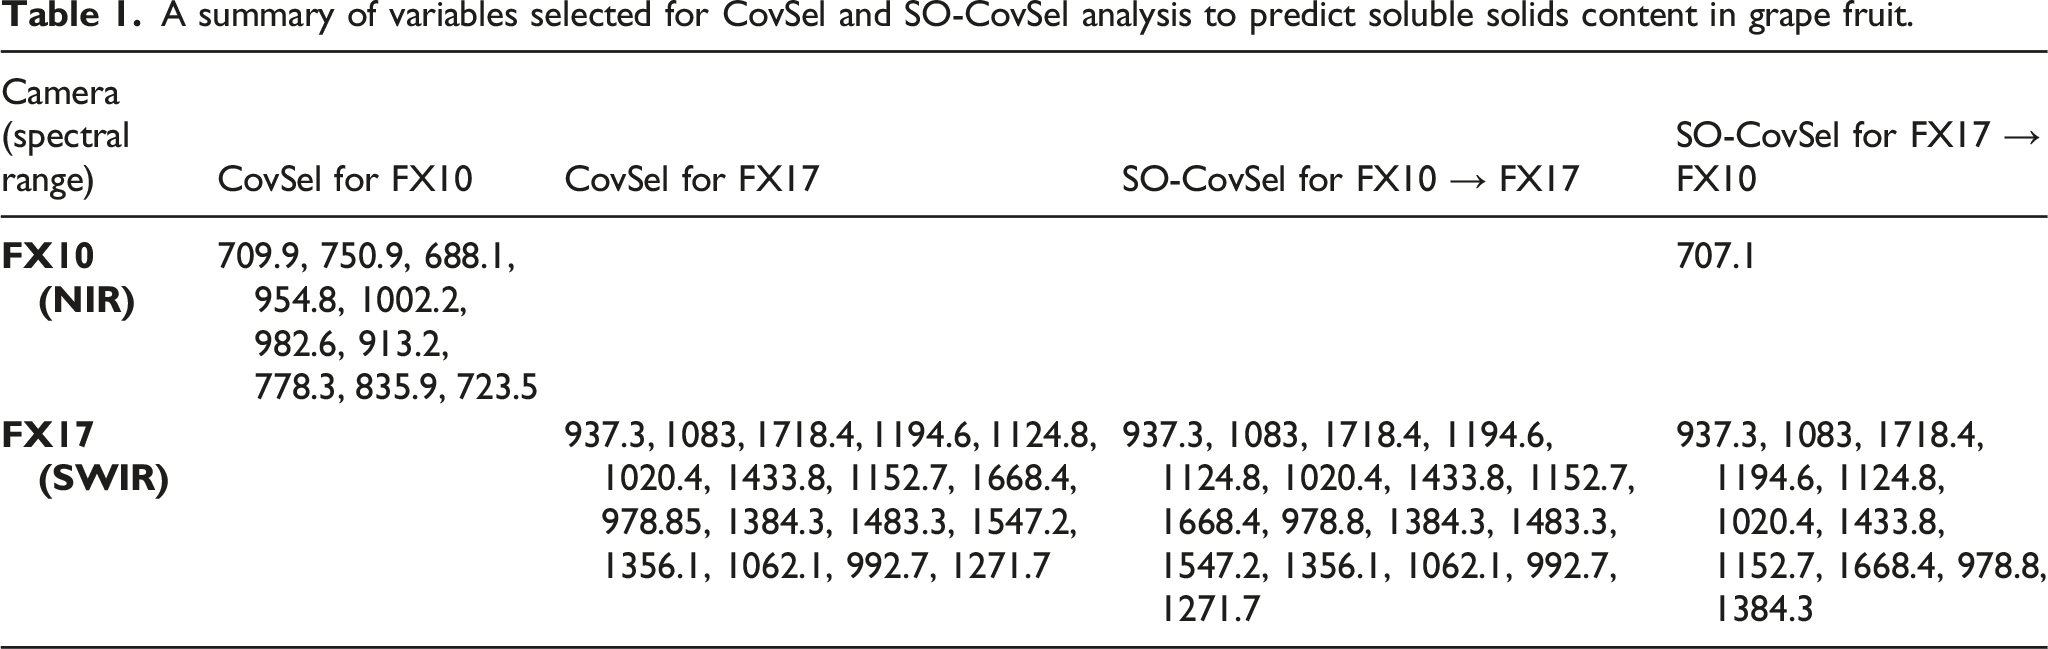
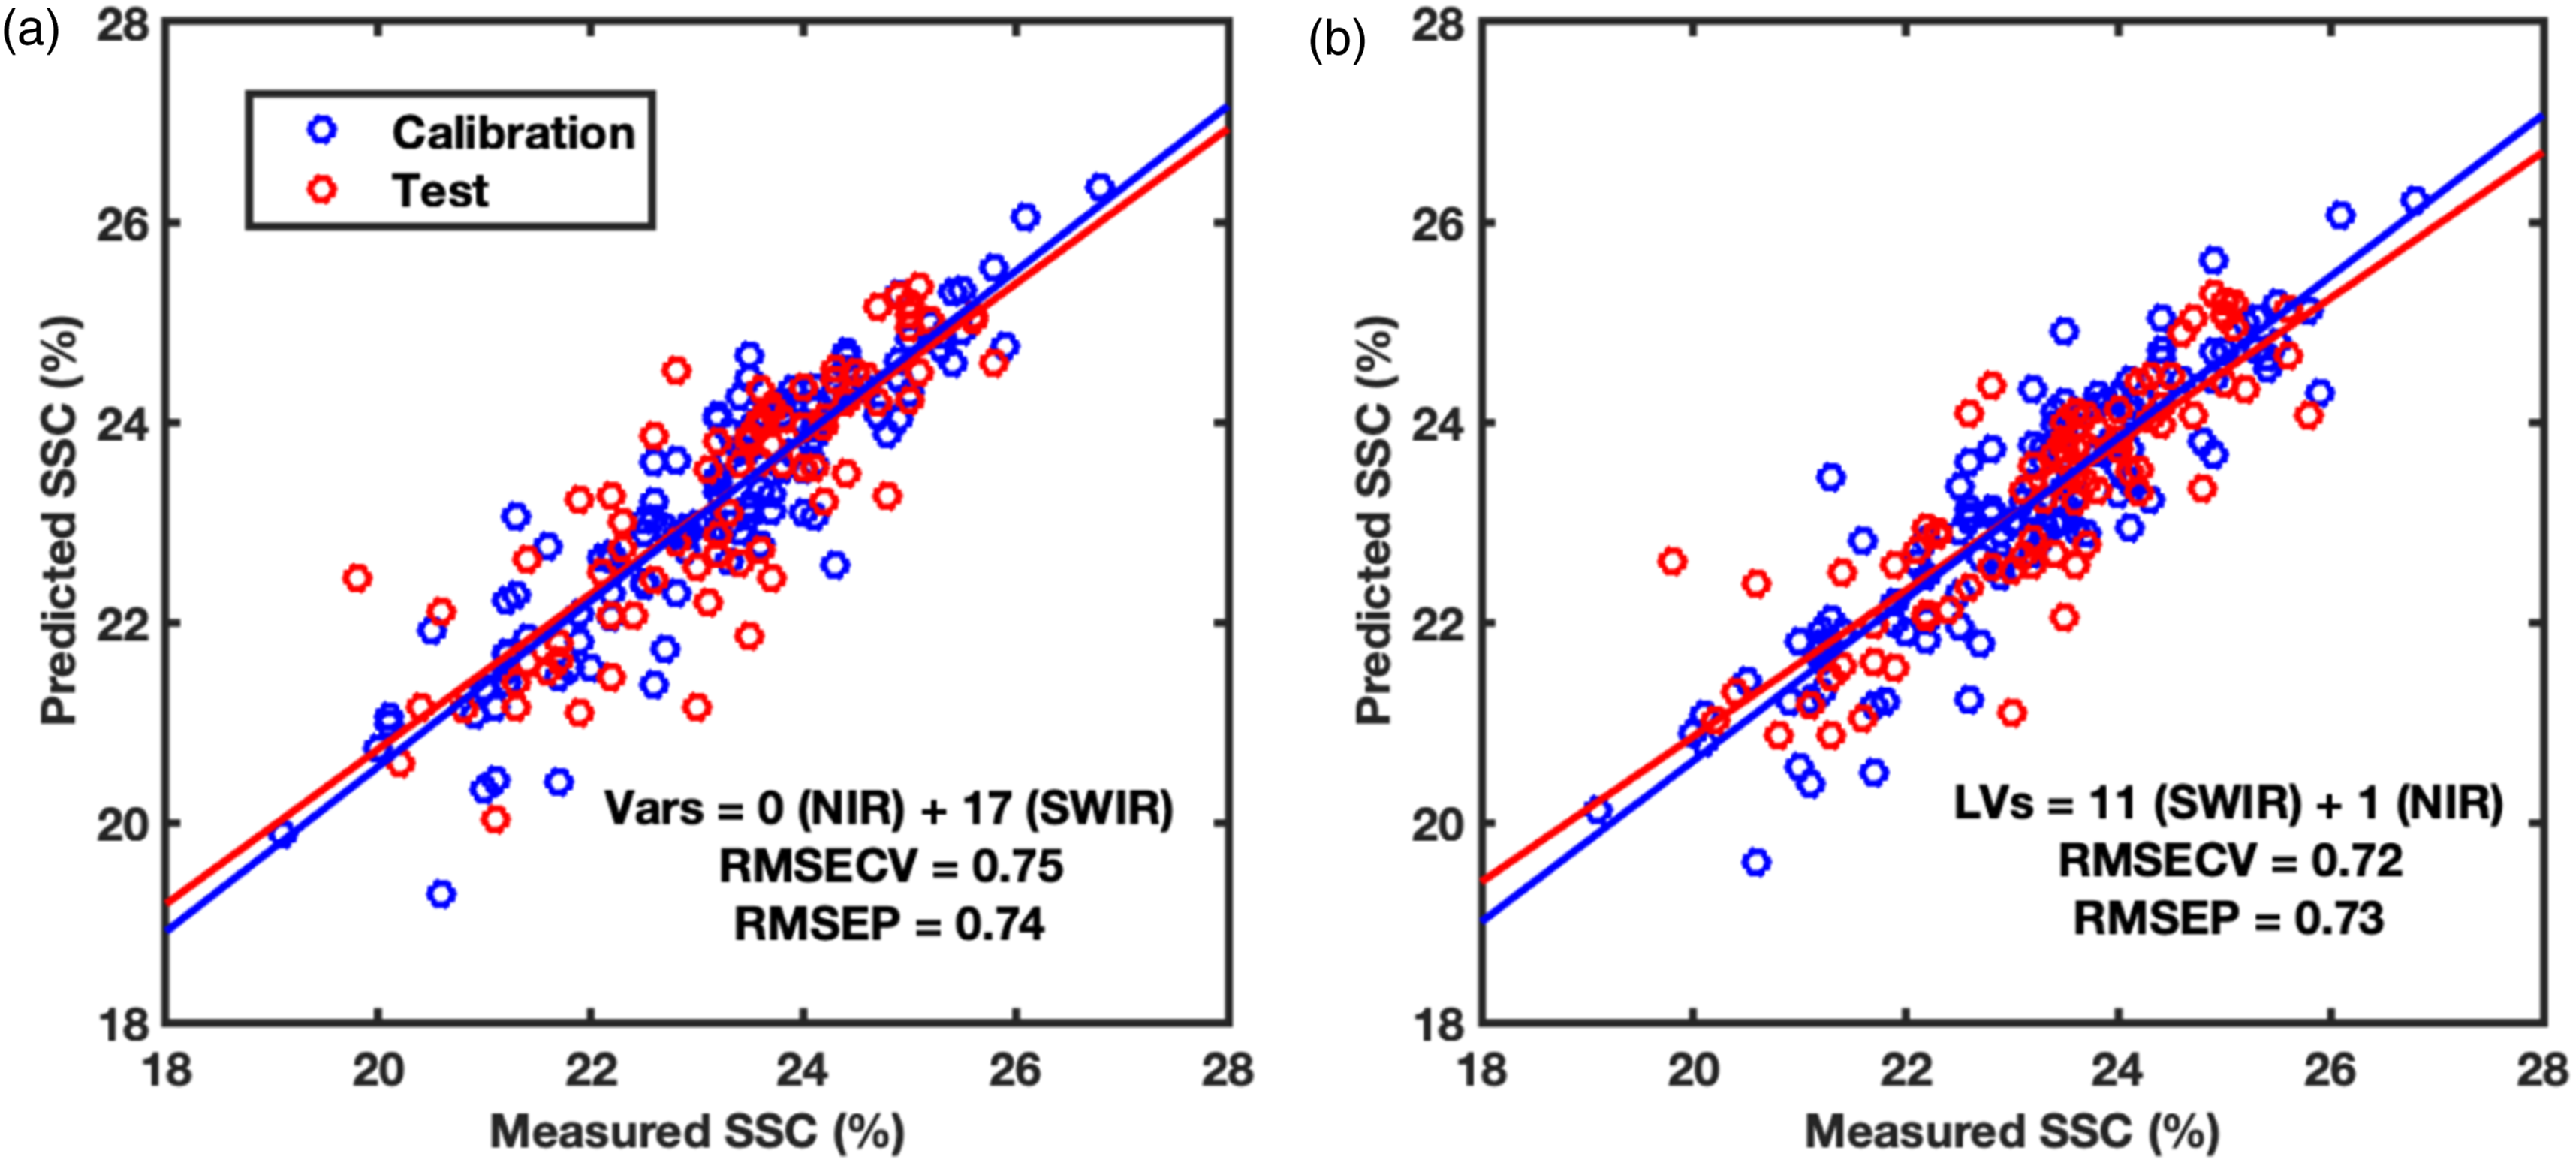
The second part of the analysis was performed to reduce the number of spectral bands required to predict SSC in grapes while maintaining the predictive performance. At first, the CovSel analysis was performed for individual sensors data i.e., FX10 and FX17 (Figure 7). The CovSel analysis showing a similar performance to the PLS modelling was achievable with a reduced number of spectral bands. For example, for the FX10 data set, the model based on only 10 spectral bands achieved RMSEP = 0.78% which was similar to the RMSEP obtained with the PLS analysis performed using 115 spectral bands. Similarly, for the FX17 data set, a model based on only 17 spectral bands achieved RMSEP = 0.74% which was close to the RMSEP obtained with PLS analysis performed using 112 spectral bands. For SO-CovSel with the FX10 as the first block and FX17 as the second block, the same solution (Table 1) as the CovSel analysis on FX17 data was obtained. This is because for SO-CovSel analysis no bands were selected from the FX10 data while all 17 bands were selected from the FX17. For SO-CovSel analysis with the FX17 as the first block and FX10 as the second block, in total 12 bands were selected with 1 band from FX10 while 11 bands from FX17 data. The performance of SO-CovSel model using the 1 band from FX10 while 11 bands from FX17 data (Figure 8(b)) was slightly better than the SO-CovSel analysis using only the 17 variables from FX17 (Figure 8(a)). However, the main benefit of the SO-CovSel analysis can be considered as the necessity of only 11 bands to predict SSC in grape fruit. Such selected bands may support the development of multispectral systems for predicting SSC in fresh fruit. The NIR and SWIR bands selected from CovSel analysis are presented in Table 1, and most of the bands directly correspond to the overtones of OH and CH bonds from macromolecules such as water and sugar present in abundance in fresh fruit. SO-PLS modelling for fusion of FX10 (NIR) and FX17 (SWIR,) data. (a) SO-PLS performed following the order FX10 (NIR) and then FX17 (SWIR), and (b) SO-PLS performed following the order FX17 (SWIR) and then FX10 (NIR). A summary of variables selected for CovSel and SO-CovSel analysis to predict soluble solids content in grape fruit. Regression coefficients for PLS and SO-PLS modelling performed on (a) FX10 (NIR) and (b) FX17 (SWIR) spectral data.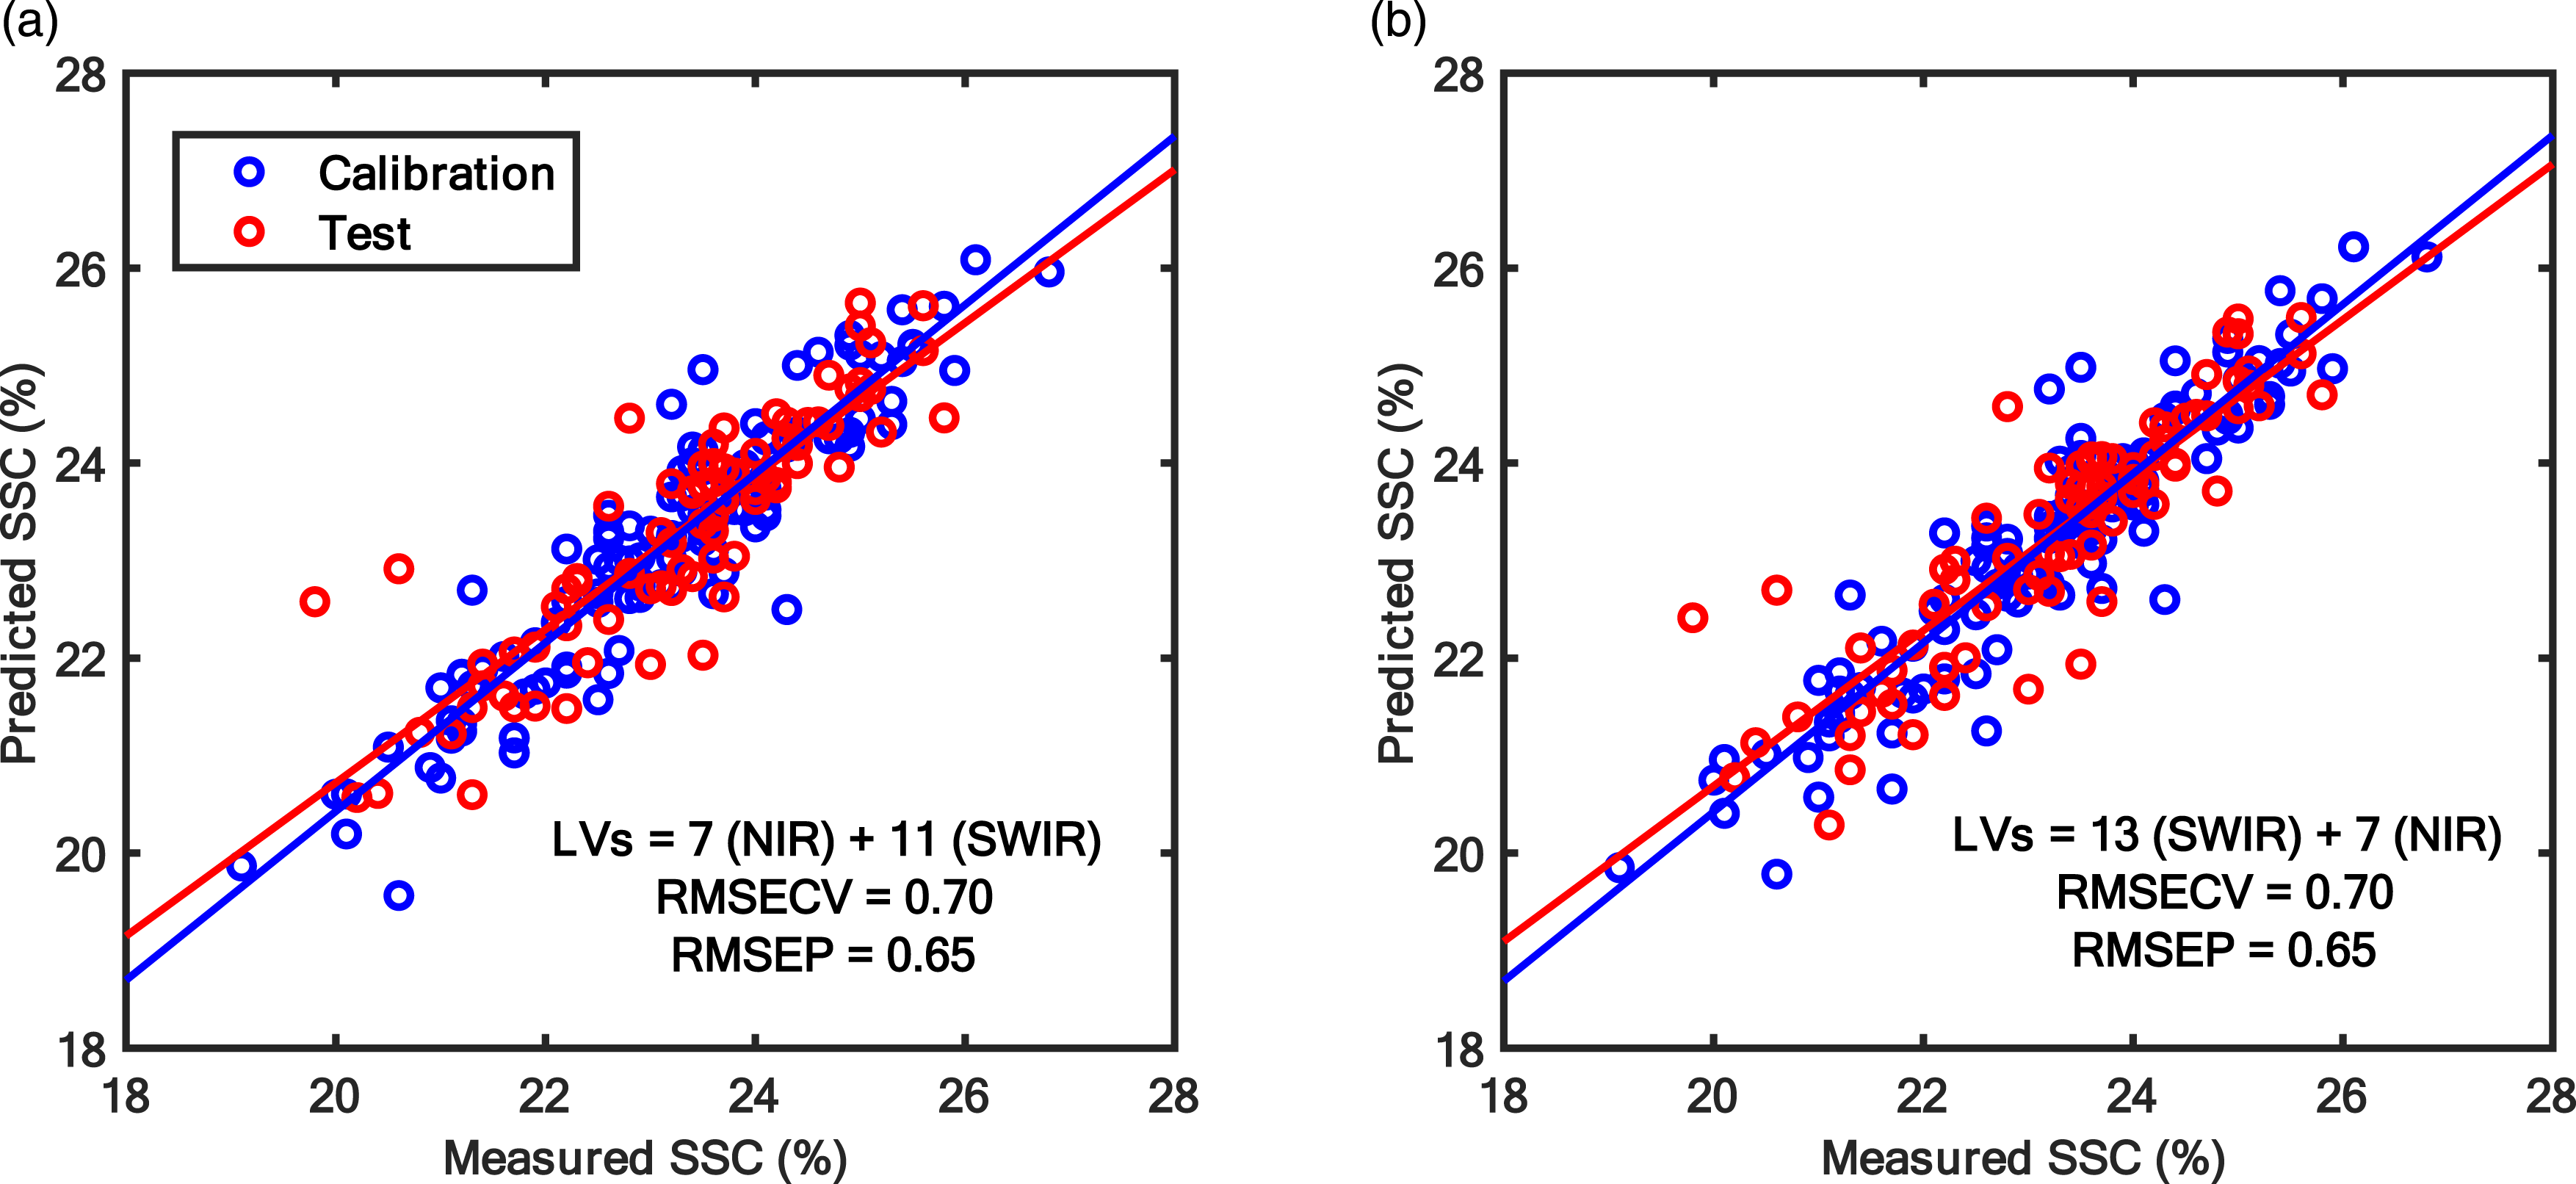
Conclusions
In this study, a multimodal close range hyperspectral imaging system demonstrated its potential to predict chemical properties such as soluble solids content in fresh fruit. The multiblock predictive modelling approaches such as SO-PLS and SO-CovSel were proposed for latent space modelling and variable selection for interpretable multimodal data modelling. Sequential fusion of NIR and SWIR hyperspectral camera data achieved lower RMSEP compared to that achievable with only one hyperspectral camera. The same result can also be achieved with only 11 spectral bands (selected from NIR and SWIR) compared to 227 total bands available in the spectral camera (both NIR and SWIR combined). Multimodal hyperspectral imaging can have wide implications for improving the prediction of food properties and multiblock modelling is the ideal tool to model such multimodal data. The developed system and presented analysis can be explored for a wide range of applications not limited to fresh fruit analysis. Prediction plots for CovSel modelling performed using (a) FX10 (NIR) and (b) FX17 (SWIR) spectral data. SO-CovSel modelling for fusion of FX10 (NIR) and FX17 (SWIR) data. (a) SO-CovSel performed following the order FX10 (NIR) and then FX17 (SWIR), and (b) SO-CovSel performed following the order FX17 (SWIR) and then FX10 (NIR). Figure 7.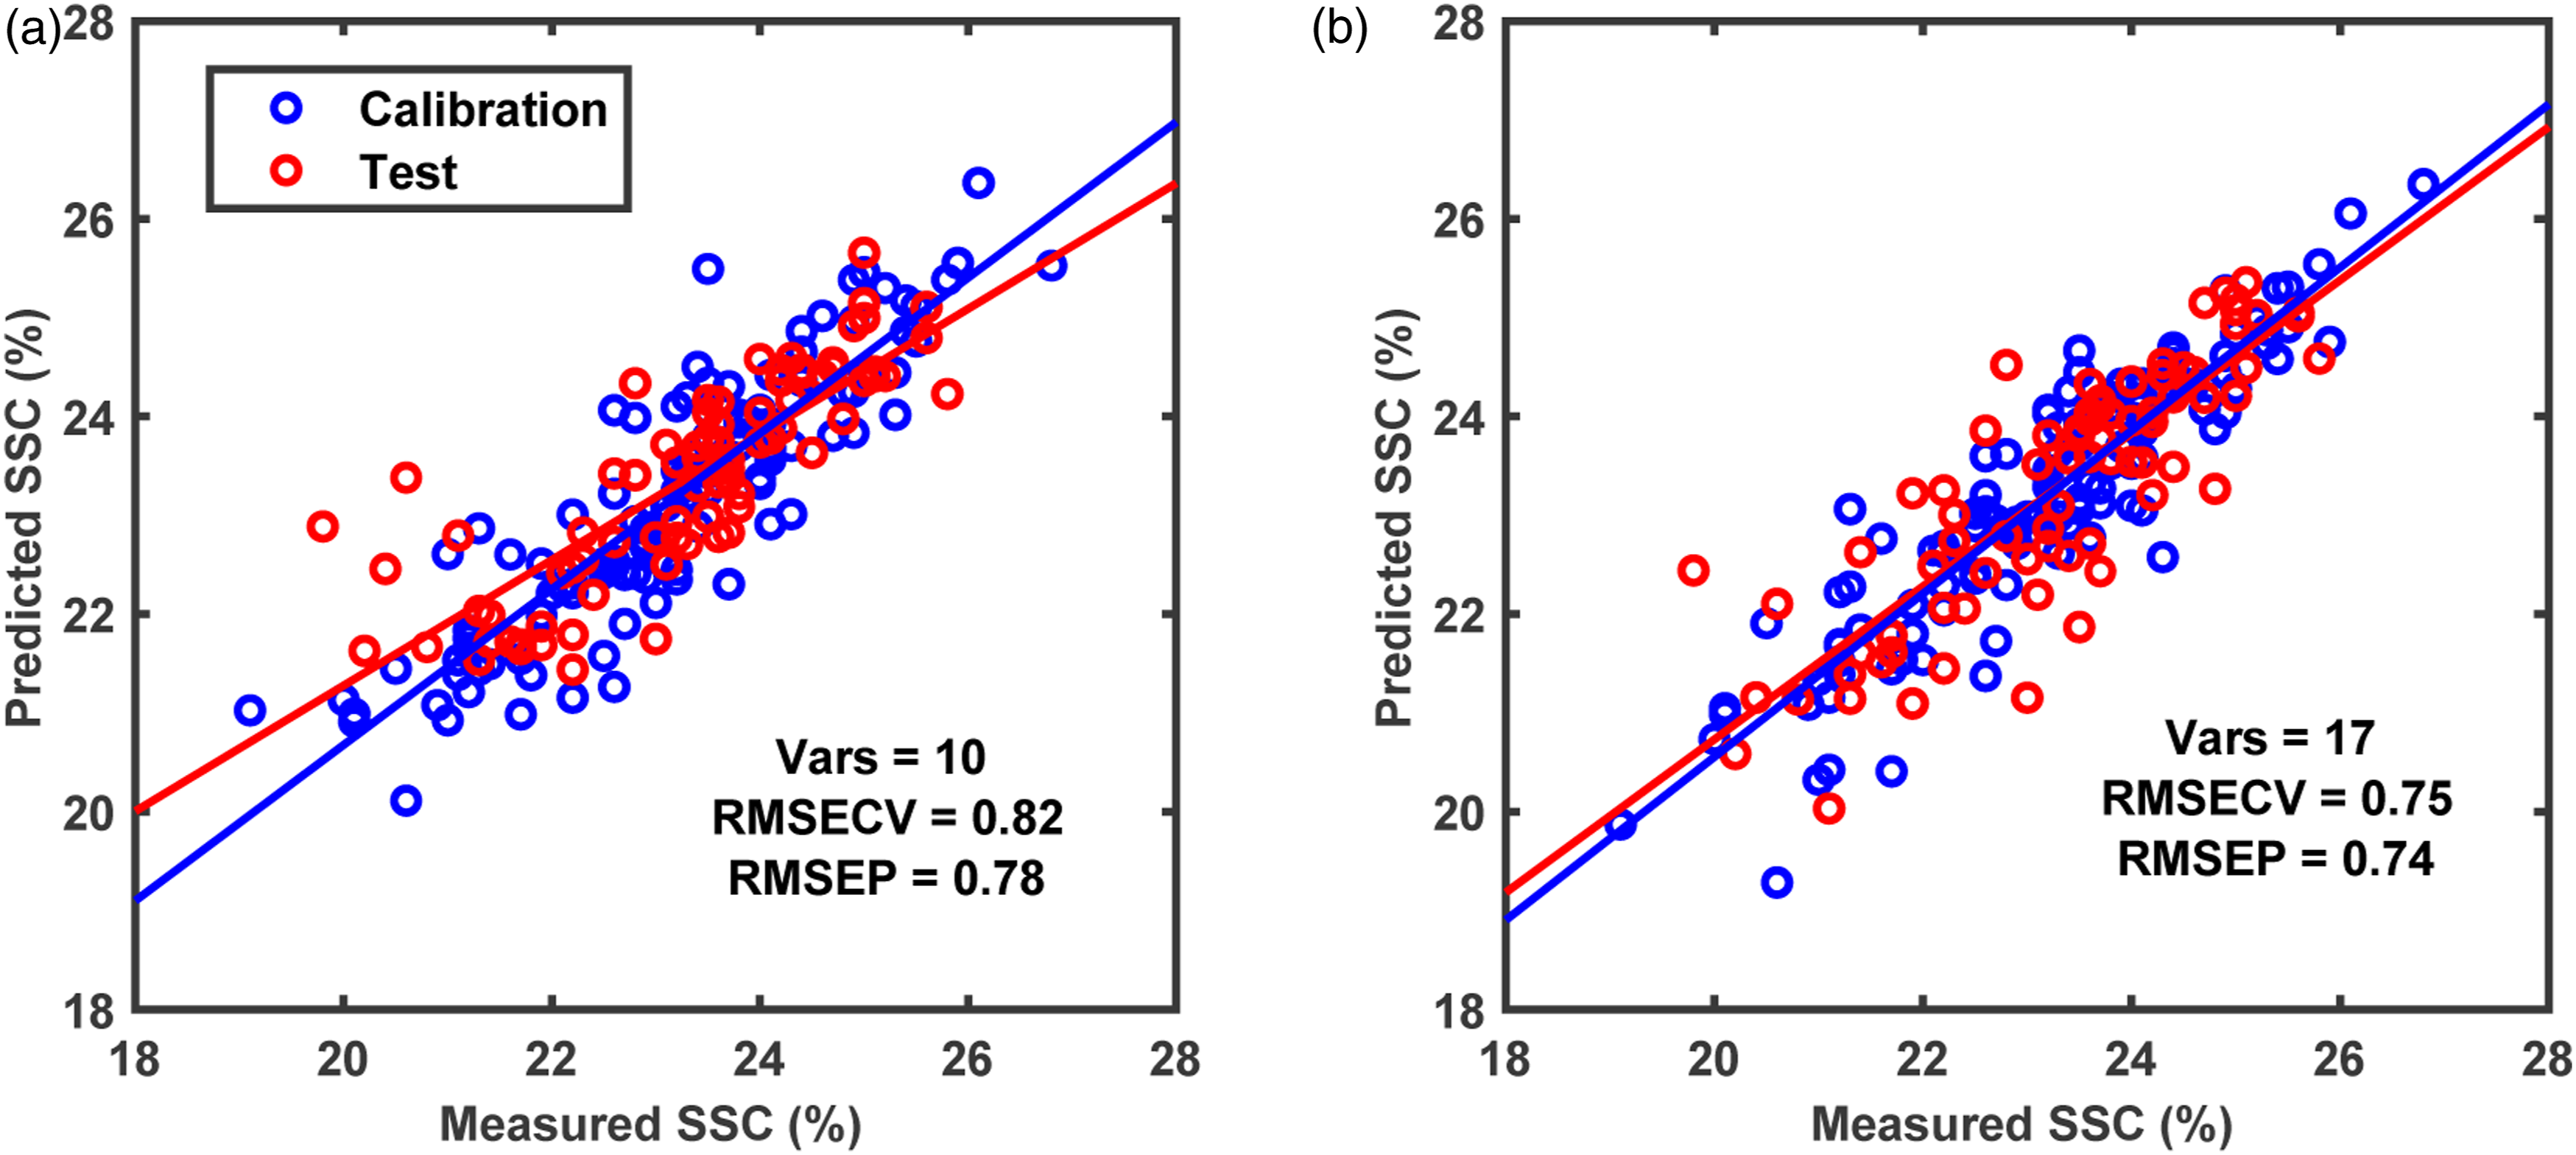
Footnotes
Declaration of conflicting interests
The author(s) declared no potential conflicts of interest with respect to the research, authorship, and/or publication of this article.
Funding
The author(s) received no financial support for the research, authorship, and/or publication of this article.