
Abstract
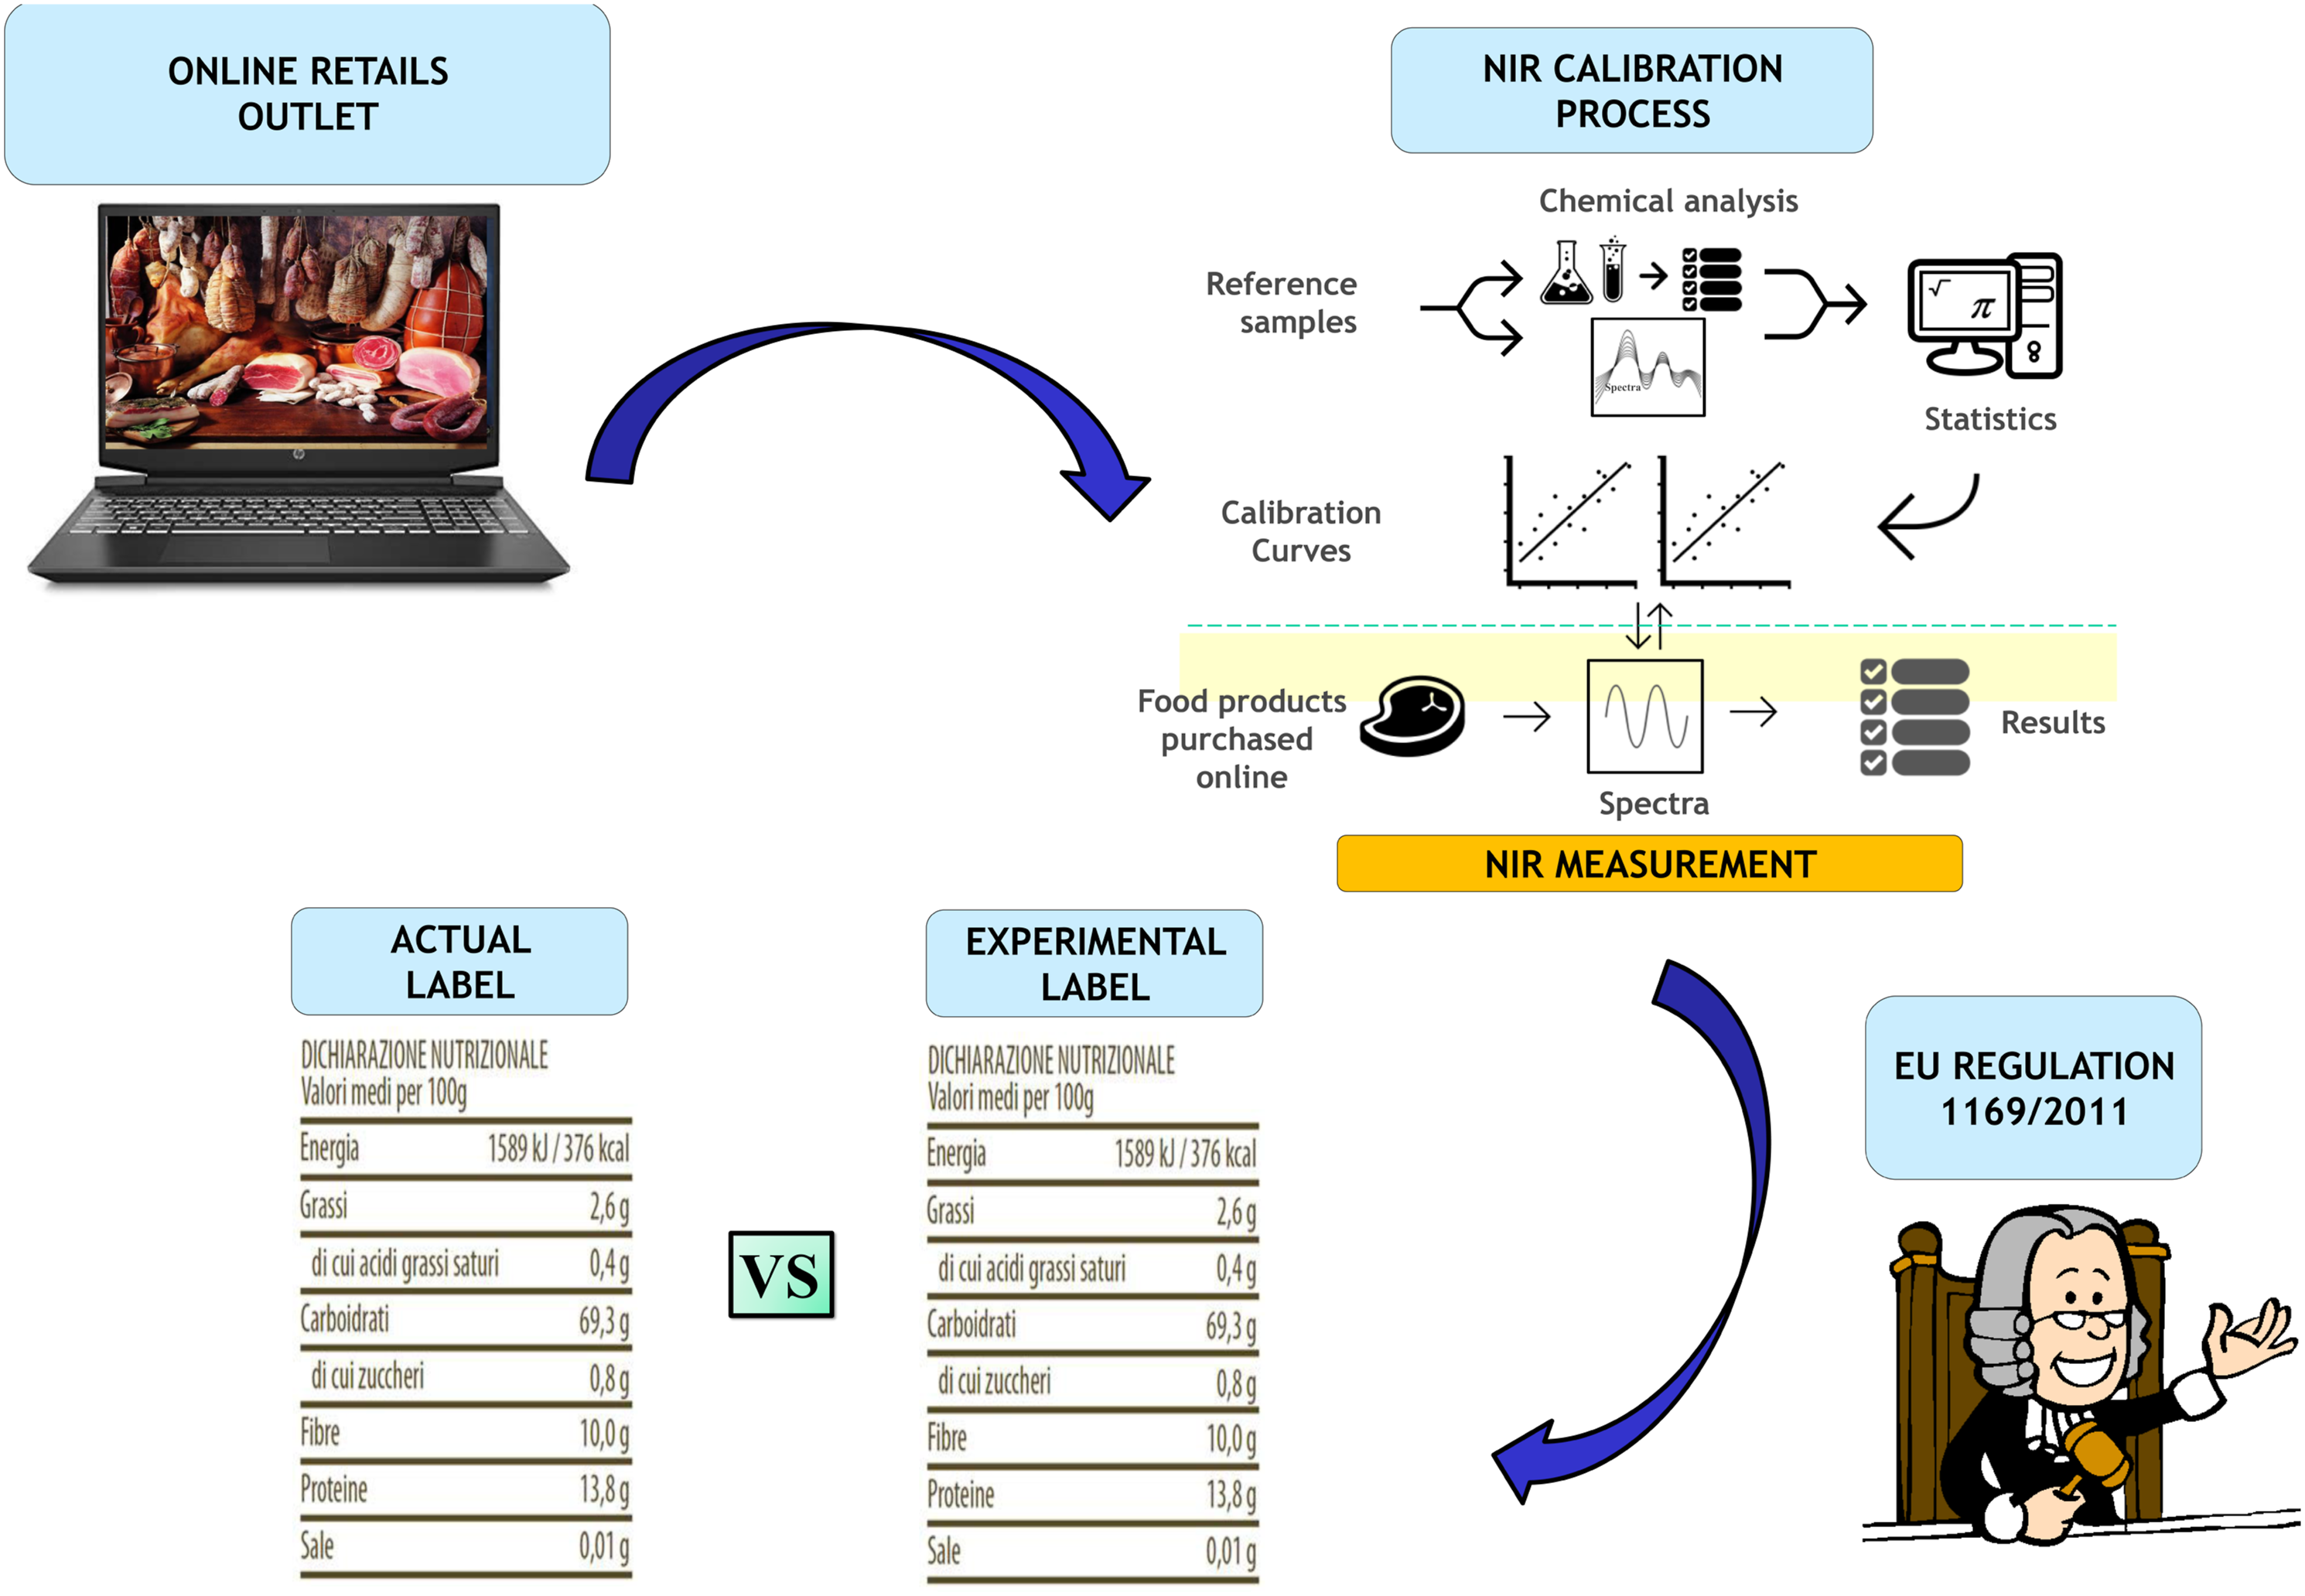
Nutritional information provided on food labels can impact healthy dietary decisions of consumers. The accuracy of the information provided is of paramount importance to guide consumers’ food choices and prevent food-related chronic diseases. The present study aimed to verify the veracity of nutritional labels of 103 food products purchased online through well-known e-commerce websites (80 processed and 23 unprocessed items) using near infrared spectroscopy. Among processed food products, surprisingly, 28 food products out of 80 (35%) did not bear nutritional labels. Considering the European tolerances for nutrient values declared on a label, the comparison of experimental values with those reported on the labels showed that more than 74% of the values declared on the label were congruent with the NIR experimental data, whereas 7.5% of the label values were non-compliant with the tolerance limits, and about 11.3% were slightly outside the tolerance limits. Note that 6.6% of the values indicated in the labels did not abide the regulation at all. Finally, 35.8% of the samples showed at least one value outside the tolerance limits. The current study demonstrated the capability of NIR spectroscopy for monitoring the compliance of nutritional labels with EU tolerance limits and guiding the choice of reference methods for further confirmation purposes.
Keywords
Introduction
The nutritional information panel (NIP), printed on food packaging, is a valuable means to inform consumers about the composition of food and help them in selecting healthy products.1,2 With the increase of nutrition-related diseases, it is crucial that the nutritional information provided on NIP labels is correct, as it impacts on healthy dietary decisions of consumers. 3 Nutritional labelling has been compulsory in the European Union (EU) since the 1990s. 4 The latest EU regulation (No 1169/2011) combines two directives (2000/13/EC and 90/496/EEC) into one unique regulation. 5 According to this EU regulation, food manufacturers of pre-packaged food are required to provide a nutrition information panel reporting energy value (kcal or kJ), and amounts of fat, saturated fatty acid, carbohydrate, sugars, protein and salt. Additional information can also be included: polyunsaturated fatty acid, monounsaturated fatty acid, polyols, starch, fiber as well as any of the vitamins or minerals listed in point 1 of Part A of Annex XIII, and present in significant amounts as defined in point 2 of Part A of Annex XIII.
Clear description of allergens, emphasized through a typeset that clearly distinguishes it from the rest of the list of ingredients, for example by means of the font, style or background color, is required. According to the EU Regulation, the declared values can be average values based on: (i) the manufacturer’s analysis of the food; (ii) a calculation from the known or actual average values of the ingredients used; or (iii) a calculation from generally established and accepted data. It is also known that the content of nutritional components is affected by environmental, genetics and processing factors such as feed and soil. Note that the nutritional components can be also affected by the geographical origin of raw materials, manufacturing processes and storage. Therefore, a guidance document is available for competent authorities for the control of compliance with EU Regulation (EU) No 1169/2011 with regard to the setting of tolerances for nutrient values declared on food labels. The document reports all the details on tolerance limits and rounding rules as can be visualized on the European Community platform. 6 Tolerances refer to acceptable differences between nutrient values declared on a label and those established in the course of official controls.
In recent years, grocery e-commerce has become a massive, fast-growing market and, as is already the case for physical stores, nutritional labels on pre-packaged foods are mandatory. Until a few years ago, online grocery buyers were busy young people in search of convenience and fast delivery. 7 The recent COVID-19 lockdown measures accelerated the massive shift of consumers from regular supermarkets to online grocery shopping and home delivery. Governments have encouraged the use of e-commerce in the retail food supply chain, and consumers have used online shopping to access food while maintaining social distancing. 8
In the United Kingdom, online and in-store nutrition information panels were examined, categorized and analyzed to discern the variety of label designs used and consistency between online and in-store labelling. 9 Recent studies investigated whether pre-packaged foods provided credible nutrition labels for consumers and how many pre-packaged foods did not comply with the tolerance limits in physical stores.10–13 While salt and saturated fat were outside the tolerance limits in Canadian food products, 11 similar outcomes were obtained when checking the compliance of Portuguese ready-to eat foods. 13 Recently, poor availability and large inconsistencies in food labelling information in the e-grocery retail environment in Canada was found. 14 However, there is little published data on the compliance with the EU tolerance limits of nutrition labels for food purchased through online retail outlets.
The analysis of food components using the official wet chemistry methods is expensive and laborious. On the other hand, the food industry and legislators need cost-efficient solutions for measuring the components of nutritional labels with rapidity and without the extensive use of organic solvents. Near infrared (NIR) spectroscopy meets these requirements, allowing the content of moisture, total fats (saturated, polyunsaturated and monounsaturated fats), protein, carbohydrate, sodium chloride, moisture and ash in intact food samples to be determined.15–17 The method is a cost-effective, non-destructive, rapid technique that does not use organic solvents. NIR spectroscopy has been applied to estimate the food composition for nutritional fact labels, 18 evaluate authenticity and provenance19–26 and to monitor in-line food production and processes. 27 The application of NIR spectroscopy is based on calibration models that rely on quantitative values obtained by reference methods. Chemometrics are used to find a mathematical relationship between absorption data and product contents. Once the nutritional values of a food are estimated by NIR, these values can be used to determine the metabolisable energy of the food system. 28 The accuracy of the technique in measuring macronutrients in food has been already demonstrated by several studies.28–31 Following the standardization procedures described by ISO 12099:2010 and ISO 21543:2006, food companies, analytical laboratories have switched from expensive and time-consuming wet chemistry to (NIR) spectroscopy to measure nutrient content.
The NIR spectral data were combined with those of a colorimetric method that employs a phenol-sulfuric acid (PSA) assay in microplate format to quantify carbohydrates. 32 This method is used widely in food, algae, 33 mushrooms 34 and feed35–37 because of its sensitivity and simplicity.
The purpose was to assess whether the declarations of nutritional values reported on the NIP of food products, purchased via well-known Italian online grocery e-commerce websites, were correct and compliant with the EU tolerance limits.
Note that e-groceries, belonging to the large distribution organization (LDO), sell food produced by large food manufacturers and provide the same portfolio of products as their physical stores. On the other hand, small local farmers and fisheries sell their food products via well-known, third-party e-commerce websites. It is most likely that this is the first systematic evaluation of the compositional values stated on nutritional fact labels of foods purchased from online groceries of well-recognized e-commerce platforms.
Materials and methods
Sample collection
A total of 103 food products (61 meat-based products, 17 fish-based products and 25 cheeses) were purchased from a well-known e-commerce website that has a dedicated e-grocery section in its web portal with food items from all over the Italian area. Note that the samples analyzed in this study were produced by Italian small local dairy and meat farms and fisheries and are mainly sold in online retail outlets. About 20% of samples were produced by well-known food suppliers that sell their items both in regular supermarket and online retail outlets. The period of collection of the samples covered a little over 2 years (end of 2018-beginning of 2020).
Sample preparation and compositional analysis
Upon their arrival, the samples were stored and analyzed within 72 h. Foodstuffs were stored at their most suitable storage temperature: at room temperature, in the refrigerator +2/+4°C or frozen at −18°C. Based on the approved laboratory internal procedure, the representative amount of sample is considered 50 g. Therefore, after removing non-edible parts, a minimum amount of 50 g of each food product was homogenised (Grindomix GM 200, Retsch, Germany) then two aliquots were placed in two Petri dishes. If available, the entire food item was homogenized after removing non-edible parts.
Near infrared spectroscopy
After equilibrating the samples to room temperature, they were subsequently analyzed on a Bruker MPA™ (Bruker Optik GmbH, Ettlingen, Germany) equipped with a quartz beam splitter, an integrated Rocksolid™ interferometer, a rotating sample wheel and two detectors (a PbS detector working wavelength range 12000–3600 cm−1 and a TE-InGaAs detector working between 12800–4000 cm−1) combined with OPUS 7.0 (Bruker Optik GmbH) software. Absorption spectra were collected in diffuse reflectance mode. The resolution was 8 cm−1. The scanner speed was 10 kHz and each spectrum had 6 scans averaged. As mentioned above, each homogenized sample was placed into two Petri dishes and each Petri dish was analyzed twice. Glass Petri dishes were used for the cheese samples and The plastic Petri dish shows absorbance bands at 8840-8580 cm−1, 6200-5600 cm−1 and 4700-4000 cm−1. The glass Petri dish shows no absorbance. The glass is a Pyrex glass. The four spectra obtained per each sample were averaged. Calibration development of the macronutrients of each type of food (fish, meat and cheese) were built using QUANT (Bruker Optik GmbH) software.
Models build up and validation criteria
The NIR spectra were normalized by standard normal variate (SNV) or multiplicative scatter correction (MSC) or first derivate coupled to MSC. A partial least squares (PLS) regression model, able to interpolate the values obtained by reference methods with the absorption spectra of reference foods, was applied. Accredited reference methods were applied to reference food products by external laboratories to obtain the values of protein, total fat, saturated and mono and polyunsaturated fatty acids, sodium chloride, moisture and ash. Histograms showing the reference food products analyzed by reference methods and used to calibrate and validate the curves are reported in the Supplementary material (Figures S2–S4). Note that the operator tests different pre-processing methods and selects the one that provides the best prediction of the PLS model. The PLS regression calibrations were validated by test set validation (TSV) based on the split of data on training and test set (70:30). The software chose the number of components that maximizes the explained variance of the model. The software automatically selects outliers based on Mahalanobis distances. Subsequently, the operator manually removes some outliers with large Mahalanobis distance and repeats multiple times the validation procedure with the aim of maximizing the model performances. The performances of the model were established based on the predictions of the test set. In Tables S1 of the Supporting Information (SI), the statistical procedures used to build and validate the performances of the calibration curves for protein, fat, moisture, sodium chloride, saturated fat, monounsaturated fat, polyunsaturated fat and ash in meat, fish and cheese are reported. In particular, the number of reference samples, the number of spectra in duplicate of the reference samples, the range of the curves, the applied pre-processing methods, the number of components used to build the PLS regression model are listed. The accuracy of the calibration models was evaluated by root mean square error of prediction (RMSEP) which is the difference between the true and the estimated compositional value calculated from the error of a fully independent test set collected on different days. The coefficient of determination (R2) indicates the correlation between the measured values, determined by analytical laboratory, and the predicted values. It is very important to consider this coefficient as its high value (close to 1) indicates a good correlation between spectral data and concentration data. The ratio of performance to deviation (RPD) was also computed. RPD is a confidence interval around the predicted value. In the field of spectroscopy, RPD is the standard parameter to illustrate the quality of a model. In other words, RPD measures the consistency/correlation between observed and predicted values. Therefore, the values of RMSEP, R2 and RPD, showing the results of the validation of the method, are also reported in Table S1 for each curve.
Monitoring of the models and uncertainty
NIR spectroscopy performances were monitored routinely according to the guidelines provided by the ISO 12099:2017. According to these guidelines, the frequency of checking the NIR method was typically from 1 to 5% of measured foods checked by reference methods per year. One control sample, with known amounts of the macronutrients, was measured before each uninterrupted series of foods to verify possible instrument drifts. The recorded day-to-day variations of the control samples were plotted in control charts. The outcomes of the NIR spectroscopy are periodically verified by recognized inter-laboratory circuits (ring-tests). The uncertainty (Ue), which is the parameter describing the dispersion of the values that can be attributed to the NIR predicted values, is expressed as Ue = ±2 x RMSEP.
Sugar quantification
Due to the low amounts of free sugars present in meat, cheese and fish products that were below the reliable ranges of the NIR spectroscopy, sugars were quantified by spectrophotometry based on the reaction between sugars and phenol in acid conditions.32,38 The method is optimized on a 96-well microplates format that employs reduced amounts of reagents with an improved sensitivity. 32 Briefly, 1.0 g of food was weighed into a 50 mL Falcon tube, suspended in 20 mL of water and then vortexed for 4 min. The supernatant was filtered and eventually diluted, before depositing 400 μL volumes in a 96-well plate in quadruplicate. Then, 150 μL of 96% sulphuric acid was added to the deposited samples and, after incubation at 55°C for 15 min, 30 μL of 5% phenol in water was added to the solution. After a second incubation at 55°C for 15 min, the absorbance of the colored aromatic complex obtained from the reaction between phenol and all free sugars was measured by a spectrophotometric absorbance microplate reader (Sunrise spectrophotometer, Tecan, coupled to Magellan V7.3 – SP1 software) at 492 nm. The quantification is based on a calibration curve in the range of 0.1–0.8 g/100 g of glucose. The limit of detection of the technique is 0.1 g/100 g whereas the expanded uncertainty was estimated as 5.3%. Note that, according to the EU guidance document for competent authorities, an amount ≤0.5 g/100 g or ml “0g” or “<0.5 g” sugars may be declared.
Total carbohydrates and checks on components
According to the Food and Agriculture Organization (FAO) guidelines for checking food composition data prior to the publication, 39 the total carbohydrates were calculated by difference as follows: total carbohydrates = 100 - (weight in grams [water + protein + fat + ash + alcohol]) in 100 g of food. In the analyzed food products the presence of alcohol can be excluded. As recommended by the FAO guidelines 39 , the sum of the component values must fall inside a range of 97–100 g/100 g unless the total carbohydrates are calculated by difference. In the latter case, no discrepancies should exist. In order to further verify the correctness of the experimental values, we evaluated the percentage of saturated fatty acids in 100 g of total fat. In cheese, meat and fish this percentage is well-known, and it always falls within defined ranges. Cheese has an approximately 60 g of saturated fat in 100 g of total fat. Meat contains about 30–40 g of saturated fat in 100 g of total fat. Fish has approximately 20 g of saturated fat in 100 g of total fat. For each group of foods, the average percentage of saturated fatty acids in 100 g of total fat as calculated from our NIR data accorded with the expected percentages mentioned above, thus confirming the reliability of the NIR methodology. Cheese, meat and cured meat, and fish contained, on average, 61 g, 37 g and 20 g of saturated fat in 100 g of total fat, respectively (Figure S1).
Energy calculation
To calculate the energy provided by 100 g of edible food product the following formula, according to the EU Regulation 1169/2011, 5 was used: Energy of 100 g of food product in Kcal = 4 × (grams of proteins and carbohydrates) + 9 × grams of total fat. Energy of 100 g of food product in KJ = 17 × (grams of proteins and carbohydrates) + 37 × grams of total fat. Note that no fibers nor polyols were measured in this study, and thus not included in the energy calculation, as in the selected food products (meat, fish and cheese) fibers and polyols can be considered logically to zero.
Evaluation of the compliance to the tolerance limits
To verify the compliance of the nutritional values reported on the nutritional labels of the food products, the rounding guidelines of the guidance document for competent authorities for the control of compliance with EU Regulation were followed. 6 The rounding guidelines are among the factors that influence the setting of tolerances and allow estimating whether the value that was determined during the analysis of the control authority is within tolerance limits. The rounding rules were applied to the experimental value and then of lower and upper bounds were calculated for the declared value according to the tolerance limits. If the experimental value fell between the bounds the declared value was considered compliant.
Results and discussion
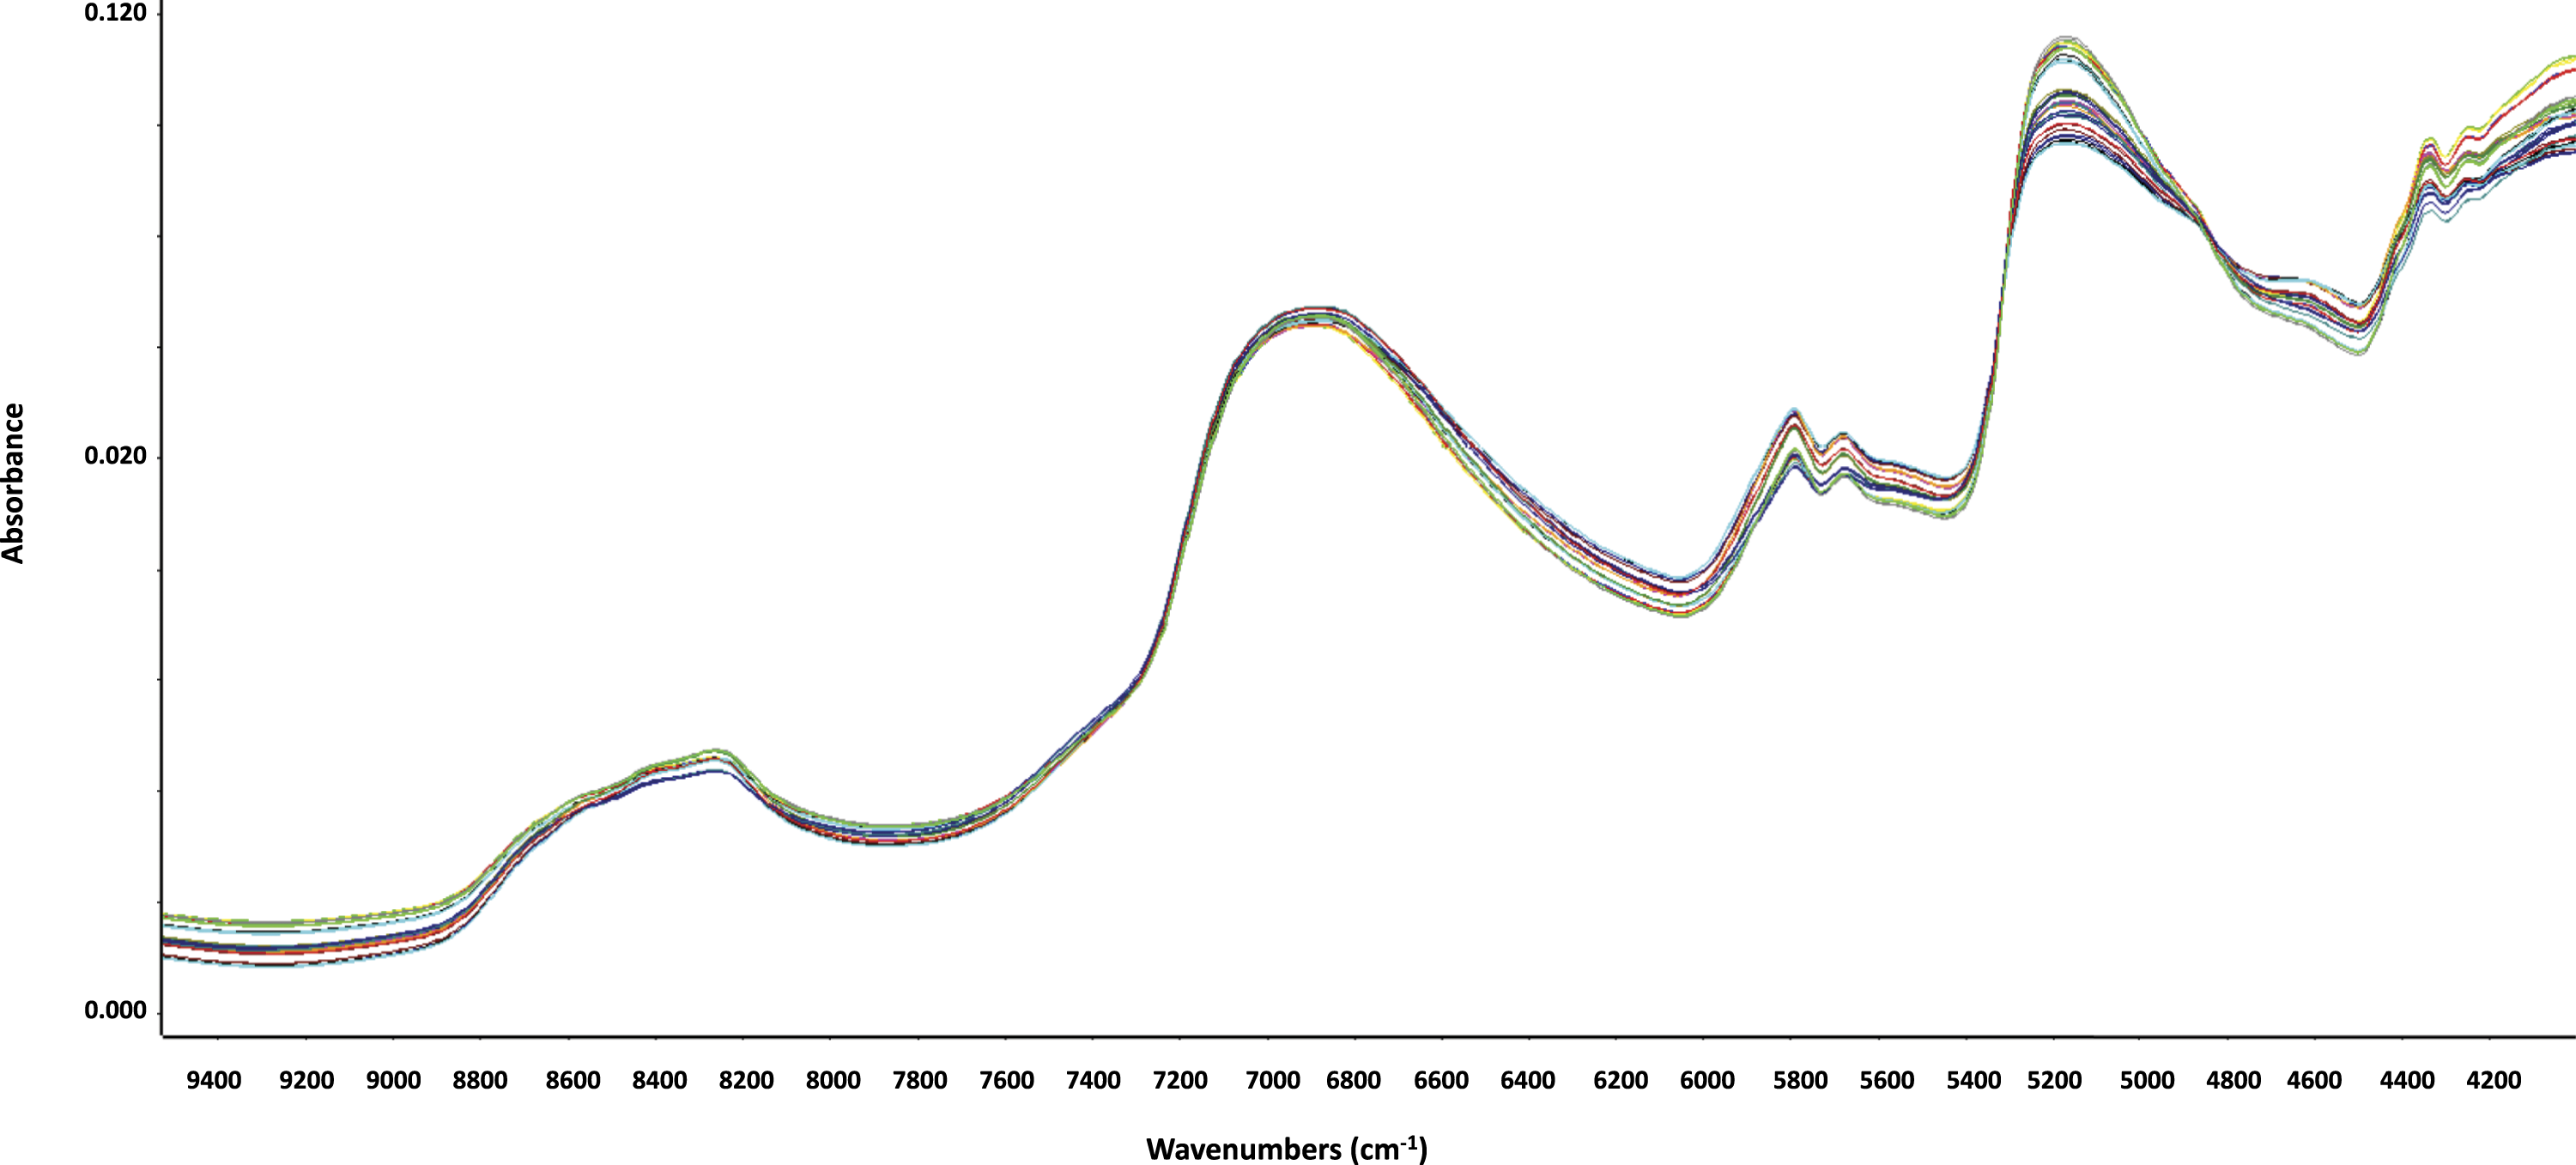
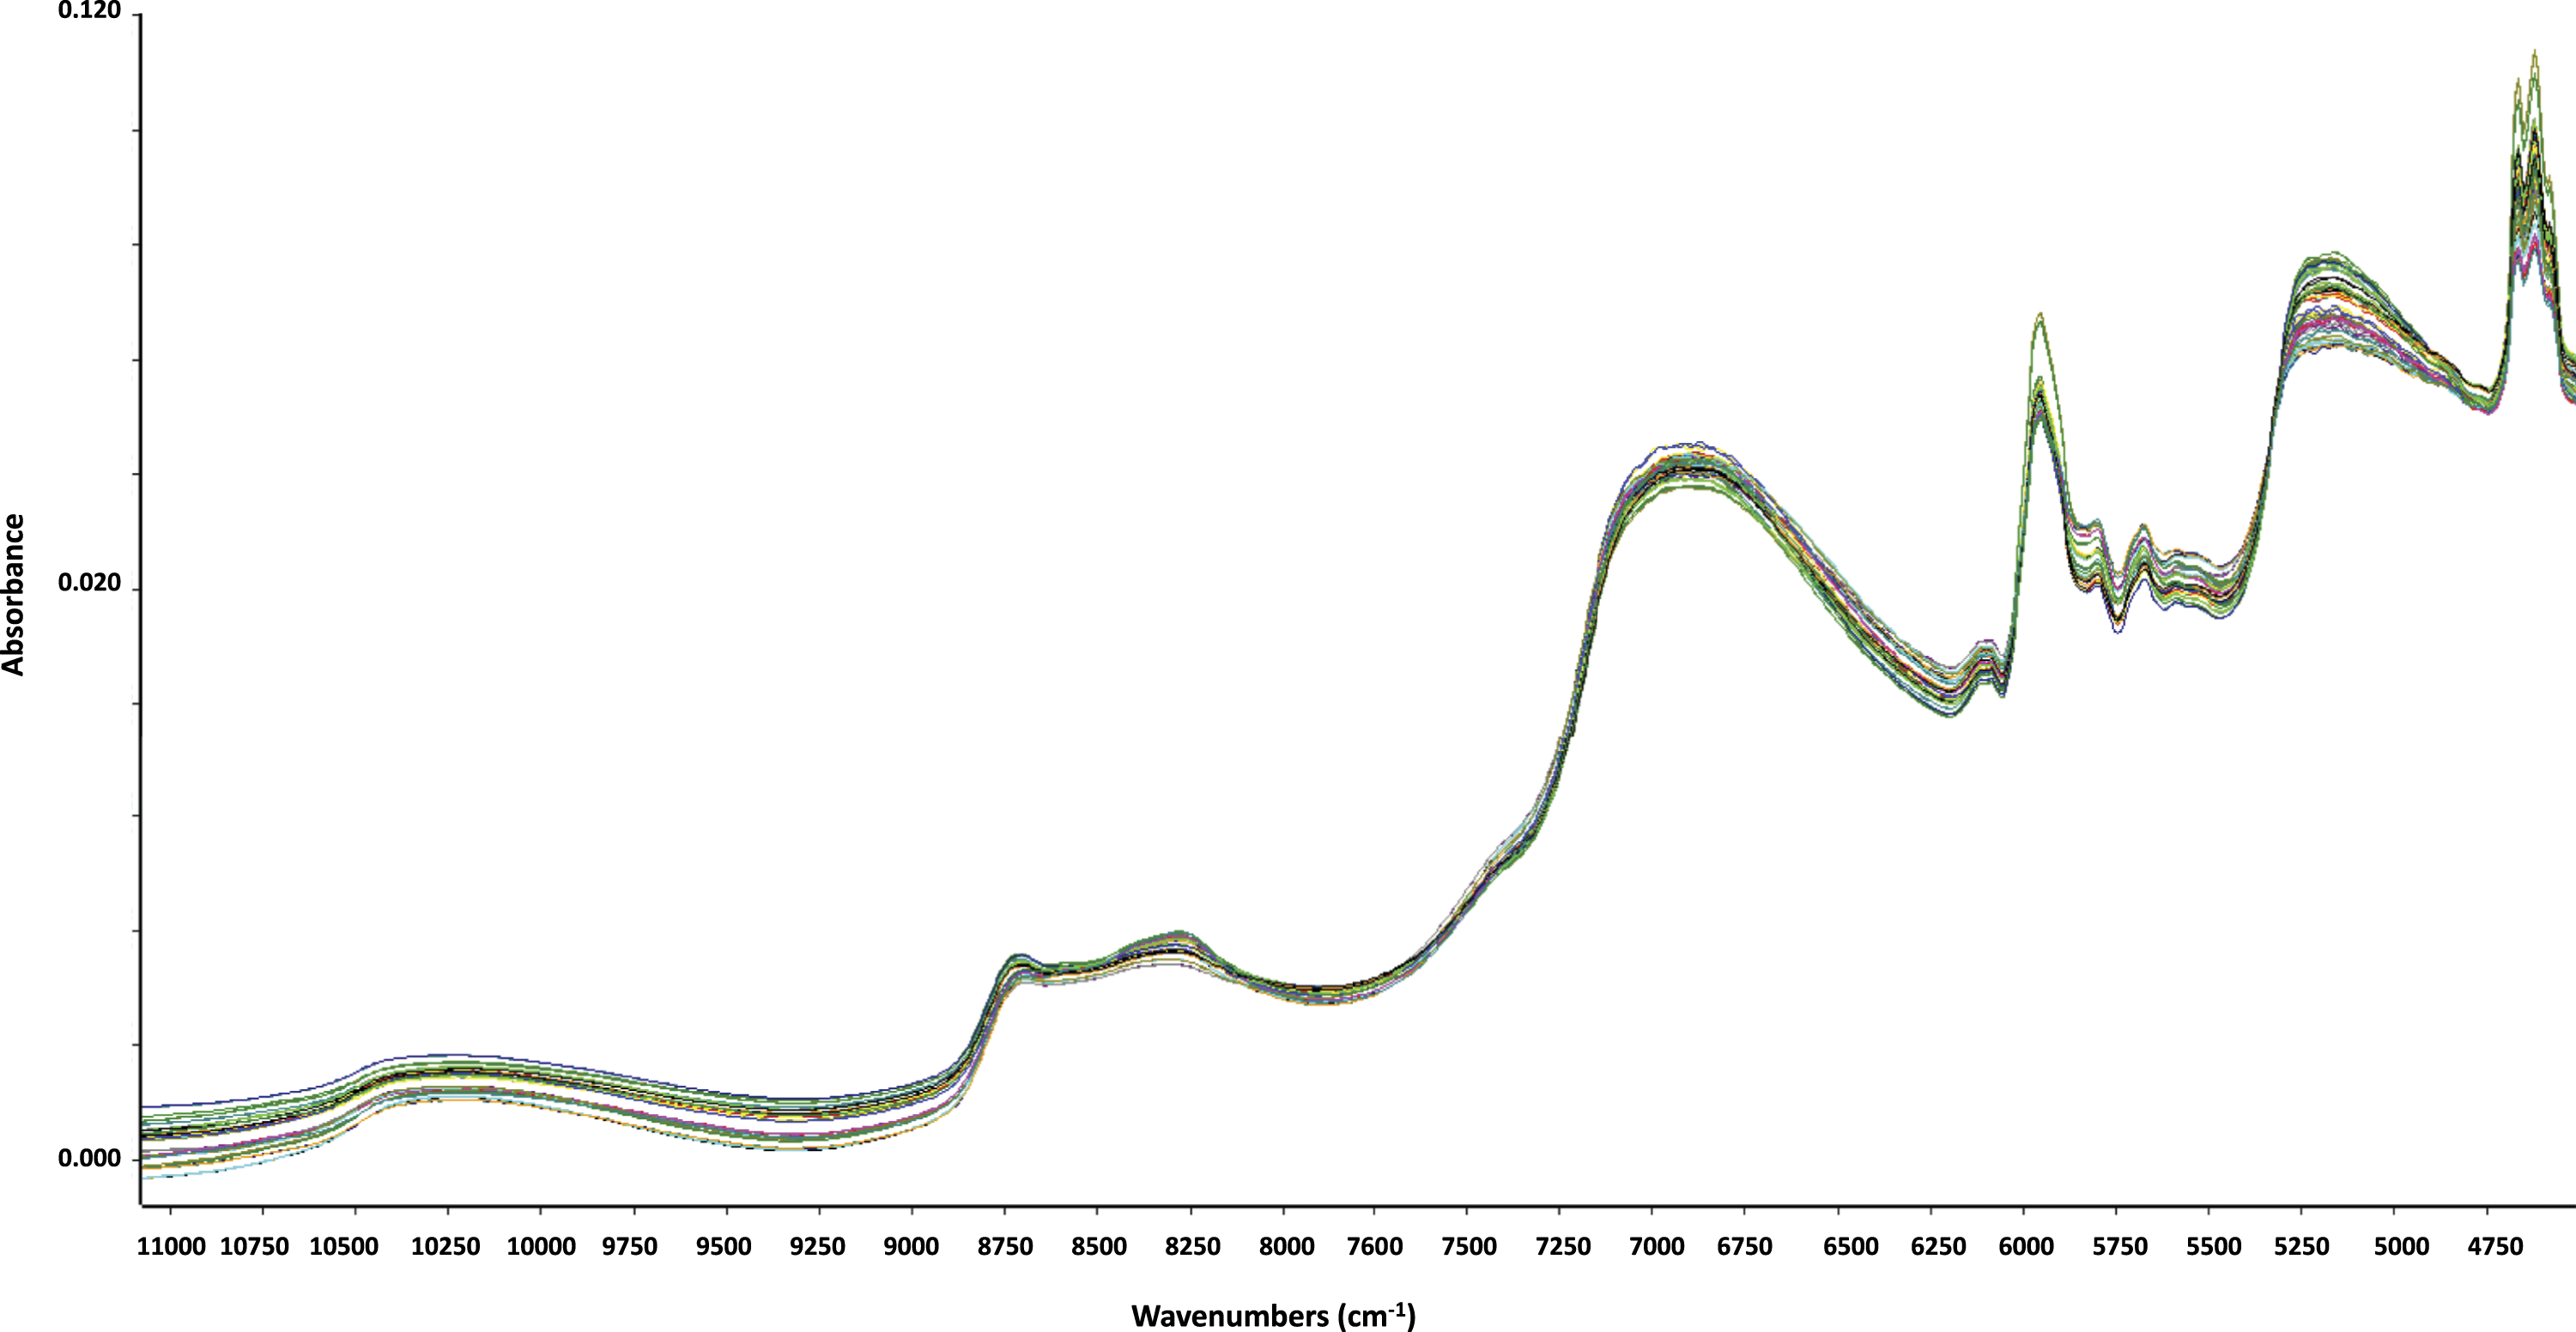
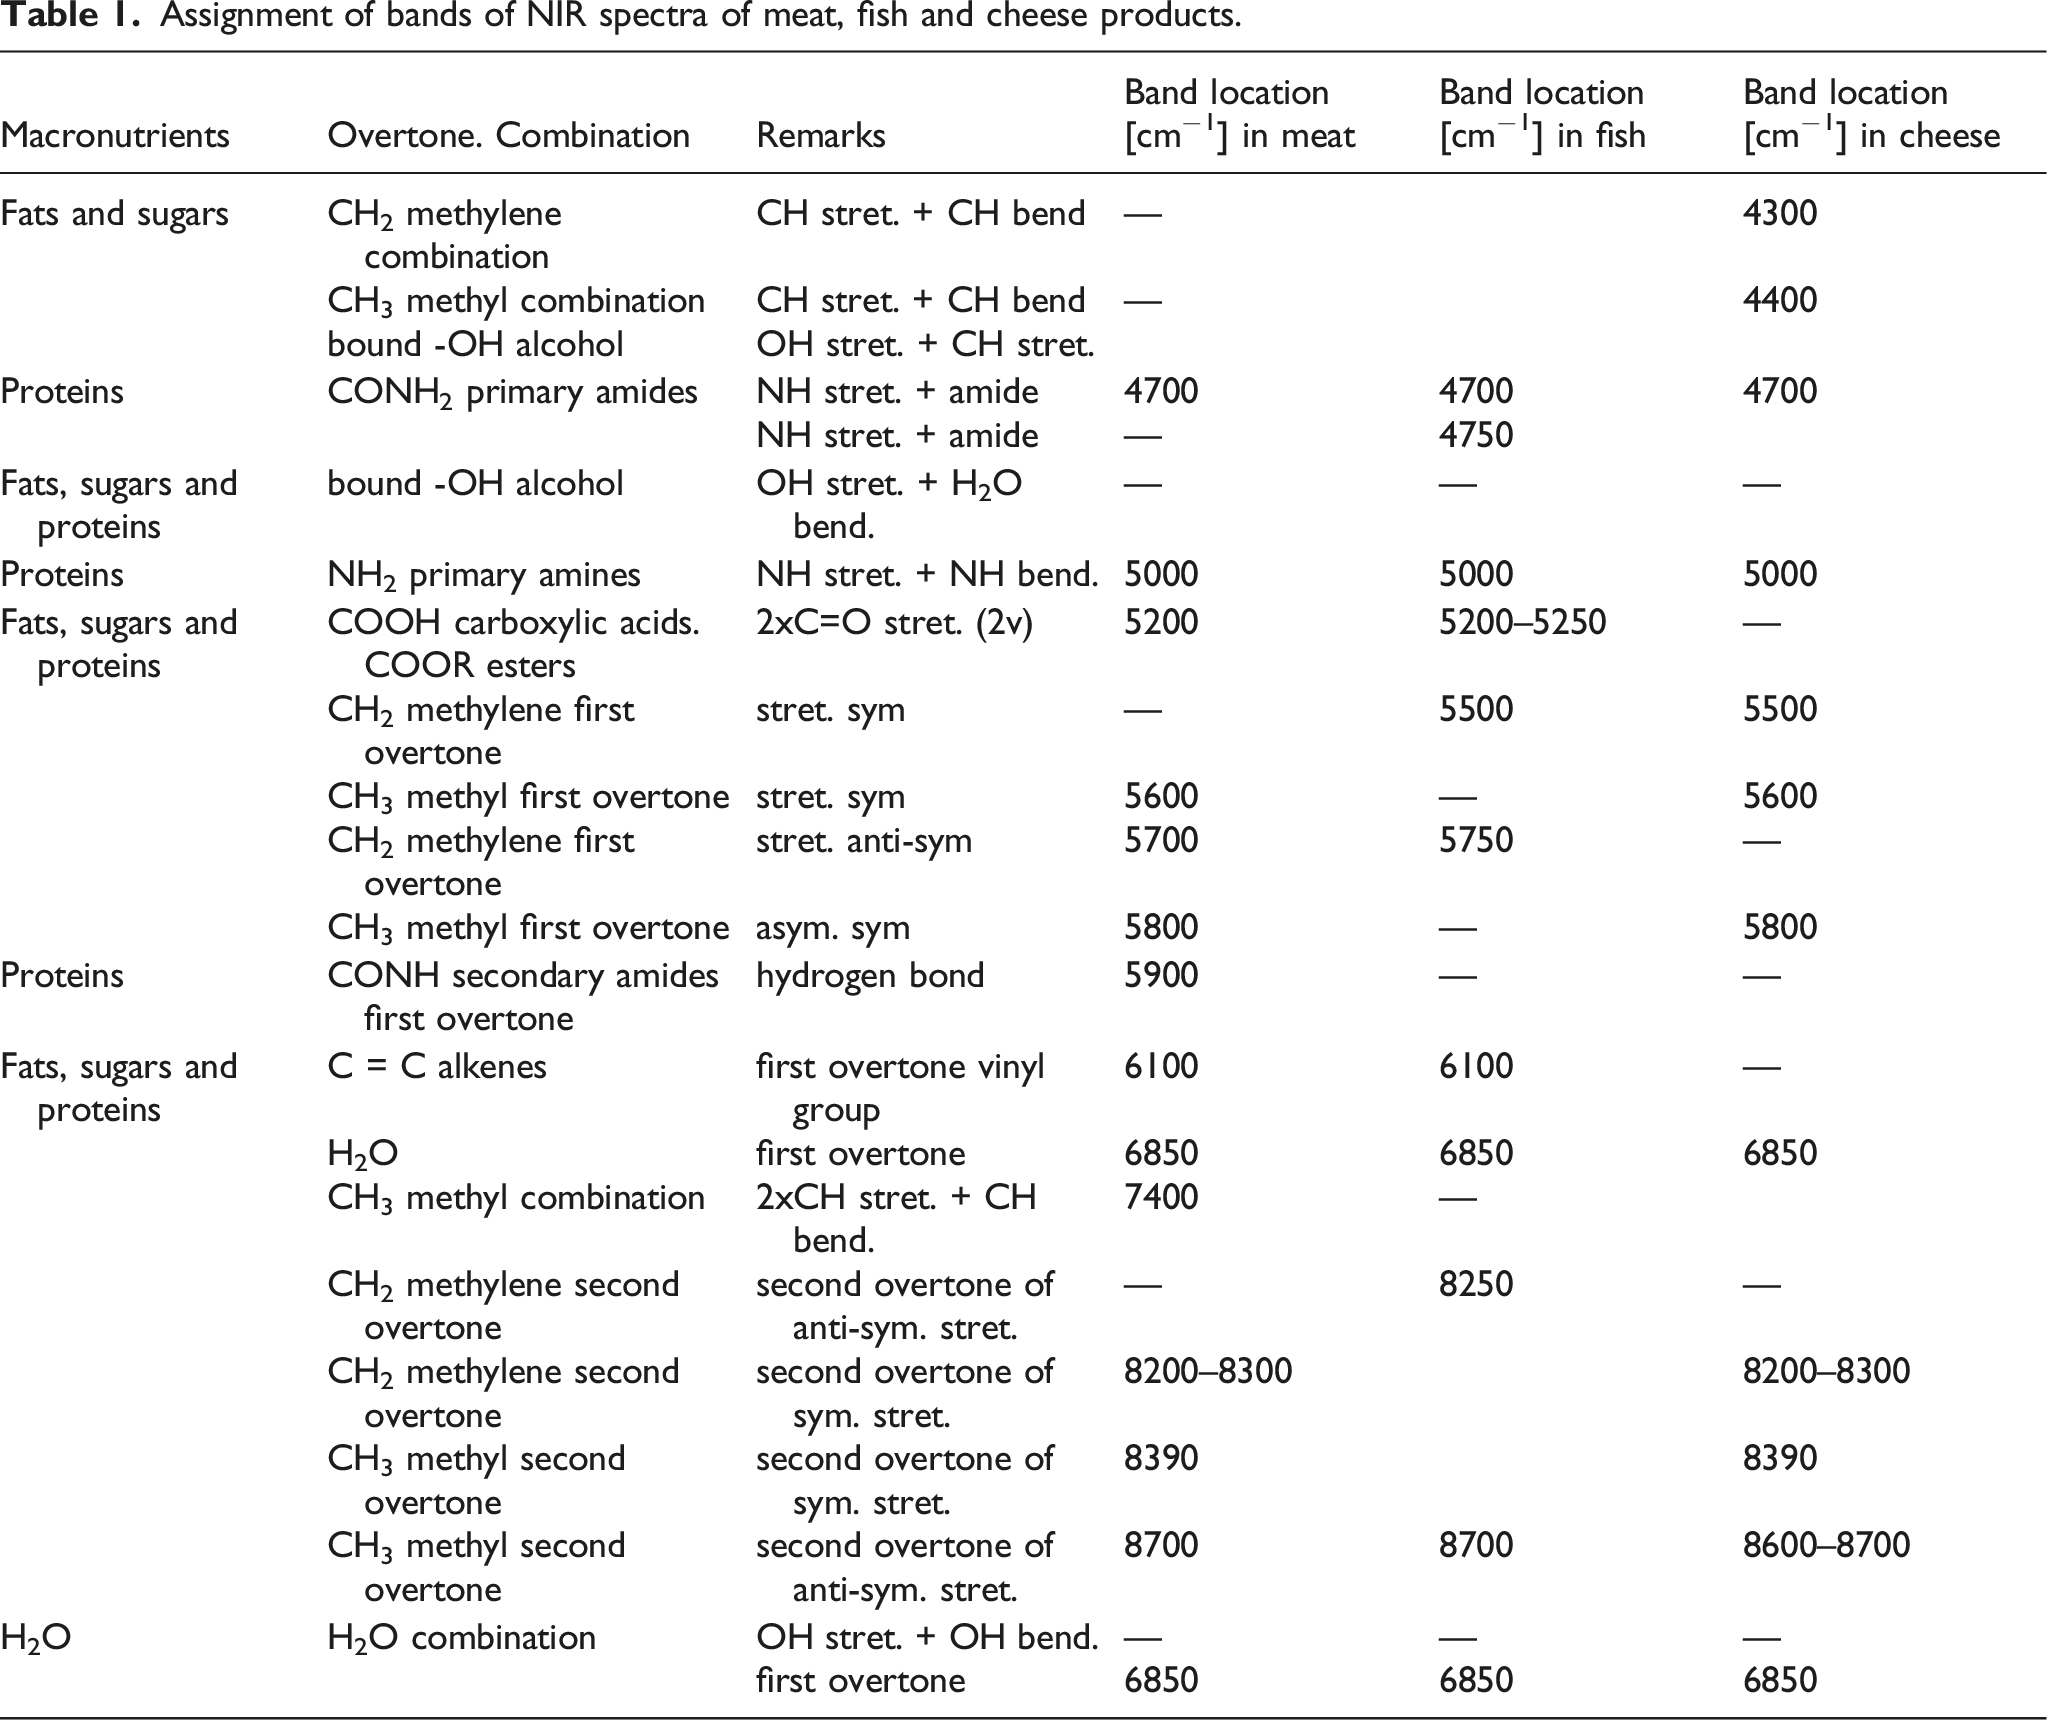
The Figures 1, 2, 3 show the normalized spectra of the three food matrices analyzed in the study. A spectral interpretation, based on literature,
40
of the observed bands of the spectra is reported in Table 1. The PLS regression calibrations measured a set of nutritional values as an alternative approach to wet chemistry and instrumental measurements for further checking of EU tolerance limits compliance. In addition, the PLS regression statistics in terms of R2, RMSEP and RPD confirmed that NIR spectroscopy can be used for an accurate and simultaneous screening of macronutrients values. The R2 values of prediction models ranged from 0.81 to 0.994. Note that Shenk and Westerhaus proposed that a R2 value greater than 0.70 is suitable for a good predictive ability.
41
On the other hand, most of the RDP values of meat and cheese models were equal to or greater than 3 as recommended by the AOCS Analytical guidelines Am 1a-09 for screening methods. Note that model performance can be considered sufficient for a rough screening if RPD is between 1.5 and 2.5 as suggested by Williams
42
. A number of 103 food products, comprising 80 processed food products and 23 unprocessed food products, were analyzed both by NIR spectroscopy and spectrophotometry to determine the foods’ nutritional composition. The energy values (both kJ and kcal) were also calculated. Tables S2–S4 report the nutritional content of the 103 foods experimentally obtained by NIR and spectrophotometry. Although it is expected that any food supplied through distance selling meets the same information requirements as food sold in shops, it is worth noting that mandatory food information must be available both on the delivered product and the web portal before the purchase is concluded.
5
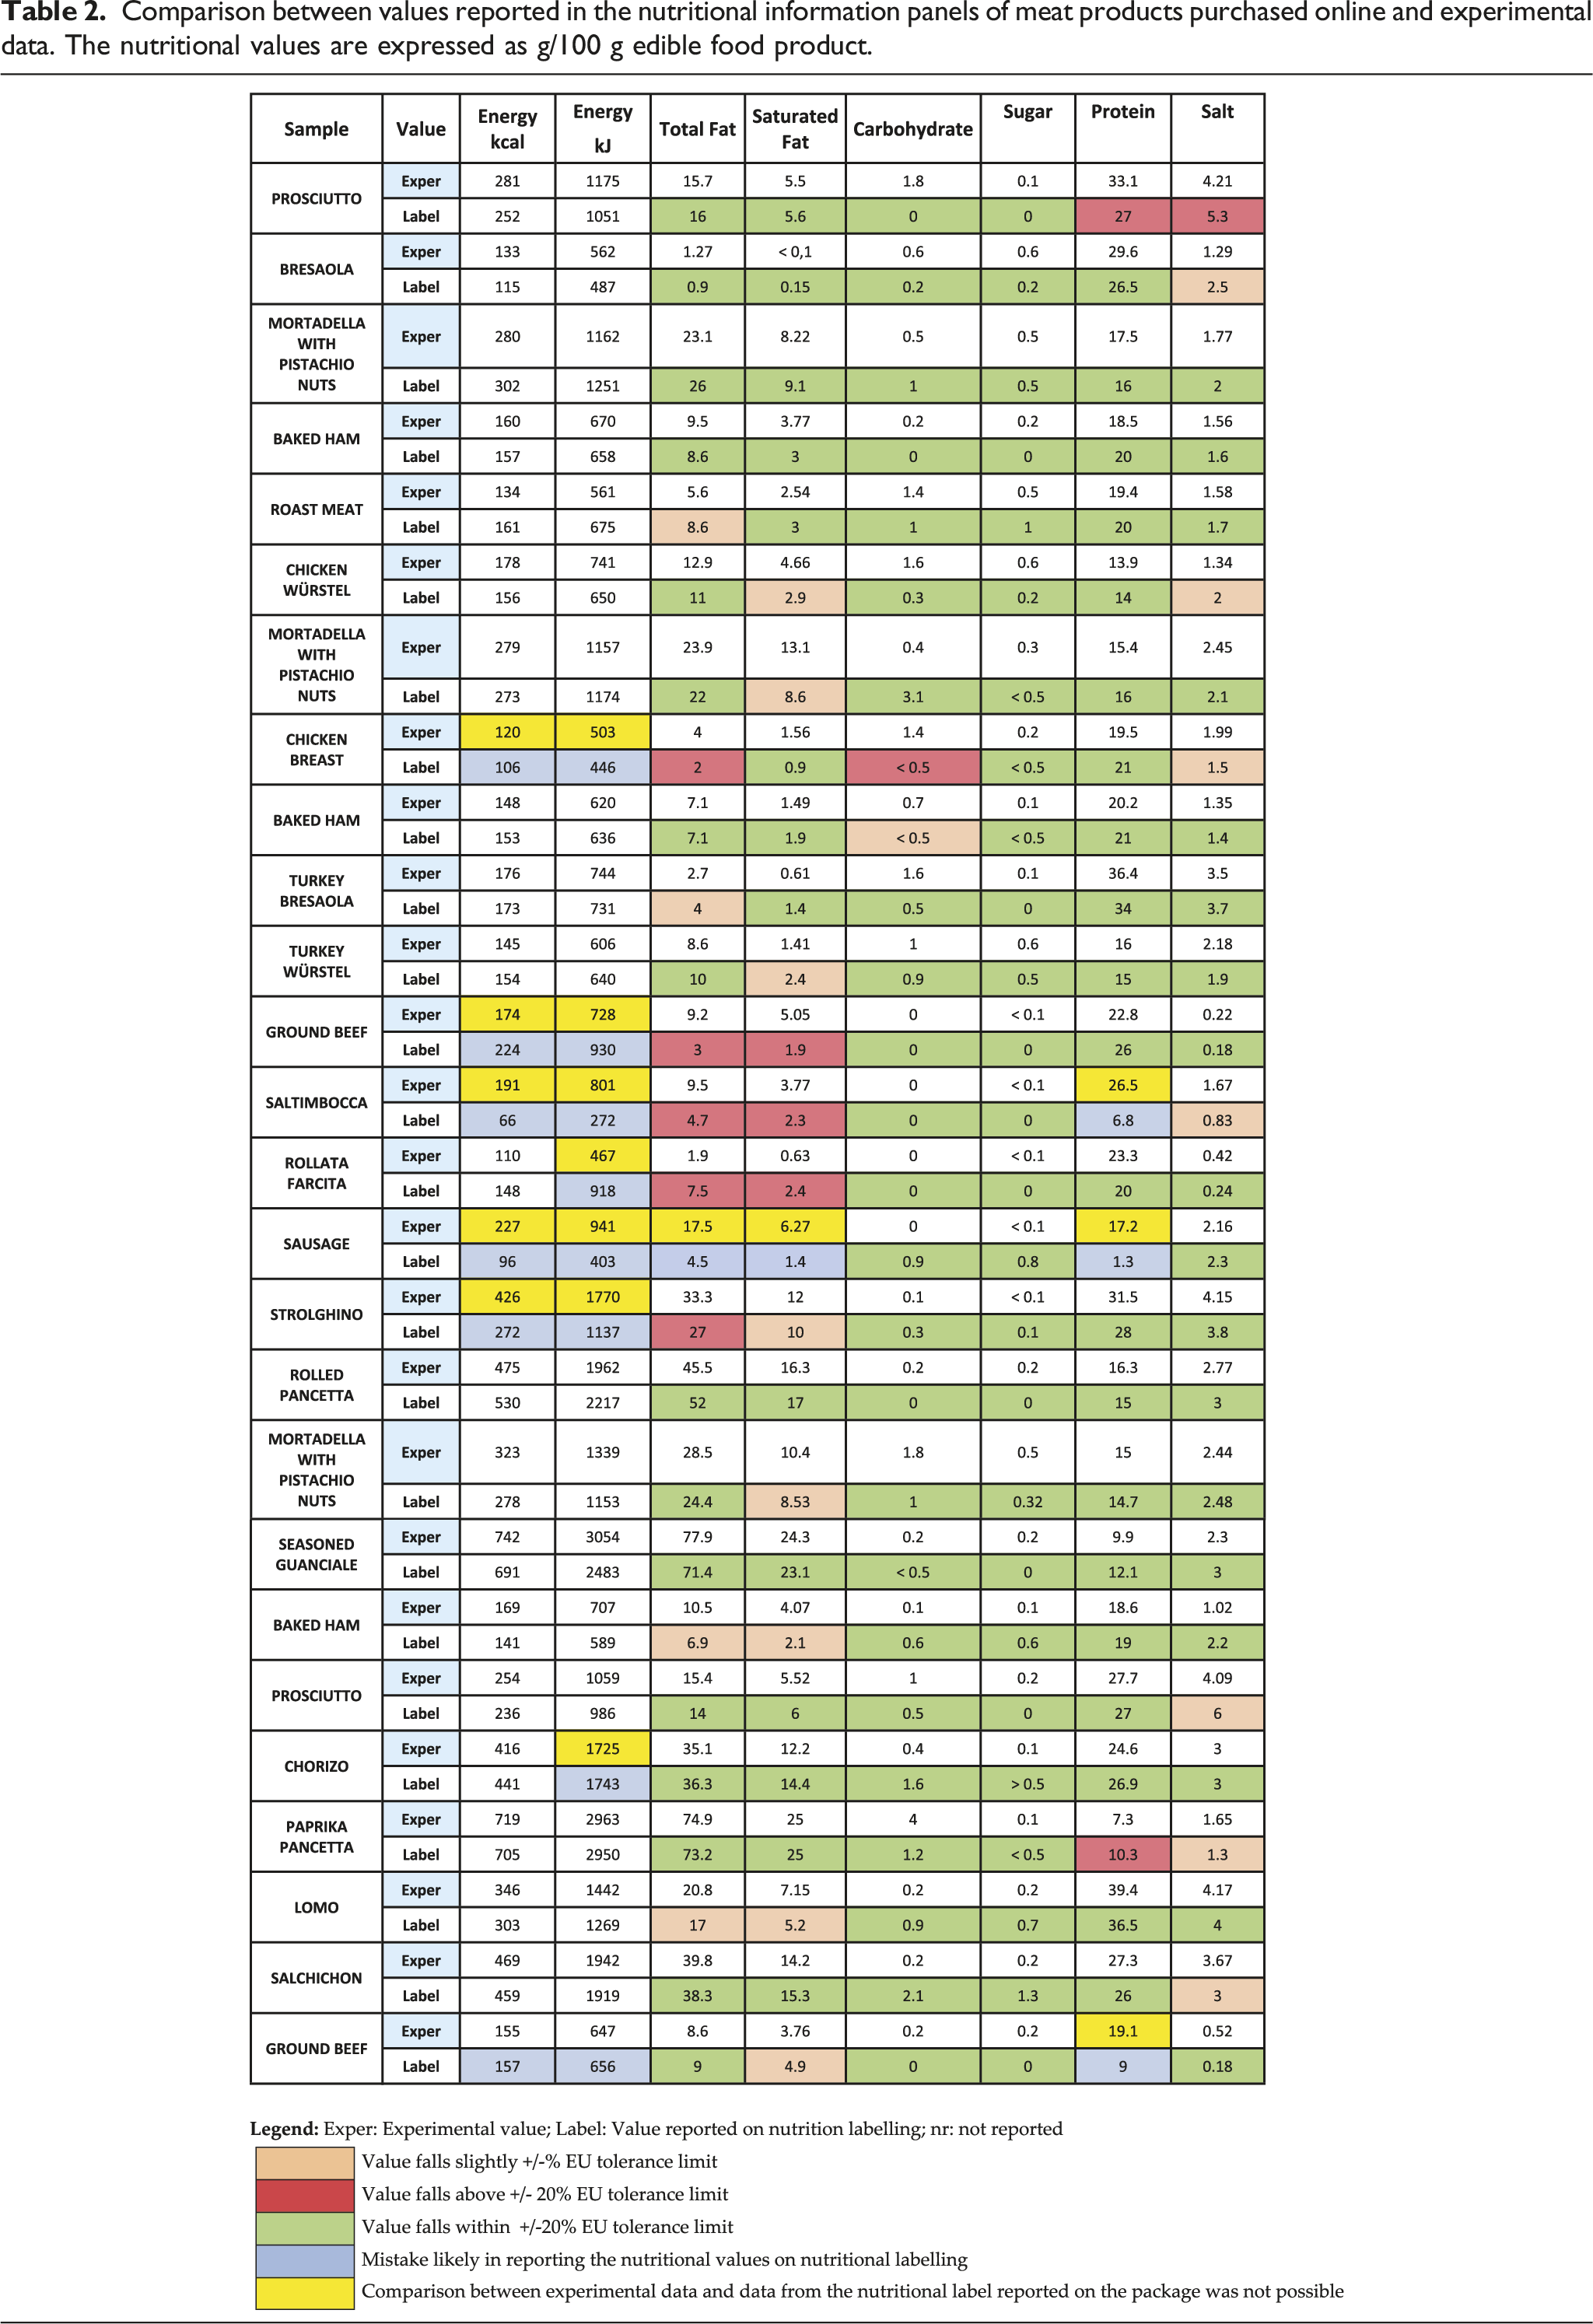
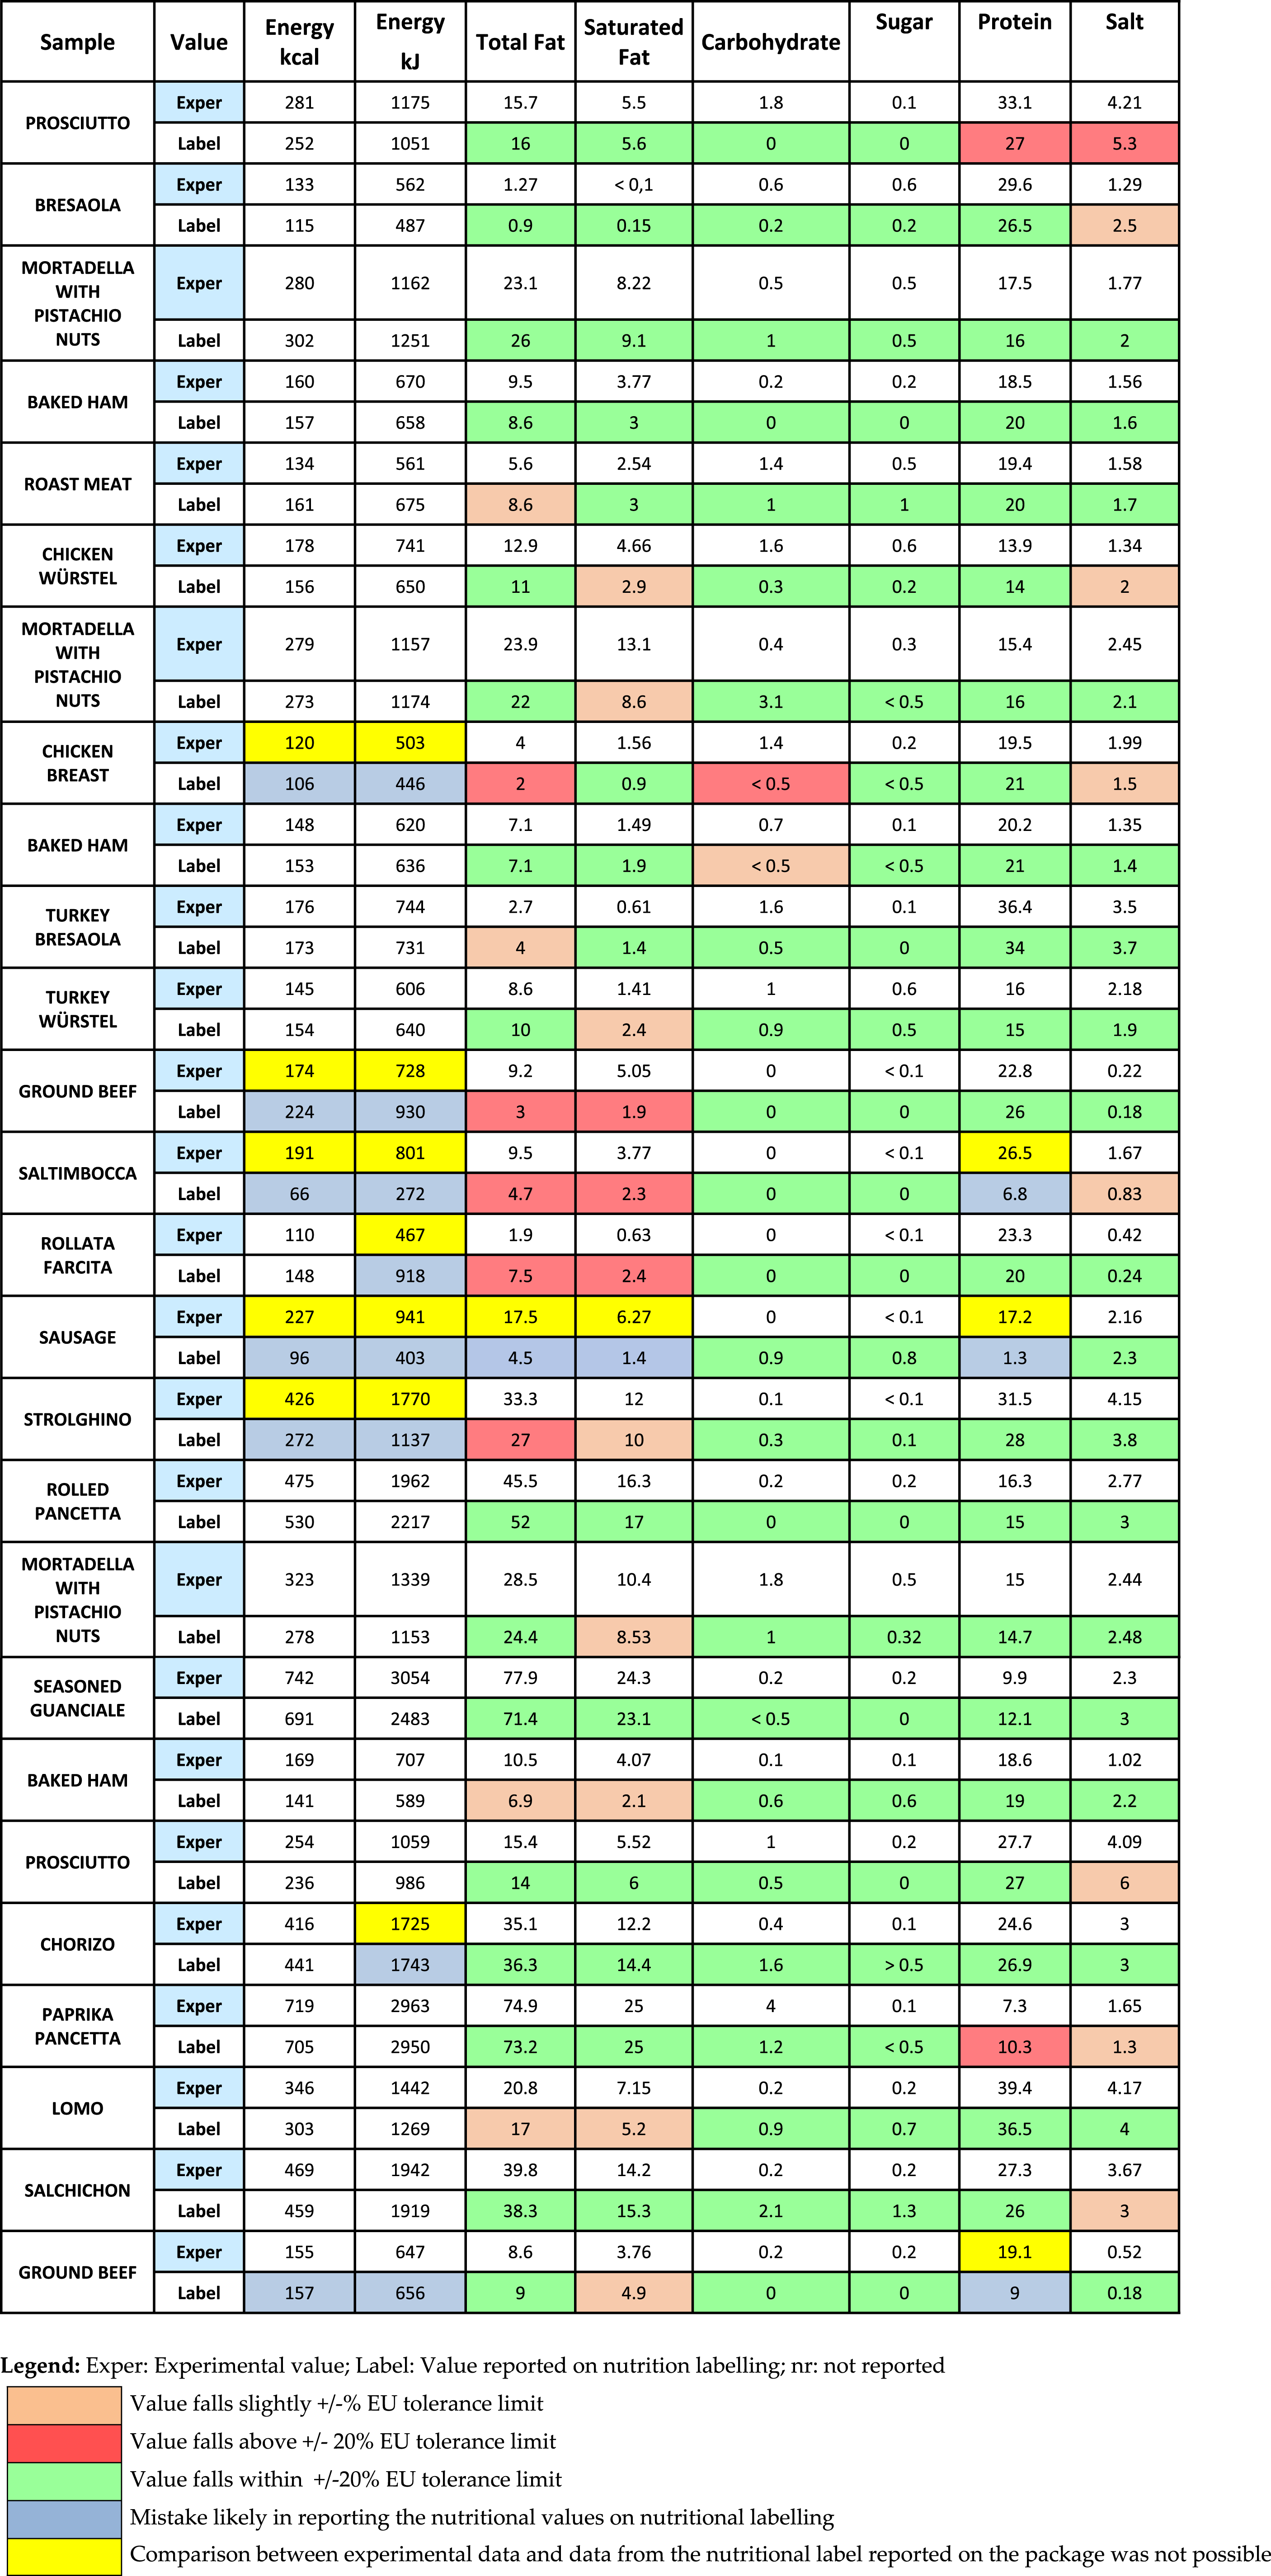
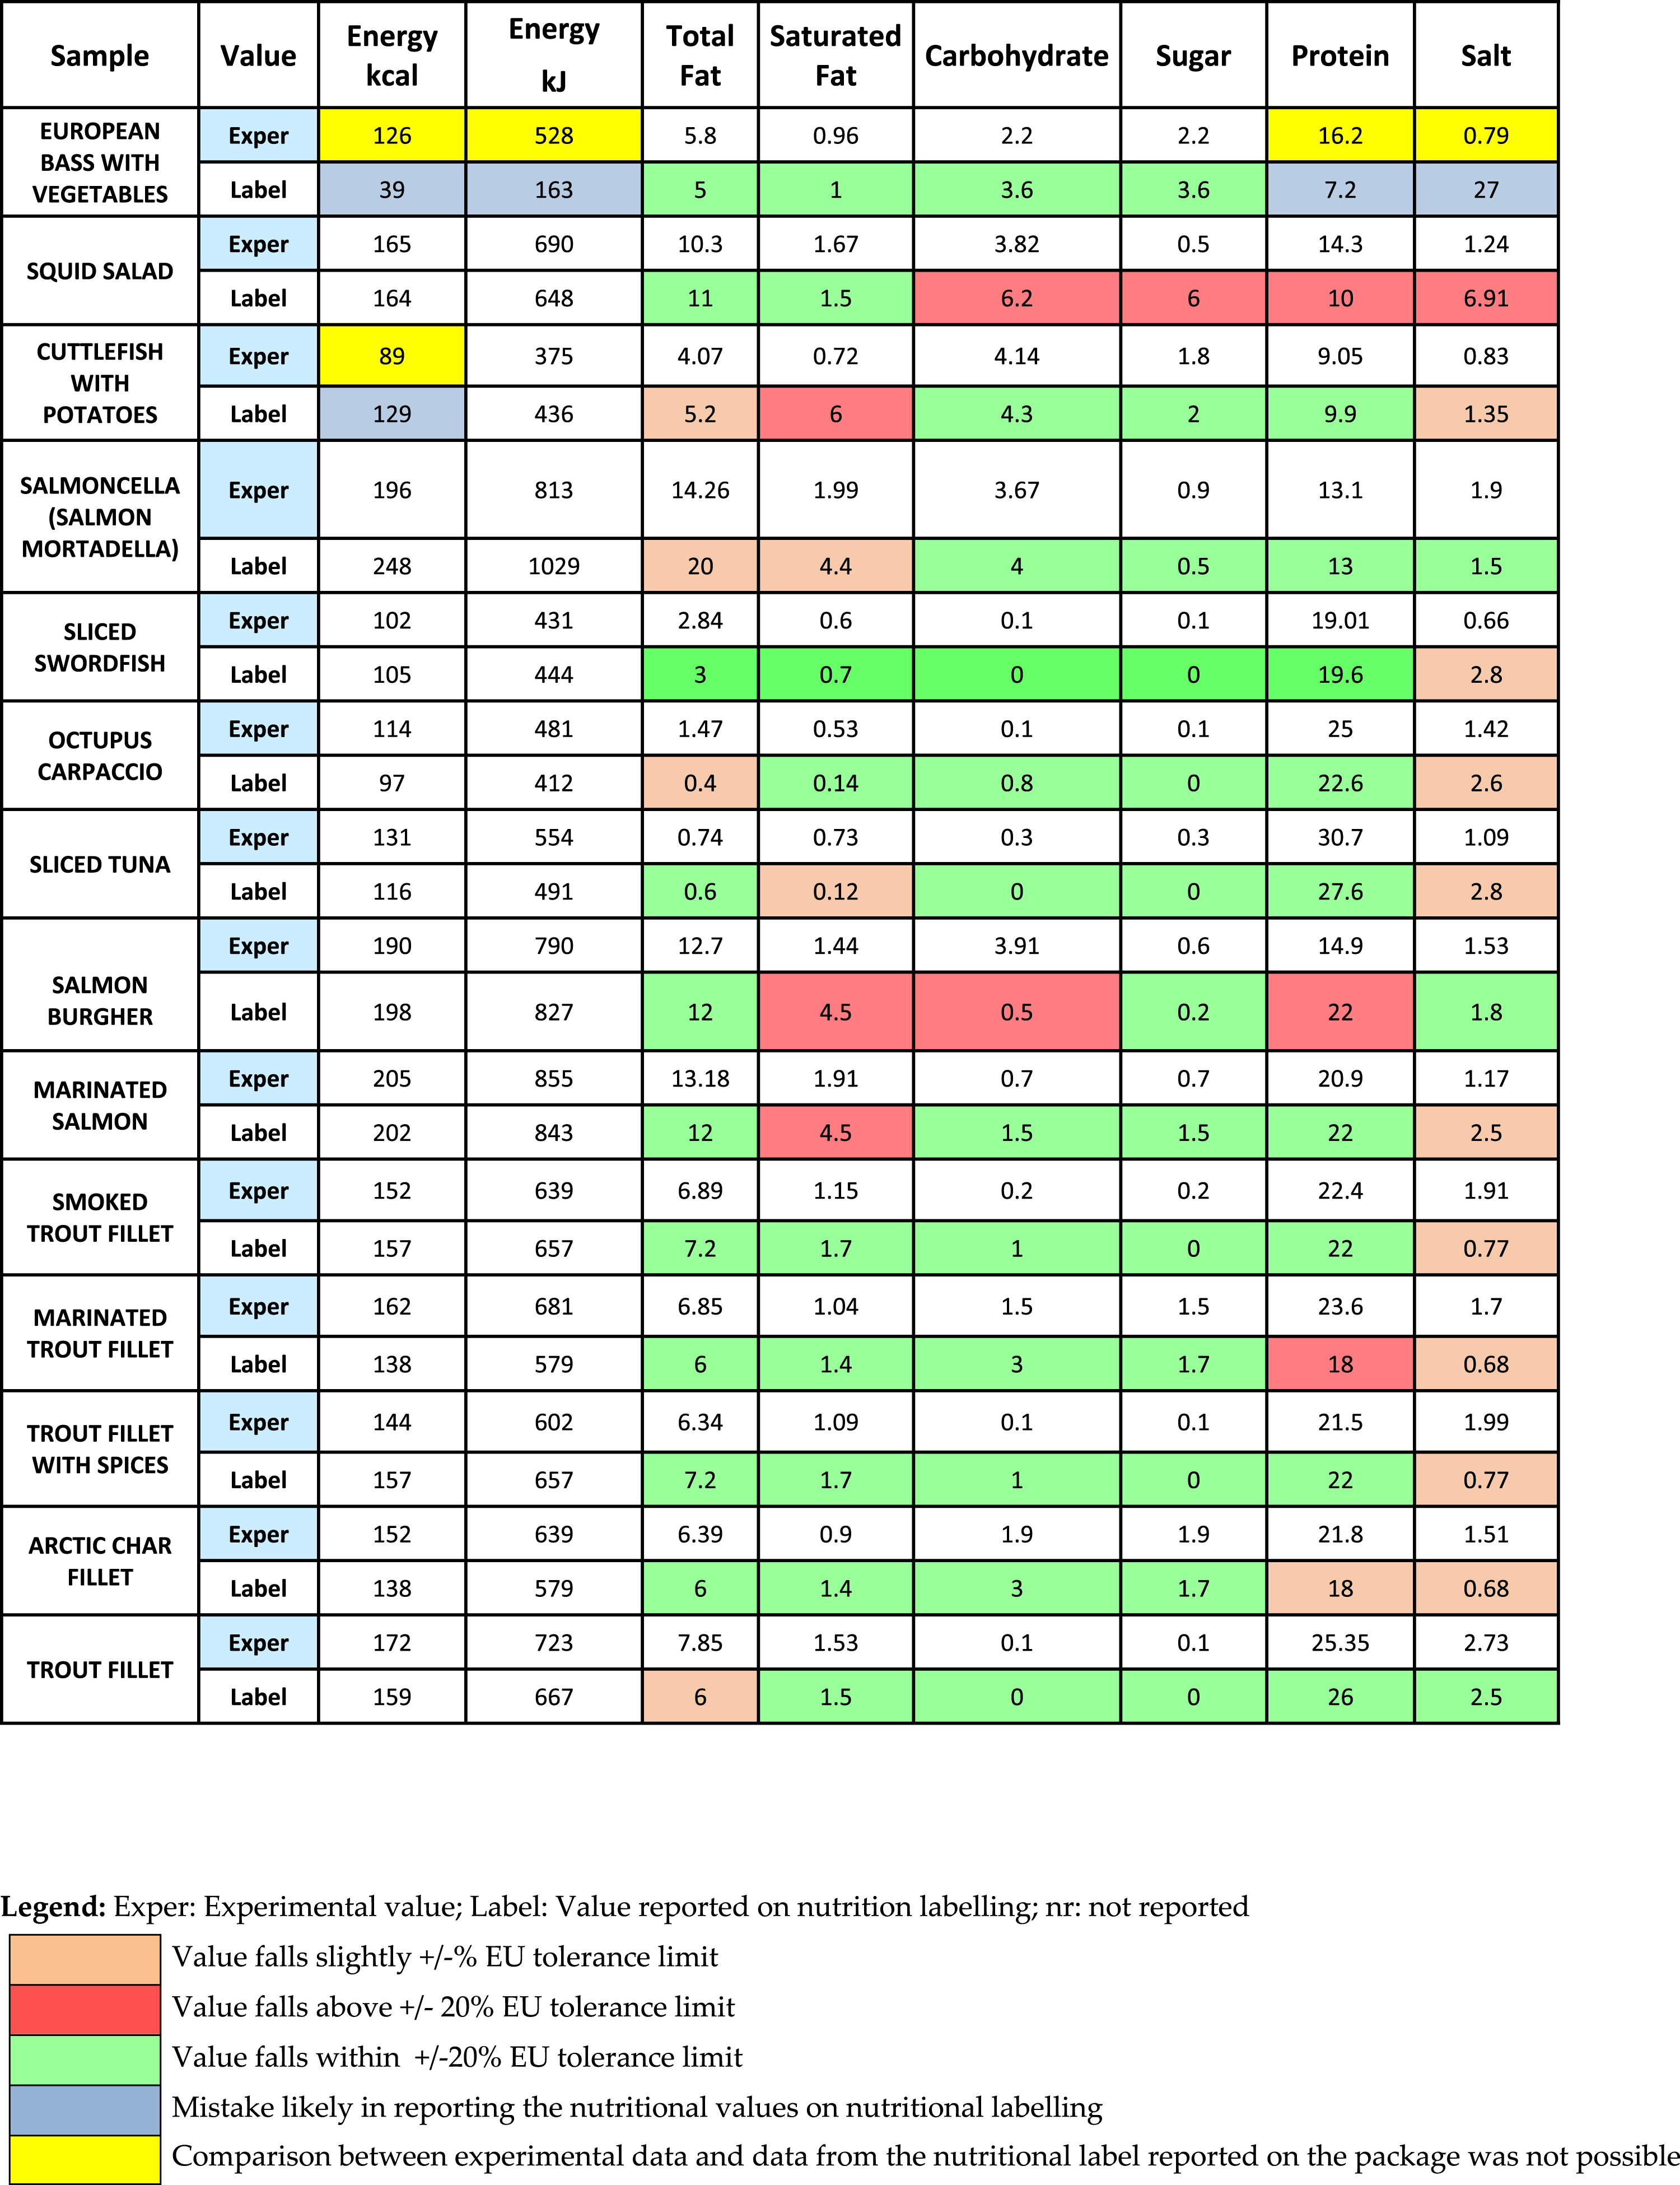
Nevertheless, after delivery, 28/80 (35%) of processed food products did not bear mandated nutritional labels. Note that for these food products the presence of their nutritional labels on the e-grocery web-portal was further checked, but the information was unable to be located. Therefore, the experimental data were compared with label declarations for 52/80 processed food products. In detail, 22/40 pre-processed meat products bore required nutritional labels, as did 13/25 cheeses. All the 17 processed fish products had appropriate nutritional fact labels attached to the packages. Unprocessed foods are not mandatorily required to have nutritional labels, but two unprocessed food products (raw chicken breast and ground meat) had nutritional labels Therefore, we were able to compare data from the nutritional labels of 53 food products with our experimental data. Table 2 shows a comparison between our data and those reported in the nutritional fact labels taken from the product packaging. Comparing the experimental data with the values reported on food packages, it was noticed that nutrition labels were not always factual. However, there is clear EU guidance on what variations are tolerable between the declared information on the label and the actual content,
6
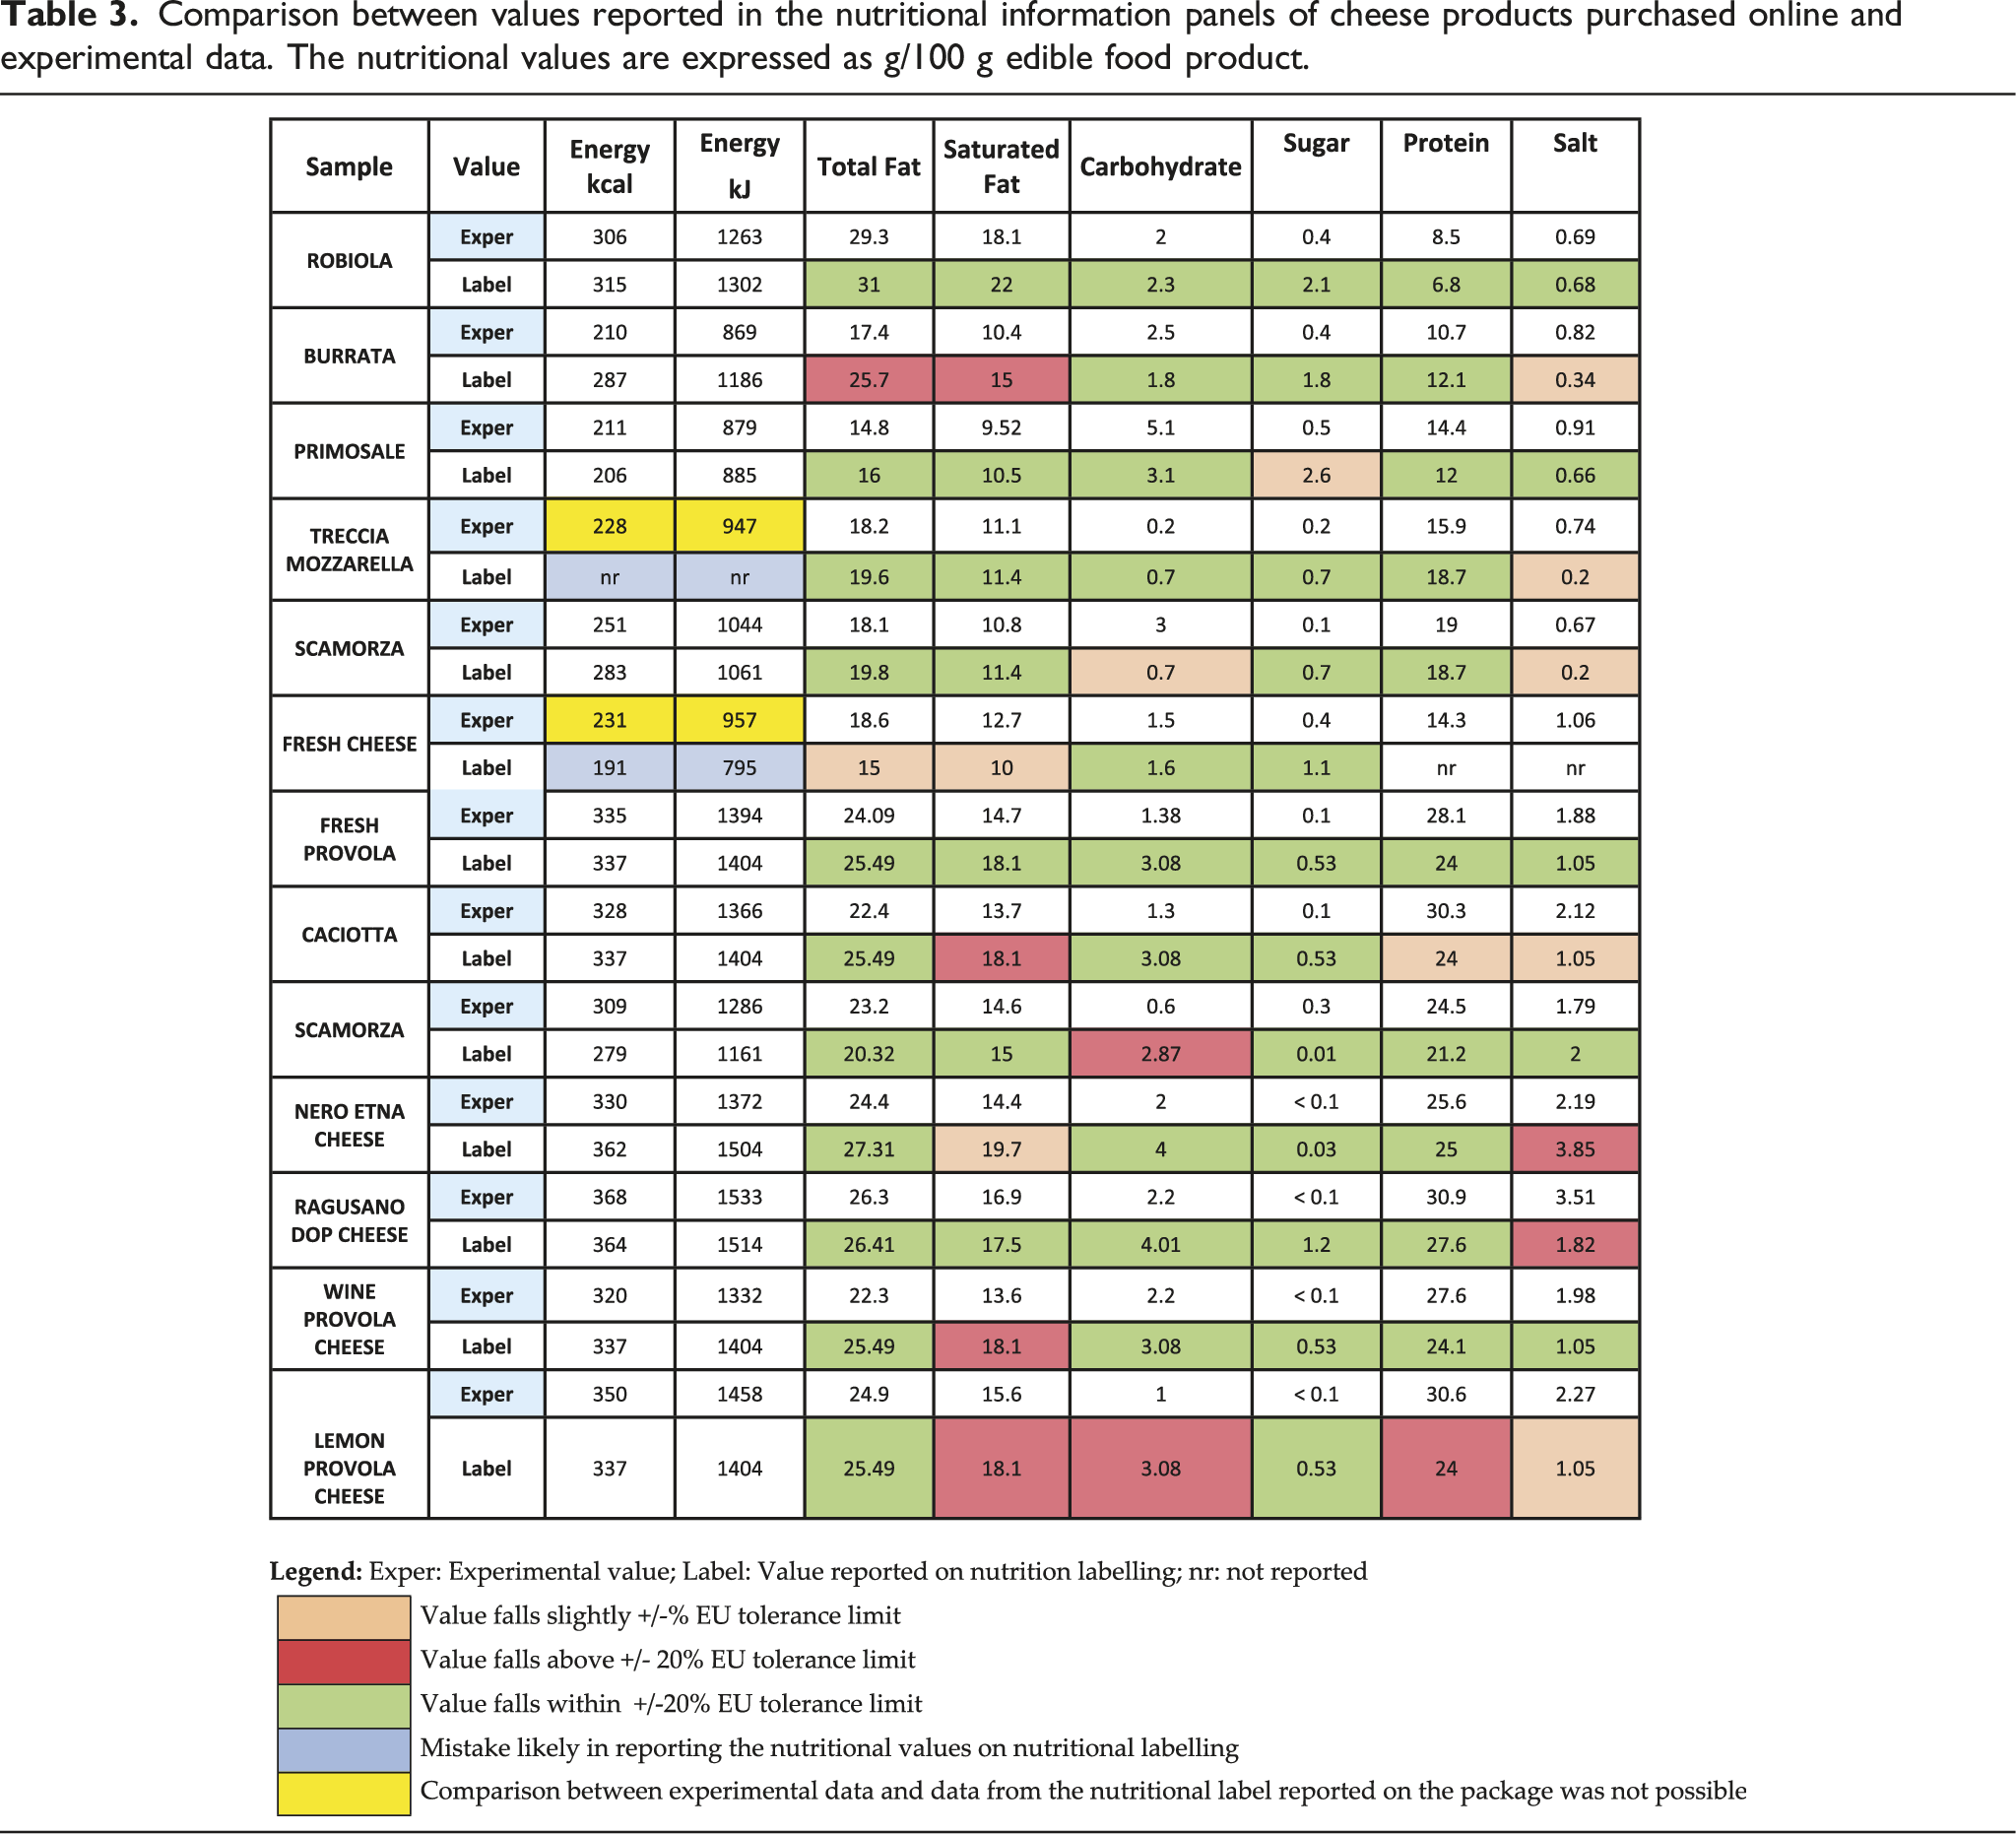
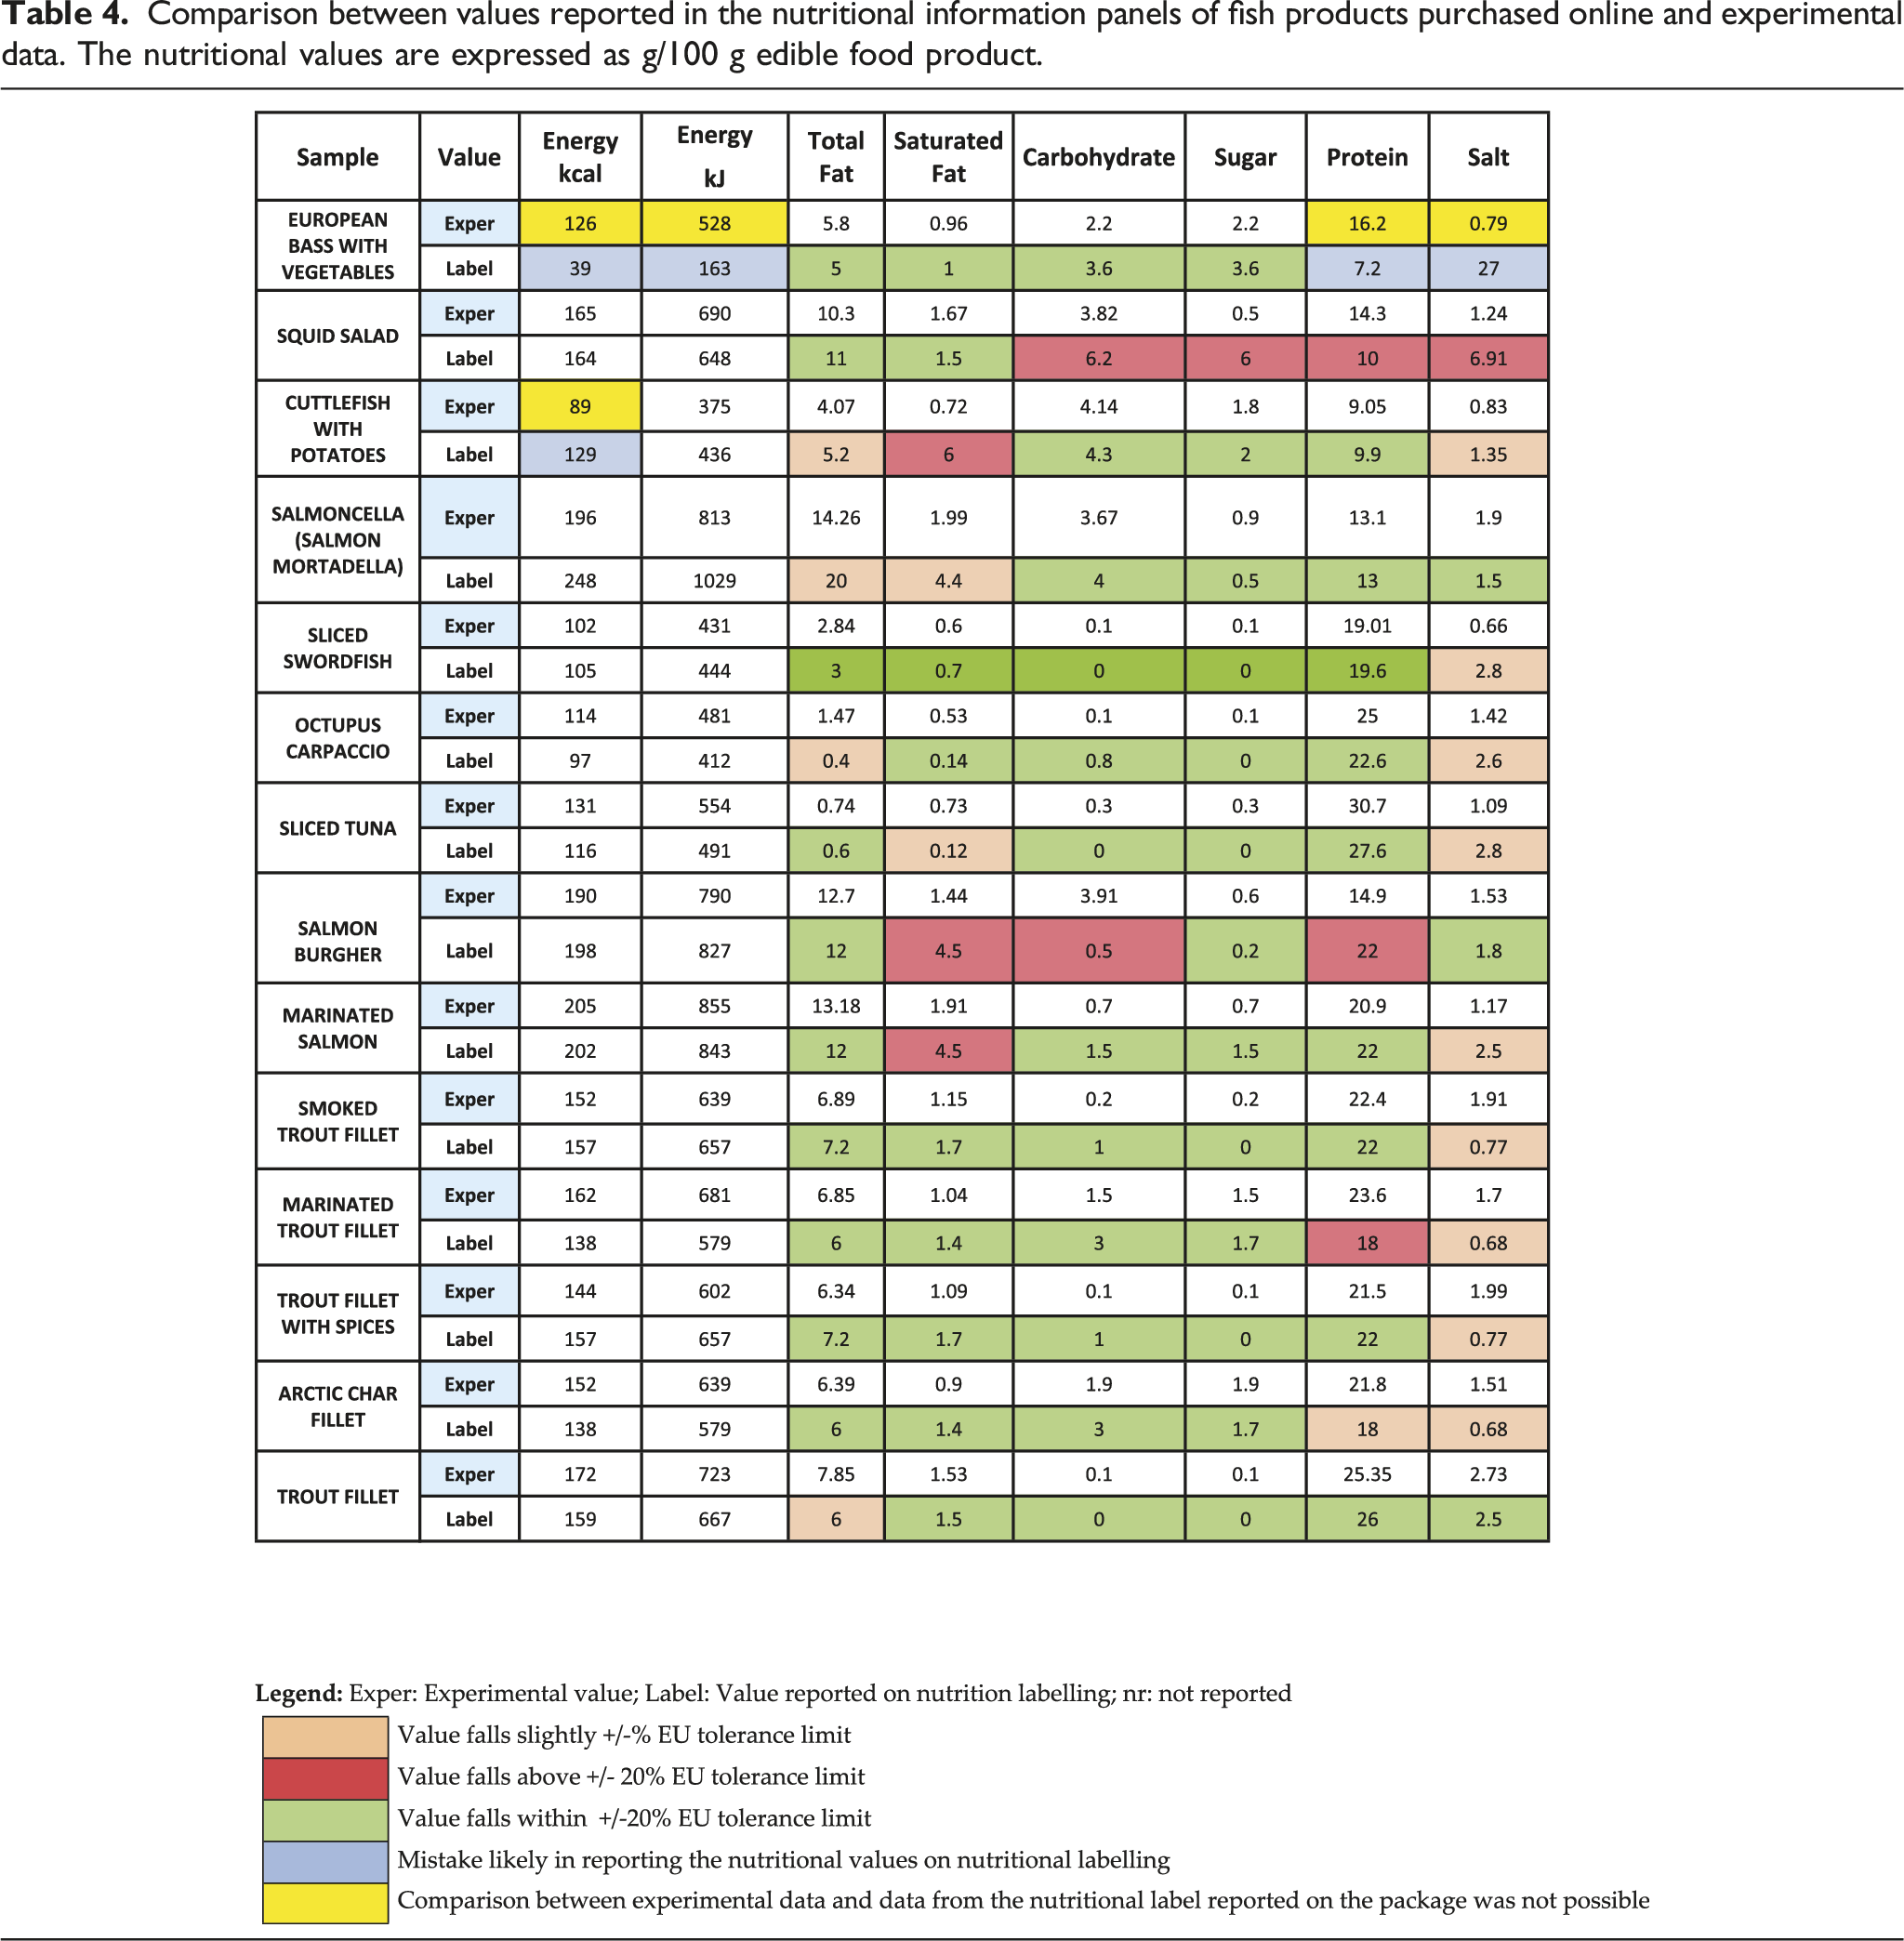
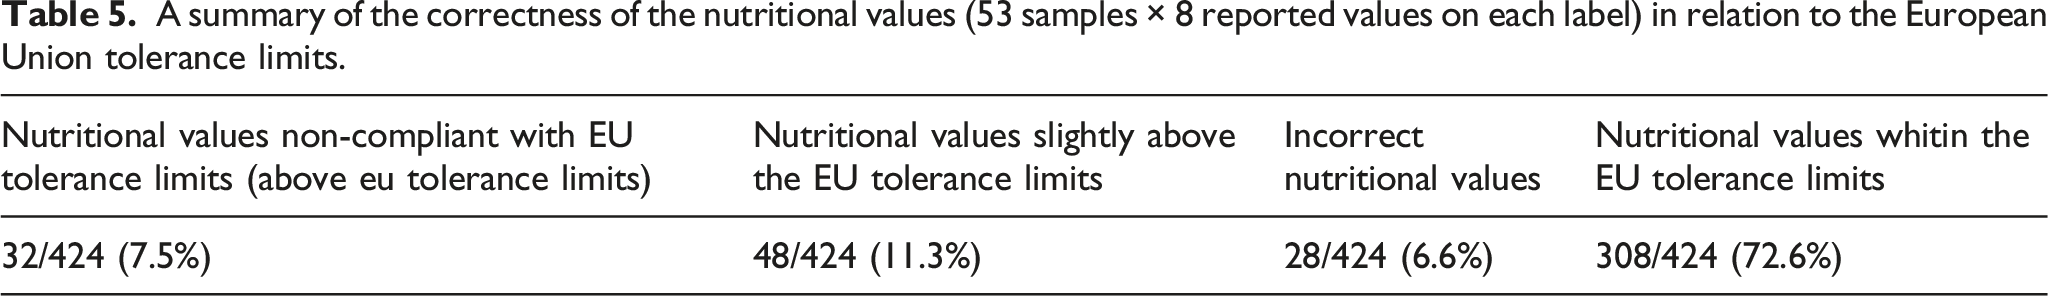
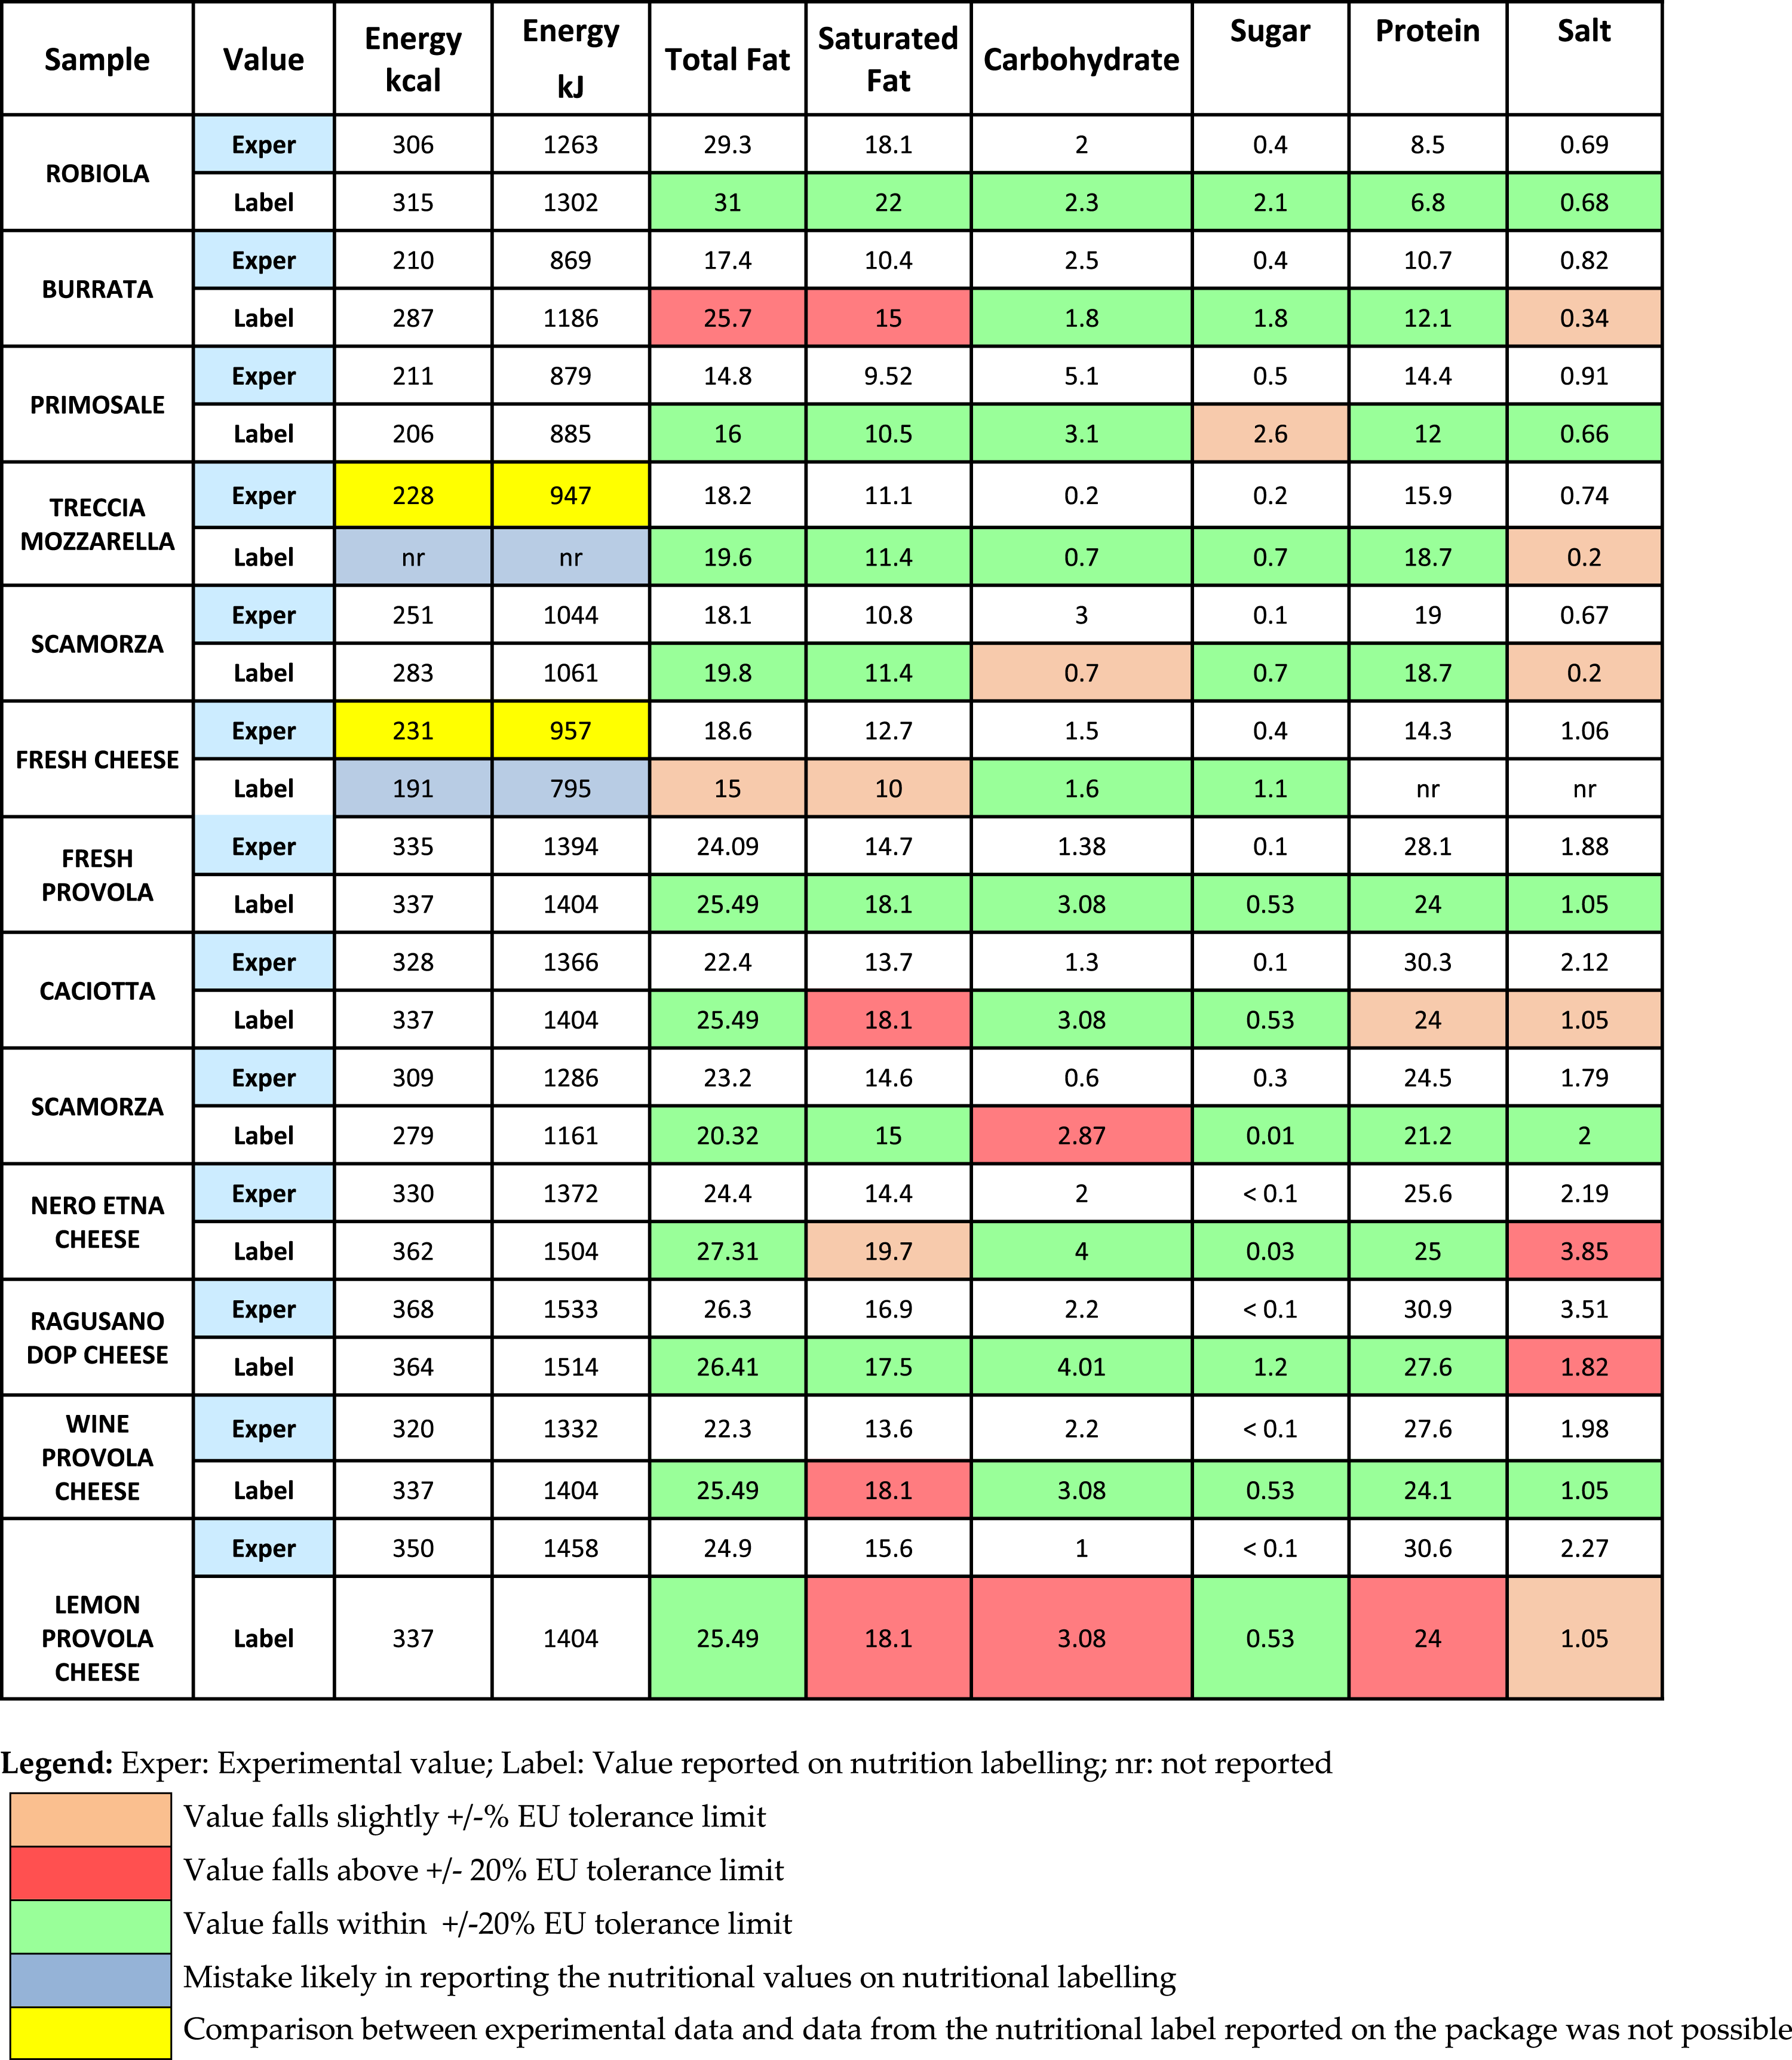
and this is summarized in Table S5 of the supplementary information. Briefly, the guide allows a margin of error (of up to 20%, including the uncertainty of the method) for the stated value versus the actual value of nutrients. Based on the EU guidance, more than 35.8% of the analyzed samples showed at least one value outside the tolerance limits (red colored values in Tables 2, 3, 4). A summary of the correctness of values of all the labels (424 nutritional values, i.e., 53 food products x 8 reported values on each label) in relation to the EU tolerance limits is shown in Table 5. Among 424 nutritional values, 32 values were greatly above the tolerance limit thus non-compliant with the EU tolerance limits (7.5%), 48 values (11.3%) were slightly above the tolerance limit and 308 were within the tolerance limits (Table 5). Finally, 28 values were completely incorrect and their comparison with the experimental results was impossible (6.6%). It is worth noting that the total fat was greatly above the tolerance limit in 8 food products, while 12 food products contained levels of monounsaturated fatty acids greatly above the tolerance limit (red boxes in Tables 2, 3, 4). Monounsaturated fats were the nutrients with most inconsistences, in terms of compliance with European Union tolerance limits and they were observed mainly in meat and cheese products (chicken breast, ground beef, saltimbocca, rollata farcita, and strolghino, caciotta, burrata and provola). However, those foods contained low amounts of fatty acids that were close to the reliable detection range of the technique (Table S1 of supplementary information). Nevertheless, in a recent publication, the declared values of 209 ready-to-eat foods, purchased in regular Portuguese retail outlets were checked for compliance with EU tolerance limits of salt and fat. For saturated fat, 27% of the foods were outside of the tolerance limits and only half of the foods with a declared value ≥1.25 g/100 g were within tolerance limits for salt content.
13
In 2014, the accuracy of food labels of over a thousand food products was assessed by the Canadian food inspection agency, which found 16.7% of products were “unsatisfactory”, with laboratory values exceeding ±20% of the label value.
11
They found that salt and saturated fat were the food components that produced the highest numbers of unsatisfactory analytical data: label comparisons 18.4% and 15.8%, respectively. In the same vein, we found 23/52 salt values measured in the foods examined were outside the EU tolerance limits. We also observed some typographical errors on the product labels. Some of them reported a saturated fatty acid value higher than the total fat content. In the cuttlefish with potatoes, the amount of saturated fatty acid declared on the label was likely provided by the analytical chemistry laboratory as a percentage of fat, but has been directly reported in the label without calculating the total amount of fat in the product. A total of 11 food products out of 56 had declared energy values on their labels (yellow-colored energy values in yellow boxes, Tables 2, 3, 4). Although the values of the components in these 11 foods were compliant with those provided by NIR spectroscopy, incorrect energy values were reported (either as kcal or kJ, or both). It seems manufacturers’ calculations of kcal and kJ energy values were incorrect; interestingly, the energy values were mainly underestimated. In another study, on average, packaged foods contained 8% more calories than advertised and restaurant foods were an average of 18% over the stated calorie counts.
43
Even more disheartening, this particular study focused on “reduced calorie” foods.
43
Finding an average of 18% over the stated calorie counts in reduced calorie foods, sounds more like food fraud. A recent study on the accuracy of nutritional labels of well-known snacks in the United States observed discrepancies in reported calories due to inaccurate carbohydrate content measurements and serving sizes.
44
Typographic errors were also encountered in two food labels (saltimbocca and ground meat). The values 9 and 6.8 appeared on the nutritional information panels instead of 19 and 26.8, respectively. Since the calculated energy values were correct, we speculate the values were erroneously transcribed. Four different items (wine provola, lemon provola, fresh provola and caciotta) had identical labels, which is fraudulent to customers who have the right to know the real nutritional content of what they eat. This is also illegal, since clearly, these cheeses, from the same manufacturer, must contain different ingredients and have different nutritional compositions. The label of one fresh cheese was incomplete, with the salt and protein values missing. For one food item (sausage), the on-label values were completely different from our data. The stated values were very low and we suggest they were illegally declared without any analytical verification. The current study demonstrated that NIR spectroscopy can monitor the compliance of nutritional labels of food items and guide the choice of reference methods for confirmation purposes. Normalized NIR spectra of the meat samples analysed in the study displayed between 9000 and 4500 cm−1. Normalized NIR spectra of the cheese samples analysed in the study displayed between 9500 and 4000 cm−1. Normalized NIR spectra of the fish samples analysed in the study displayed between 1100 and 4500 cm−1. Assignment of bands of NIR spectra of meat, fish and cheese products. Comparison between values reported in the nutritional information panels of meat products purchased online and experimental data. The nutritional values are expressed as g/100 g edible food product. Comparison between values reported in the nutritional information panels of cheese products purchased online and experimental data. The nutritional values are expressed as g/100 g edible food product. Comparison between values reported in the nutritional information panels of fish products purchased online and experimental data. The nutritional values are expressed as g/100 g edible food product. A summary of the correctness of the nutritional values (53 samples × 8 reported values on each label) in relation to the European Union tolerance limits.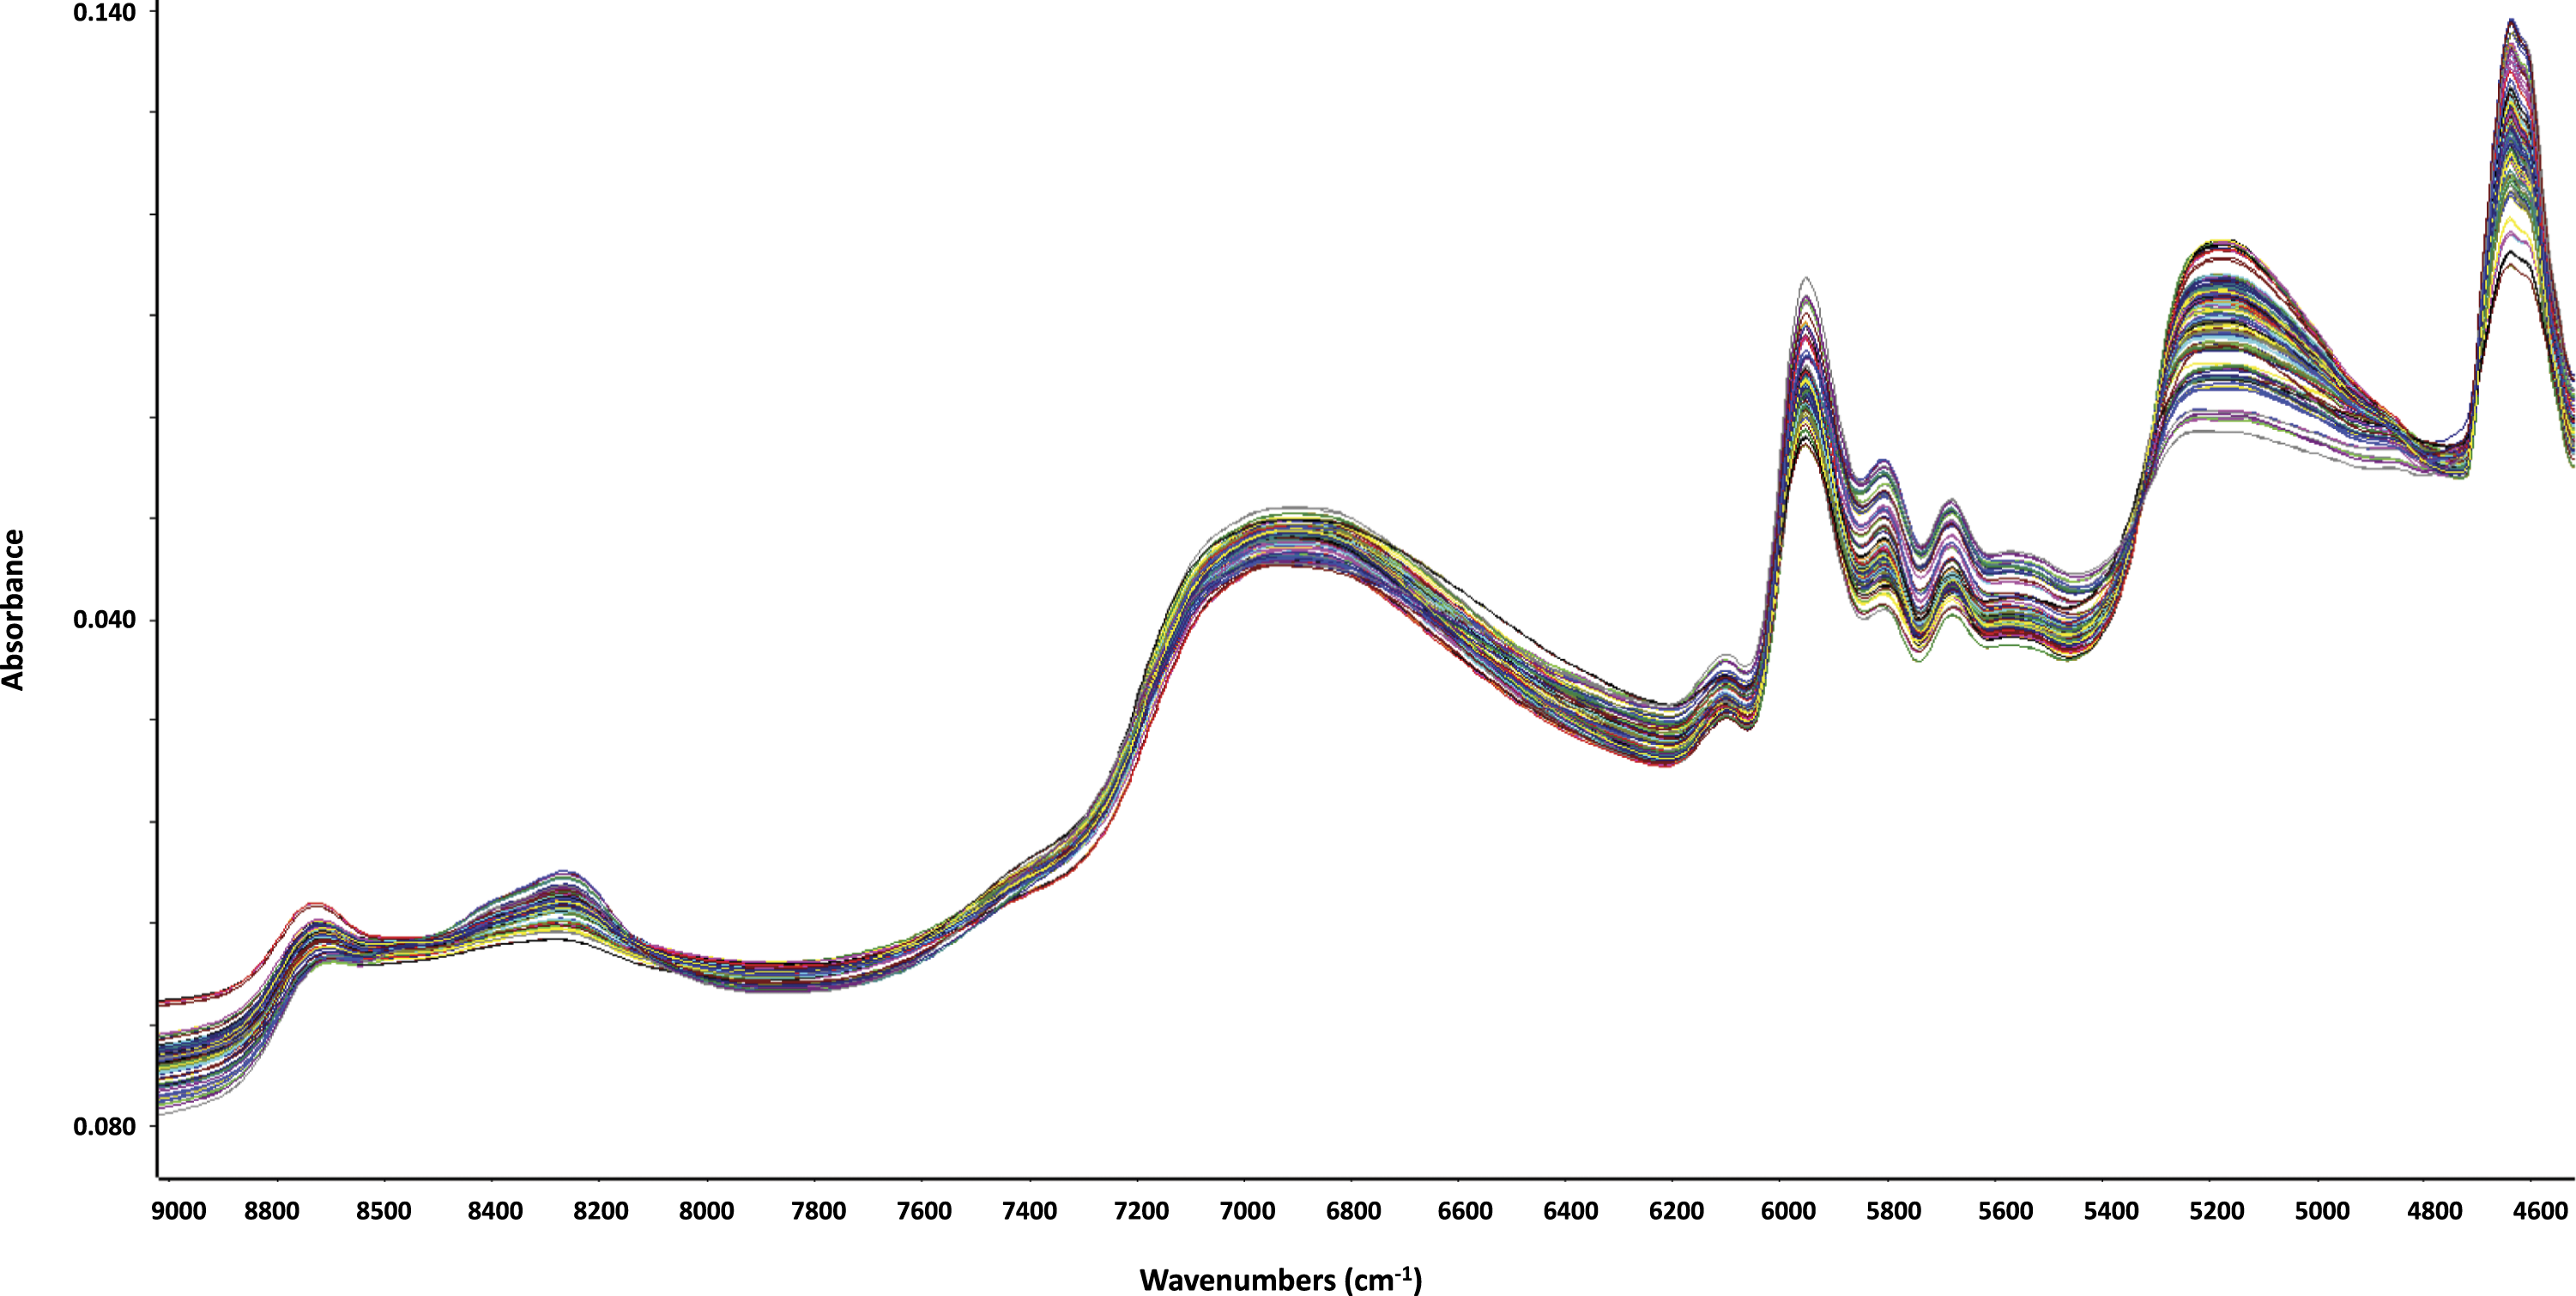
Conclusions
Customers of both physical retail outlets and online groceries have the right to expect that the information on food products’ nutritional information panels (NIP) is true. The European Union requires labels on pre-packaged food products not to be false or misleading. Therefore, as a food chemistry laboratory belonging to the Italian Ministry of Health, a study was undertaken to confirm the validity of information appearing on NIPs on food sold online using NIR spectroscopy to rapidly predict the nutritional values of various foodstuffs. It was observed that 35% of the processed foods bought from online groceries did not bear any nutritional label when the foods were delivered, even though these labels are required by law. Based on the EU guidance, more than 35.8% of the analyzed samples showed at least one value greatly outside the tolerance limits. Note that the samples analyzed in this study are produced by small local dairy and meat farms and fisheries and are mainly sold in online retail outlets. No mistakes were encountered in the few samples (20% of the entire dataset) produced by well-known food suppliers that sell their items both in regular supermarket and online retail outlets. Therefore, this study does not provide a picture of the nutritional claims (availability and accuracy of the nutritional claims) of the regular Italian groceries, but it alerts consumers to inconsistencies that may be encountered on well-known e-commerce websites. In contrast to large scale distribution networks that carefully abide to the food safety rules both on site and on line, small, independent food producers that sell their food items through e-commerce web platforms should be aware of what is required by the EU legislation. As e-commerce becomes a larger percentage of the overall grocery sales, many Italian small business retailers should focus on adapting their practices to ensure they meet food safety best practices including correct nutritional food labels. For manufacturers, food labelling can be expensive, but further costs are incurred when the labelling is not compliant or missing, especially in the case of a fine or prosecution for false labels or when legislators impose product withdrawal from the market. Although the e-commerce web-portal guidelines clearly state that the food sellers must comply with EU food safety and labeling requirements and in particular with the requirements for the European Union, no checks are made and the presence of the label is left to the responsibility of the seller. This is already practiced by large scale distribution companies, and e-grocery retail platforms should make an effort to provide the nutritional characteristics of all presented food items, improve the accessibility to nutrition fact labels and help online grocery shoppers to easily compare the content of multiple products. Finally yet importantly, as the health competent authorities that check for food safety are territorial, the question remains as to what regulatory body is going to check the compliance of food labels of food manufactured in a specific region and sold throughout Italy and the rest of the EU? The use of NIR spectroscopy can help with an initial screening of the compliance of nutritional information panels of a large number of samples and guide the choice of reference methods for confirmation purposes.
Supplemental Material
Supplemental Material - Nutritional labelling of food products purchased from online retail outlets: screening of the compliance with European union tolerance limits by near infrared spectroscopy
Supplemental Material for Nutritional labelling of food products purchased from online retail outlets: screening of the compliance with European union tolerance limits by near infrared spectroscopy by J Marco Bragolusi, Alessandra Tata, Andrea Massaro, Carmela Zacometti and Roberto Piro in Journal of Near Infrared Spectroscopy
Footnotes
Acknowledgments
The authors thank Dr. Lisa Barco and Dr. Pietro Antonelli for providing the samples from best known e-commerce web-portals.
Author Contributions
Conceptualization and Supervision: R.P; Methodology and Investigation: MB, CZ; Writing Original Draft, Reviewing and Editing: A.T., R.P.; Formal Analysis: AM.
Declaration of conflicting interests
The author(s) declared no potential conflicts of interest with respect to the research, authorship, and/or publication of this article.
Funding
The author(s) disclosed receipt of the following financial support for the research, authorship, and/or publication of this article: This research was supported by grants from the Italian Ministry of Health (IZS VE 01/16 RC) entitled: “Il mercato online dei prodotti alimentari: studio e messa a punto di un sistema di controllo per la tutela del consumatore”.
Supplemental Material
Supplemental material for this article is available online.
References
Supplementary Material
Please find the following supplemental material available below.
For Open Access articles published under a Creative Commons License, all supplemental material carries the same license as the article it is associated with.
For non-Open Access articles published, all supplemental material carries a non-exclusive license, and permission requests for re-use of supplemental material or any part of supplemental material shall be sent directly to the copyright owner as specified in the copyright notice associated with the article.