
Abstract
Compositional variations in the surfactants used to produce personal care products result in significant challenges during large scale manufacturing, for example errors in product viscosity. Characterisation of the surfactant can be completed using chromatographic techniques however these are time consuming and impractical during real-time manufacturing. Near infrared (NIR) absorption spectroscopy with a fibre-optic coupled transmission probe is proposed as an in-line method of determining the levels of unsulfated alcohol in sodium lauryl ether sulfate (SLES). NIR absorption spectra in the region of 4000 – 12000 cm−1 were collected for a range of supplier samples at three temperatures. Gas chromatography - mass spectrometry was used as a reference technique to quantify samples of SLES and quantitative chemometric data analysis was used to produce partial least squares (PLS) calibration models for the prediction of surfactant composition. PLS regression was performed on the data in the spectral regions between 7509 – 5334 cm−1 using a range of data pre-processing techniques to identify the best model. Models were evaluated using root mean square error of cross validation (RMSECV) and residual predictive deviation (RPD) as the primary indicator of model accuracy and robustness. A partial least squares regression model using a generalised least squares weighting data pre-processing approach was found to be the most robust in regards to sample non-homogeneity and temperature, producing a model with an RMSECV = 0.094 w/w% and RPD = 4.03. The model successfully predicted the unsulfated alcohol mass percentage in an external validation of unknown samples with alcohol levels within the model limits of 0.7–2.2 w/w%. Spectra acquired at a resolution of 8 cm−1 with 32 scans take just 16 seconds to obtain, proving that NIR spectroscopy can successfully be applied as an alternative analytical method to gas chromatography for the determination of low level impurities in viscous surfactant systems.
Keywords
Introduction
Surfactants (surface active agents) are molecules used extensively across a wide variety of industries, including consumer goods, oil and gas and agriculture. In the personal care industry surfactants are used to act as a cleaning agent that removes dirt from the hair and skin and are common ingredients in shampoos and body washes.
It is important for the companies developing personal care products to consider the user experience, for example how the product looks, smells and feels, in addition to the efficacy of the product. Surfactants are essential in maintaining this latter quality attribute. The micellar structures created by surfactants are largely responsible for the viscosity of the final product and hence must be formulated and processed to one that is desirable to the average consumer.
Sodium lauryl ether sulfate (SLES) is an anionic surfactant commonly used in personal care products due to its superior detergency, tolerance for water hardness and mildness to skin.
1
Due to the high cost of manufacturing pure surfactants, commercially available materials almost always contain a mixture of components. This mixture is a combination of the precursor materials used to produce the surfactants, reaction by-products, and desired product. SLES is produced via the sulfation of ethoxylated alcohols. The ethoxylated alcohols are produced via the ethoxylation of short chain alcohols, derived from palm kernel oil. Many viable processing routes exist for the sulfation process, however a commonly used reaction mechanism is provided in equations (1) to (3).
2
For the parent primary alcohol, ROH, R is usually C12 (1-dodecanol or lauryl alcohol) carbon number. This is reacted with ethylene oxide (CH2CH2O) to produce an ethoxylated alcohol. The ethoxylated alcohol is then reacted with vapourised sulfur trioxide and neutralised with sodium hydroxide to produce the SLES. The ethoxylation reaction (reaction 1) kinetically favours the addition of multiple ethoxylate (EO) groups rather than a single ethoxylation. Hence the resulting product contains a mixture of surfactants with varying chain lengths and numbers of ethoxylate groups, water and unsulfated ethoxylated alcohols. The conversion of ethoxylated alcohol to surfactant is dependent on the processing conditions during the sulfation (reaction 2). The sulfation process is well documented and more details can be found in the literature.3–6

Both the carbon chain length distribution and the ethylene oxide distribution are responsible for the physical characteristics of the surfactant in addition to the detergency and biodegradability characteristics. As there are many synthesis routes available for suppliers to choose from, the surfactant characteristics become supplier dependant. 1 Previous studies7–9 have concluded that the presence of long chain alcohols can affect the viscosity of diluted surfactant systems by solubilisation into the micelle structures.
Due to the low volumes of surfactant used at laboratory scale manufacture of formulations, compositional variations in the surfactant are rarely encountered until large scale manufacturing begins. When a strict formulation is followed, the variability in surfactant quality results in increased rates of product failures against quality control measures, thus increasing manufacturing time, cost, and waste production.
The ability to determine surfactant composition, especially in regards to unsulfated alcohol content, during manufacturing would be beneficial to predicting micelle structure and identifying opportunities for intervention before products with out of specification viscosities are produced.
Analysis of the products of the sulfation process has previously been studied using chromatographic methods. Weil et al. 10 used gas-liquid chromatography to study the reaction products from the sulfation of fatty alcohols, using propylene oxide, Molever 11 used high temperature gas chromatography to monitor the level of unsulfonated linear alkylbenzene in a linear alkylbenzene sulfonate product, and Bengoechea and Fernández 12 advanced on this work by characterising the unsulfonated linear alkylbenzene using high performance liquid chromatography.
Although chromatography has been shown to be a reliable and accurate method for the analysis of sulfation products the proposed chromatographic methods are time consuming and results are slow to obtain, often taking up to 60 minutes for sample measurement and requiring a trained technician to interpret the results. 13 The delay in obtaining results combined with the continuous nature of the process means that the results are not representative of the current product.
Near infrared (NIR) spectroscopy is proposed as an alternative process analytical technique. NIR spectroscopy has been extensively studied and used as a process analytical technique and is widely reported in literature. The speed and ease at which process measurements can be obtained makes it desirable over longer laboratory techniques. The alcohol in SLES is specified to be present in quantities not more than 3% by weight of the SLES, to be a useful tool to aid large scale manufacturing of personal care products the unsulfated alcohol needs to be known to the nearest 0.1% of the weight of the SLES. NIR spectroscopy has been shown to be a successful technique for quantifying analytes at low concentrations even when the spectral features of the analyte of interest are similar to that of the bulk sample matrix. Pan et al. 14 has used NIR spectroscopy to quantify low level actives in pharmaceuticals at levels of 1% of the total mixture and Blanco et al. 15 has identified different preservatives with similar molecular structures within the same matrix at concentrations as low as 0.129 mg/g.
Near infrared spectroscopy has previously been used to study surfactants. Walling and Dabney16,17 used NIR reflectance spectroscopy to ensure the conformance of surfactants to predetermined compositional specifications. A key difference between their work and the work presented in this study is that they measured active detergent, solids and moisture of sodium lauryl sulfate rather than unsulfated alcohol. The study used a bench top spectrometer, collecting spectra over the wavelength range 1100 nm to 2500 nm using a resolution of 4 nm, and diluted surfactant (70% water) whereas this study will focus on an immersion probe and a concentrated surfactant (70% surfactant).
The near infrared region studies the hydrogen atom in various molecular environments, covering the overtones and combinations of lower energy fundamental molecular frequencies C–H, O–H and N–H vibrations. 18 The spectra for SLES is expected to exhibit absorbance peaks associated with the vibrations of the aliphatic hydrocarbon chain, the alcohol head group of the unsulfated alcohols, and water. The absorption frequencies for the C–H and O–H absorptions in the NIR region are provided by Bokobza. 18 The first and second overtones of the O–H stretching vibrations in alcohols are located around 1400 nm (7142 cm−1) and 1000 nm (10,000 cm−1) respectively, while the stretching bending combination occurs near 2000 nm (5000 cm−1). These O–H vibrations are however known to be sensitive to the environment. Water displays specific peaks at 1940 nm (5154 cm−1) for the combination band and 1440 nm (6944 cm−1) for the first overtone. The C–H absorptions for the aliphatic hydrocarbon are found in the regions; 2000 nm (5000 cm−1) and 2400 nm (4166 cm−1) for the combination vibrations, between 1600 nm and 1800 nm (6250–5555 cm−1) for the first overtones, and between 1000 nm and 1200 nm (10000–8333 cm−1) for the second overtones.
The aim of this study is to investigate the feasibility of using near infrared spectroscopy as an in-line process analytical technique to determine the quantity of unsulfated alcohol present in the product of the sulfation of ethoxylated alcohols. The paper describes the generation of PLS calibration models for NIR spectra using reference data generated through gas chromatography.
Materials and methods
Samples of SLES 1EO (SLES with an average degree of ethoxylation of 1) of 70% concentration in water were received from 4 different sulfation plants and suppliers, which had been collected over a 12 month period. All samples were manufactured under the same quality specification guidelines of 68–72% active level, 0.5–2.5% unsulfated alcohol. The suppliers did not disclose whether the samples were manufactured via the same processing route. All samples were received with a certificate of analysis and were compliant with the specification guidelines given above.
Gas chromatography
Unsulfated alcohols were identified and quantified using gas chromatography-mass spectrometry as a reference method. Chromatographic measurements were performed using an Agilent 6890 N gas chromatograph with an Agilent 5973 mass spectrometer (Agilent, Santa Clara, CA, USA). An SGE BPX5 5% phenyl polysilphenylene siloxane capillary column was used with a temperature ramp from 120 to 275°C at a ramp rate of 4°C min−1. An injection volume of 4 µl was used. Samples are held at 120°C for a period of 5 minutes and at 275°C for 15 minutes. The run time per sample is 58.75 minutes.
Calibration samples with known concentrations were prepared for reference as follows. A sample of the feedstock alcohol, provided by supplier A of the SLES, was dissolved into a solution of 40:60 isopropanol to water at concentrations of 0.5, 1 and 2%. 5 ml of an internal reference of 0.1% 1-undecanol in hexane was added to each dilution and shaken for 15 minutes. 1-undecanol was chosen as the reference as odd numbered hydrocarbon chains are not expected to be present in the feedstock. The solutions were left to separate, then the top layer containing the hexane was extracted before being dried with 2 g of granulated sodium sulfate. The solution was then injected into a 2 ml vial using a 22 µm syringe filter.
Samples of SLES of mass 1 g ± 0.01 g were dissolved into a 40:60 isopropanol water mixture. 5 ml of 0.1% 1-undecanol in hexane was added and shaken for 15 minutes. The solutions were left to separate then the top layer containing the hexane was extracted before being dried with 2 g of granulated sodium sulfate. The solution was then injected into a 2 ml vial using a 22 µm syringe filter.
A calibration curve was produced by plotting the ratio of the undecanol standard peak to the sum of all the alcohol peaks in the chromatogram against the concentration of the feedstock present in the hexane layer. Between 6 and 8 measurements were collected for each sample.
Spectroscopic measurements
Near infrared absorption spectra were obtained over the wavenumber range of 4000 – 12,000 cm−1 using a Bruker Matrix F Fourier Transform near infrared spectrometer (Bruker Optik GmbH, Ettlingen, Germany) with a fibre-coupled Hellma Excalibur 20 transmission probe (Hellma GmbH & Co., Müllheim, Germany) with a 2 mm path length. Each spectrum acquired was an average of 32 scans collected at a spectral resolution of 8 cm−1. These conditions were experimentally determined to be an adequate compromise between sampling time, allowing a representative view of the non-homogenous sample to be obtained, and peak resolution, to provide sufficient information across the overlapping water and alcohol peaks. The measurement time was approximately 16 s and the blank transmission cell, filled with laboratory air was used for background measurements. The probe was cleaned using distilled water in between samples.
Absorptions in the NIR region are primarily due to vibrational overtone and combination bands. These are temperature dependent and so spectra were collected for each sample at three different temperatures between 20 – 50°C. Each sample was measured between two and three times at each temperature.
Samples were measured as received and, other than the application of heat, were not manipulated prior to measurement. At 70% concentration SLES exists in a lamellar phase, and hence is highly viscous which results in the material not naturally flowing unaided into or through the 2 mm gap in the transmission probe. Samples were manually pipetted into the gap during measurements at a rate of approximately 10 ml per spectrum. This aided maintenance of constant temperatures within the probe.
Repeat measurements of the same sample suggested that if the sample remains undisturbed within the spectrometer the spectra obtained are exact matches of each other, however if the sample was disturbed, for example by a small amount of sample movement, the resulting repeat spectra were different. Due to the viscous nature of SLES it was expected that there are isolated pockets of varying composition hence, the differences obtained in spectra represent real compositional difference within the same sample. To account for this the spectra were obtained whilst the sample was flowing through the probe to obtain a more representative average spectrum per sample.
Chemometrics and data analysis
Partial Least Squares (PLS) regression calibration models for the unsulfated alcohol in sodium lauryl ether sulfate samples were generated using the PLS_Toolbox chemometrics software (PLS_Toolbox version 8.7, Eigenvector Research Inc., Manson, WA) in MATLAB (Version 9.2, The MathWorks, Inc., Natick, MA). The SIMPLS PLS1 algorithm was used.
Temperature was considered to be a disturbance rather than an independent variable when identifying the model. Space limitations means that PLS is not described here in detail. For further information, the reader is referred to the works of Wold et al. 19
The impact that different data pre-processing methods had on the accuracy of the resulting PLS calibration model when it was applied to unseen data was investigated. Standard normal variate (SNV), multiplicative scatter correction (MSC), extended multiplicative scatter correction (EMSC), first derivative, second derivative, generalised least squares weighting (GLSW), and extended mixture model (EMM) techniques were applied. To suppress noise generated from the derivative pre-processing techniques Savitsky-Golay filters were applied to the derivative data. Savitsky-Golay filters with a polynomial order of 1 and a window size of 17 was found to be suitable. To determine suitable values for parameters, such as the number of latent variables to use in the PLS model and the specific sections of spectra to use, cross-validation using ‘venetian blinds’ with 10 data splits and one sample thickness per blind was applied.
The PLS models were generated using a set of calibration data and cross validated using subsets of the original calibration data. The models were additionally validated against a set of unseen samples. Resulting PLS models were evaluated using statistical measures; including the root mean square error of calibration (RMSEC), root mean square error of cross validation (RMSECV), root mean square error of prediction (RMSEP) for the unseen set of samples, coefficient of determination, R2, and residual predictive deviation (RPD) as recommended by Williams et al. 20 The RMSEC statistic holds limited value as it does not provide a measure of the predictive accuracy of the model when applied to unseen data, which is typically the most important requirement for the model. The RPD statistic provides a relative method for measuring how well the calibration model can predict concentrations; it is calculated as the ratio of the standard deviation of the reference measurements to the RMSECV. The value of RPD should be as high as possible, with an RPD in the range of 3.1–4.9 being considered good for screening purposes. For quality control purposes a model with and an RPD between 5 and 6.4 is recommended.20–22
Results and discussion
Results of reference calibration method
The composition of the feedstock alcohol and the impurities in the samples of SLES were identified using the GCMS reference method. The feedstock alcohol is sourced from palm kernel oil before undergoing the ethoxylation reaction, resulting in a mixture containing molecules with a distribution of both chain length and ethoxylates.
The retention times for the different alcohols were identified from the chromatograms of the pure ethoxylated lauryl alcohol feedstock. The retention times and distribution of the alcohols is provided in Figure 1 and Table 1.
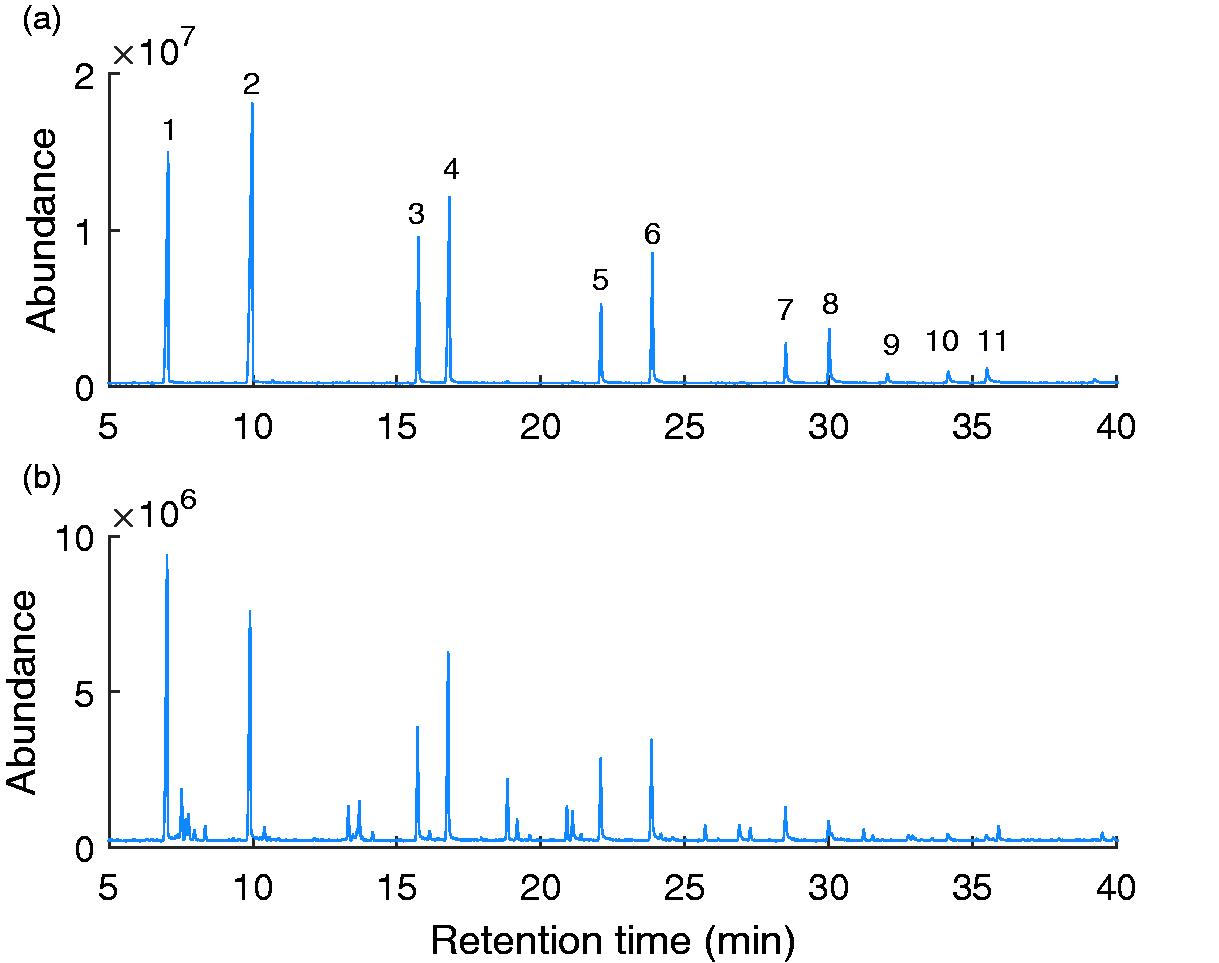
GCMS chromatogram of feedstock alcohols (a) and a typical sodium lauryl ether sulfate sample (b).
Composition of feedstock alcohol.
The impurities present in samples from different suppliers were found to be varied, with some impurities present in some suppliers’ materials and some not. This suggests different production routes may have been used, or there is the possibility of contamination from poor flushing of feed lines in-between the production of different surfactants. The impurities observed were a mixture of ethoxylated and non-ethoxylated alcohols, hydrocarbons, esters and carboxylic acids. As this study is exclusively investigating the detection of unsulfated alcohols, any GC peaks not identified as alcohols were excluded from the reference quantification calculations.
It was assumed that the distribution of chain lengths and degree of ethoxylation in the unsulfated alcohols is the same as would be observed in the sulfated molecules as there is no evidence that the sulfation reaction has any bias towards these parameters. The average non ethoxylated (primary alcohol sulfates) account for approximately 36.5% of all of the alcohols which is consistent with the 30–40% expected for a 1-EO according to Roberts. 2
The total alcohol range defined in the manufacturer’s specification is between 0.5–3 w/w%, but GC measurements showed the range of samples analysed to be narrower, between 0.7–2.2 w/w%. All samples were identified to have alcohol levels within this range. The average degree of ethoxylation across all samples was determined to be 1.01 however the maximum EO observed was 1.14 and the minimum 0.88. This is significant for the manufacture of formulated products however it is not expected to be an influencing factor when identifying the PLS models as the ethoxylate bonds are not observed in the NIR wavelength region. The standard error of the reference method was calculated to be 0.05 w/w%.
NIR model development
Sample sets
The developed NIR calibration must be robust to temperature and compositional variations across samples in order to be used reliably and routinely within a manufacturing environment. The temperature range of the resulting models will be reflective of the conditions the SLES encounters during processing. The temperature can fluctuate between 45°C, which is the temperature the storage tank is maintained at, and ambient, as the SLES is allowed to cool in the pipework. The models therefore include measurements collected at temperatures between 20 and 50°C.
Chemical compositional variability has been incorporated into the model by ensuring that samples were collected from different production plants and suppliers. In total 44 samples were collected from 4 suppliers. The spectra for all 44 samples at 3 temperatures are shown in Figure 2.
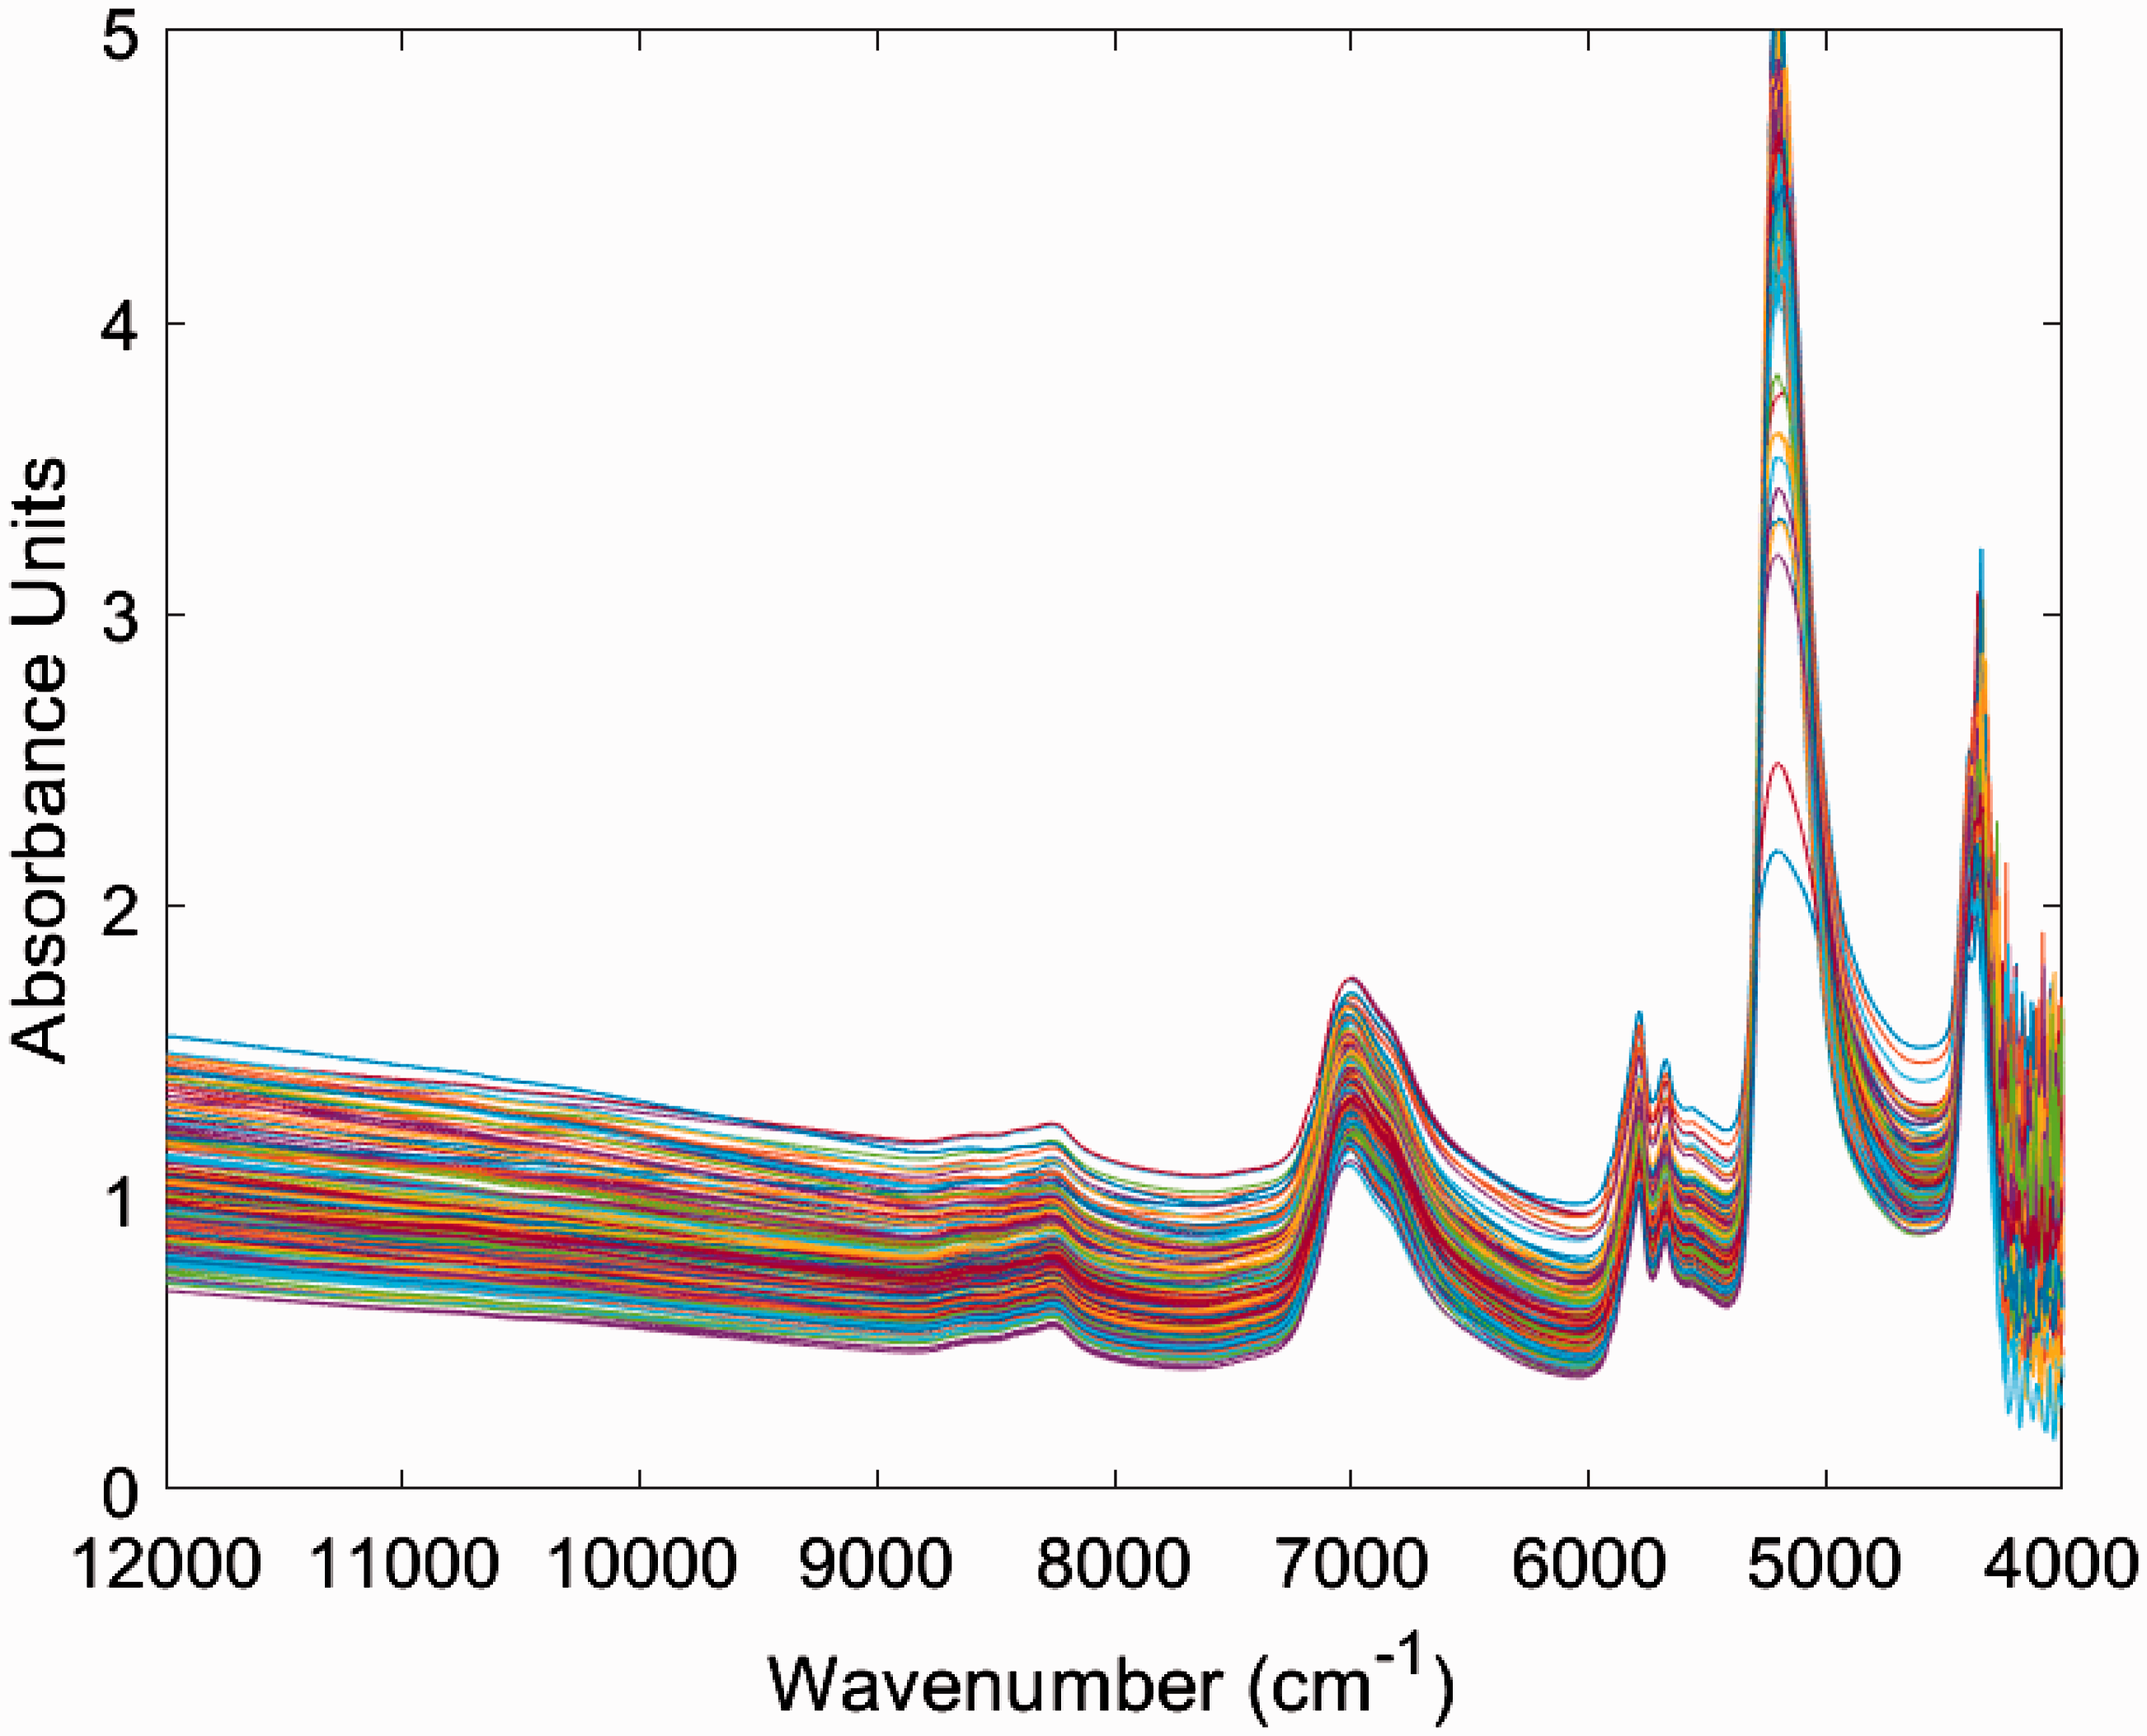
NIR spectra of all 44 SLES samples, each measured at 3 temperatures.
The samples, although chemically similar exhibit different physical properties, such as colour, consistency, aeration, and viscosity. An ideal calibration set would have included all possible expected unsulfated alcohol range (0.5–2.5%); however as samples were collected directly from suppliers’ routine batches it was not possible to specify desired unsulfated alcohol levels to receive. The calibration model was therefore produced only over the range of alcohol values received by the suppliers which corresponds to approximately 0.7–2.2 w/w% unsulfated alcohol.
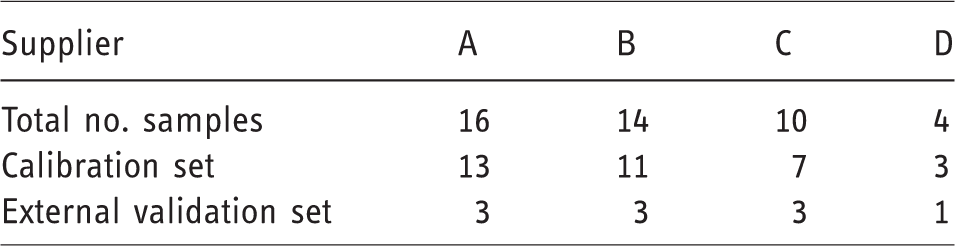
The samples were divided randomly into a calibration set and an external validation set. Table 2 shows how the 44 samples were divided into the calibration and validation sets. Each sample contained spectra obtained at three temperatures.
Sample breakdown into calibration and validation sets, A, B, C, and D represents different suppliers.
The inclusion of temperature into NIR calibration models has previously been studied.23–25 As with these studies the temperature differences were implicitly included as interferent or random variations in the samples.
Near infrared spectral regions
Absorption bands in the NIR region are weak and broad and primarily due to vibrations where hydrogen is one of the atoms such as C–H, O–H and N–H. Due to the presence of water, which makes up approximately 28% by weight of the SLES samples, the vibrations originating from the hydroxyl bonds in the alcohol are masked in the SLES samples.
Figure 3 shows example NIR spectra for the feedstock alcohol and for the sodium lauryl ether sulfate. The spectra of the feedstock alcohol and the SLES both contain bands at 4350, 5675, 5786, and 8247 cm−1. These peaks represent the combination region for CH2 and CH3 bonds, the first overtone of CH2, the first overtone of CH3, and the second overtones of CH2 and CH3 respectively. The feedstock alcohol has vibrational peaks present at 4837 and 7027 cm−1 that are unique to the alcohol. These have been identified as the combination region and first overtone for an R-OH bond respectively. The SLES spectra have peaks at 5196 and 7017 cm−1 that correspond to the first and second overtones of water. This agrees with the absorption regions observed by literature.26,27
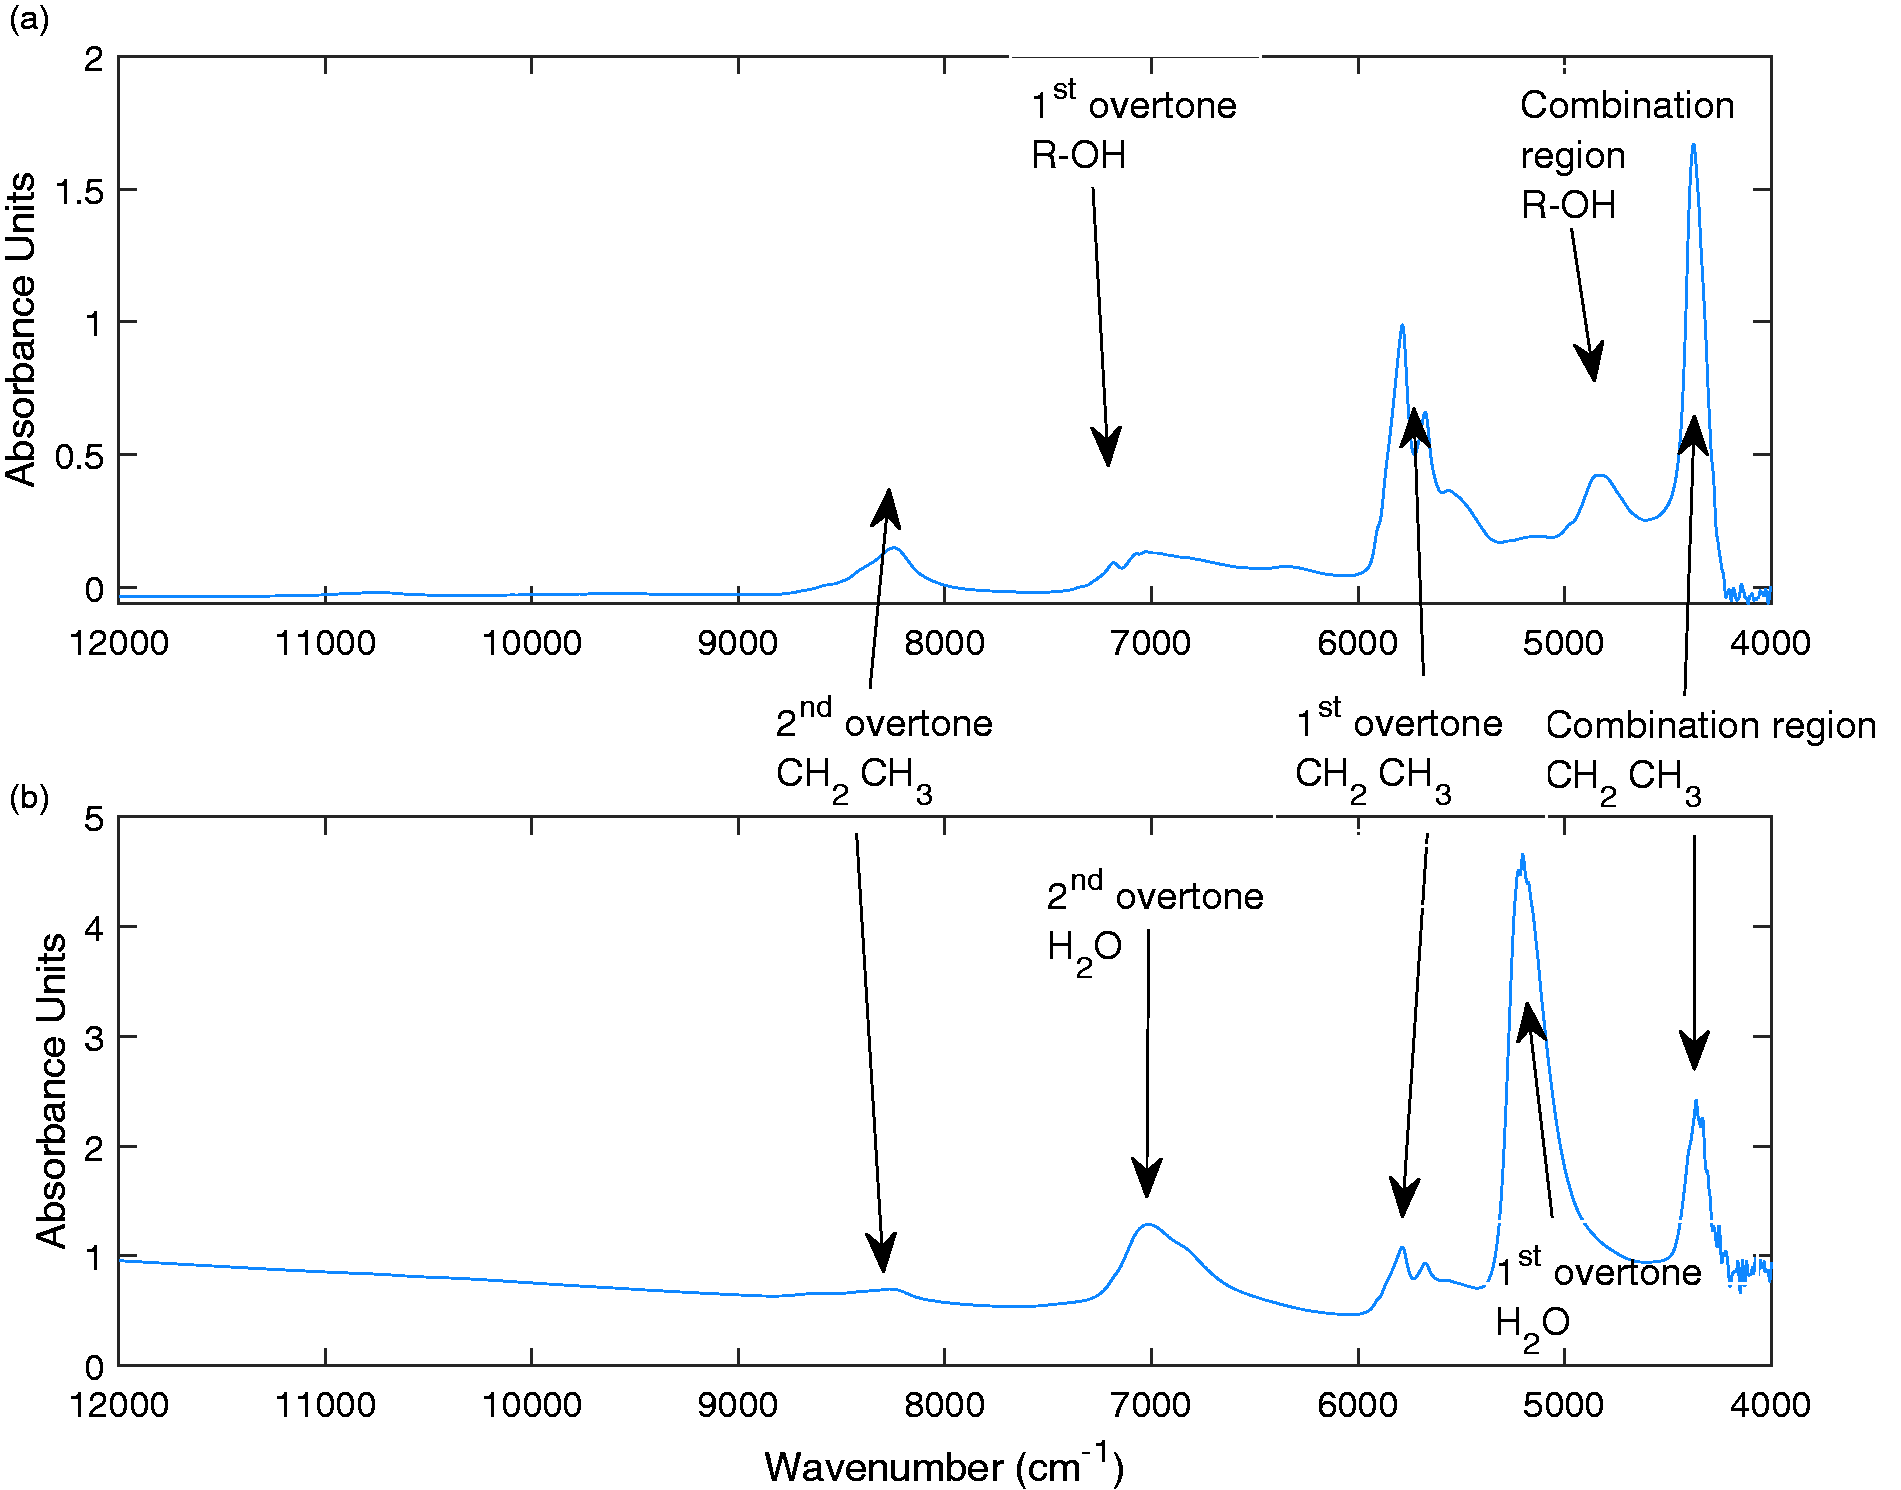
NIR spectra of feedstock (Ethoxylated lauryl) alcohol (a) and Sodium lauryl ether sulfate (b).
Previous studies have demonstrated the importance of selecting appropriate regions of the spectra to use in the calibration models.27,28 In this work the models were identified using measurements from the spectra in the region of 7413–5847 cm−1. This region corresponds to the first overtone of CH and OH. The fundamental R–OH region in the SLES samples is oversaturated due to the presence of water at high concentrations compared to the low concentrations of alcohols.
Data pre-processing
NIR spectra have weak, broad, overlapping bands, some containing irrelevant or detrimental information to the calibration models.
Appropriate data pre-processing technique were determined by analysing the RMSECV for the identified models relative to the number of latent variables. The models with the lowest RMSECV with the fewest latent variables were considered the most appropriate as these offer some protection against overfitting of the model. Figure 4 demonstrates the effect each pre-processing technique has on the model performance.
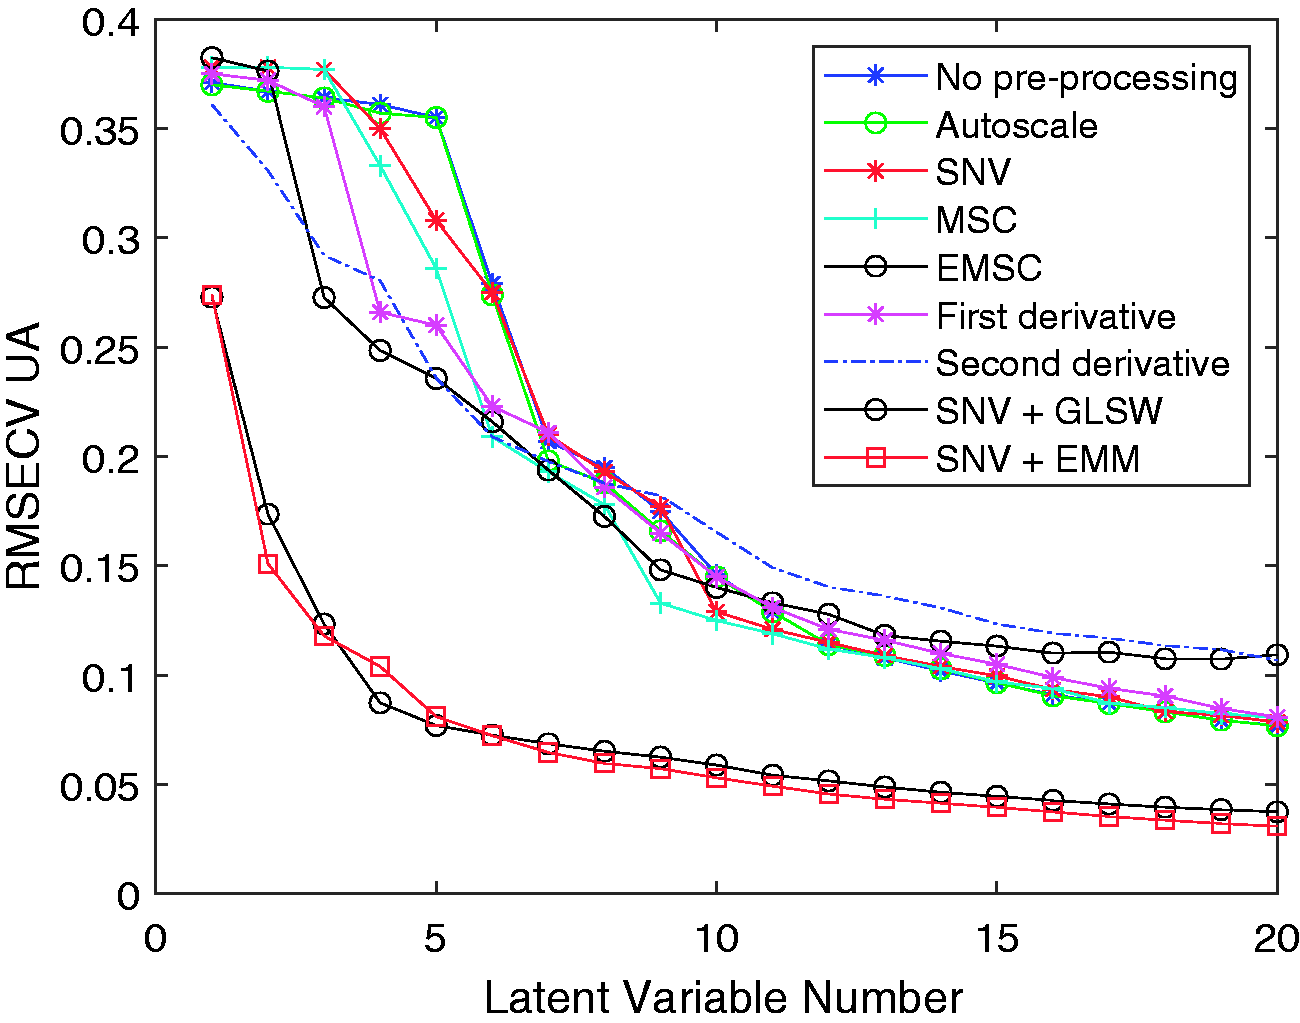
Plot of RMSECV versus number of latent variables for different data pre-processing techniques.
SNV is a data-preprocessing technique that reduces baseline offset from the data by standardising each spectra. Strong baseline offsets were observed between spectra and so the derivate, EMM and GLSW techniques were applied in addition to SNV. All models were created with mean centered data.
Two data pre-processing techiques stood out as producing PLS models with significantly better estimation capabilities than the others. Extended mixture model (EMM) and generalised least squares weighting (GLSW) methods operate differently to the other pre-processing methods in that they are designed to ignore spectral variability that is not directly correlated to the Y variables. This means data can be correlated even in circumstances where a set of samples should have identical responses but do not. 29 This is advantageous in this particular application where the samples are known to have spectral variations arising from temperature variations and compostional variations on a micro scale.
In the EMM and GLSW data pre-processing methods there is a clear “elbow” in the RMSECV at around 5 latent variables. Adding more latent variables past 5 does not give a significant advantage. Of the remaining pre-processing techniques, none exhibit a clear elbow. Each subsequent latent variable is describing only a small proportion of the data which most likely to be noise within the data sets. This gives a greater likelihood of overfitting the data. The methods using SNV, MSC, EMSC, first derivative and second derivative data pre-processing techniques provided no benefits compared with using the raw data with no data pre-processing.
GLSW calibration model
The GLSW pre-processing method was determined to be the most appropriate in this study and was used when identifying the calibration models. By definition, each latent variable describes less variance in the data than the last. In this case the first 5 latent variables describe 82% of the variance in the X data and 96% of the variance in the Y data. Above 5 latent variables there was less than 0.5% of variance in the Y data is captured per new latent variable, hence the model was built using 5 latent variables to minimise the risk of modelling noise and overfitting the model. The generated model gave RMSEC of 0.08 w/w%, an RMSECV of 0.09 w/w%, and an RMSEP for the external validation of 0.12 w/w%. The R2 values were calculated for the calibration, cross validation and external validation to be 0.96, 0.94 and 0.90 respectively.
The results of the calibration, cross validation and external validation are shown in Figures 5 to 7 respectively, each different symbol represents one of the 44 samples. The predicted value for the unsulfated alcohol for each sample varies with each repeat measurement of the sample, however this observed variation does not correlate with the temperature of the samples. It is indeterminable whether the differences in composition predicted for spectra of the same sample are due to errors in the model or actual compositional differences due to micro scale compositional variation within the surfactant samples. Temperature induced spectral variations were found to be sufficiently suppressed by the generalised least squares method.
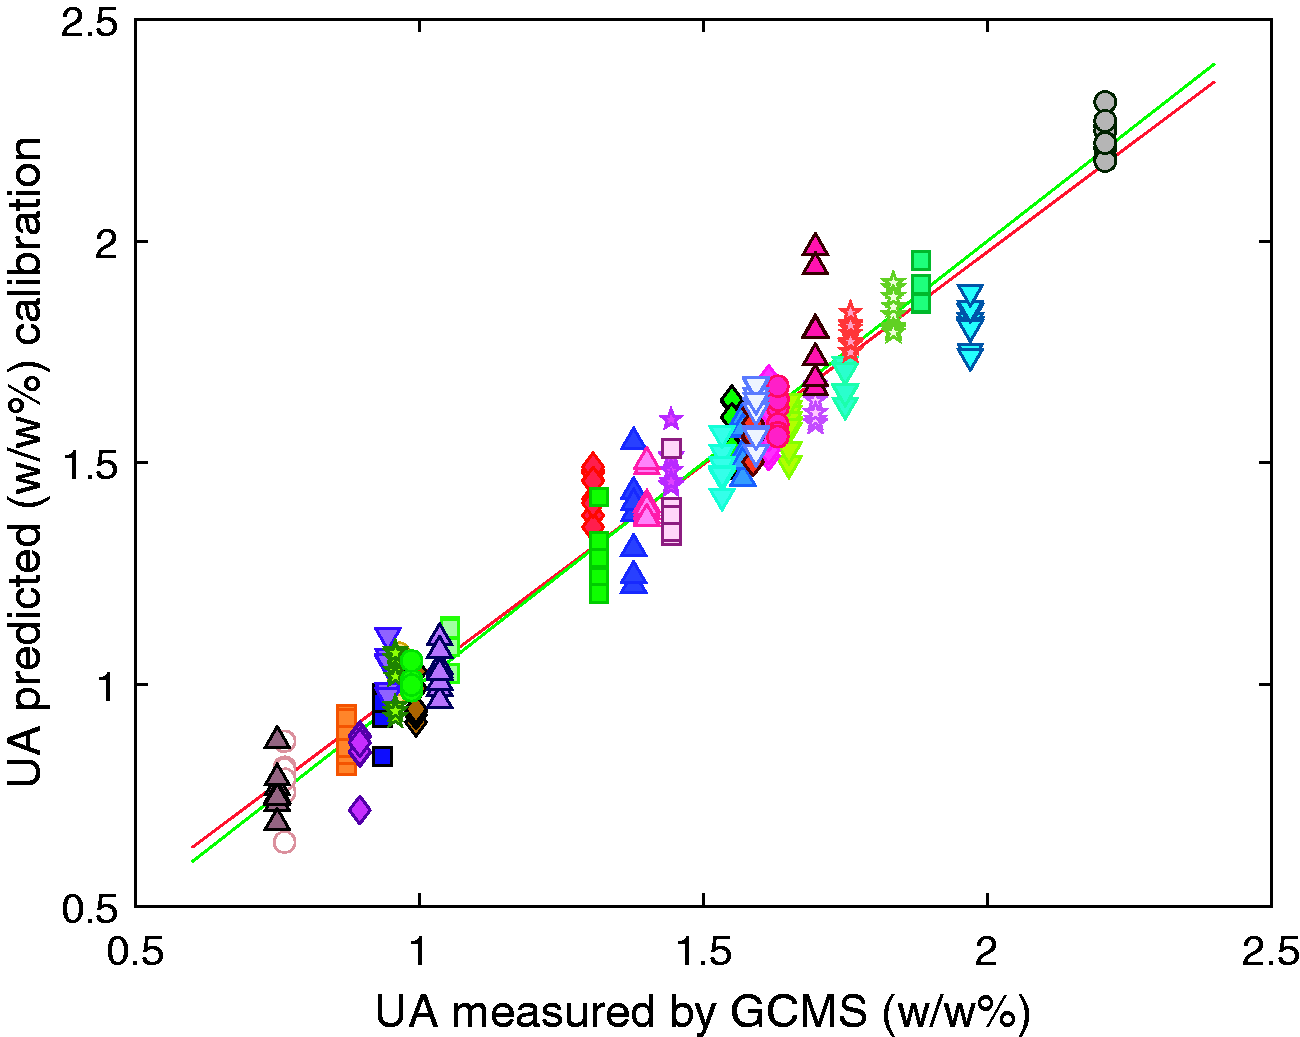
PLS calibration model for the prediction of unsulfated alcohol in sodium lauryl ether sulfate samples. Each symbol represents all repeat measurements and temperatures of a single sample.
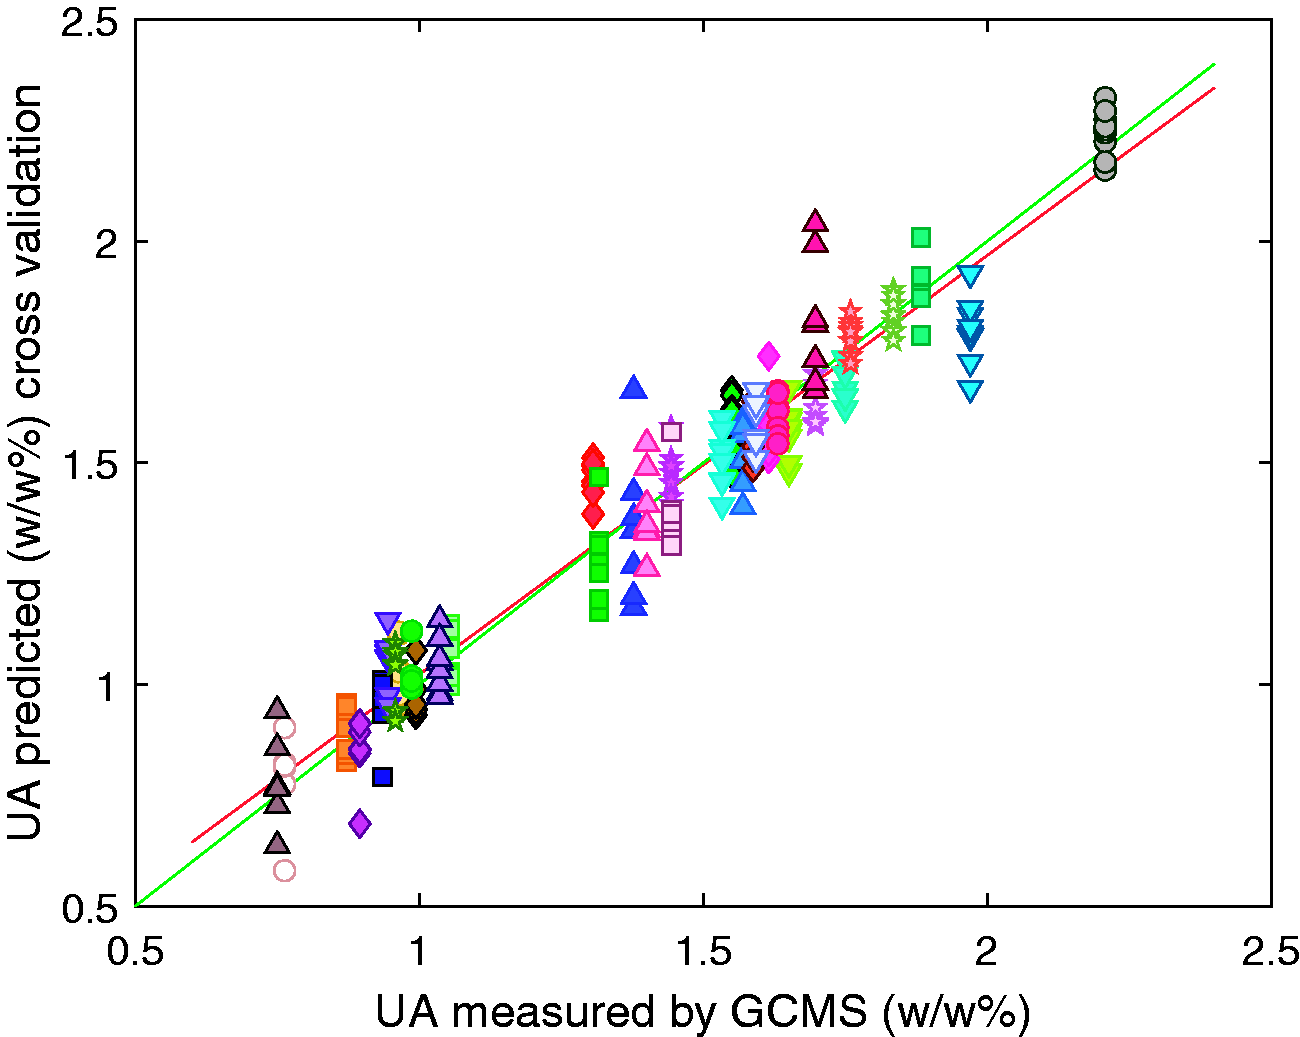
PLS cross validation model for the prediction of unsulfated alcohol in sodium lauryl ether sulfate samples. Each symbol represents all repeat measurements and temperatures of a single sample.
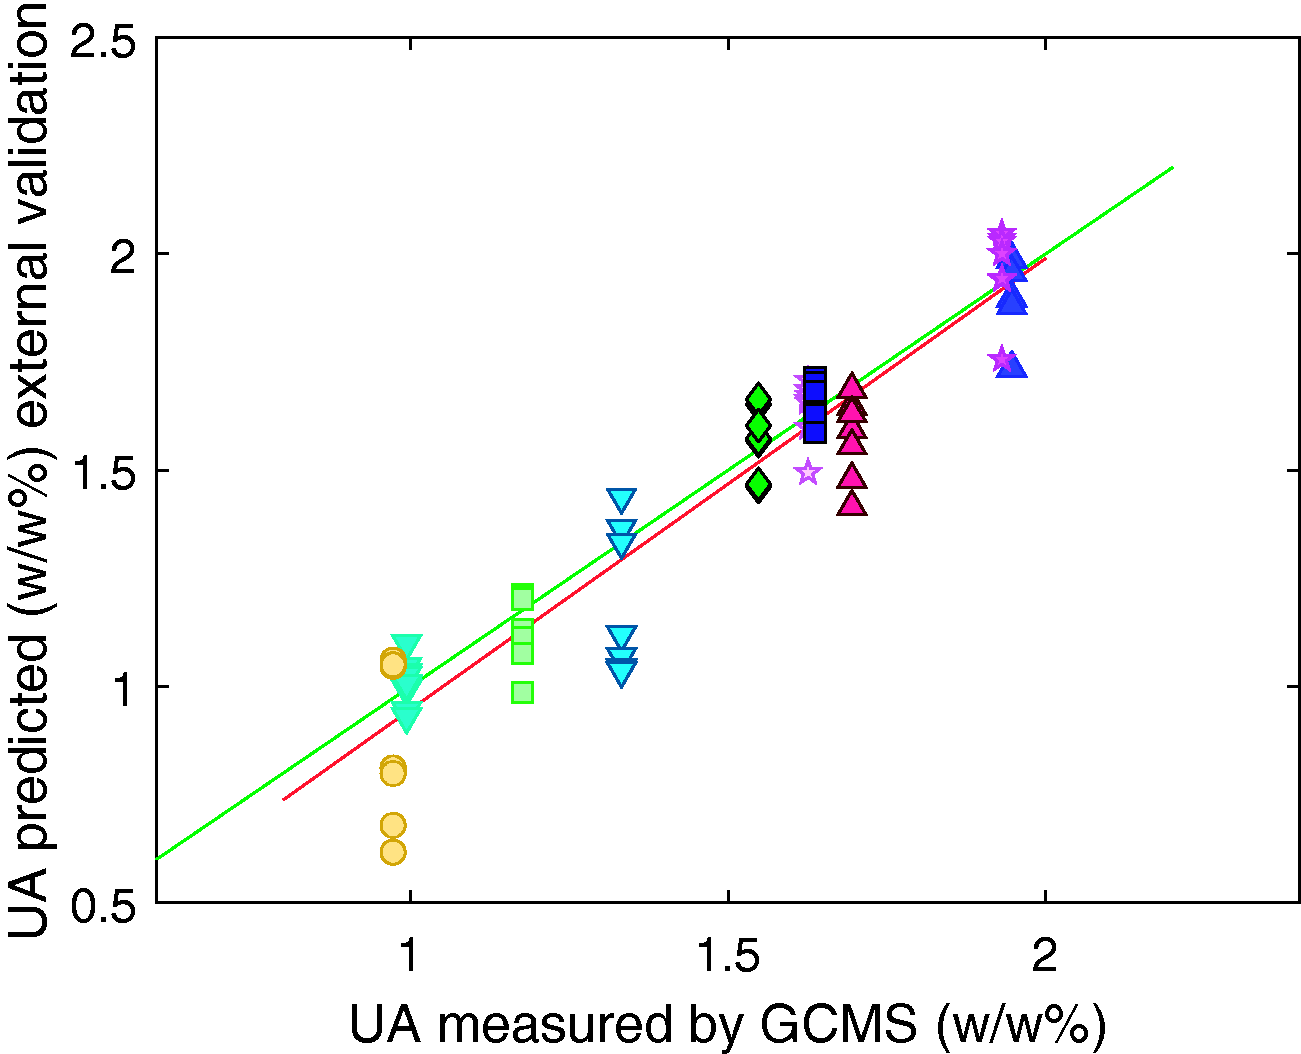
External validation set results for the prediction of unsulfated alcohol in sodium lauryl ether sulfate samples. Each symbol represents all repeat measurements and temperatures of a single sample.
The scores plots for the first and second latent variables of the calibration model are shown in Figures 8 to 10. The data for all 34 samples included in the calibration set, coloured by, supplier, UA, and, temperature respectively. For each sample repeat measurements at multiple temperatures are included. Figure 8 highlights clustering of samples from each of the different suppliers. Suppliers A and B are clearly differentiated across the first latent variable, and both clearly separated from supplier D across latent variable 2. Visually the samples from the different suppliers display no major differences. Figure 9 shows a correlation across both latent variables 1 and 2 that relates directly to unsulfated alcohol. It can be observed that although the unsulfated alcohol can vary significantly between individual samples of SLES, the range of unsulfated alcohol values observed between samples from a single supplier is much narrower. The differences in predictions observed between suppliers, where the unsulfated alcohol content of the individual samples is equal, is assumed to be due to other compositional differences within the samples such as by-products resulting from different synthesis routes being used and water. These results indicate that the greatest source of variation within the individual samples is due to the supplier and not the alcohol mass percentage.
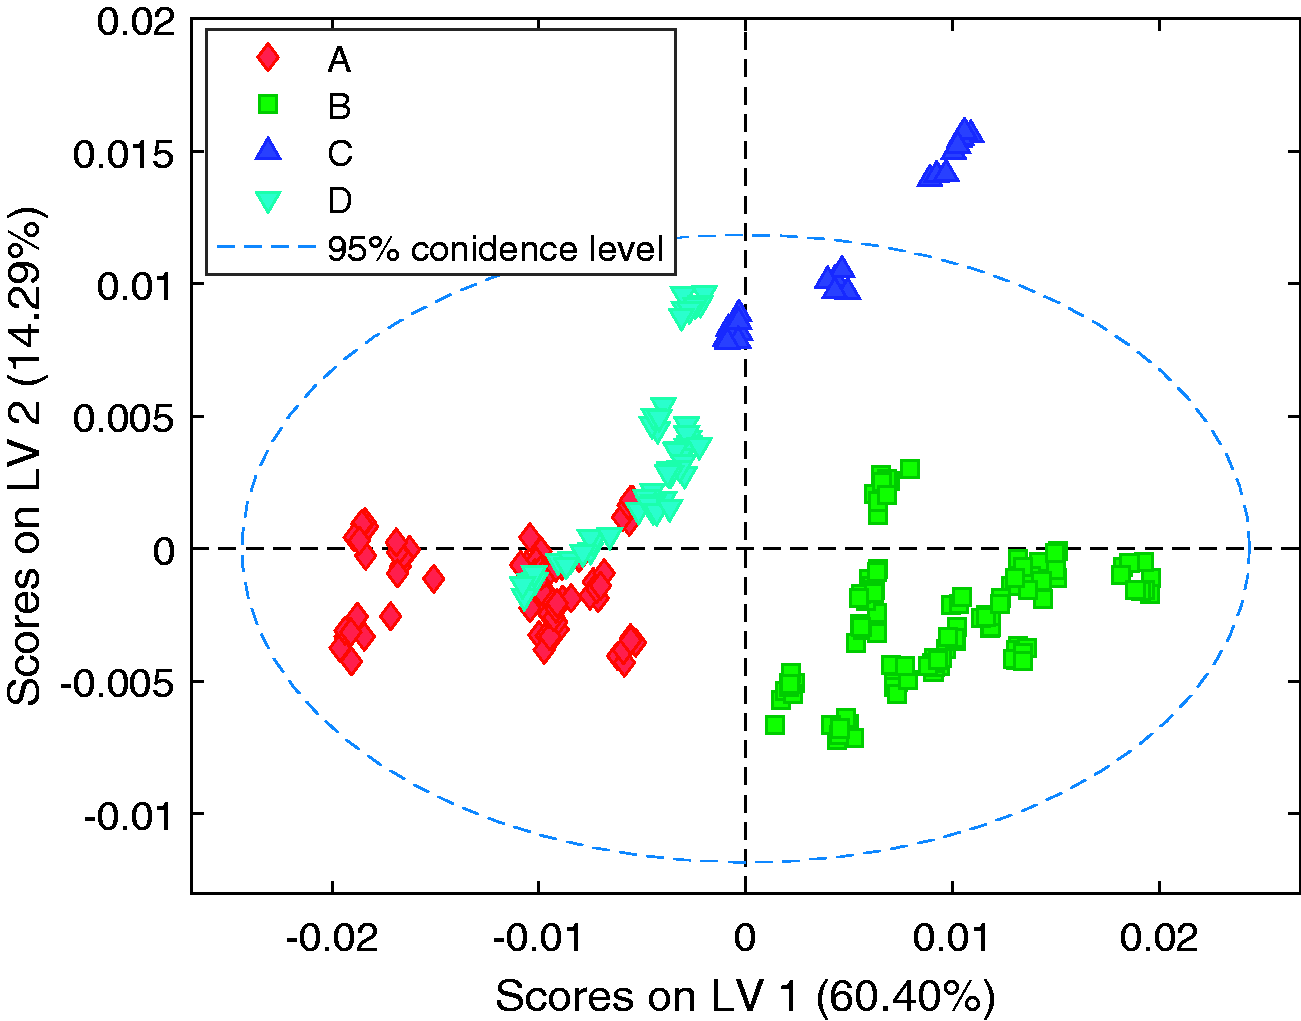
Scores plots for the first and second latent variables. Each symbol represents all spectra from a single supplier.
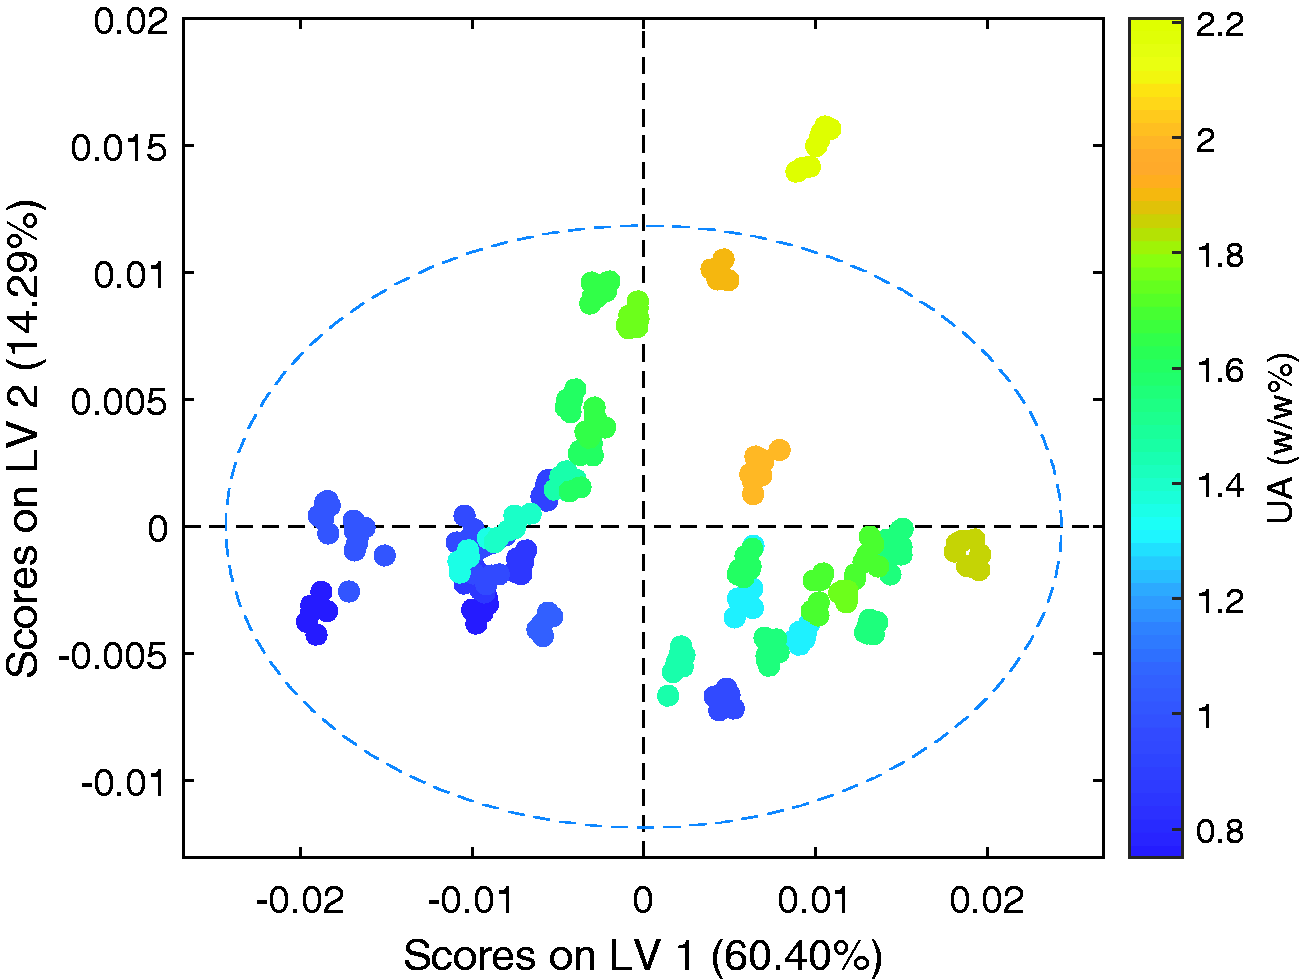
Scores plots for the first and second latent variables. Coloured by unsulfated alcohol mass percentage (w/w%).
Figure 10 displays the scores across latent variables 1 and 2 coloured by the temperature of the sample. Each sample within the model is included at a minimum of two temperatures, hence the lack of correlation in this graph supports the GLSW pre-processing approach as a suitable method of suppressing temperature induced spectral variations. Although not presented here, none of the 5 latent variables indicate a correlation with the sample temperature. For additional validation of temperature robustness, the unsulfated alcohol values of a sample were predicted whilst a stationary sample cooled down within the probe. The results of this are provided in Figure 11 and show no correlation with sample temperature. The differences in the predicted values observed is an artefact of the SLES samples now being truly homogenous.
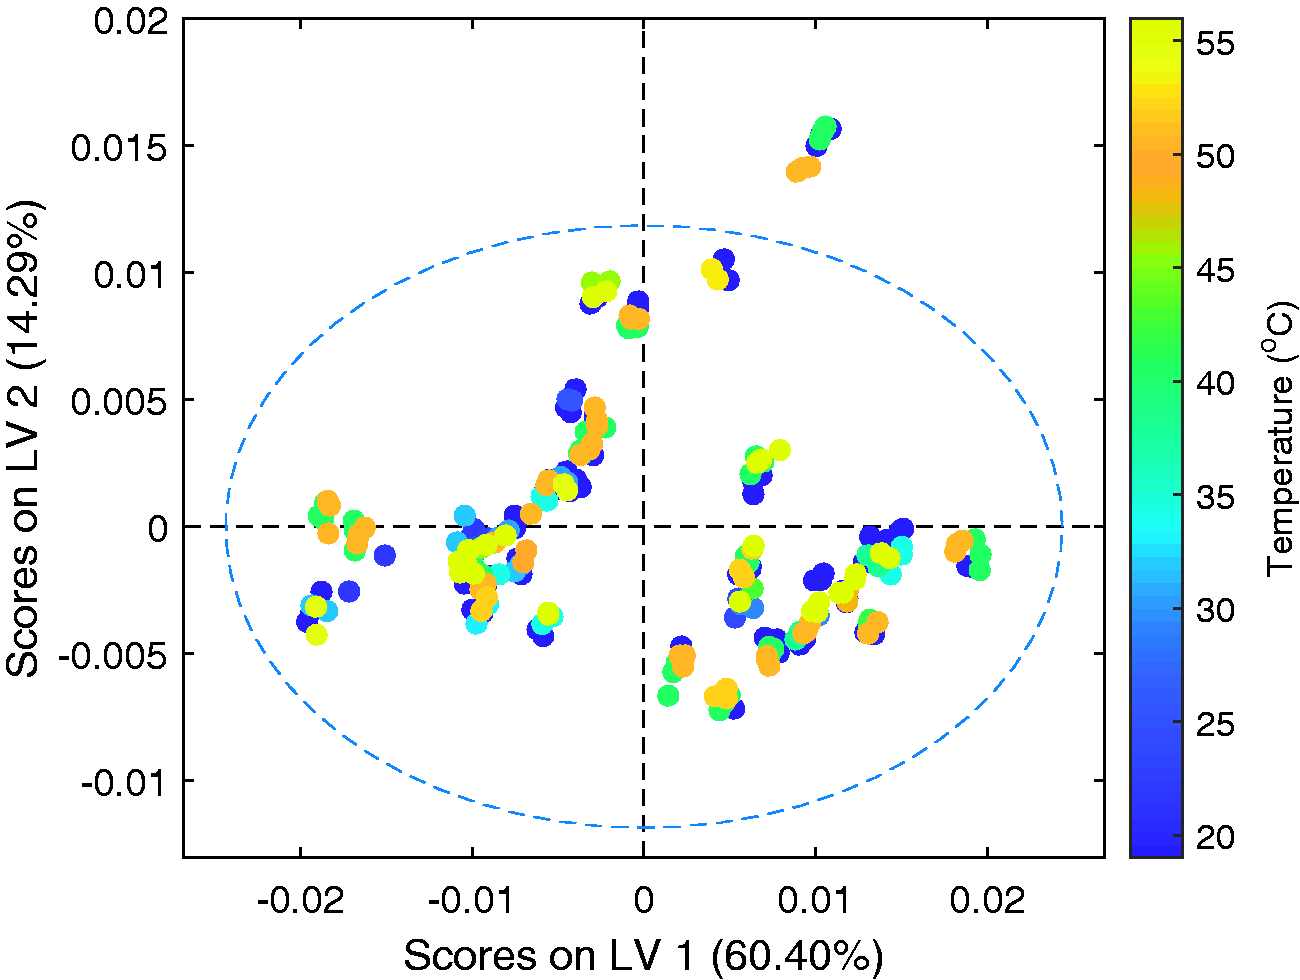
Scores plots for the first and second latent variables. Coloured by sample temperature (°C).
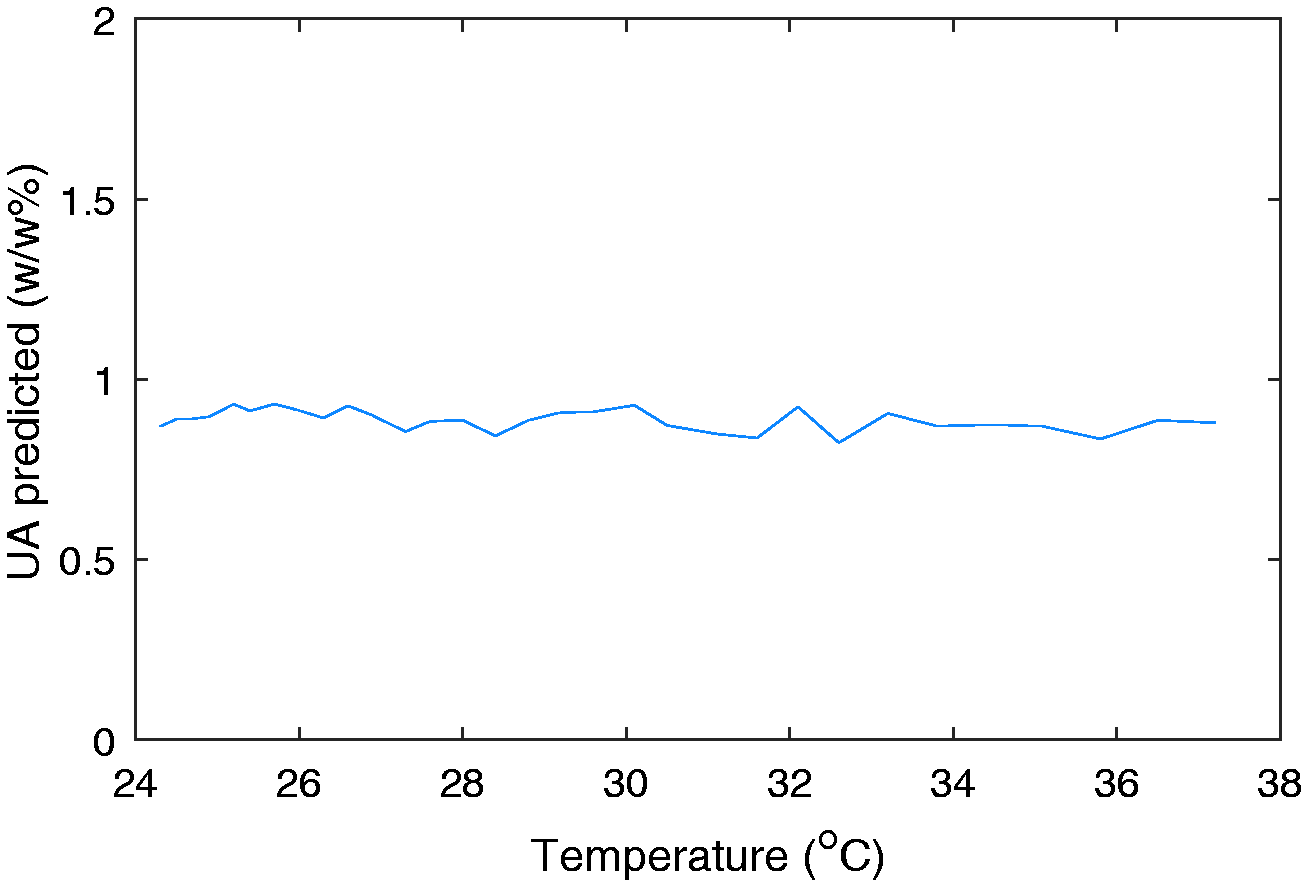
Temperature validation of the PLS model.
The RPD of the cross validation model was calculated to be 4.0 which would be considered good for screening purposes as suggested by Kim et al., 30 however below the recommended value of 5 for quality control. The RPD is indicative of likely suitability of a model for process control but is not definitive. This value could be improved by extending the range of unsulfated alcohol values within the model
Conclusions
In this study, NIR absorption spectroscopy was successfully used to quantify the unsulfated alcohol in commercial samples of sodium lauryl ether sulfate. PLS models were generated using a range of data pre-processing techniques. The effect of temperature on the samples was best suppressed by using a generalised least squares weighting data pre-processing approach to ensure the model was robust to fluctuating process conditions. The NIR model was validated using external validation data separate to the calibration data and could determine the UA quantity to give a root mean square error of prediction of 0.12 w/w%. This represents equivalent accuracy to the gas chromatography method, with the advantage of measurements taking only 16 s to obtain rather than 60 minutes, with zero sample preparation required. The sample measurement time could be further reduced, however, as a result the measurement would be an average of fewer scans, and hence an average of less of the sample, making the method vulnerable to small compositional variations.
For use in a processing environment, a RMSEP of 0.1 w/w% is desired. The model obtained currently falls slightly below the desired accuracy of the model; however it is believed this value could be improved by extending the range of the model and increasing the sample size in the calibration set. The intrinsic limit imposed on the NIR calibration model is the accuracy of the gas chromatography reference value, and the difficulty in obtaining a representative specific value for the unsulfated alcohol in a sample that is inherently non-homogeneous.
This work proves NIR methods can be used to replace or support current gas chromatographic measurements for the monitoring of surfactants. This is particularly helpful for the large-scale production of personal care products, where many batches of surfactant are continuously fed into the process. Further work on this study will be to implement the NIR method in a real manufacturing environment to track the changes in surfactant composition in real time and subsequently use the results as part of a feed forward control system in the production of personal care products.
Footnotes
Declaration of conflicting interests
The author(s) declared no potential conflicts of interest with respect to the research, authorship, and/or publication of this article.
Funding
The author(s) disclosed receipt of the following financial support for the research, authorship, and/or publication of this article: This work was supported by an Industrial Cooperative Award in Science and Technology (CASE) from the UK Engineering and Physical Science Research Council and Unilever.