
Abstract
Objective:
The aim of this study was to explore the effect of acupuncture stimulation at KI3 on brain glucose metabolism in spontaneously hypertensive rats (SHRs).
Methods:
Brain glucose metabolism in SHRs after acupuncture stimulation at KI3 was detected using 18F-2-fluorodeoxy-D-glucose positron emission tomography (18F-FDG-PET). SHRs were randomly divided into three groups: no treatment (SHR group); acupuncture at KI3 (KI3 group); and sham acupuncture (Sham group). Wistar Kyoto (WKY) rats were used as a normal blood pressure (BP) control group. Rats were subjected to 10 min of acupuncture once a day for 7 days. BP and positron emission tomography–computed tomography (PET-CT) were measured after the first acupuncture session and after 7 days of treatment.
Results:
The results showed that BP was lower in the KI3 group than in the SHR group, both 30–60 min after the first acupuncture session and 24–48 h after the 7-day treatment. Compared with the WKY group, the SHR group had lower glucose metabolism in the motor cortex, sensory cortex, basal ganglia, corpus callosum, caudate putamen, and visual cortex. Compared with the untreated/sham-treated SHR control groups, cerebral glucose metabolism was lower in the medulla oblongata, thalamus, dorsal thalamus, orbital cortex, and hypothalamus after acupuncture at KI3, while it was higher in the olfactory cortex and inferior phrenic muscle.
Conclusion:
Our results show that, in SHRs, needling at KI3 reduces high BP, most likely by altering the activation of cerebral regions.
Keywords
Introduction
Hypertension is a leading risk factor for cardiovascular diseases, such as stroke, coronary heart disease, and cognitive impairment, affecting 1 billion people worldwide. 1 Low responsiveness to drugs can limit the management options for hypertension, although there are various other treatment strategies available. 2
Thus, alternative strategies should be considered, one example of which is acupuncture, a complementary and alternative medicine that originated in China. Acupuncture has been used as an adjuvant therapy for hypertension and is popular with patients around the world. 3 There are many studies showing that acupuncture at traditional acupuncture points including KI3, LR3, ST36, and PC5 can be used to treat hypertension, both in patients and in animal models of hypertension, including spontaneously hypertensive rats (SHRs).4–7 Furthermore, several studies have reported on the molecular mechanisms of acupuncture in hypertension. For example, studies have found that substances in the brain, such as neurotransmitters, nitric oxide, angiotensin II (Ang II), gamma-aminobutyric acid, acetylcholine, serotonin, and opioids, are involved in the antihypertensive effects of acupuncture.8–13 Nevertheless, little is known about the neural mechanisms underlying the positive effects of acupuncture on hypertension.
Recently, the brain imaging technique of positron emission tomography–computed tomography (PET-CT), which shows high uptake of radioactively labeled 18F glucose in activated brain regions, has been applied to evaluate the effects of acupuncture on brain metabolism in a variety of diseases, including Alzheimer’s disease, stroke, functional dyspepsia, and migraine.14–17 However, no PET-CT studies have evaluated the cerebral responses to acupuncture treatment in hypertension.
In this study, we explored the time-dependent effects of acupuncture on SHRs by applying a non-invasive blood pressure (BP) measurement system. The purpose of this study was to examine the possible central mechanism of acupuncture treatment of hypertension using fluorodeoxyglucose-positron emission tomography (FDG-PET) to detect the glucose metabolism of various brain regions of SHRs after acupuncture at KI3.
Methods
Experimental animals
In total, 40 10-week-old SHRs and 10 Wistar Kyoto (WKY) rats weighing 200–250 g were housed at a temperature of 20°C–24°C with a relative humidity of 40–60% and a light/dark cycle of 12 h (lights on from 7:00 am to 7:00 pm) at the Experimental Animals Center, Guangzhou University of Traditional Chinese Medicine, Guangzhou, China. Rats were purchased from Beijing Vital River Laboratory Animal Technology Co. Ltd (Beijing, China) and were given free access to food and water. All animals were handled in accordance with the People’s Republic of China Ministry of Science and Technology Laboratory Animal Care guidelines and the experiment was approved by the Experimental Animal Ethics Committee of Guangzhou University of Chinese Medicine (ref. S2017003).
Grouping and acupuncture treatment
SHRs were randomly divided into three groups that received no treatment (SHR group, n = 10), acupuncture at KI3 (KI3 group, n = 10) or sham acupuncture (Sham group, n = 10). A fourth (WKY) group (n = 10) was used as a normal BP control group. The KI3 group received acupuncture at bilateral KI3, located in the depression between the posterior aspect of the medial malleolus and the tendon of the heel. A position between the third and fourth toes on the back of the foot was used as the sham acupuncture point, which was needled in rats of the Sham group. Stainless steel acupuncture needles (length 13 mm, diameter 0.25 mm; SUXIN; Suzhou Hualun Medical Devices Co., Ltd, China) were inserted at KI3 or the sham point, respectively, and rotated 120° ± 5° at a frequency of 90 ± 5 r/min. Each rat received acupuncture for 10 min (5 min on each side) and was treated once daily for 7 days. The same acupuncturist performed the acupuncture on all rats.
BP measurement
The rat’s BP was measured using a Kent Scientific CODA non-invasive BP measurement system. BP was measured 15 times per rat and the mean value was used. Before randomization to groups, 10 SHRs that did not meet the standard criteria for diagnosis of hypertension (systolic blood pressure (SBP) ⩾ 140 mmHg or diastolic blood pressure (DBP) ⩾ 90 mmHg) were excluded from the experiment. BP was mainly measured between 9:30 am and 2:30 pm. BP was measured before treatment, 30, 60, and 90 min after acupuncture, and 24, 48, and 72 h after the 7-day treatment period.
FDG-PET imaging
PET-CT scans were obtained at the animal molecular imaging platform of Sun Yat-sen Medical College. 18 Tail blood glucose was measured before PET-CT using the glucose oxidase method. After the acupuncture treatment, rats were intravenously injected with 18F-FDG (1.5 mCi/kg) and scanned on a Siemens Inveon PET system (Siemens, Germany). The FDG-PET images were acquired at full-radial spatial resolution with a 1.4 mm radius at the center of the field of view. Images were then reconstructed using a 128 × 128 × 159 matrix and a filtered back projection algorithm. All images were saved in Analyze 7.5 format.
After the evaluation of glucose metabolism, all rats were sacrificed by exsanguination following an intraperitoneal dose of 45 mg/kg sodium pentobarbital. Asystole was used as the standard for confirmation of death. All efforts were made to minimize the number of animals used and their suffering.
Statistical analysis
Data are expressed as mean ± standard deviation (SD) unless otherwise stated. One-way analysis of variance (ANOVA) was used to assess differences between groups. Paired t-tests were used to assess differences in the same group before and after treatment. Analysis was conducted in SPSS 17.0 (SPSS Inc., Chicago, IL, USA) and statistical significance was set at p < 0.05.
The PET-CT scan analysis was performed by the Key Laboratory of Nuclear Analysis Techniques, Institute of High Energy Physics, Chinese Academy of Sciences, using the SPM8 toolbox. Images were spatially normalized and smoothed for preprocessing. The differences in FDG signal between groups were compared using two-sample t-tests. Based on a voxel height threshold of p < 0.005 (familywise error (FWE) corrected) and a cluster-extent threshold of 5 voxels, brain regions showing significant inter-group differences in FDG uptake were identified.
Results
BP measurement
Prior to acupuncture, SBP and DBP in the SHR group were higher than in the WKY group (p < 0.05; Figure 1). Compared with the SHR and Sham groups, needling at KI3 reduced the SBP and DBP 30–60 min after acupuncture (p < 0.05; Figure 1(a) and (b)). The SBP and DBP values remained lower 24 and 48 h after the end of the 7-day treatment in the KI3 group relative to the SHR and Sham groups (p < 0.05; Figure 1(c) and (d)).
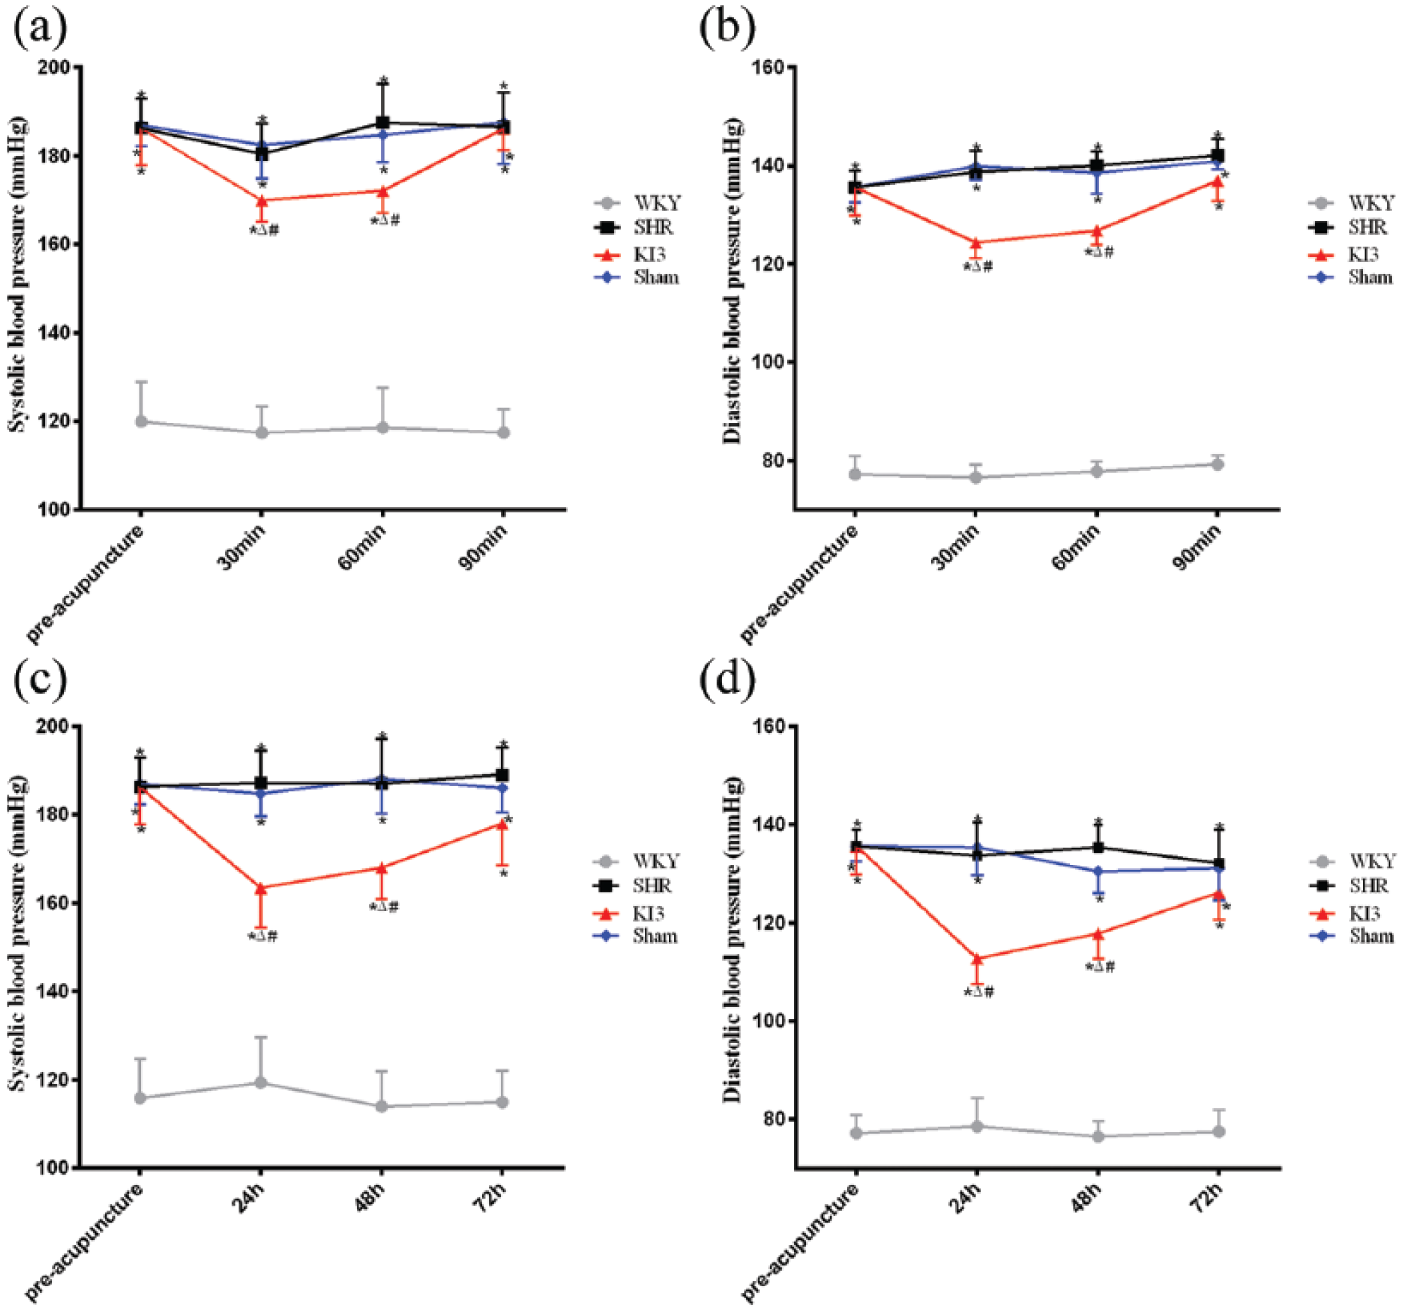
Effects of needling at KI3 in spontaneously hypertensive rats (SHRs). Between-group differences in (a, c) systolic blood pressure (SBP) and (b, d) diastolic blood pressure (DBP) were detected at 30, 60, and 90 min after initial acupuncture and at 24, 48, and 72 h after completion of the 7-day treatment period.
Regional glucose metabolism in the brain
Differences in brain glucose metabolism between groups are shown in Tables 1–3. The significant difference in the maximum t-values (Max_T) reflects the position of the maximum effect in the Paxinos and Watson spaces. The X-axis is negative to positive from left to right, the Y-axis is dorsal to ventral from low to high, and the Z-axis direction is negative to positive from the cerebellum to the olfactory bulb. The brain regions showing significant differences in glucose metabolism are displayed on anatomical sections (Figure 2), with warm bars representing increased glucose metabolism and cold bars representing decreased glucose metabolism.
Sites showing differential brain glucose metabolism in SHR versus WKY groups 60 min after initial acupuncture and 24 h after completion of the 7-day treatment period.
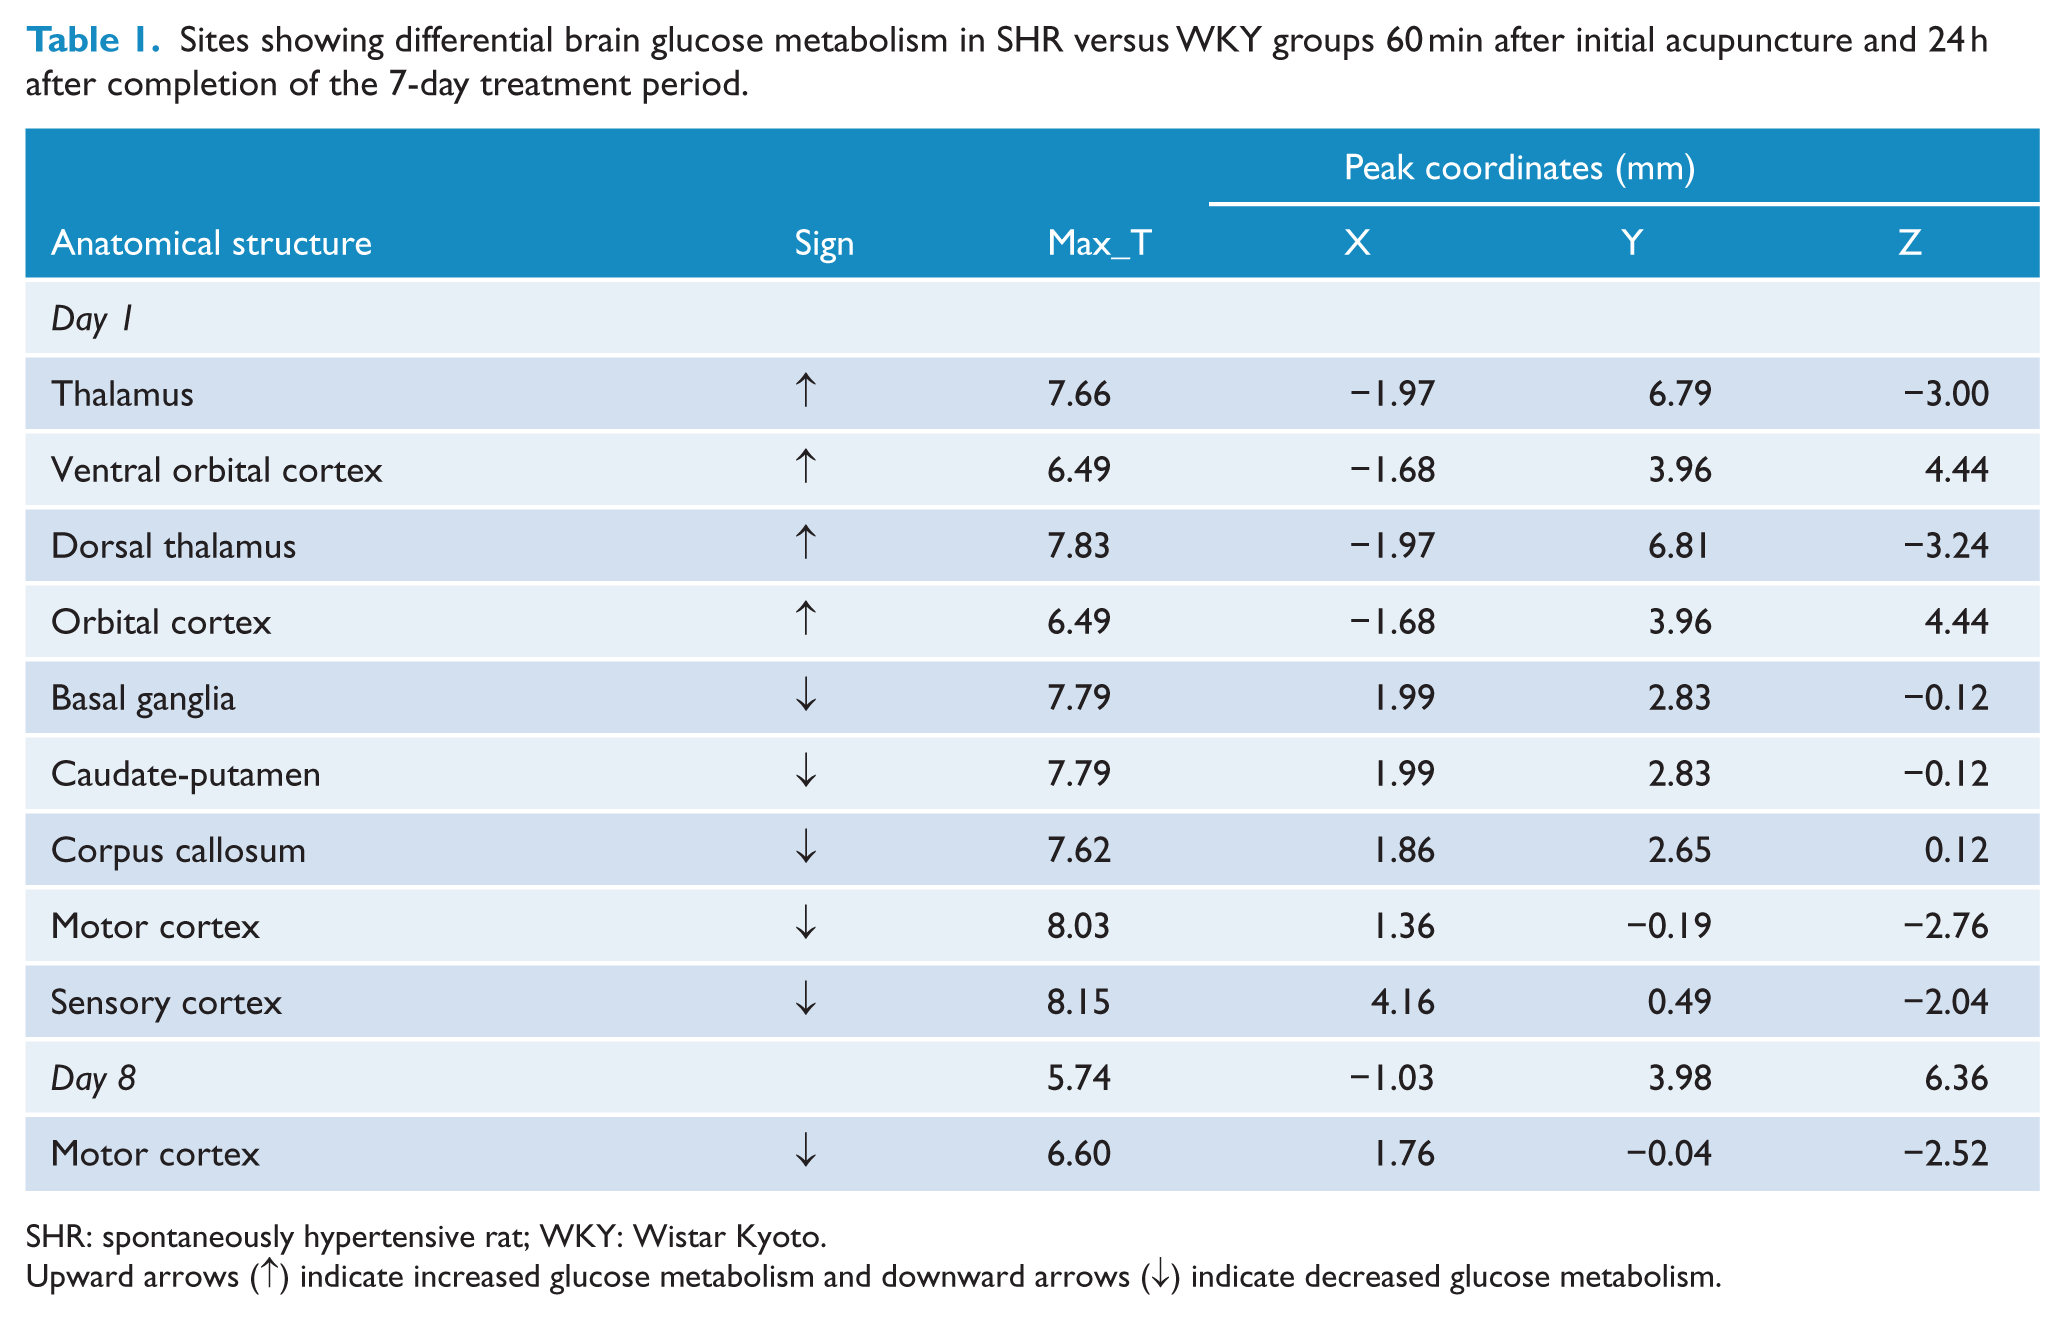
SHR: spontaneously hypertensive rat; WKY: Wistar Kyoto.
Upward arrows (↑) indicate increased glucose metabolism and downward arrows (↓) indicate decreased glucose metabolism.
Sites showing differential brain glucose metabolism in KI3 versus SHR groups 60 min after initial acupuncture and 24 h after completion of the 7-day treatment period.
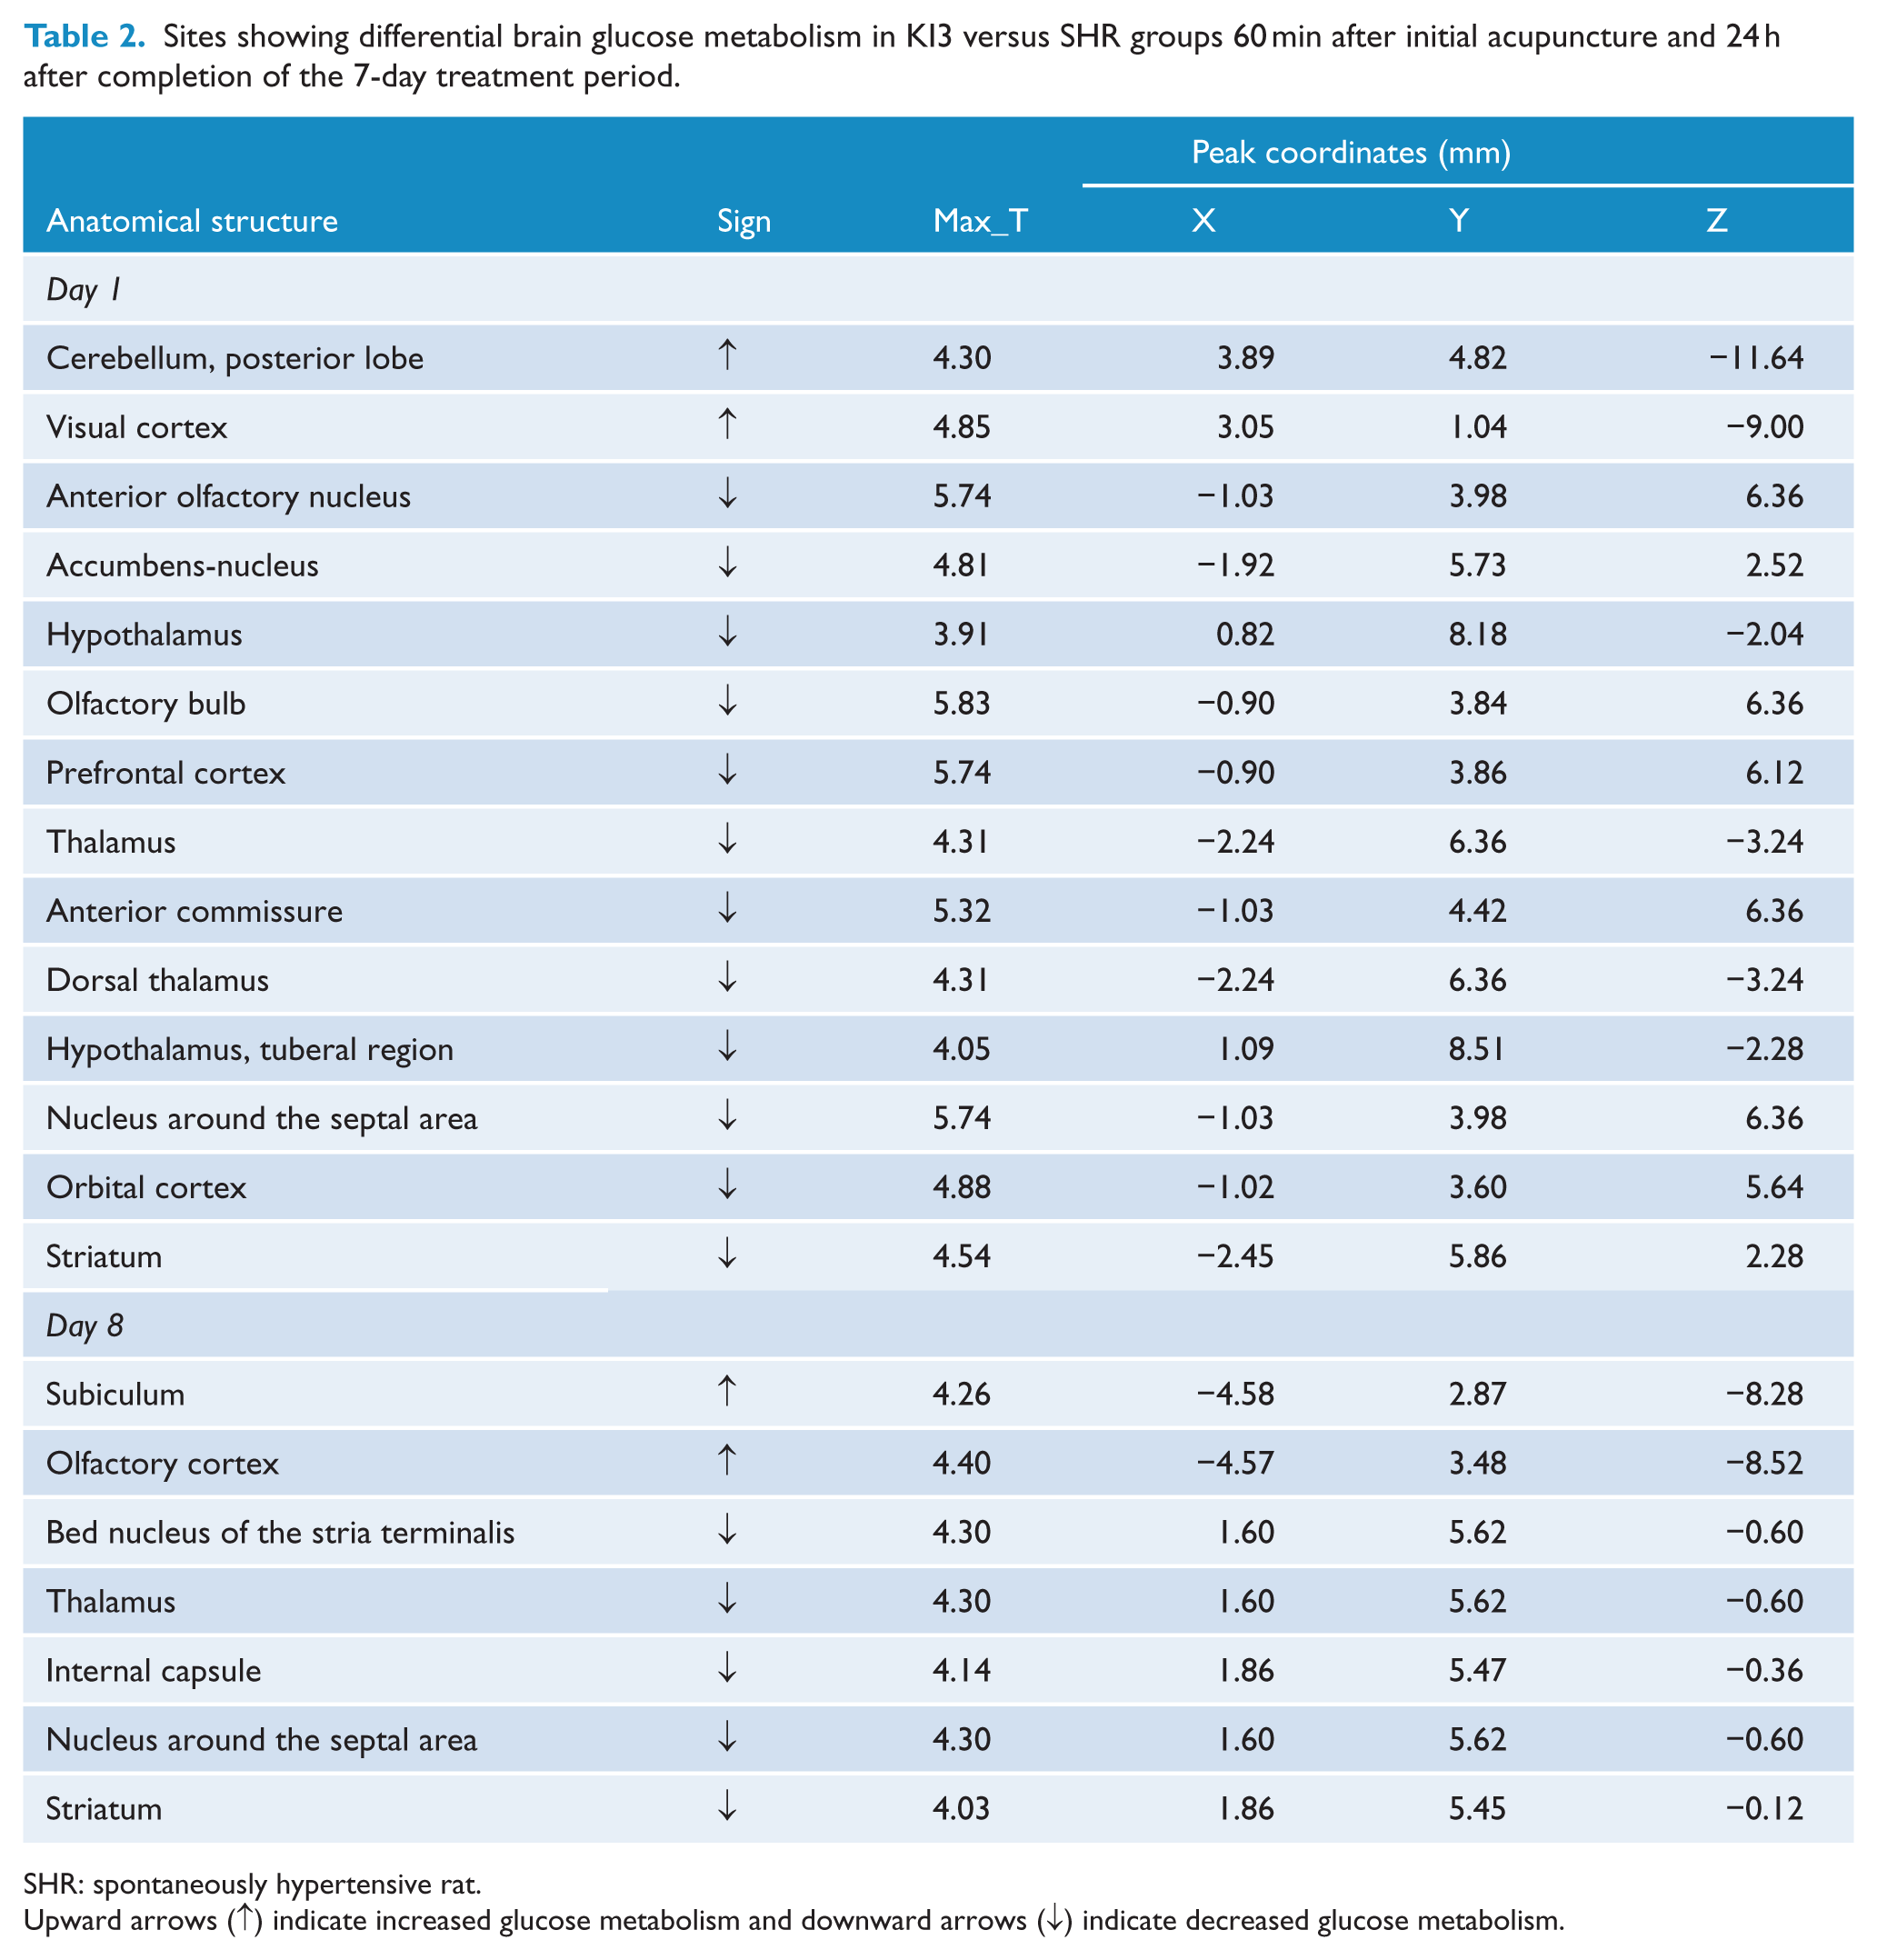
SHR: spontaneously hypertensive rat.
Upward arrows (↑) indicate increased glucose metabolism and downward arrows (↓) indicate decreased glucose metabolism.
Sites showing differential brain glucose metabolism in Sham versus SHR groups 60 min after initial acupuncture and 24 h after completion of the 7-day treatment period.
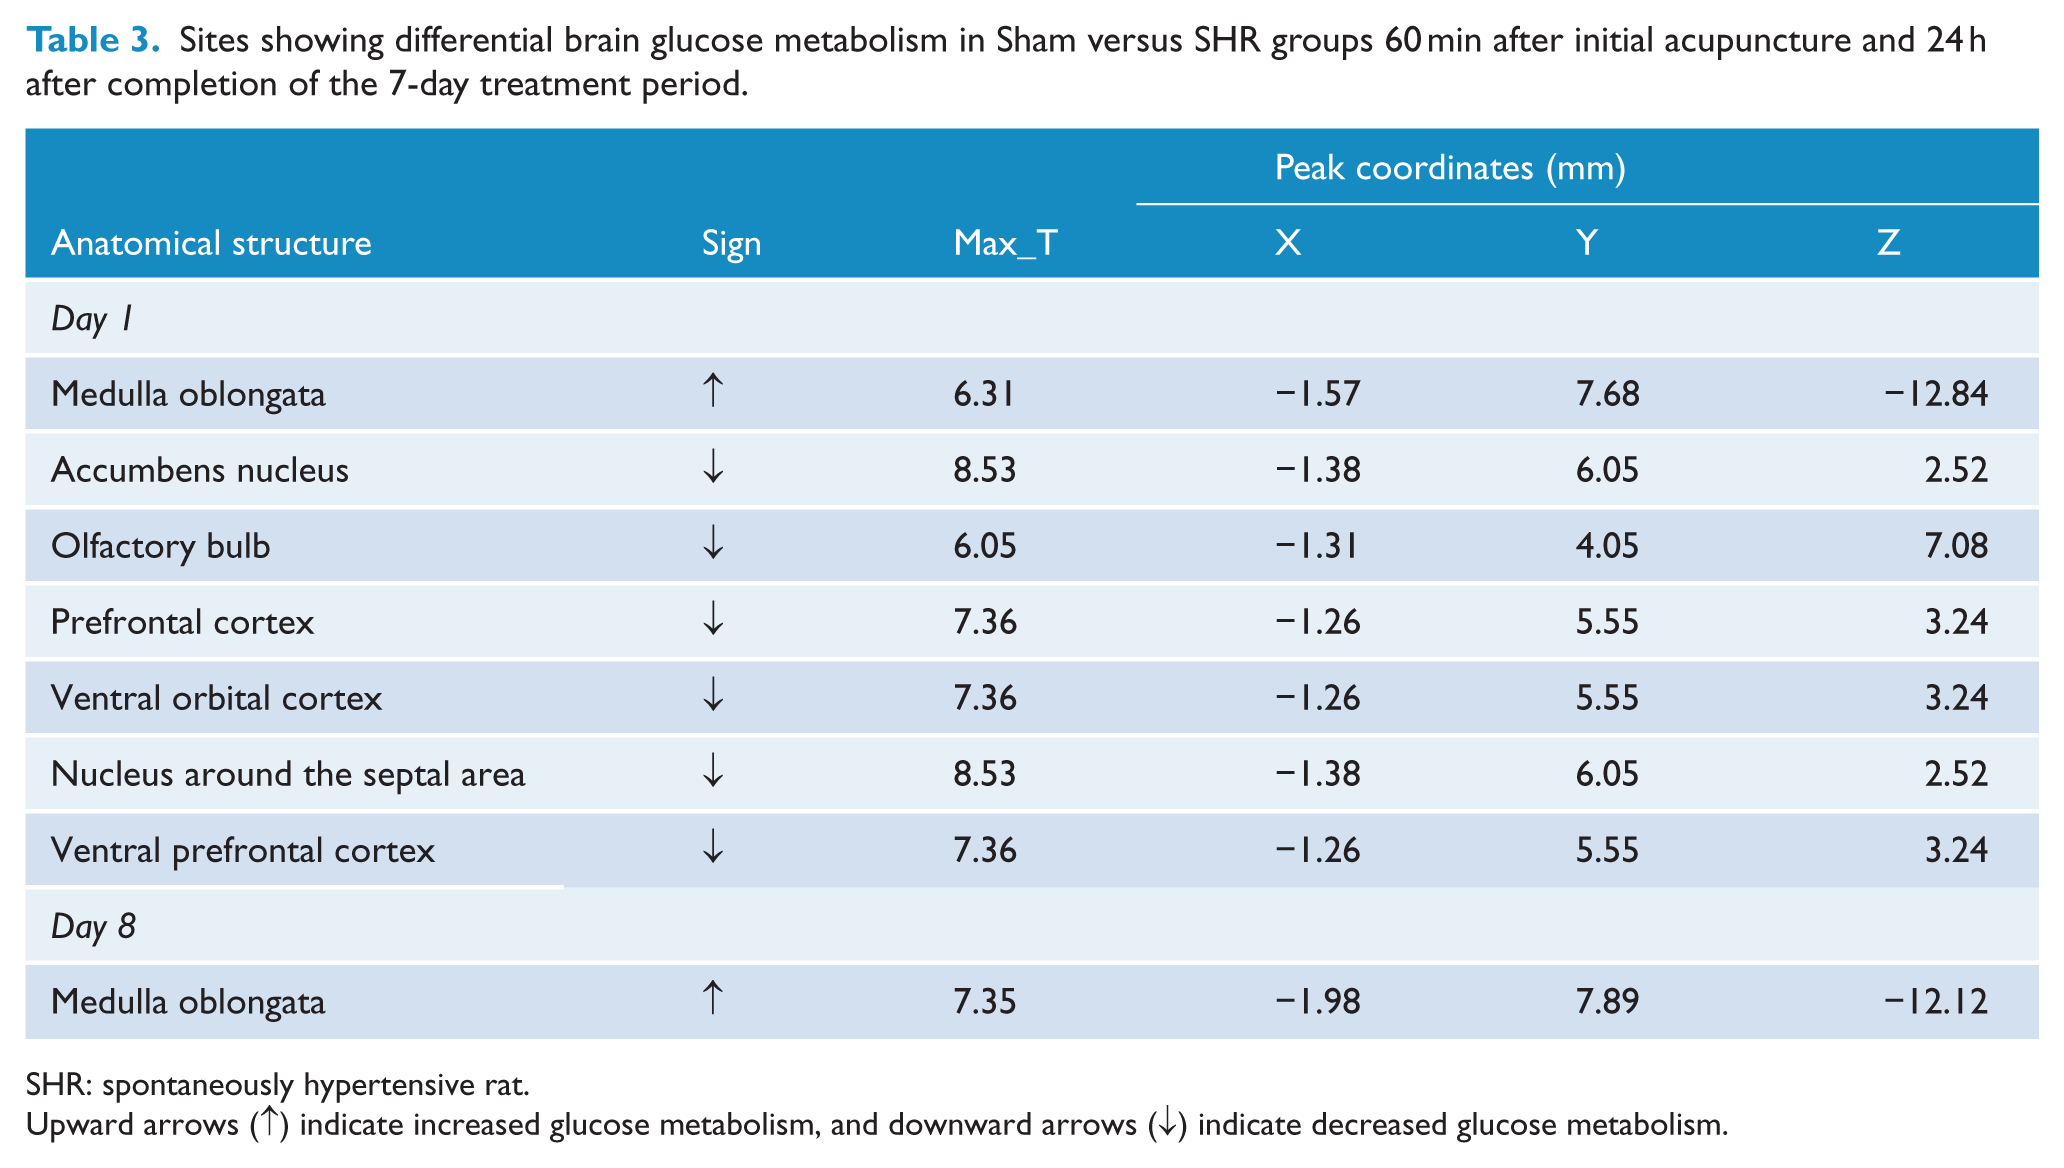
SHR: spontaneously hypertensive rat.
Upward arrows (↑) indicate increased glucose metabolism, and downward arrows (↓) indicate decreased glucose metabolism.
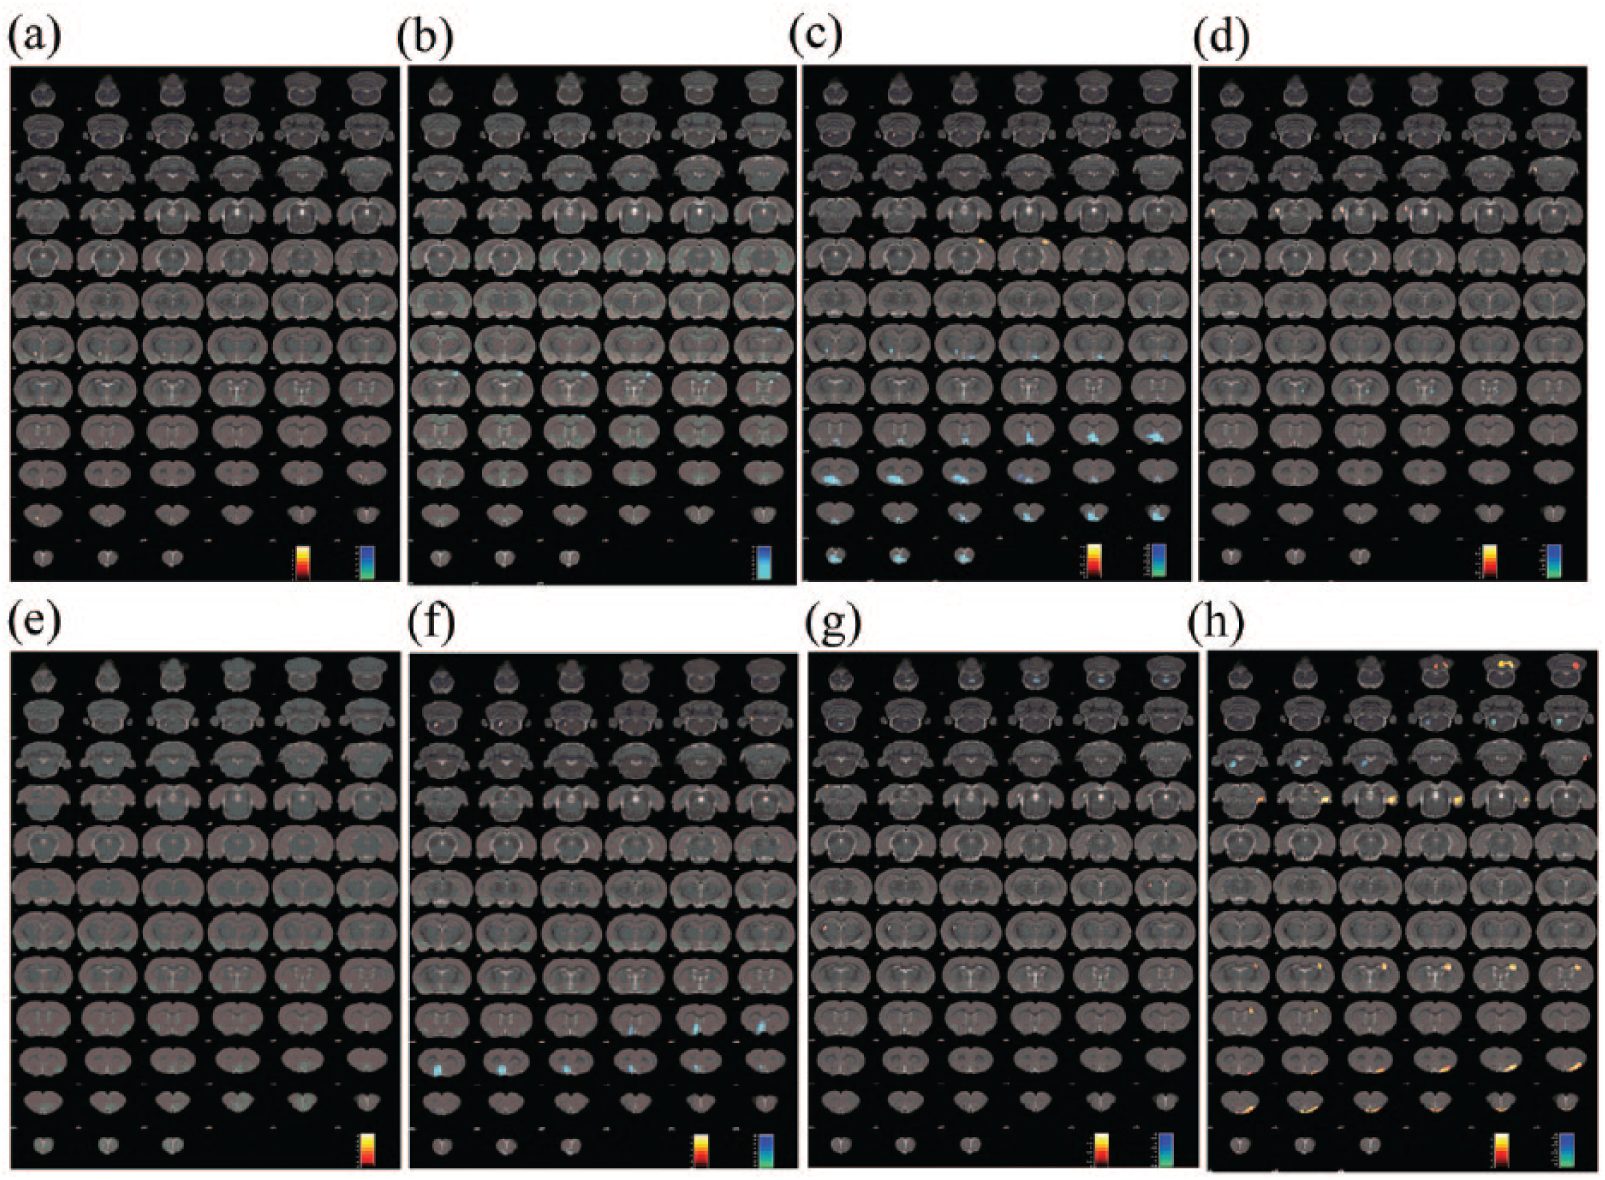
Regional glucose metabolism in the rat brain. Regional glucose metabolism was scanned 60 min after initial acupuncture (a, c, e, and g) or 24 h after completion of the 7-day treatment period (b, d, f, and h). The results are overlaid on a coronal view of the rat brain and mapped to the Paxinos and Watson rat brain atlas. (a and b, corresponding to Table 1) SHR group versus WKY group, (c and d, corresponding to Table 2) KI3 group versus SHR group, (e and f, corresponding to Table 3) Sham group versus SHR group, and (g and h, corresponding to Table 4) KI3 group versus Sham group. Color bars represent the t-value of each significant voxel.
Glucose metabolism in the thalamus, dorsal thalamus, and orbital cortex was higher in the SHR group than in the WKY group on day 1, while it was lower in the SHR group than in the WKY group in the motor cortex, sensory cortex, basal ganglia, corpus callosum, caudate putamen, and visual cortex on days 1 and 8 (Table 1 and Figure 2(a) and (b)).
Glucose metabolism in the posterior lobe of the cerebellum, visual cortex, olfactory cortex, and subiculum was higher in the KI3 group than in the SHR group on days 1 and 8, while it was lower in the thalamus, dorsal thalamus, prefrontal cortex, orbital cortex, striatum, and hypothalamus on days 1 and 8 (Table 2 and Figure 2(c) and (d)).
Glucose metabolism in the medulla oblongata was higher in the Sham group than in the SHR group on days 1 and 8, while it was lower in the olfactory bulb, prefrontal cortex, ventral prefrontal cortex, ventral orbital cortex, and nucleus around the septal area on day 1 (Table 3 and Figure 2(e) and (f)).
Glucose metabolism in the subiculum, hippocampus, fimbria of the hippocampus, and olfactory cortex was higher in the KI3 group than in the Sham group on days 1 and 8, but lower in the medulla oblongata and thalamus on days 1 and 8 (Table 4 and Figure 2(g) and (h)).
Sites showing differential brain glucose metabolism in KI3 versus Sham groups 60 min after initial acupuncture and 24 h after completion of the 7-day treatment period.
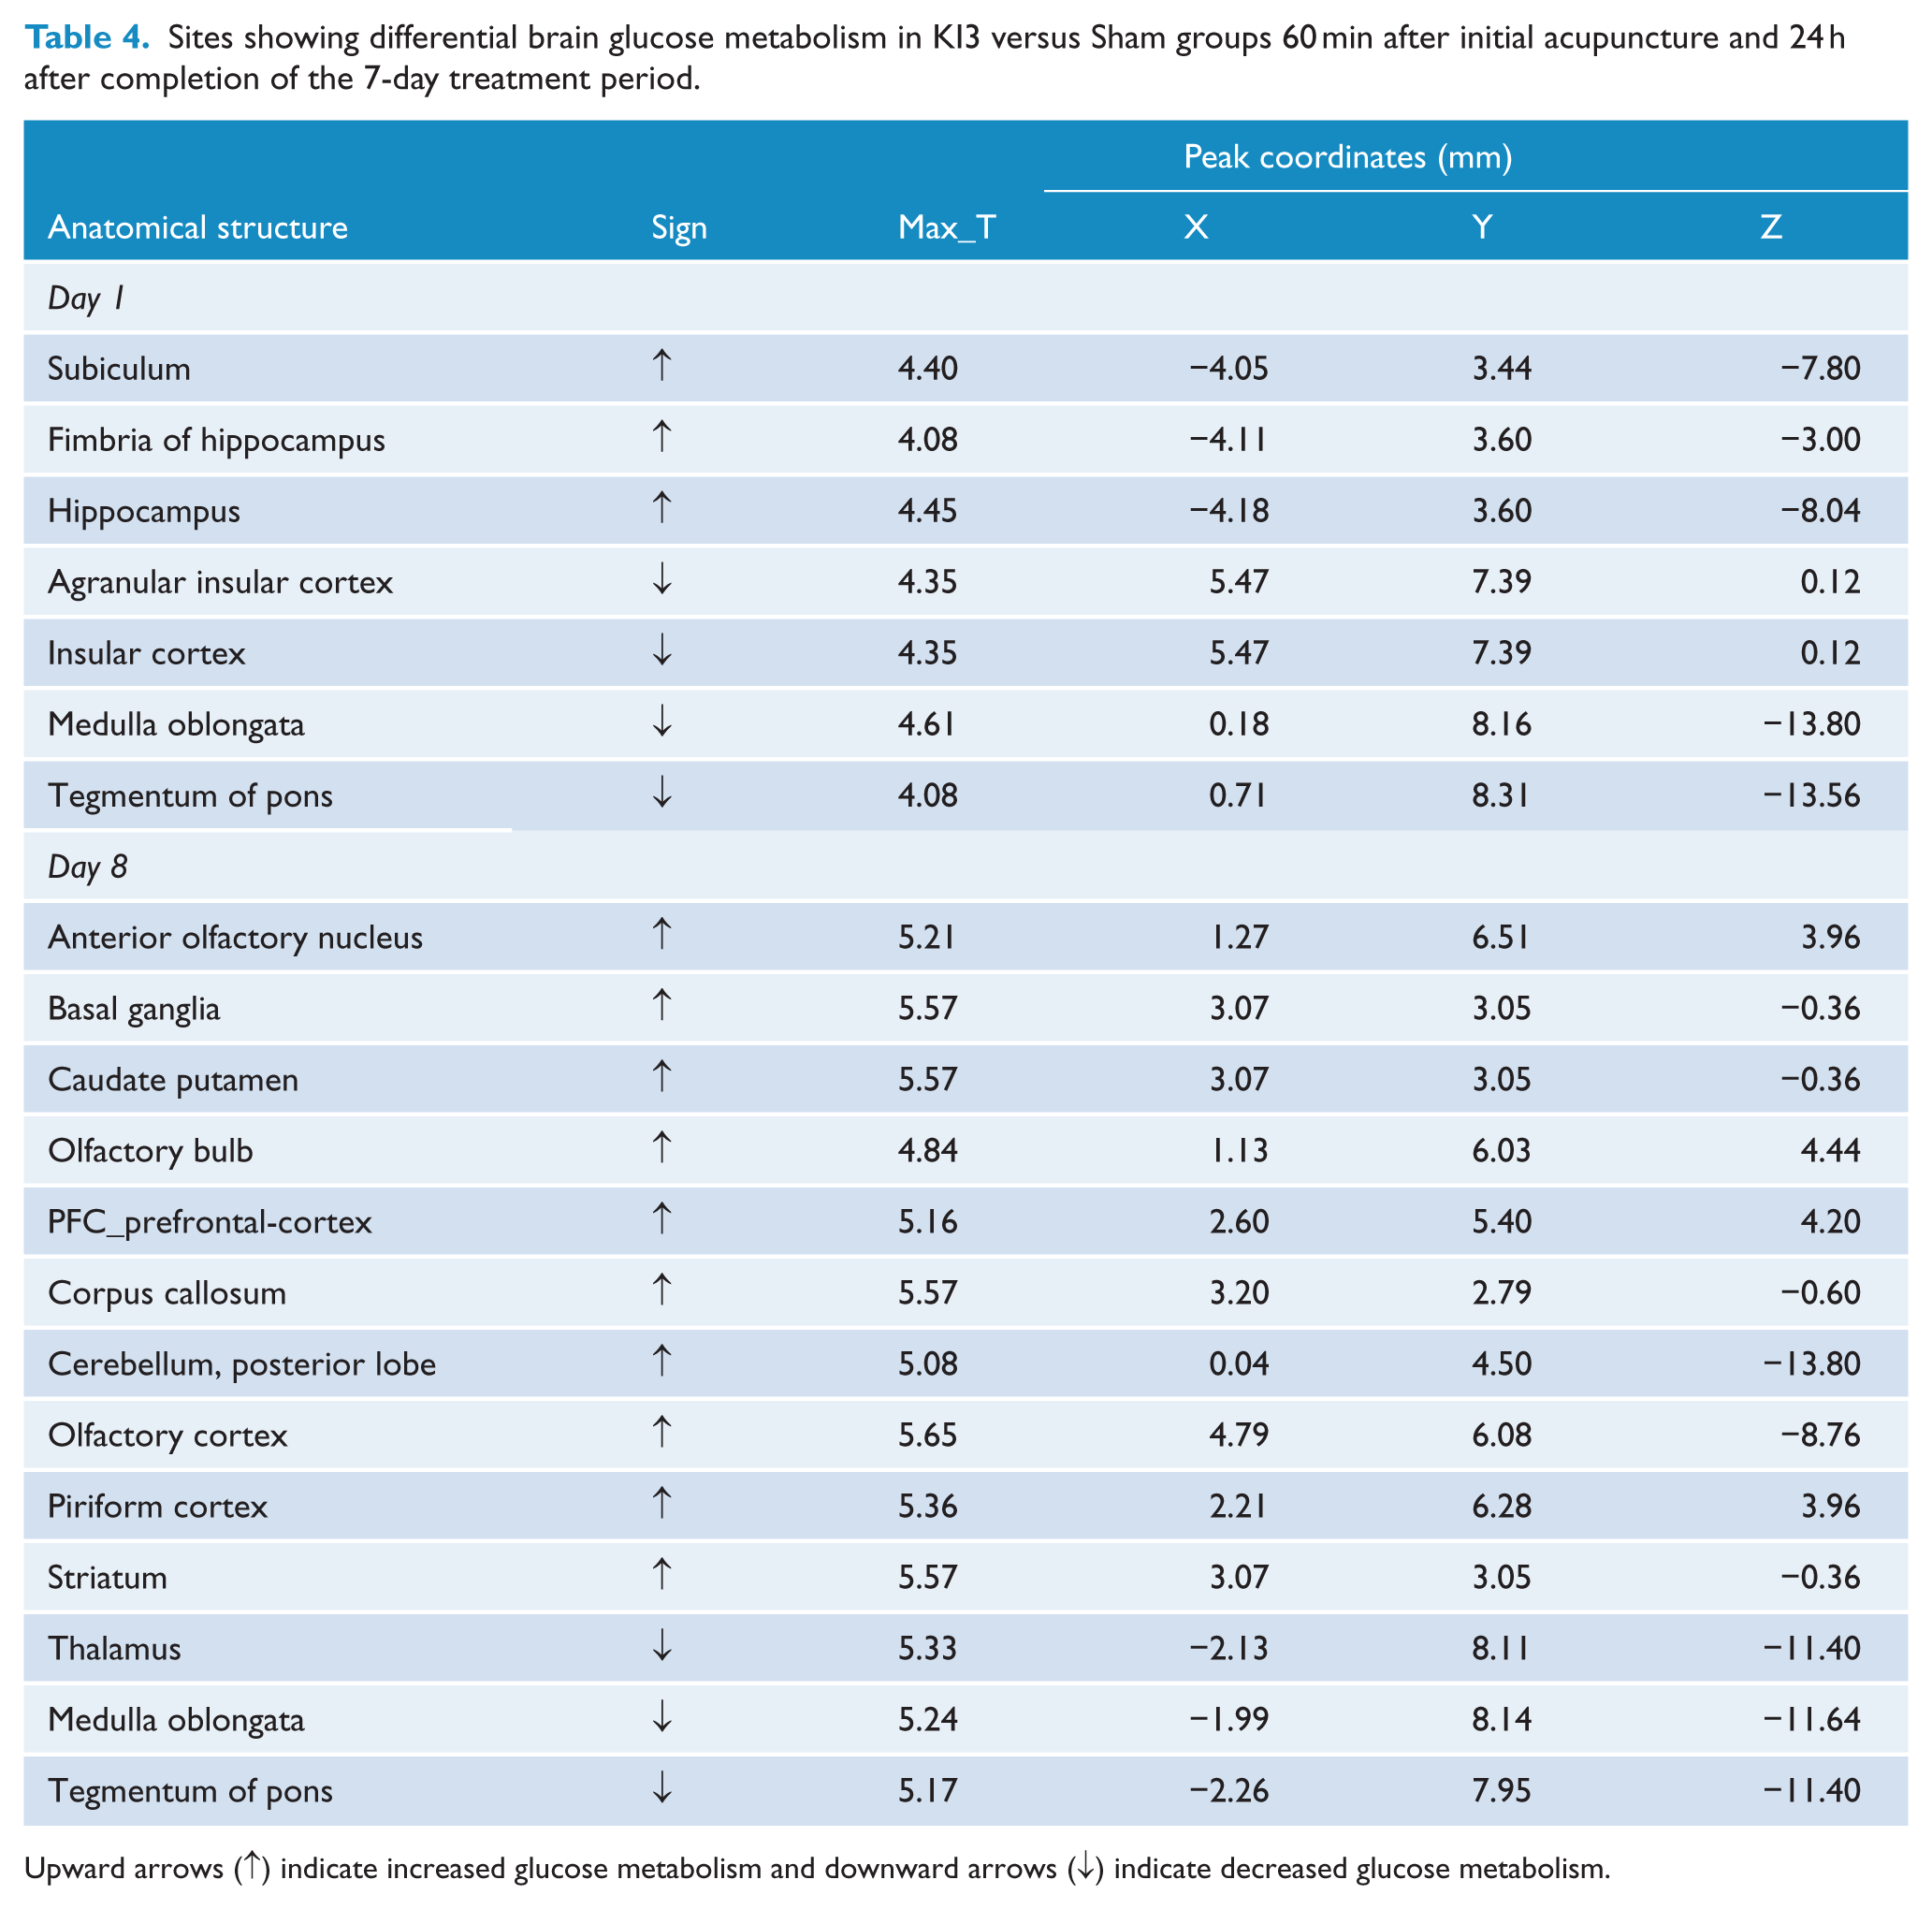
Upward arrows (↑) indicate increased glucose metabolism and downward arrows (↓) indicate decreased glucose metabolism.
Discussion
Our results showed that the antihypertensive effect of acupuncture given for 7 consecutive days was superior to that of a one-time acupuncture treatment, especially with respect to the duration of BP reduction. Clinical acupuncture treatments often involve repetitive stimulation, and studies have shown that the long-term cardiovascular effect produced by serial acupuncture treatments far exceeds the effect of a one-time needling session. 18 Several possible mechanisms have been put forward to explain the long-term effects of acupuncture, mainly involving the reciprocal enhancement circuit of brain regions and the delayed release of neurotransmitters. 18 Needling at ST36–ST37 in cold hypertensive rats increased the mRNA expression of preproenkephalin in the rostral ventrolateral medulla (rVLM) for 48 h, indicating that the δ-opioid system in the rVLM may partially mediate the long-term antihypertensive effect of electroacupuncture (EA). 19 Researchers found that needling may induce distinct reorganization of the effective connectivities of brain networks and that needling at KI3 in mild cognitive impairment induced the strongest and most extensive effects. 20 We speculate that one or more of these mechanisms may be related to the sustained antihypertensive effects of acupuncture at KI3.
In this study, we used PET-CT to detect the effect of acupuncture on glucose metabolism in different brain regions, in order to make deductions regarding the central mechanism of BP regulation that may be associated with it. Compared with the WKY group, glucose metabolism in the hypothalamus, thalamus, and dorsal thalamus was higher in the SHRs. The metabolism in these brain regions decreased after needling at KI3, while there was no change in these regions in the Sham group. It is well known that the hypothalamus plays an essential role in the regulation of BP; the hypothalamus is the most advanced integration center below the cerebral cortex, regulating the activity of the autonomic nervous system. Nerve impulses both into and out of the hypothalamus can pass through the thalamus, and the two regions are functionally closely related. A growing number of studies have found that hypertension is related to high levels of oxidative stress in the hypothalamus. Oxidative stress is mainly manifested by an increase in the formation of reactive oxygen species (ROS), and such an abnormal increase in ROS precedes the formation of hypertension in SHRs, suggesting that ROS are active in the occurrence and maintenance of hypertension. 21 Gene expression levels under oxidative stress were shown to be uniquely regulated by EA pretreatment in myocardial ischaemia-reperfusion injury. 22 In our previous study, acupuncture reduced BP and modulated the expression of seven proteins involved in oxidative stress in the brain of SHRs, including ALDH2, SOD, protein DJ-1, GSTM5, GLUD1, HSP90a, and a-ETF. 23 Therefore, we hypothesize that one of the possible central mechanisms by which acupuncture at KI3 can lower BP is inhibition of oxidative stress in the hypothalamus.
The effects of acupuncture may be mediated by multiple mechanisms. 23 Central modulation of BP also involves the renin–angiotensin system (RAS). Components of the RAS, such as renin, angiotensinogen, angiotensin-converting enzyme (ACE), angiotensin, angiotensin II, and angiotensin II receptor subtypes, are also found in the brain, and there is compelling evidence suggesting that RAS can contribute to hypertension by modulating cardiovascular effects through the central nervous system. 24 Studies have shown that angiotensinogen in the brain is produced mainly by cells in the thalamus, hypothalamus and brainstem, and cortical neurons, converting Ang I into Ang II and promoting Ang II secretion. 25 As Ang II increases, sympathetic neuron activity in the paraventricular nucleus (PVN) increases and BP rises. 26 Acupuncture reduces BP through decreasing plasma renin and angiotensin II activity. 27 In addition, researchers have found that hypertension is closely related to inflammation of the central nervous system. Ang II and prorenin increase the level of proinflammatory cytokines in the hypothalamus (tumor necrosis factor (TNF)-α, interleukin (IL)-6, and IL-1β), while decreasing the level of anti-inflammatory cytokines. Subsequent activation of nuclear factor (NF)-κB signaling augments the proinflammatory response and increases the permeability of the blood–brain barrier in Ang II-induced hypertension, which results in further inflammation and sympathetic nervous system activity, further increasing BP. Furthermore, NF-κB inhibition within the bilateral PVN attenuates an Ang II-induced hypertensive response by reducing proinflammatory cytokines. 24 Studies have shown that acupuncture can inhibit NF-κB signaling pathways in multiple brain regions,28,29 and therefore we speculate that the central antihypertensive mechanism of acupuncture at KI3 may be related to the following two points: (1) acupuncture inhibits the RAS and lowers BP by inhibiting components such as angiotensinogen produced by astrocytes in the thalamus and hypothalamus; and (2) acupuncture reduces the discharge of sympathetic neurons by inhibiting NF-κB and reducing proinflammatory cytokines in the hypothalamus, thereby attenuating an Ang II-induced hypertensive response.
It is worth noting that our study used the Sham group as a control to demonstrate the efficacy of targeted acupuncture for the treatment of hypertension. This showed that KI3 acupuncture produced stronger antihypertensive effects than sham acupuncture at an anatomically close location. Our PET-CT results showed that, in comparison with KI3 acupuncture, sham acupuncture did not effectively reduce glucose metabolism in the hypothalamus, thalamus and dorsal thalamus, but instead irregularly affected the olfactory bulb and several cortical regions. Other researchers have found that, when traditional acupuncture points are used, the patterns of changes in glucose metabolism are consistent and targeted, whereas they are disordered and irregular when sites not corresponding to traditional acupuncture points are stimulated. 17 Functional magnetic resonance imaging (fMRI) studies have shown that the stimulation of traditional acupuncture points activated more relevant brain regions and induced broader neuronal activity than sham stimulation, both in patients and in the general population.30,31 These apparent differences in function may be explained by structural variations with respect to the sites of traditional acupuncture points. 32 Researchers have found that the nerve endings, nerve receptors, capillary vessels, lymphatic vessels, and mast cells are densely distributed at locations corresponding to the sites of traditional acupuncture points. 33 In addition, both nitric oxide (NO) content and skin conductance at traditional acupuncture points increased after needling. 34 Therefore, the dissimilarities in neuroanatomical structure at traditional acupuncture points and sham needling locations may help explain the variable effects and may equally apply to this study. We suggest that the antihypertensive effect of acupuncture at KI3 may be related to the specific activation of relevant brain regions corresponding to the anatomical location of KI3. However, the deeper mechanisms of action need further study.
This study has several limitations. First, we could not directly explain the relationship between brain glucose metabolism and prognosis in hypertensive animals. Future studies could use proteomic or genomic techniques to independently study areas of interest in the brain to better understand the deeper mechanisms of action underlying the use of acupuncture in the treatment of hypertension. Second, to study the molecular mechanism of acupuncture regulation on the target brain regions, we sacrificed the rats after the PET-CT scan and cryopreserved the brain tissue for further planned studies of genomics and proteomics. Therefore, we could not track the chronic, longitudinal acupuncture effects in these rats, which may otherwise have been useful. In the future, we will further study the long-term efficacy of acupuncture treatment for hypertension.
Conclusion
Using an SHR model, we demonstrated that acupuncture at KI3 not only decreased BP, but also altered glucose metabolism in the hypothalamus, thalamus, and medulla oblongata. Further research is needed to clarify the significance of these changes and the mechanism of action of acupuncture for the treatment of hypertension.
Footnotes
Acknowledgements
We would like to thank Professor Qingqiang Tu (Sun Yat-sen Medical College, Sun Yat-sen University) for his help in performing the PET-CT scans. The corresponding author has the right to grant on behalf of all authors, and does grant on behalf of all authors, an exclusive license (or non-exclusive for government employees) on a worldwide basis to the BMJ Publishing Group Ltd and its Licensees to permit this article (if accepted) to be published in AiM editions and any other BMJPGL products to exploit all subsidiary rights, as set out in our license (![]() ).
).
Contributors
X.L., C.T., and J.L. conceived and coordinated the study. X.L. and J.L. participated in the design of the study. J.L., C.P., and D.L. drafted the manuscript. J.L., C.P., K.H., Y.W., G.Z., and Y.W. conducted the study. B.S. and B.N. performed the data analysis. All authors read and approved the final version of the manuscript accepted for publication.
Funding
This work was supported by the National Natural Science Foundation of China (ref. 81473600).
Declaration of conflicting interests
The authors declared no potential conflicts of interest with respect to the research, authorship, and/or publication of this article.
Data availability
Readers can access the data underlying the findings of the study by contacting the corresponding author’s email address (