
Abstract
People have associations between colors and concepts that influence the way they interpret color meaning in information visualizations (e.g., charts, maps, diagrams). These associations are not limited to concrete objects (e.g., fruits, vegetables); even abstract concepts, like sleeping and driving, have systematic color-concept associations. However, color-concept associations and color meaning (color semantics) are not the same thing, and sometimes they conflict. This article describes an approach to understanding color semantics called the color inference framework. The framework shows how color semantics is highly flexible and context dependent, which makes color an effective medium for communication.
When you think of raspberries, what comes to mind? You may think of features like red, fuzzy, and sweet. In this classic cognitive psychology feature listing task, color is just one of many features in people’s conceptual representations of objects (Mervis & Rosch, 1981). Historically, color was considered a not-so-important feature of object representations (Biederman & Ju, 1988) that must sometimes be ignored to find deeper relations among concepts (Gopnik & Sobel, 2000). Cases in which color dominates in object representations (e.g., inferences about foods; Macario, 1991) have been treated as domain-specific exceptions (Rogers & McClelland, 2004). Researchers have even challenged that color is part of conceptual representations of objects, and evidence to the contrary was limited to objects with strong color associations (Tanaka & Presnell, 1999; Therriault et al., 2009). From this perspective, there is potential to underestimate the role of color in human cognition.
However, color can be considered through a different lens—not as one of many attributes of object representations in the human mind but rather as a visual feature that represents, or “stands for,” concepts. From this perspective, the meaning that people ascribe to colors—color semantics—plays an important role in the way humans evaluate and interpret the world around them (Hasantash et al., 2019; Lin et al., 2013; Schloss, 2018; Schloss et al., 2018, 2023; Schloss & Palmer, 2017). Such effects are not limited to concepts with strong color associations (Mukherjee et al., 2022).
This article primarily focuses on the role of color semantics in visual communication. Visual communication is fundamental to how humans share information. People use information visualizations (e.g., maps, charts, diagrams, and signage) to help others navigate new environments, track perilous weather patterns, learn about scientific discoveries, monitor political trends, and indicate where to discard different types of recyclables, to name a few examples. 1 In visual communication, designers create visualizations by representing concepts using visual features (e.g., colors, shapes, sizes, textures), and observers interpret visualizations by discerning the meaning of those visual features (Franconeri et al., 2021; Goldstone et al., 2015). For example, in Figure 1a, colors represent fruits in a bar chart (left) or variations in magnitude in a colormap data visualization (right). Readers may be tempted to think that interpreting color meaning in Figure 1a is trivial—observers can simply follow the legends. However, observers have expectations about color meaning independent of legends, and they have more difficulty interpreting visualizations that violate those expectations (Lin et al., 2013; Schloss et al., 2019).
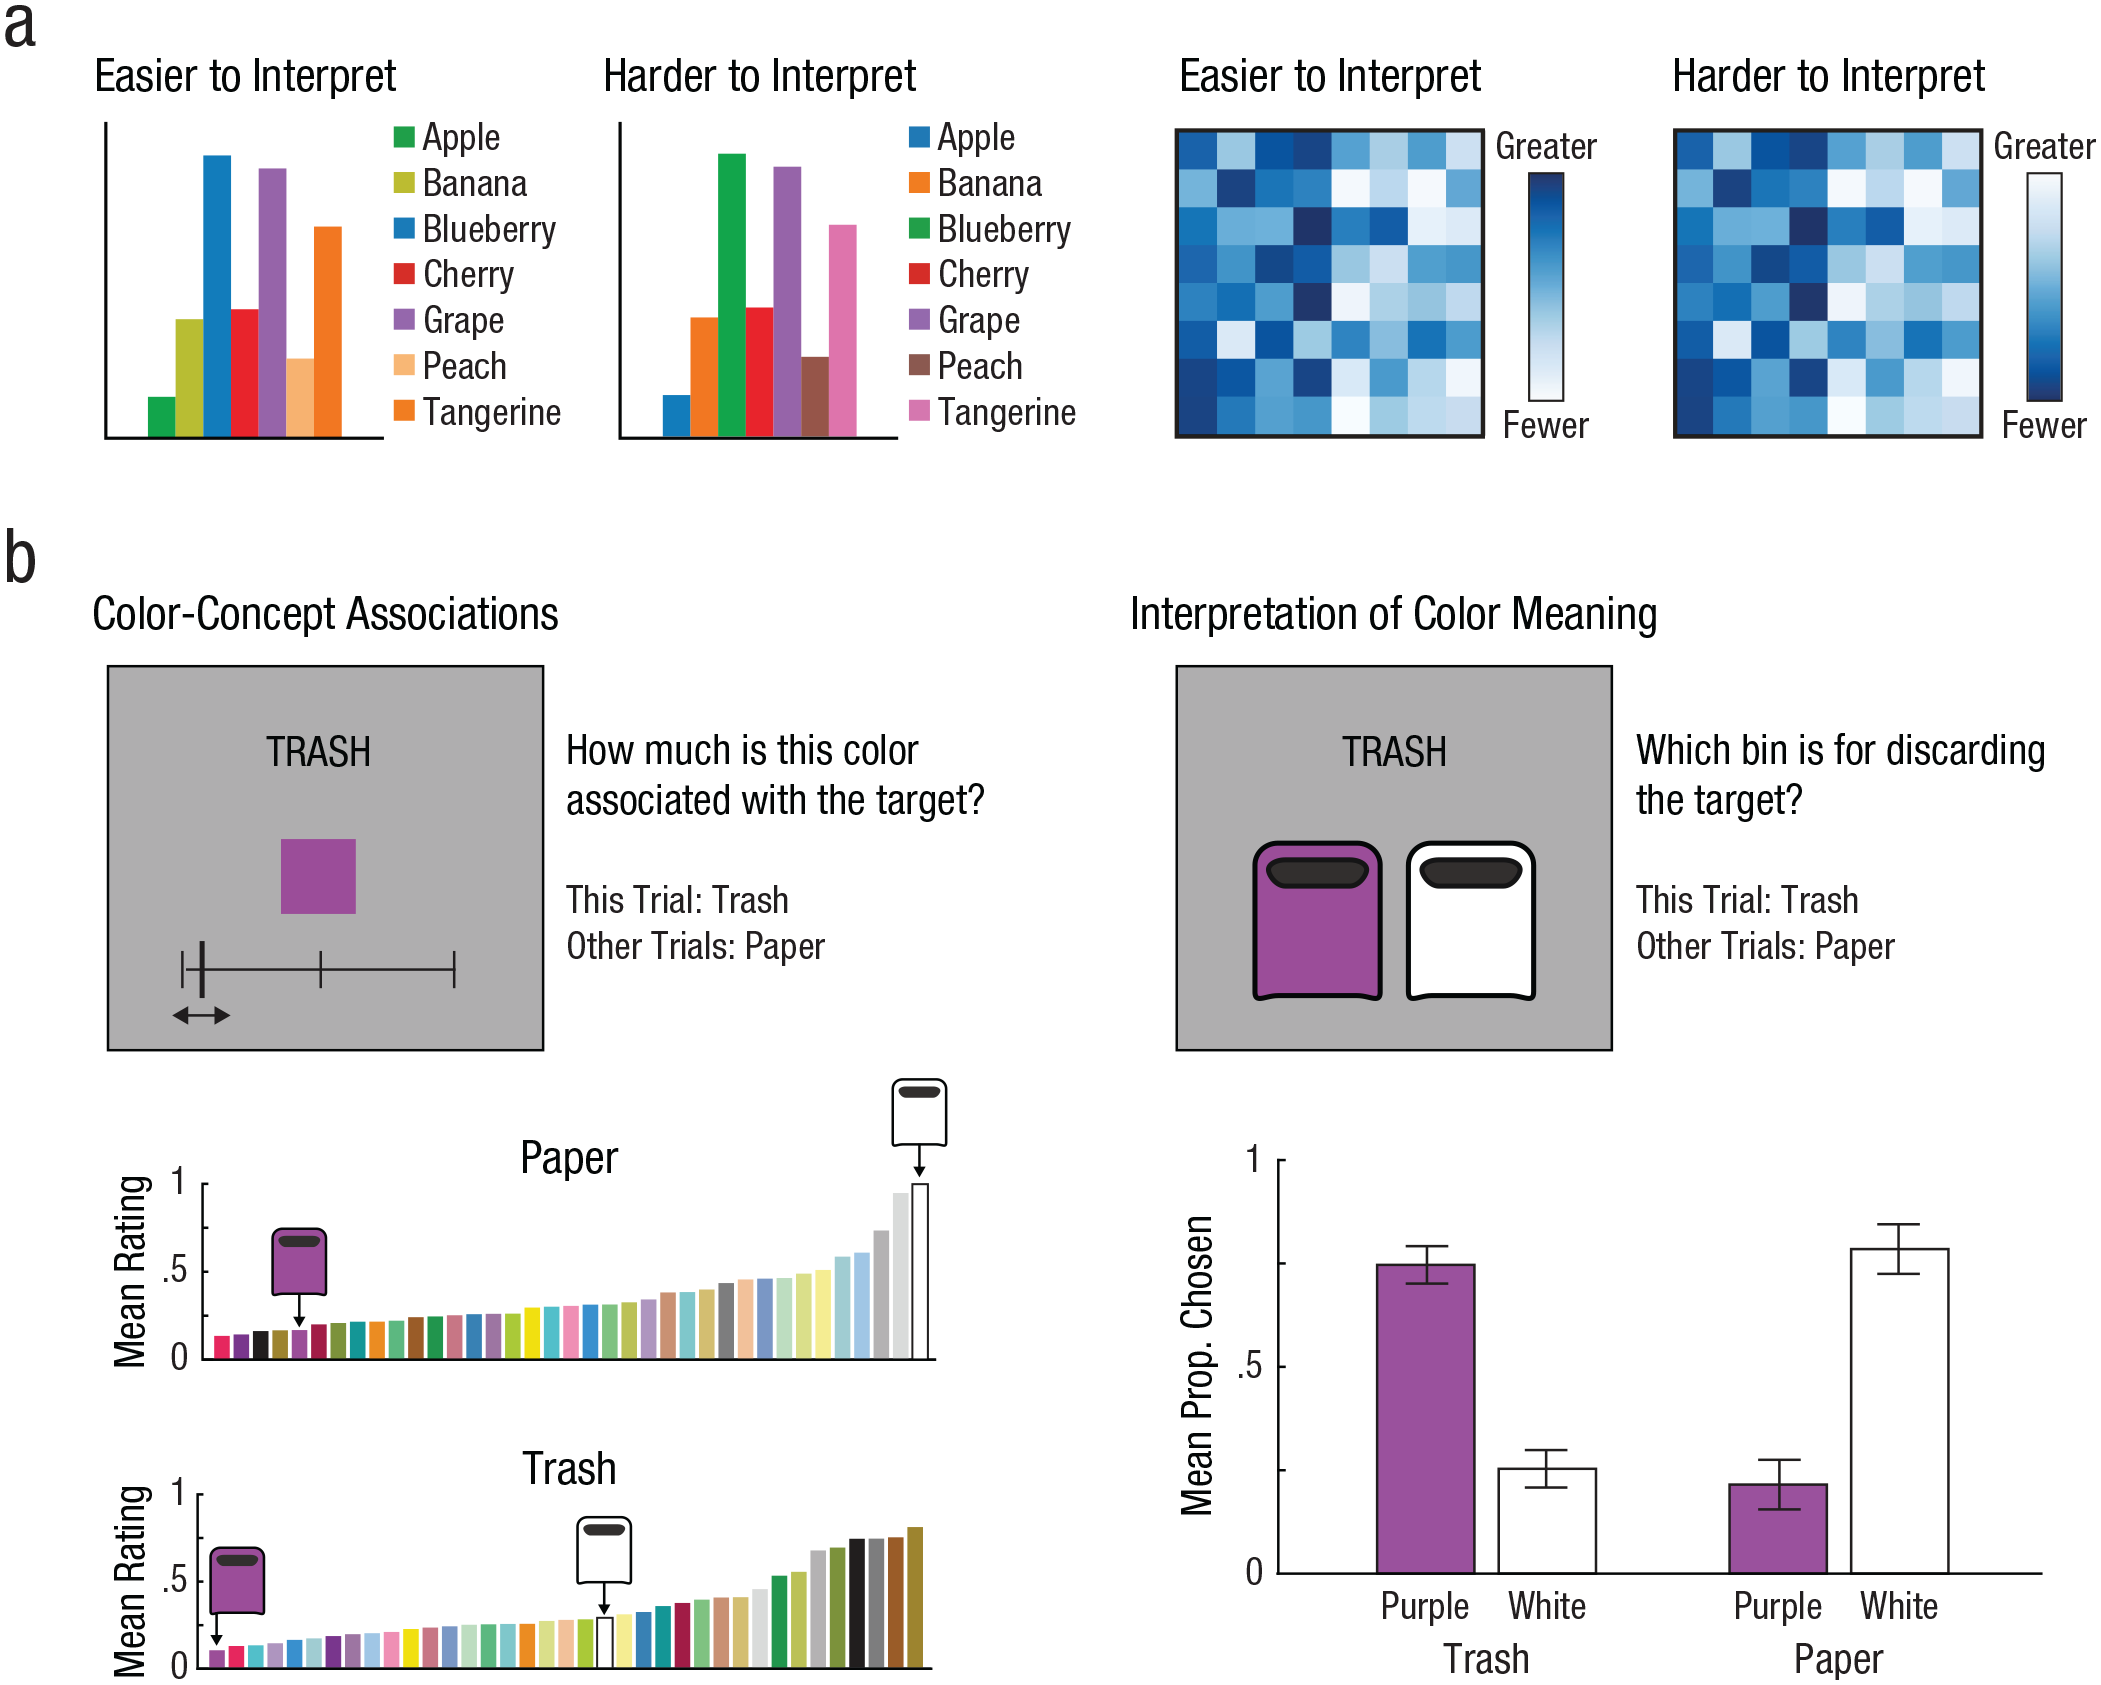
(a) Examples of information visualizations that are easier/harder to interpret depending on the encoded mapping between colors and concepts specified in the legend. Left: Bar charts were easier to interpret when bar colors resembled the objects the bars represented (adapted from Lin et al., 2013). Right: Colormap data visualizations were easier to interpret when darker colors mapped to greater magnitude (dark-is-more bias; adapted from Schloss et al., 2019). (b) Example of the dissociation between color-concept associations and color meaning from Schloss et al. (2018). Left: Task in which participants rated the association strength between each of 37 colors and the concepts trash and paper and the corresponding mean ratings for each color (sorted from low to high). Right: Task in which participants judged which colored bin represented the target concept named above and results showing the proportion of times each color was chosen for each target (error bars represent standard errors of the means). Note that trash was more associated with white than with purple (left), yet observers inferred purple meant trash (right); see text for an explanation of why.
Readers may also be tempted to assume that color meanings are simply color-concept associations—the degree to which individual colors are associated with individual concepts. But color-concept associations and color meaning are not the same thing, and they can even conflict. Consider the study illustrated in Figure 1b (Schloss et al., 2018). One group of participants judged associations between colors and recycling-related concepts (e.g., paper and trash). Another group judged color meaning by interpreting which colored bin was for discarding a target object. Here, the target was trash, but on other trials, the target was paper. Trash was more strongly associated with white than with purple (left), yet participants reported purple meant trash (right). Thus, color meaning conflicted with color-concept associations. An explanation for this discrepancy will be discussed later.
This article describes a novel approach to understanding color semantics called the color inference framework (Schloss, 2018). The framework shows how color semantics is flexible and context dependent, which makes color an effective medium for communication.
Color Inference Framework
The color inference framework characterizes the way people infer meanings from colors and use those inferences to make judgments about the world (Schloss, 2018; Fig. 2). The framework begins with color-concept associations, the degree to which each possible color is associated with each possible concept. These associations are stored in a color-concept association network, which connects all colors to all concepts. On this network representation, different color inference operations are computed to produce different kinds of judgments. Figure 2 shows two such inference processes: Pooling inference produces preferences for colors, and assignment inference produces interpretations of color meaning in information visualizations. Although formulated using color as a paradigm example, the color inference framework has potential to extend to other perceptual features, insofar as they are systematically associated with concepts. The following sections provide detailed descriptions and supporting evidence for the components of the framework.
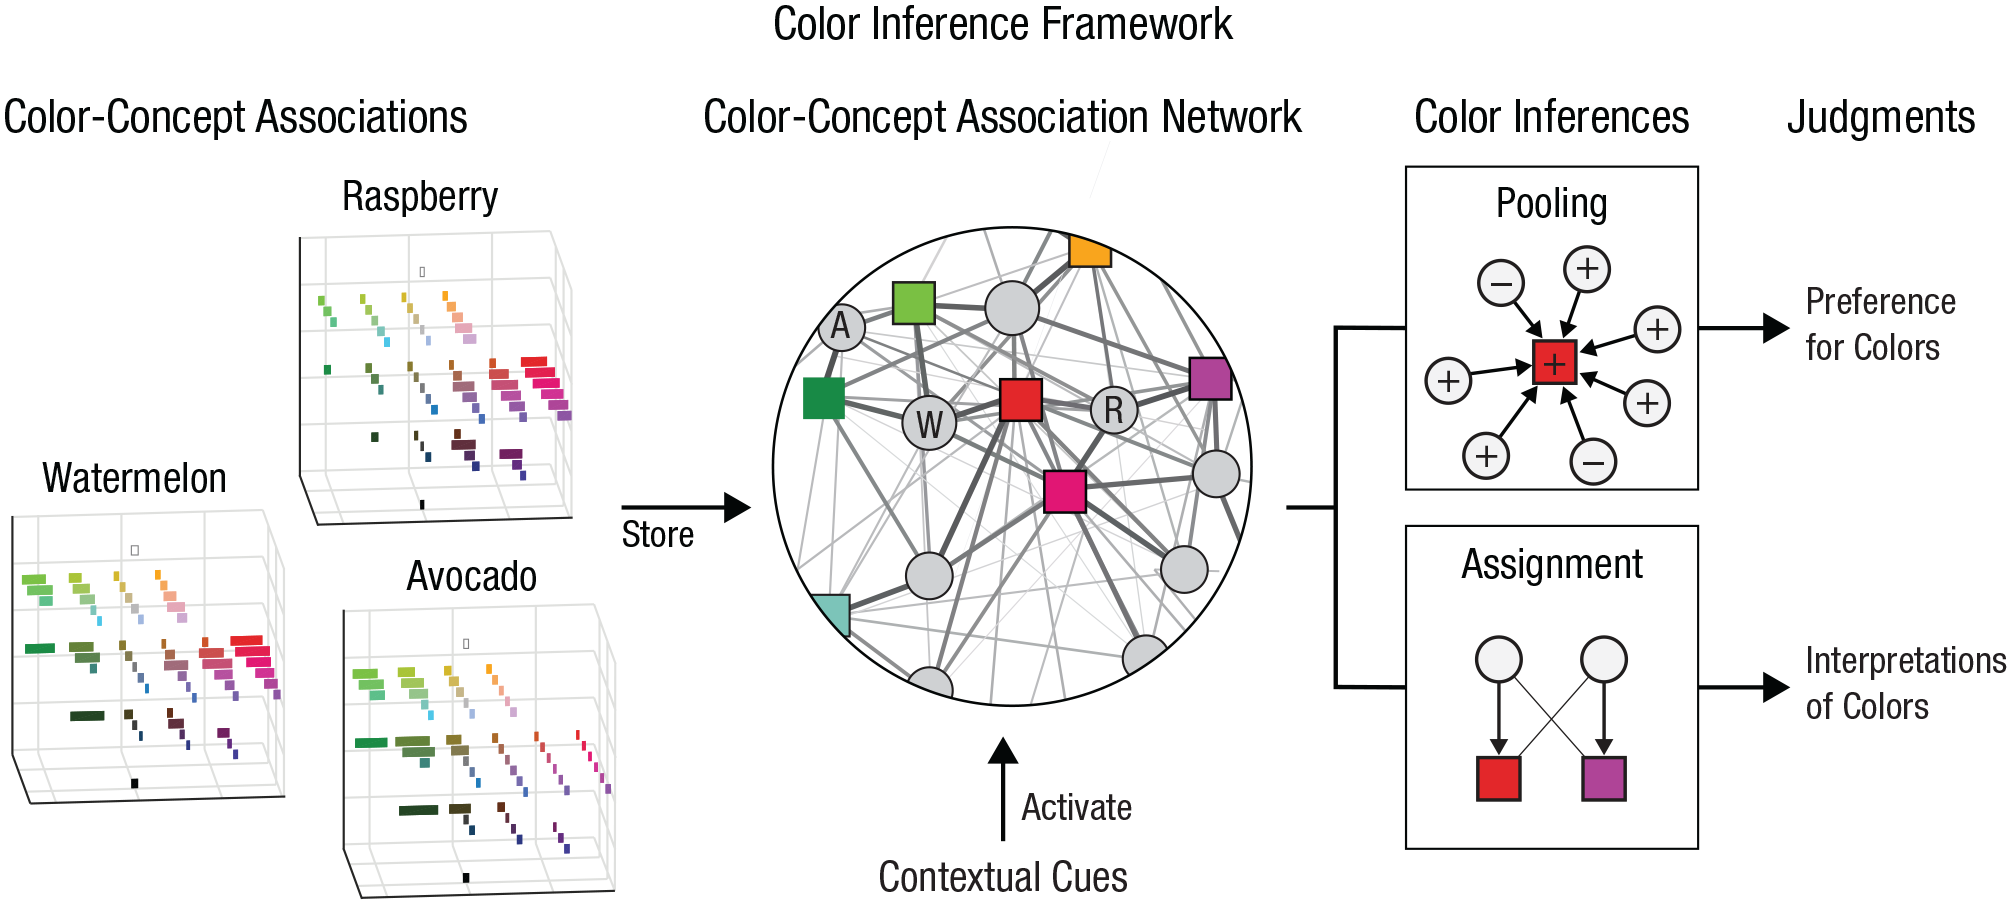
Overview of the color inference framework (Schloss, 2018). See text for details.
Color-concept associations
Although color semantics is not solely determined by associations between individual colors and concepts, such associations are a key ingredient.
Historically, work on color-concept associations in cognitive psychology focused on associations between concrete objects and their characteristic colors (e.g., fire trucks with red; Tanaka & Presnell, 1999). But, for any concept, one can quantify the degree to which it is associated with each possible color humans perceive via either human judgments (e.g., Mukherjee et al., 2022; Murthy et al., 2022; Schloss et al., 2018) or computational estimations (e.g., Lin et al., 2013; Rathore et al., 2020). Rather than considering only some concepts as having discrete associations with a small set of colors, all concepts can be viewed as evoking a distribution of associations across all of color space.
Figure 2 shows examples of color-concept association distributions sampled over a perceptual color space, called color-concept associations spaces (Rathore et al., 2020), for the concepts watermelon (W), raspberry (R), and avocado (A). Each point represents a color, and each color receives a weight proportional to association strength (longer bars indicate greater weight). Watermelon puts strong weights on reds and greens, raspberry puts strong weights on reds and purples, avocado puts strong weights on greens, and none of these fruits put strong weights on blues, yellows, or grays. Estimating the full distribution, rather than the top associated colors for a given concept, is important both for understanding the nature of color-concept associations and for designing effective color palettes for information visualizations. Although beyond the scope of the present article, Schloss et al. (2018) reports evidence that sometimes designing effective palettes requires using weakly associated colors to avoid confusability.
The color inference framework proposes that color-concept association distributions arise and continually update through experience (Schloss, 2018). Schoenlein and Schloss (2022) tested this hypothesis by teaching participants about novel concepts: Filk and Slub alien species. Participants saw examples of colored aliens from each species, which had different color distributions: One species was warm biased (mostly orange, red, and yellow), and the other was cool biased (mostly cyan, green, and blue). After, participants rated color-concept associations for each species with each color they saw during exposure plus new, unseen colors varying in saturation/lightness. Overall, participants formed new associations from exposure, and association strength increased with color-concept exposure frequency. This frequency effect generalized to similar colors not seen during learning, which helps explain how continuous color-concept association distributions can be “filled in” after exposure to a small sample of colors. Moreover, evidence suggests that color-concept associations spread to other colors within the same color category (e.g., an association between a concept and a particular shade of blue spreads to other colors categorized as blue; Rathore et al., 2020). Questions remain concerning how color-concept associations are formed for abstract concepts, but some have proposed that abstract associations extend from experiences with related concrete objects (Schloss, 2018; Soriano & Valenzuela, 2009).
Color-concept association network
Within the color inference framework, color-concept associations are thought of as stored in a color-concept association network (Fig. 2) connecting all colors to all concepts. The connecting-edge weights are proportional to association strength between each color and concept.
This idea stems from classic semantic networks (e.g., Collins & Loftus, 1975), with key differences. In classic semantic networks, nodes representing concepts of colors (e.g., the concept red) are connected only to concepts for things appearing that color (e.g., fire trucks, roses) and disconnected from things not appearing as that color (e.g., bananas). In color-concept association networks, each perceivable color is connected to every possible concept. For example, rather than just one node for the concept of red, nodes exist for every color percept that appears reddish (light reds, dark reds, muted reds, purplish reds, orangish reds, and every red in between. 2 These nodes are connected to not only strongly associated concepts (e.g., fire trucks, roses) but also all other concepts (e.g., bananas). Accounting for connections between all concepts and colors, regardless of association strength, is key for understanding the color inference processes discussed later.
The distance between any two concepts in the network depends on similarity of their color-concept associations, which can deviate from semantic similarity among concepts. For example, watermelon would be near Christmas (similar color associations, dissimilar concepts) but far from bananas (dissimilar color associations, similar concepts). The color inference framework focuses on color meaning arising from relative distances between colors and concepts, but whether semantic similarity among concepts also plays a role is an open question.
Contextual cues
A given judgment does not engage the entire color-concept association network at once. Instead, contextual cues provide input specifying which colors and concepts are relevant to a task. Perceptual input (observation of colors) activates particular color nodes, and conceptual input (thinking about concepts) activates particular concept nodes within the network. As discussed next, the resulting inferences depend on which colors and concepts are jointly perceived and considered.
Color inference processes and corresponding judgments
Different computations on the color-concept association network support different kinds of inference processes, which produce different kinds of judgments. Variations in network structure due to cultural, individual, or temporal variation (Schloss & Palmer, 2017; Tham et al., 2020) will produce different judgments across individuals, but such judgments should still be predictable if the network structure and inference processes are well specified. Two kinds of inference processes have been well studied.
Pooling inference for evaluating color preferences
Pooling inference is an operation on the color-concept association network that produces judgments of color preference (Fig. 2). When a person judges their preference for a color, concepts strongly associated with that color are activated. Each concept has a valence (positive/negative signs in Fig. 2) representing the individual’s preference for the concept (or referent thereof). The valences of those concepts are pooled to produce a summary valence, which determines how much the individual likes that color.
This notion stems from the ecological valence theory (EVT), which states that people like colors to the extent that they like all objects strongly associated with those colors (Palmer & Schloss, 2010). Supporting the EVT, 80% of the variance in average color preferences of participants in the United States was explained by the combined valence of all objects associated with those colors, weighted by association strength. Color preferences are considered part of a feedback loop such that seeking experiences with liked colors reinforces preferences for those colors, insofar as those experiences are positive (Palmer & Schloss, 2010). Earlier work focused on concrete objects, but later work extended the theory to include any kind of concept (see Schloss & Palmer, 2017). Although the EVT explains color preferences across a variety of cultures, it falls short in others (e.g., participants in Saudi Arabia), and further research is needed to understand why (Al-Rasheed et al., 2022).
Within the color inference framework, changes in color preferences can arise from variations in weights on relevant concepts in the color-concept association network during the pooling function. Indeed, priming observers to think about positive concepts associated with a particular color (e.g., strawberries associated with red) increases preference for that color (Strauss et al., 2013), and natural variations in concept activation over environmental seasons also produce systematic changes in color preference (Schloss & Heck, 2017). These and related results are summarized in a theory and review article on individual and temporal differences in color preferences (Schloss & Palmer, 2017), so they will not be further discussed here.
Assignment inference for interpreting colors in information visualizations
Assignment inference is an operation on the color-concept association network that produces interpretations of color meaning in information visualizations. This operation is computed over the subset of the color-concept association network relevant to the encoding system of the visualization (i.e., the specific concepts represented in the visualization and the visual features used to represent them; Fig. 2). For example, in the recycling task from Figure 1b, the encoding system includes the concepts of trash and paper and the colors purple and white. This subset of the network is shown as a bipartite graph in Figure 3, a representation using edges to connect the two concept nodes to the two color nodes of the encoding system. The numbers next to the edges (and edge thickness) represent the “goodness” of each color-concept pairing, called merit. For visualizations involving only two discrete concepts and colors, merit can be considered as association strength (depicted toward the left of Fig. 3). For visualizations with > 2 colors and concepts (Schloss et al., 2018) or involving relational rather than discrete concepts (Schoenlein et al., 2023), merit can be more complex. 3
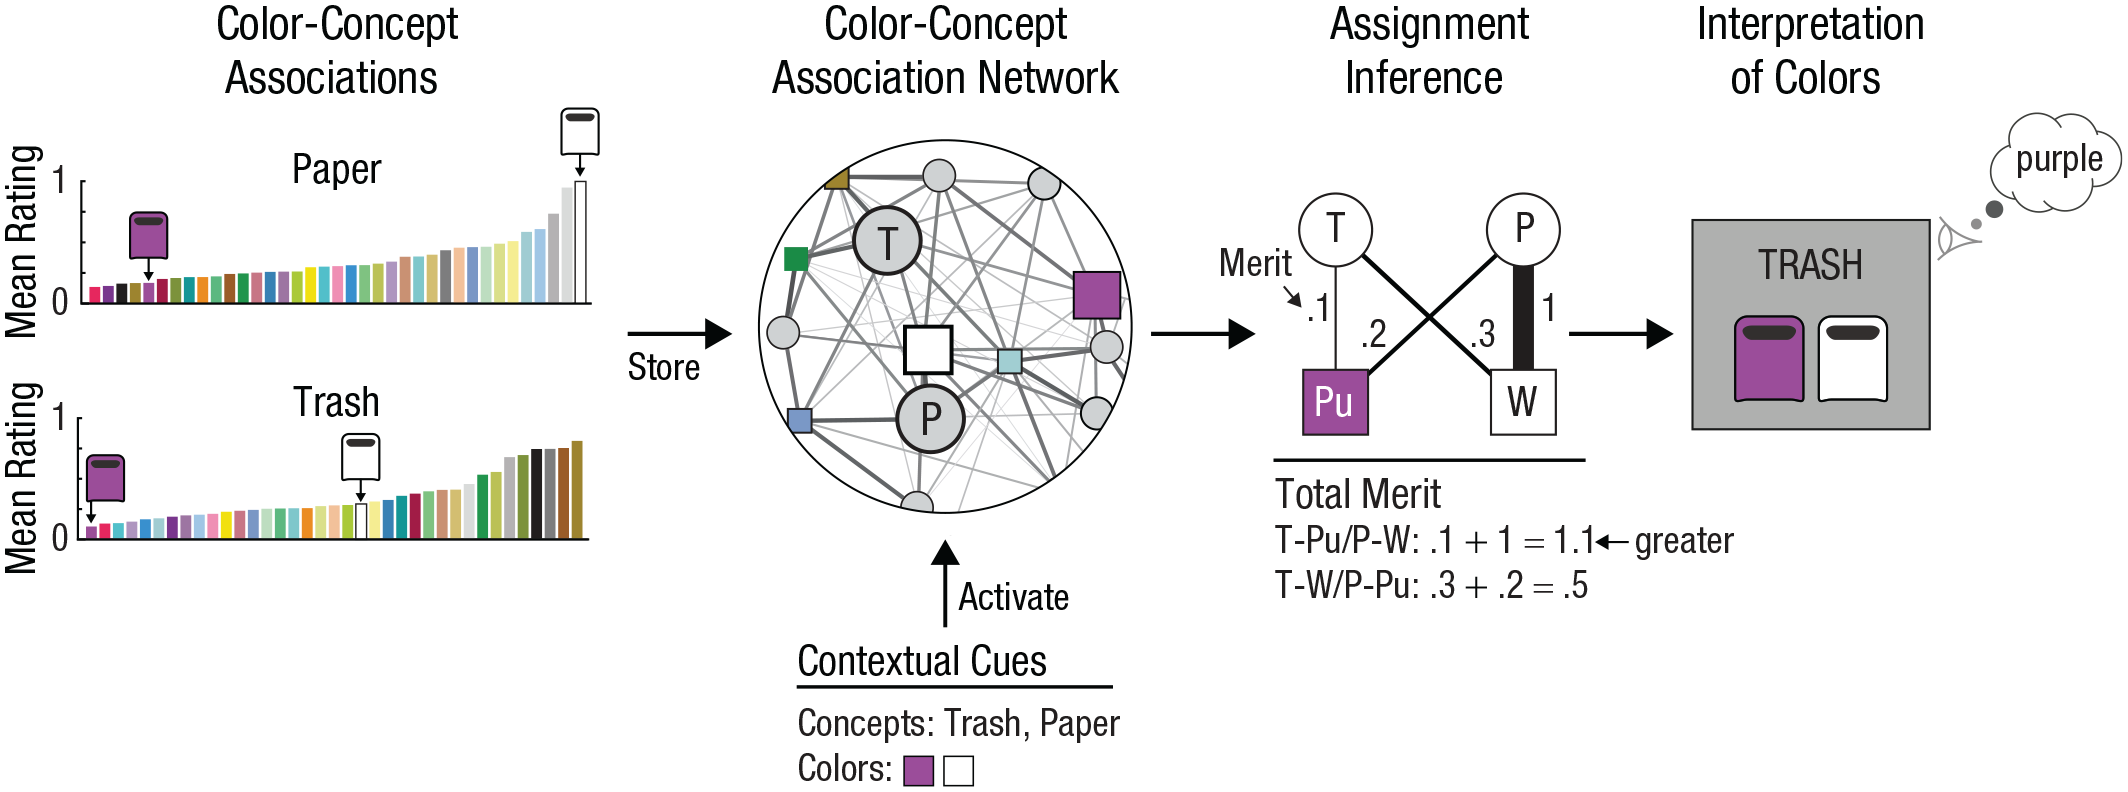
Application of the color inference framework to explain the dissociation between color-concept associations and color meaning shown in Figure 1b (based on Schloss et al., 2018). See text for details.
When participants are asked which color represents a target concept (e.g., trash), the concepts and colors in the context of the encoding system are activated within the network. Assignment inference evaluates possible assignments between colors and concepts and returns the overall “best” assignment (greatest total merit). 4 Comparing total merit in Figure 3, trash–purple and paper–white (1.1) has greater merit than trash–white and paper–purple (0.5), so observers interpreted that purple meant trash even though trash was more strongly associated with white (Schloss et al., 2018). Thus, assignment inference accounts for the dissociation between color-concept associations and color meaning shown in Figure 1b.
This recycling example emphasizes that understanding color meaning requires accounting for all colors and concepts in the context of the encoding system, not merely each color-concept association alone. This finding implies that changes to the encoding system will change inferences about color meaning. Indeed, ongoing work suggests that if paper is removed from the encoding system (i.e., participants only complete trials with trash as the target), then participants no longer have a reason to choose purple and instead infer that white means trash.
The outcome of assignment inference corresponds to interpretation of color meaning if there is no conflicting information from legends, labels, or captions. However, under conflicts (e.g., Fig. 1a), observers must resolve the mismatch between their expectations from assignment inference and the external information to produce an accurate interpretation, which makes interpreting visualizations more difficult.
Assuming no conflict, what determines people’s ability to use assignment inference to interpret color meaning? To address this question, consider the bar charts in Figure 4a, which represent data about watermelon and mango. For each chart, which color represents watermelon? How easy was it to decide? One might think ease of assignment depends simply on how strongly you associate each color with the target concept, watermelon, or how easy it is to see the difference between the colors (perceptual discriminability). But ease of assignment depends on something else.
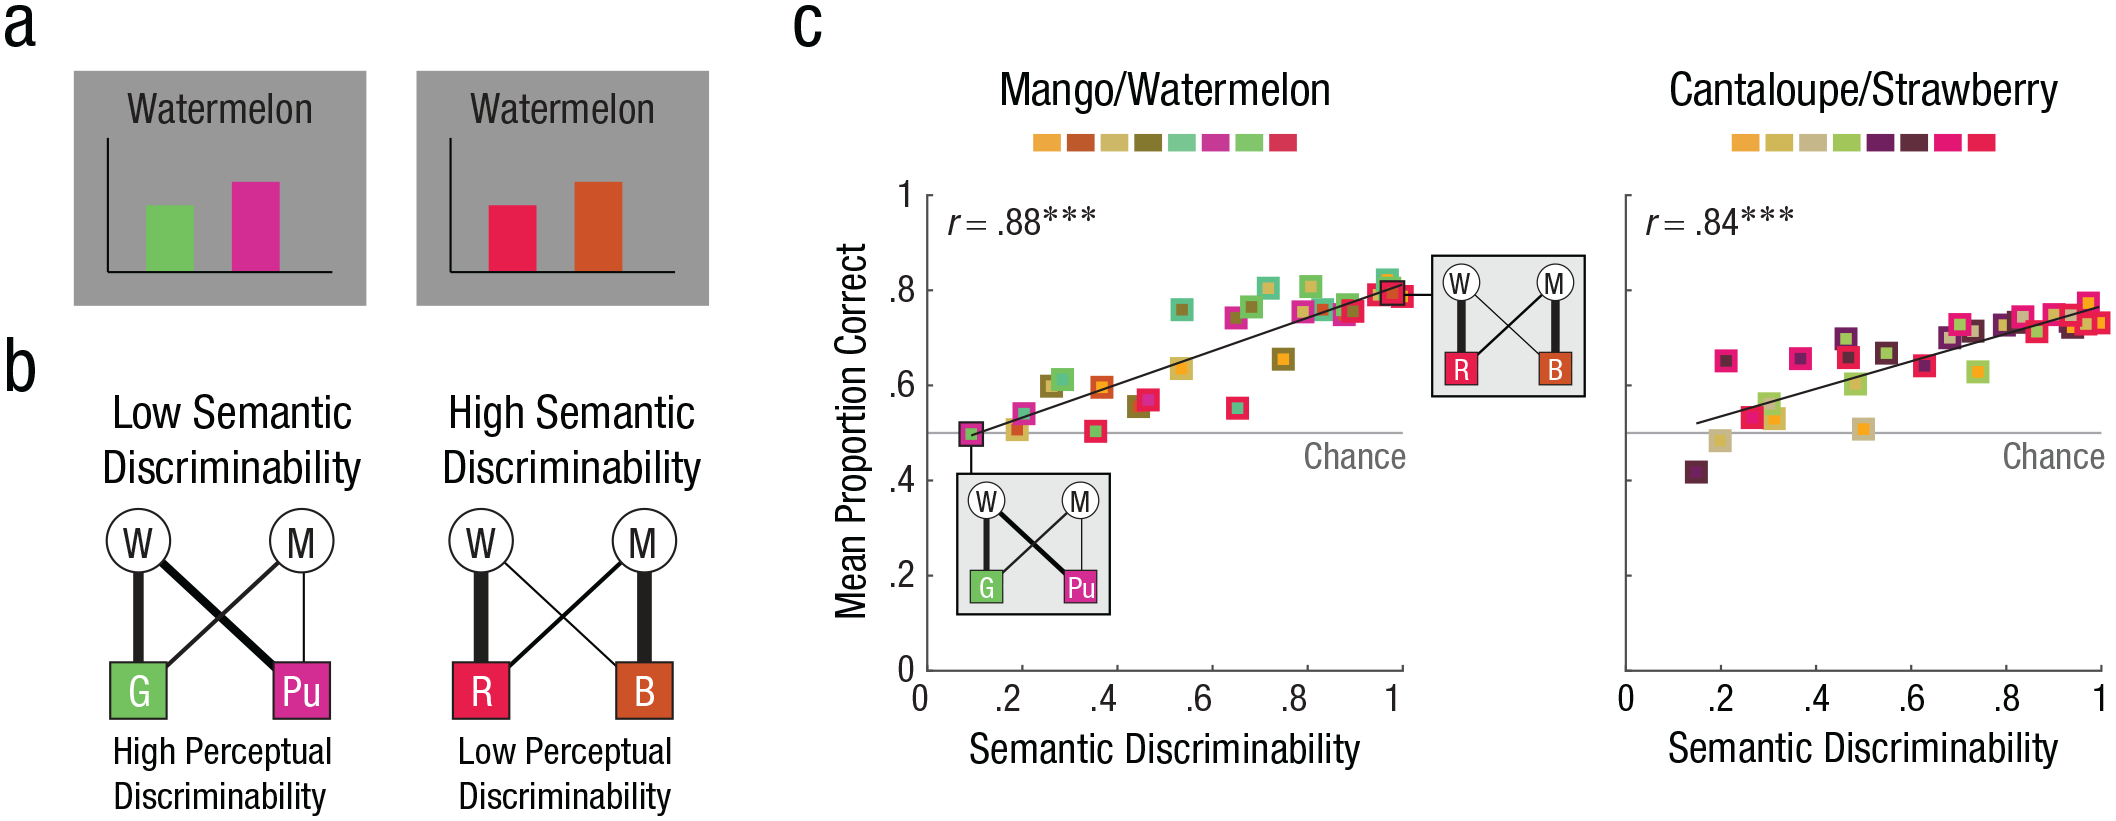
(a) Example trials, for which participants reported which bar color (left/right) represented the target concept above. (b) Bipartite graphs for the concepts watermelon (W) and mango (M) and colors with low semantic discriminability (green [G] and purple [Pu]) and high semantic discriminability (red [R] and brown [B]). Here, the colors with low versus high semantic discriminability have high versus low perceptual discriminability, respectively. (c) Mean proportion of correct responses plotted as a function of semantic discriminability in the mango/watermelon and cantaloupe/strawberry conditions (averaged over participants and the two concepts within each pair). The colors above each plot indicate the eight colors judged in that condition (all pairwise comparisons). The bipartite graphs inset in the mango/watermelon condition correspond to (b). These data are from Schloss et al. (2021). Asterisks indicate significant correlations (***p < .001).
For Figure 4a (right), most readers probably inferred red meant watermelon and the task felt easy, but for Figure 4a (left), responses were probably split between colors and the task felt hard (assuming typical color vision). This example demonstrates semantic discriminability, the ability to discern the difference in meaning between colors within an encoding system (Schloss et al., 2021). Semantic discriminability can be quantified using a metric evaluating the total merit of the most likely assignment compared with the alternative assignment(s) (see Schloss et al., 2021, for a formal definition for two colors and concepts and Mukherjee et al., 2022, for a definition for larger encoding systems). Figure 4b shows that for red and brown, the watermelon–red and mango–brown assignment has much greater merit than the alternative, so semantic discriminability is high. For green and purple, both assignments have similar merit, so semantic discriminability is low. Semantic discriminability is a property of observers’ expectations of color meaning, distinct from the “true” mapping specified by the designer of an encoding system (e.g., watermelon = red and mango = brown or watermelon = brown and mango = red). Assuming that the encoding system matches observers’ expectations (e.g., watermelon = red and mango = brown), the ability to use assignment inference to correctly interpret color meaning in visualizations should increase with increased semantic discriminability.
Schloss et al. (2021) tested this hypothesis by having participants interpret bar charts (Fig. 4a) with bars representing data about two fruits (mango and watermelon or cantaloupe and strawberry). Participants reported which color (left/right) represented the fruit named above the chart. For each fruit pair, participants judged all pairs of eight colors, which varied in semantic discriminability. Responses were scored as correct if they matched the optimal assignment (i.e., the assignment with greatest merit), which should align with observer expectations (Schloss et al., 2018). Figure 4c shows that mean accuracy increased with increased semantic discriminability for both mango/watermelon (r = .88) and cantaloupe/strawberry (r = .84). A statistical model showed that semantic discriminability predicted interpretability, independent of effects of association strength between the target concept and correct color or perceptual discriminability. Figures 4b and 4c show an example where accuracy was greater for colors with lower perceptual discriminability because semantic discriminability was higher.
Semantic discriminability also predicts interpretability for visualizations representing a larger number of concepts and concepts that are more abstract (Mukherjee et al., 2022). Previously, the prevailing view was that abstract concepts lacking strong, specific color-concept associations (e.g., sleeping, comfort, driving, safety) were noncolorable—they could not be encoded meaningfully using color (Lin et al., 2013). However, Mukherjee et al. (2022) found that such concepts could be meaningfully represented using colors to the extent that those colors were semantically discriminable, given the other colors and concepts in the context of the encoding system. Participants saw bar charts with four colored bars and four concepts listed above and reported which color they thought represented each concept (Fig. 5a). Across trials, each concept appeared in four concept sets, with colors designed to be as semantically discriminable as possible (Schloss et al., 2018). Figure 5b shows that within the concept sleeping, accuracy for choosing the optimal color depended on semantic discriminability between that color and other colors in the encoding system defined by the four colors and concepts. Figure 5c shows the full data set, where accuracy significantly increased with semantic discriminability. Note that responses were well above chance, even for concepts that Lin et al. (2013) considered noncolorable (i.e., activities and properties). Thus, color is a more powerful cue for visual communication than previously thought.
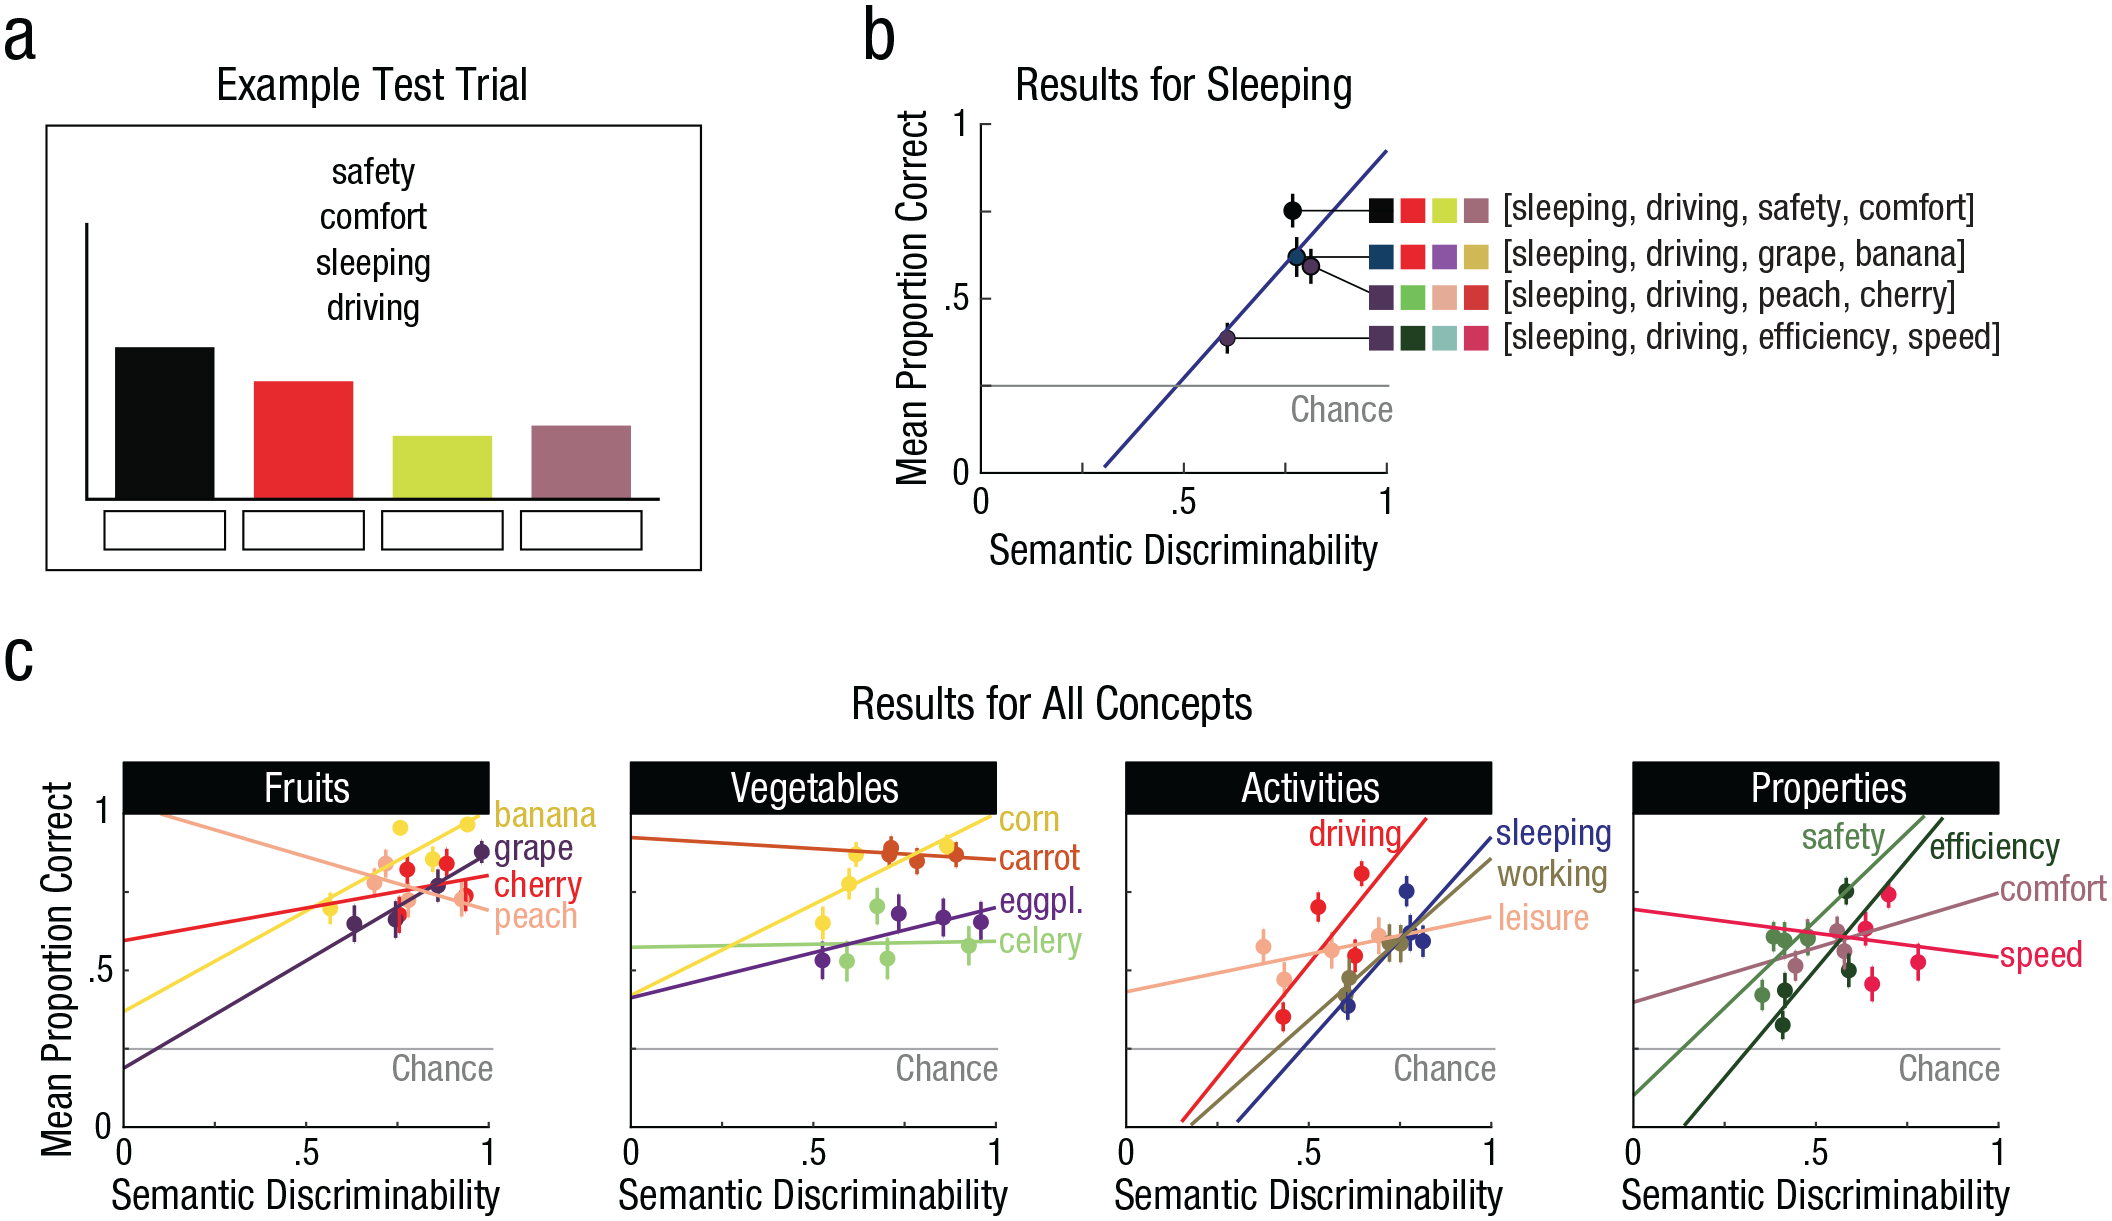
(a) Experimental trial in which participants matched each of four concepts to each of four colors. (b) Mean proportion of correct responses for the concept sleeping as a function of semantic discriminability. To the right of each data point is the full set of colors and concepts for that condition (the left-to-right order of colors matches the order of the concepts for optimal assignments). (c) Mean proportion of correct responses for all concepts tested, as a function of semantic discriminability (concepts are grouped by fruits, vegetables, activities, and properties). Error bars indicate standard errors of the means, and the horizontal gray line indicates chance performance. This figure is adapted from Mukherjee et al. (2022).
Having established that people can use assignment inference to interpret color meaning insofar as the colors are semantically discriminable, the next question is, what determines the ability to find semantically discriminable colors for a set of concepts? Semantic discriminability theory posits that the capacity to find semantically discriminable colors for a set of concepts depends on how different the color-concept association distributions are for those concepts (Mukherjee et al., 2022).
To illustrate this theory, Figure 6 shows color-concept association distributions for pairs of concepts along with the most semantically discriminable color pair among all colors assessed for each concept pair. For concept sets with very different color-concept association distributions (e.g., peach and celery, and banana and comfort), it is possible to find colors with high semantic discriminability. Note, comfort has a relatively uniform distribution on its own (no strong, specific associated colors), but when paired with banana, which has a peaky distribution (strong, specific associated colors), it is possible to produce highly semantically discriminable colors. When concepts in a set have less peaky distributions that are still different from one another (e.g., sleeping and driving), it is possible to find colors that are moderately high in semantic discriminability. However, when association distributions are highly similar, (e.g., grape and eggplant), it is not possible to find colors in those distributions that are highly semantically discriminable, even if those concepts have strong, specific associations on their own. Overall, the ability to produce semantically discriminable colors for concept sets increased with increased distribution difference for sets of two concepts (r = .93) and four concepts (r = .74; Mukherjee et al., 2022). Initially tested using color, semantic discriminability theory is a general account of when perceptual features can or cannot meaningfully represent concepts. It can be tested using other perceptual features (e.g., shape, tactile texture) or possibly even other semantic features (e.g., words).
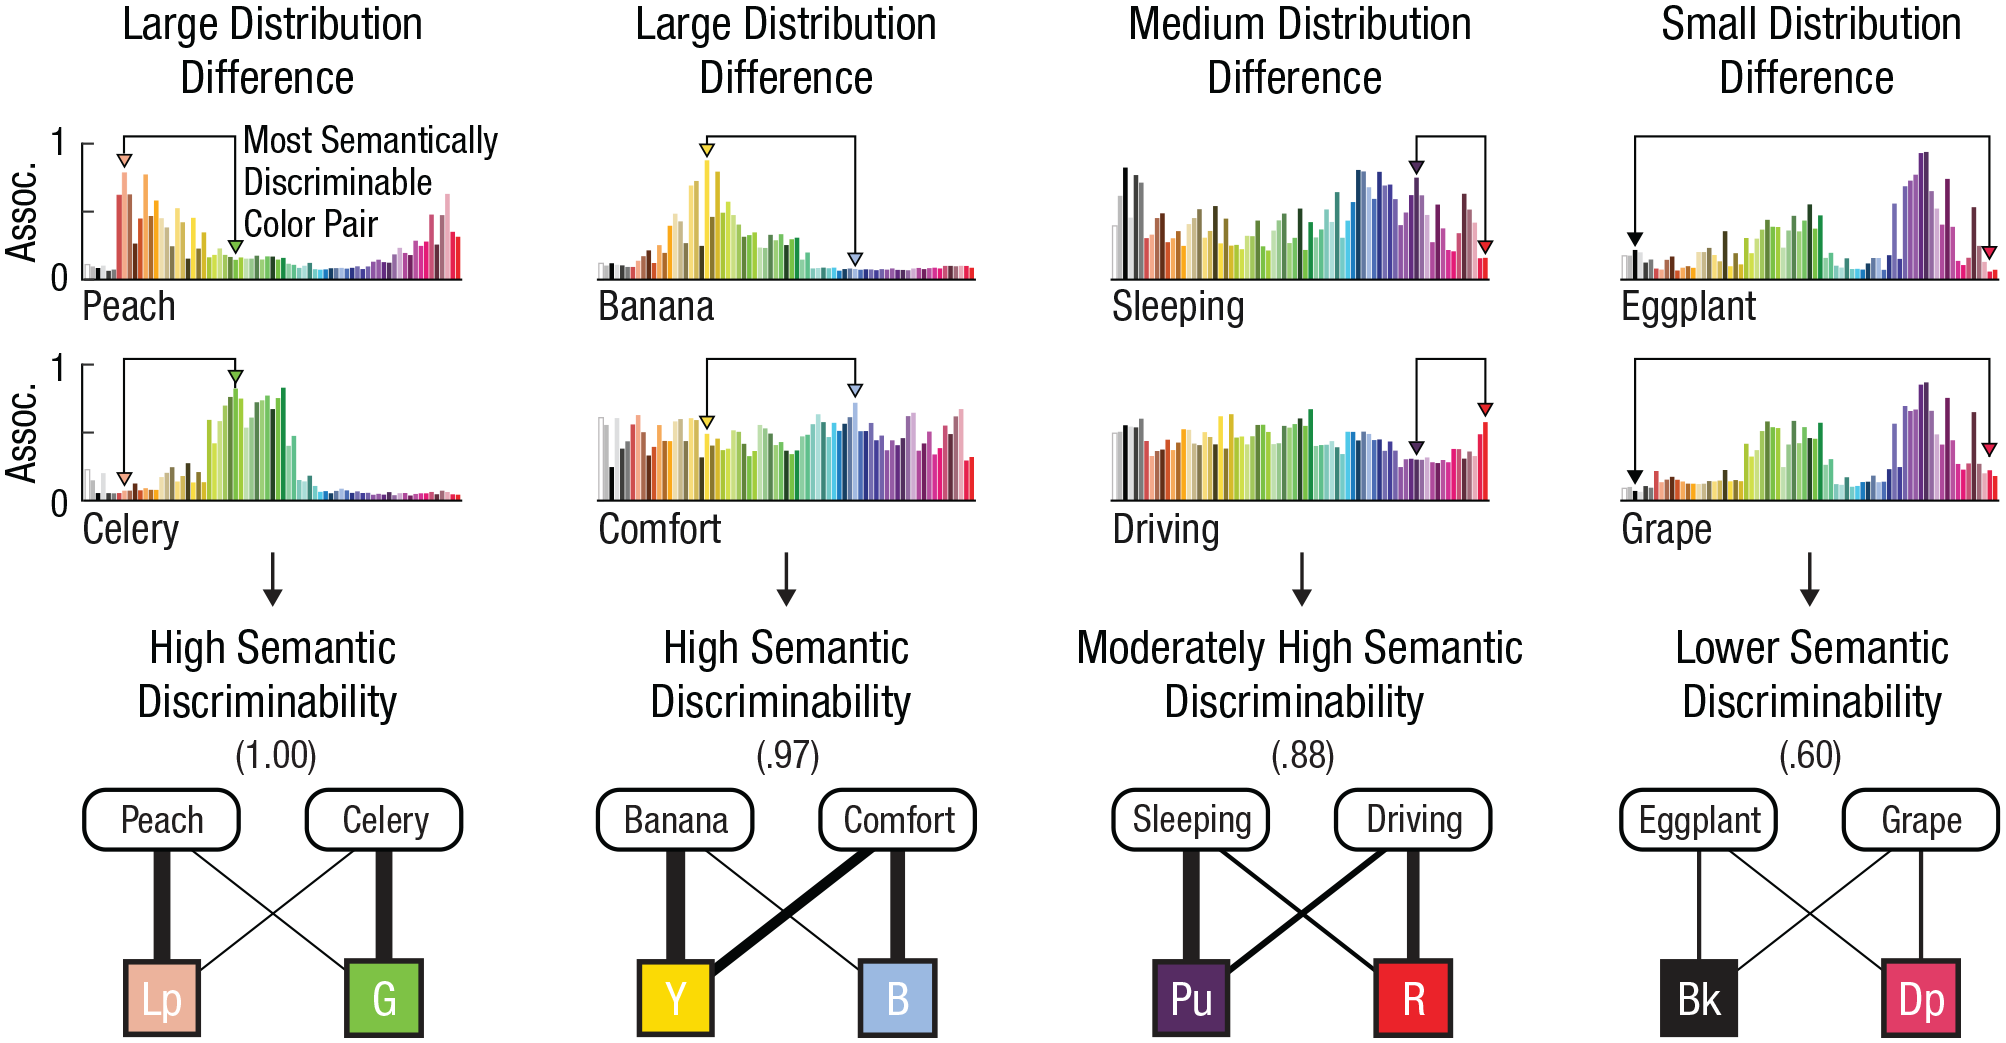
Top: Pairs of concept sets that have varying degrees of distribution difference. Within each concept pair, arrows point to the “best” color pair—the color pair with the greatest semantic discriminability among all color pairs in the distributions. Bottom: Semantic discriminability of the best color pair and corresponding bipartite graphs showing the relative merit of each assignment. The optimal assignments are peach–light pink (Lp) with celery–green (G), banana–yellow (Y) with comfort–blue (B), sleeping–purple (Pu) with driving–red (R), and eggplant–black (Bk) with grape–dark pink (Dp). These examples and data are from Mukherjee et al. (2022).
The Color Inference Framework in Application
The color inference framework can be applied to predict color preferences and design colors for information visualizations that facilitate visual communication. Once color-concept associations have been quantified, models of pooling inference can predict color preferences (Schloss & Palmer, 2017), and models of assignment inference can select color-concept pairings that optimize interpretability (Mukherjee et al., 2022; Schloss et al., 2018). These approaches will become more scalable as methods improve for automatically estimating color-concept associations without extensive human judgments (Lin et al., 2013; Rathore et al., 2020). Although color-concept associations are dynamic, updating with experience (Schoenlein et al., 2023), evidence suggests they are sufficiently stable at the group level to predict group-level color preferences (Palmer & Schloss, 2010) and color meaning in information visualizations (Mukherjee et al., 2022; Schloss et al., 2018, 2021; Schoenlein et al., 2023), which is key for designing visualizations for public audiences. The results of these studies can extend to incorporating color semantics into recommender tools for effective visualization design (Gramazio et al., 2017; Smart et al., 2020) and have already contributed to understanding color in marketing (Spence & Van Doorn, 2022).
Conclusions
The color inference framework explains why color semantics is flexible and context dependent, which makes color an effective medium for communication. Color semantics cannot be understood only in terms of associations between individual colors and concepts; it is important to account for all other colors and concepts in the context of an encoding system. Any concept set has potential to be represented meaningfully using colors if those colors are semantically discriminable. Although formulated using color, the color inference framework and accompanying theories have potential to serve as general accounts of semantics, extending to other visual features (e.g., shape, visual texture), perceptual features in other modalities (e.g., audition, touch), and possibly verbal semantic features (e.g., words). This work addresses fundamental questions of how the human mind extracts information from sensory input to acquire knowledge about the world and can be translated to make communication more effective and efficient.
Recommended Reading
Mukherjee, K., Yin, B., Sherman, B. E., Lessard, L., & Schloss, K. B. (2022). (See References). Introduces, explains, and tests semantic discriminability theory for when perceptual features can or cannot meaningfully represent concepts.
Schloss, K. B., Lessard, L., Walmsley, C. S., & Foley, K. (2018). (See References). Introduces assignment inference as the process by which people infer meaning from colors and shows that associations and meaning are not the same thing.
Schloss, K. B., & Palmer, S. E. (2017). (See References). Provides an overview of the ecological valence theory of color preferences and explains how individual and temporal differences in color preferences can be understood within a single framework.
Footnotes
Acknowledgements
Thank you to Tim Rogers, Stephen Palmer, Laurent Lessard, Kevin Lande, Kushin Mukherjee, Melissa Schoenlein, Melina Mueller, Mary Peterson, and Morton Ann Gernsbacher for their constructive feedback.
Transparency
Action Editor: Robert L. Goldstone
Editor: Robert L. Goldstone