
Abstract
Due to the difficulty of direct finite-element modeling for honeycomb sandwich panels, it is more common to apply equivalent modeling theories. It is necessary to compare their equivalent precision and then to determine the method with the best equivalent performance so as to prepare for the application in satellite solar arrays. The first 10 natural frequencies are obtained by analyzing the dynamic characteristics of sandwich panel theory model, honeycomb panel theory model, and equivalent panel theory model. The equivalent errors of different equivalent methods are obtained by comparison with the analysis results of real honeycomb panel model. Then, the sandwich panel theory and the Hoff theory with high precision are used to simulate the solar array panel. The two methods are further verified and compared by simulation and experiment. Finally, the sandwich panel theory with the highest accuracy is selected to simulate the vibration response of the solar array panel based on the above work. By comparing the frequency response analysis results with the test results, it is found that the maximum acceleration response error is within 7%, and the corresponding frequency error of the main direction is within 3%. The comparison between random analysis results and test results shows that the root mean square response errors of acceleration in three directions are within 13.7%. It is proved that the sandwich panel theory has high accuracy in the honeycomb structure. Based on the background of a specific space project, this study innovatively applies the test results to compare several typical equivalent theories of honeycomb sandwich panels so as to get a theory with the highest equivalent precision. The final conclusion has been applied to the design of related space products and proved to be feasible. This provides important reference and basis for the structural design of the satellite.
Keywords
Introduction
Composites are widely used because of their excellent mechanical properties. Many scholars have studied the vibration properties of composites. Wu et al. 1 –4 studied the mechanical properties and wave propagation characteristics of the composites enhanced by carbon nanotubes. Kim et al. 5 and Sankar et al. 6 studied the mechanical properties of composite structural materials. Li 7 , Wu, 8 and Fujii and Kikuchi 9 studied the topology optimization design of composite materials. There are also some scholars who have optimized the topologies of composite materials based on the propagation of heat and waves. It can be seen that the application and development of composite materials are now in full momentum. More and more industries are actively using composite materials to improve the mechanical properties of structures and achieve lightweight.
Nowadays, honeycomb sandwich panels are widely used, because they are suitable for many structures in practical applications. The most common type of honeycomb sandwich panels is the regular hexagon cell in the core layer. Due to its high specific strength, specific stiffness, and excellent insulation, vibration damping, and fatigue resistance, honeycomb sandwich panels have been widely used in the fields of shipbuilding, construction, transportation, construction, aerospace, and other fields. For example, a large number of aluminum honeycomb sandwich panels are used in aircraft. Due to its excellent mechanical properties and lightweight structural characteristics, the main panel structure of many spacecraft is composed of honeycomb sandwich panels. 10 –13 Generally, the mass of the honeycomb sandwich panels can account for 80–90% of the entire spacecraft panel structure. 14 –18
Since there is no honeycomb structure unit in current general aerospace product engineering software, such as Nastran, only the real physical model and the equivalent models based on equivalence theories can be used to simulate the structure with honeycomb sandwich panels. However, the modeling of three-dimensional models is more complicated, and the amount of calculation will be large due to the shape of the honeycomb panel. Therefore, the application of an equivalent panel model with a small amount of calculation is more common. 19 –26 There are three main equivalent theories currently: sandwich panel theory, honeycomb panel theory, and equivalent panel theory. Among them, the first method only changes the honeycomb core layer equivalently, while the other two equivalent methods make equivalent changes to the entire honeycomb sandwich panels. Since the equivalent methods and principles of the equivalent theories are all different, the effects of the geometrical structures of the different parts of the honeycomb panels on the equivalent parameters are also different. So, the equivalent parameters of the final equivalent theories have some differences, leading to that the equivalent accuracy of each equivalent model is different. Therefore, it is necessary to compare the equivalent methods of honeycomb sandwich panels.
For the study of equivalent methods and theories, Zheng et al. 20 applied the equivalent panel theory and sandwich panel theory to satellites. By comparing with analytical solution, the equivalent results were reasonable, and the two methods were basically identical. However, this article only draws reliable conclusions from the simulation results of the two equivalent theories, and does not widely consider many typical equivalent methods, nor does it compare which equivalent theories have higher equivalent accuracy. The results are not very scientific and extensive references. Xu Shengjin and Kong Xianren used the honeycomb panel equivalent theory to perform modal analysis on honeycomb panels. However, the research content only compared the results of an equivalent method and theoretical calculations. The equivalent accuracy of the equivalent method cannot be clarified, so the result is also incomplete. Xia et al. 27 used three methods to separately calculate the modal frequencies of the honeycomb panel and conduct comparative analysis. However, the above research only stays in the theoretical description of the equivalent methods and the amount of calculation of the final simulation, and does not fully compare the simulation results and the simulation accuracy of the three equivalent methods. Zhang et al. 28 contrasted the analysis results of the equivalent model and the real models. Although the comparison parameters are relatively abundant, the equivalent methods do not completely include the three equivalent theories and they need to be improved.
In this study, the finite-element models of the honeycomb sandwich panel are established according to the equivalent parameter expressions of the three equivalent methods. Then, the modal analysis of the three equivalent models and the real model established by the entity are analyzed and compared. So, the equivalent accuracy of the equivalent theories is evaluated comprehensively. The two equivalent theories with the most ideal equivalence are selected to be applied to the satellite solar array panel. The simulation results of modal analysis are compared with the panel test results, which prove that sandwich board theory is the most accurate equivalent theory. And then, sandwich panel theory is applied to solar array panel for dynamic analysis, and further experiments are used to verify the equivalent results. Finally, the scientific and complete comparison results of equivalent methods are obtained. This study innovatively compares the several typical equivalent theories of honeycomb sandwich panels and finally verifies the results with the test results. The theory with the highest equivalent accuracy is obtained. The resulting conclusion can provide reference for the subsequent application of equivalent method in honeycomb structure.
Introduction of equivalent theory
Honeycomb sandwich panels typically consist of upper and lower skin layers and an intermediate honeycomb core layer. The hexagonal honeycomb is widely used because of its simple manufacture, low cost, and high structural efficiency. This article focuses on the simplified panel model of a regular hexagonal aluminum honeycomb sandwich panel with uniform core thickness, as shown in Figure 1.

Structural composition of honeycomb sandwich panel.
Figure 1 shows the geometrical parameters of the honeycomb sandwich panel. In the figure, a is the board length of the honeycomb sandwich panel, b represents the width of the panel, hf represents the thickness of the single panel, hc represents the thickness of the core layer, t represents the thickness of the core wall, and L represents the edge length of the cell.
Sandwich panel theory
Sandwich panel theory is an equivalent method only for honeycomb cores. It is assumed that the core layer resists transverse shear deformation and has a certain in-plane stiffness. The upper and lower skin layers obey the Kirchhoff hypothesis, ignoring their resistance to transverse shears. The honeycomb core can be equivalent to a homogenous thickness-invariant orthotropic layer. Since only the hexagonal honeycomb is discussed, the equivalent material parameters for the core are as follows 29 –34

In the above expression, E, G, ρ, μ, respectively, represent the elastic modulus, shear modulus, density, and Poisson’s ratio, whereas the lower index s represents the elastic parameters of the core layer and the lower index c represents the elastic parameters of the honeycomb core layer. γ is a correction coefficient, which is generally 0.4–0.6, and t and L are consistent with the foregoing.
Honeycomb panel theory
The honeycomb panel theory is derived from the kinetic equation and Hamiltonian principle. In this theory, the whole structure is equivalent to an orthotropic panel with the same stiffness and size. Considering the in-plane and out-of-plane mechanical properties of the surface layer and the sandwich, assuming that the thickness of the surface layer of the honeycomb sandwich panel is d, the sandwich height is 2h, and the surface layer is great thinner than the whole panel. The equivalent result of the structure is shown in Figure 2. The black line represents the original structure of the honeycomb sandwich panel, and the red line represents the equivalent structure.

Structure before and after equivalence.
For convenience of research, it is assumed that they are all special orthotropic, that is, the coordinate main axis of the structure coincides with the natural coordinate axis. Considering the symmetry of honeycomb sandwich panels, the geometric midplane of honeycomb panels is chosen as the coordinate midplane, and the in-plane displacement of the midplane can be ignored in linear small deflection.
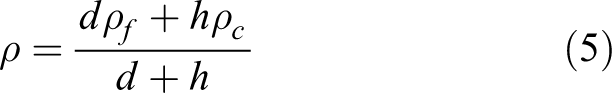
According to the above two criteria, the equivalent mechanical parameters can be determined as follows

Among them


The density expression is
The lower corner marked with f denotes the panel elastic parameters. k is the value of which is 0–1 according to the actual project or test, which indicates the influence degree of the lateral shear of the skin layers.
Equivalent panel theory
In the equivalent panel theory, the integral honeycomb sandwich panel is equivalent to isotropic material panel with different thickness. The expressions of the elastic modulus and thickness of the equivalent panel are derived based on the theory of constant stiffness. Then, calculate the density of the equivalent model according to the equal mass before and after the equivalent. 28
This theory is easy to implement, but it does not reflect the influence of the cross-sectional shape of the core layer on the overall structure.
As a curved panel, the Kirchhoff assumption of the small deflection panel should be met, that is
straight normal assumption;
omit the normal stress perpendicular to the panel;
there is no displacement parallel to the middle plane at all points on the middle plane of the panel.
The bending stiffness of panels can be obtained

where d is the thickness, E is the elastic modulus, and μ is the Poisson’s ratio of the thin panel.
As a plane stress panel, it only bears in-plane load, thus producing normal stress and shear stress, which are uniform along the thickness direction. Therefore, the stiffness of plane stress is obtained

Because of the equivalent basis between sandwich panels and single-layer panels, they have the same stiffness.
Reissner theory
According to the hypothesis of Reissner theory:
The surface panel is very thin, assuming that the stress is uniformly distributed along with the thickness, which means the surface is in the stress state of the film.
Since the sandwich is soft, the stress distribution parallel to the xy plane of the sandwich is ignored, that is, assuming
In the sandwich and the skin, the stress component is small, so it is assumed that
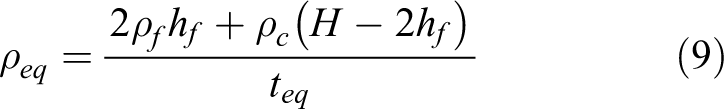
Bending moment and torque of aluminum honeycomb sandwich panel are mainly borne by isotropic surface layer, so bending performance can be considered as isotropic, while shear resistance is anisotropic. Therefore, the equivalent parameters can be solved as follows

At the same time, the density of the equivalent board can be calculated based on the unchanged mass before and after the equivalent
Hoff theory
According to the hypothesis of Hoff theory:
The panels are thin, assuming they are ordinary sheets.
Since the sandwich is soft, the stress distribution parallel to the xy plane of the sandwich is neglected, that is, assuming
In the sandwich and the skin, the stress component is small, so it is assumed that
The Hoff theory goes further than Reissner theory, and the stress on the surface panel is more complex, considering the bending stiffness of the panel. It is only necessary to make some modifications in the above-mentioned equivalent stiffness method based on the Reissner theory. Therefore, the equivalent parameters can be solved as follows
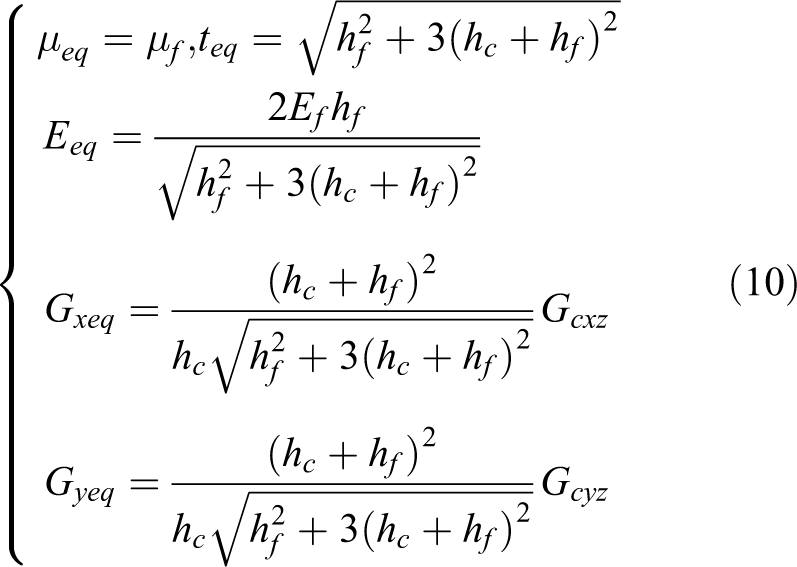
The density can be obtained according to the invariance of the mass before and after the equivalence

Comparison of modal analysis results
Since the content of this section is to compare the modal analysis results of the finite-element models based on each equivalent theory with the entity model of the honeycomb sandwich panel. It is necessary to establish five finite-element models, an entity finite-element model, and four equivalent models. The coordinate axis X is the direction along the short side of the substrate under the constraint state. The coordinate axis Z is a plane perpendicular to the substrate in a constrained state. The coordinate axis Y is the direction along the long side of the substrate under the constraint state, and the direction is the right-hand rule with the coordinate axis X and the coordinate axis Z.
Table 1 lists the material parameters and dimensions of each part of the honeycomb sandwich panel structure.
Geometry and material parameters of the honeycomb sandwich panel.

Elastic parameters extraction of equivalent models
Based on the actual size of the honeycomb panel, the input parameters of the materials and properties of each model are calculated according to the parameter formula of the equivalent theories. After establishing various finite-element models, they are, respectively, substituted into the respective models to set parameters. Finally, the modal analysis simulation is performed in the MSC Nastran software environment. The equivalent parameters of each equivalent model are given in Table 2.
Equivalent parameters of the equivalent theories.

Comparison of modal analysis results
If the natural frequency of the object is the same as the frequency at which the excitation is applied, then resonance will be induced and cause serious deformation or even destruction of the object. The purpose of modal analysis is to identify the natural frequency of the structure. The modal frequencies, especially the fundamental frequency, can better reflect the inherent properties of the mechanical structure. Therefore, the results of modal analysis can better reflect the dynamic performance of the mechanical structure. 35
Three methods for solving modal eigenvalues are provided by MSC Nastran software (MD NASTRAN 2011.1.): tracking method, transformation method, and Lanczos method. The Lanczos method used in this article is most effective in calculating the eigenvalue problem of very large sparse matrices. 36
Through modal analysis, the fundamental frequency and the 6th to 10th order typical frequencies of the honeycomb sandwich panel and its equivalent models are obtained. The results are listed in Table 3, where the error value is the absolute value of the error. The first-order modal vibration cloud diagram of each equivalent model is shown in Figure 3.
Comparison of modal fundamental frequencies and modal typical frequencies of the model.

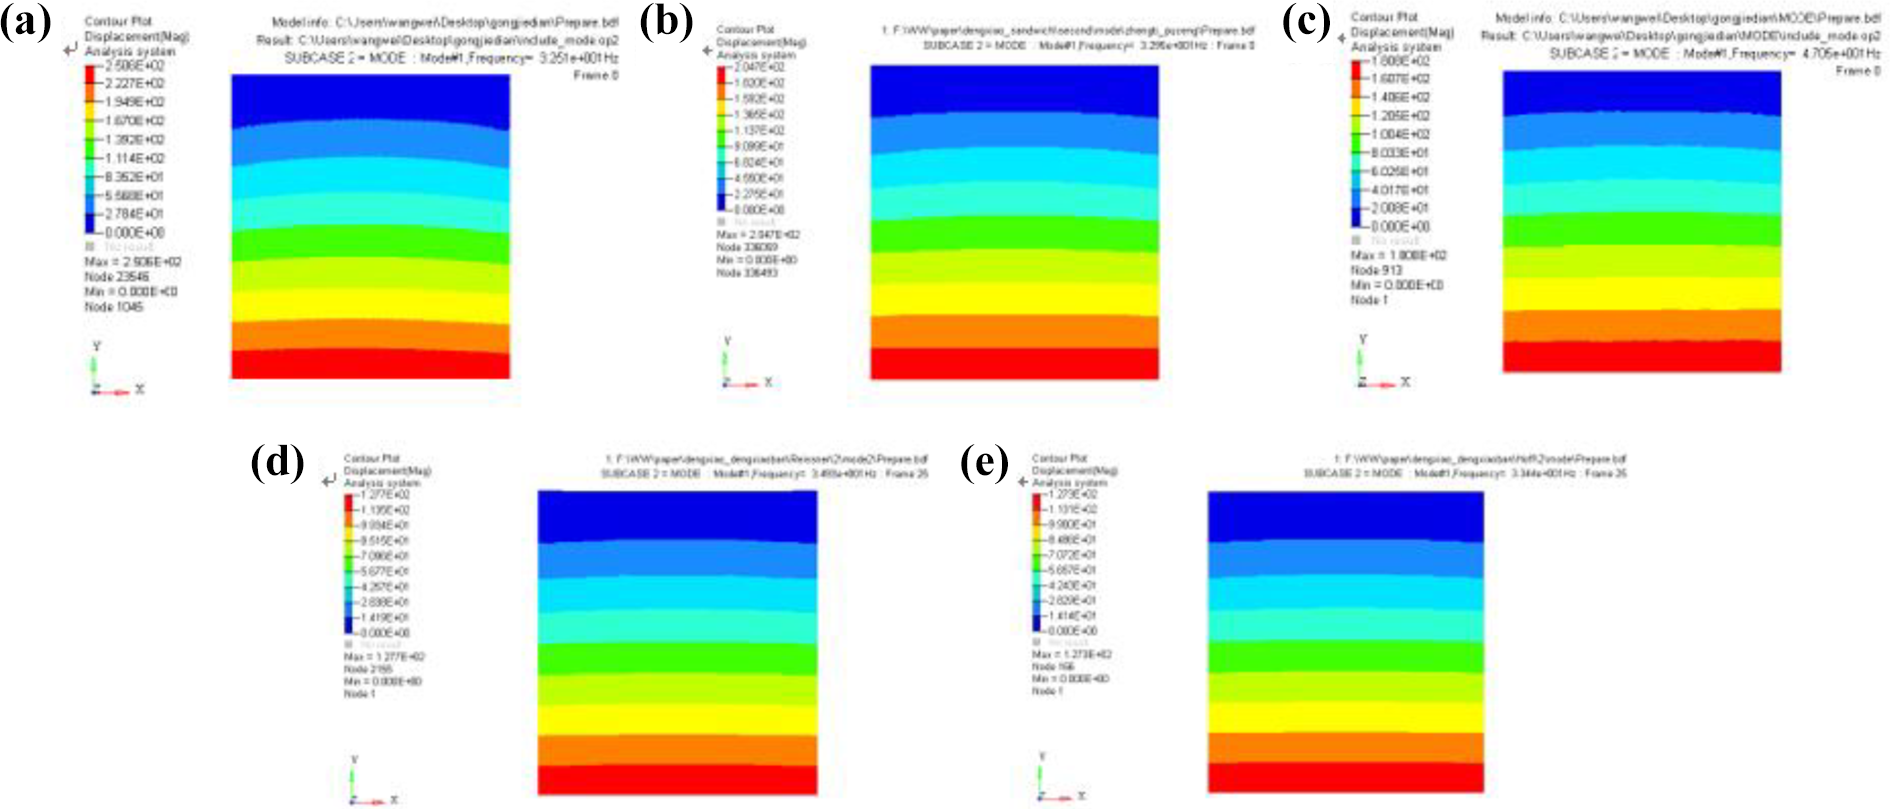
The first-order modal shape nephogram of each model: (a) Honeycomb sandwich panel model, (b) sandwich panel theory model, (c) honeycomb panel theory model, (d) Reissner theory model, and (e) Hoff theory model.
From the comparison of the fundamental frequencies and typical frequencies of the above models, it can be seen that the fundamental frequency error of sandwich panel model is the smallest with 1.353% compared with the original model. Relatively speaking, the models of honeycomb panel theory, the Reissner theory, and Hoff theory have larger fundamental frequency errors, in which the honeycomb panel theory model has the largest error, which is 47.05%. The errors of Reissner theory model and Hoff theory model are 14.149% and 7.413%, respectively. The response distribution trend of fundamental frequency of each equivalent model is generally consistent. From the 6th to 10th orders of high-order typical frequencies, the frequency errors of each order of the sandwich panel model are less than 9%, and the frequency errors of other equivalent models are relatively larger. In general, sandwich panel theory is more accurate in equivalence, with less error, while other equivalent theories have a larger error, and the equivalent effect is not as good as sandwich panel theory.
Comparison of the application of equivalent theories to solar array panel
The foregoing shows that the sandwich panel theory has the highest equivalent accuracy, followed by the Hoff theory. To further verify the reliability of their equivalent performance on the solar array panel, it is necessary to apply sandwich panel theory and Hoff theory to the solar array panel structure and carry out modal simulation analysis according to the specific structure and boundary conditions of the solar array panel. Through test verification, it can be a vital reference for the application of the equivalent theories of honeycomb sandwich panels on solar array panel. 37
The overall structure of the solar panel is a honeycomb panel surrounded by carbon fiber frames. Honeycomb sandwich panel structure usually consists of two high-strength surface layers and a honeycomb interlayer. The surface layer is usually made of carbon fiber composites, and the interlayer is an aluminum honeycomb structure. The panel is surrounded by frames and there are four locking devices in the middle. The details are shown in Figure 4.

Structure diagram of panel.
Application of equivalent theories
Application of sandwich panel theory
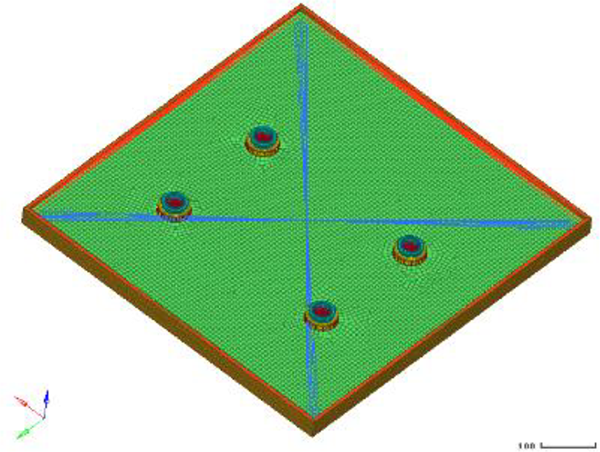
According to the actual engineering situation, the solar array panel is composed of frames, a core layer, upper and lower panels, and locking devices of the panel. The four corners are usually fixed by hinges, so four fixed points are used during the actual simulation and testing. The finite-element simulation of the core layer is based on the equivalent parameters obtained in Table 1, and other components maintain the raw material and structural properties, and the finite-element modeling of the sandwich panel theory can be completed, as shown in Figure 5.
Finite-element model of sandwich panel theory.
The modal analysis of the equivalent finite-element model gives the first five frequencies and mode shapes, as given in Table 4.
The first five modal frequencies and modes of sandwich panel theory.

The first two vibration modes of sandwich panel theory model are shown in Figure 6.

The nephograms of sandwich panel theory: (a) the first order and (b) the second order.
Application of Hoff theory
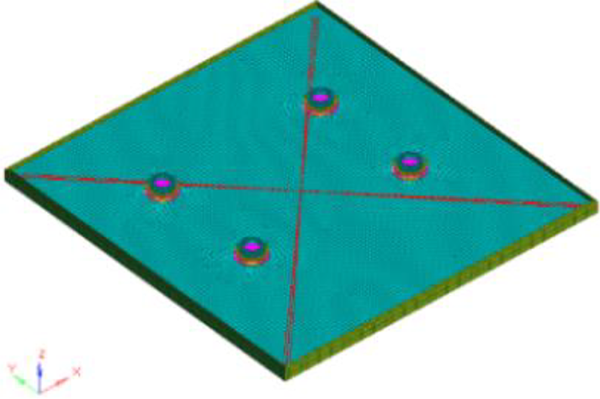
Using the Hoff theory, the core layer and the upper and lower panels of honeycomb are equivalent as a whole. The locking devices of the panel and frames do not change. Consistent with sandwich panel theory, four-point fixing is used. Other components maintain raw material and structural properties. The equivalent modeling is completed based on the elastic parameters in Table 2. The finite-element model is shown in Figure 7.
Finite-element model of Hoff theory.
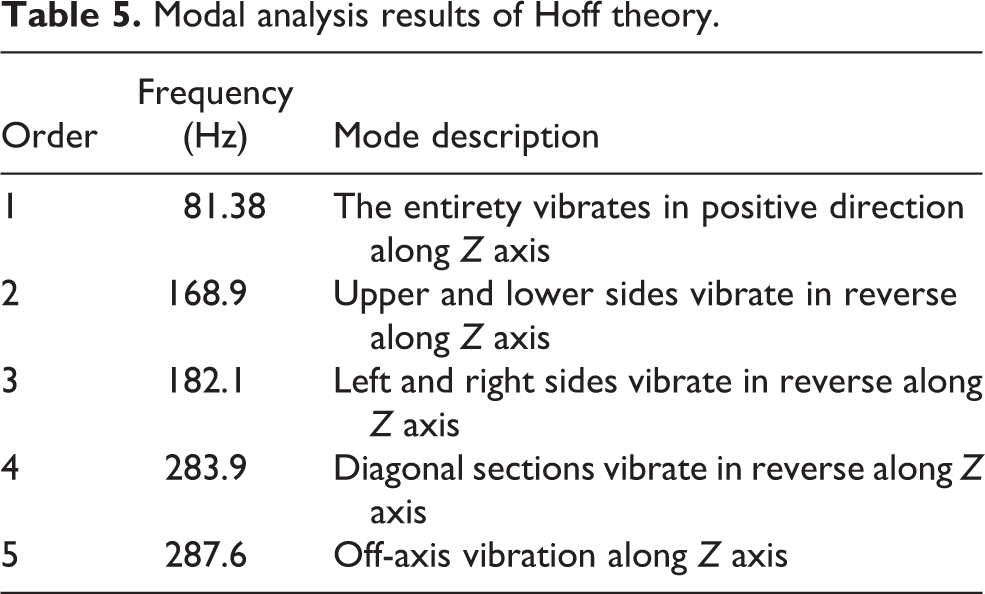
The first five-order frequencies and vibration modes of Hoff theory can be obtained in Table 5.
Modal analysis results of Hoff theory.
The first two vibration modes of Hoff theory model are shown in Figure 8.

The first two modes of Hoff theory: (a) the first order and (b) the second order.
Test verification
The modal test of the solar array panel is performed using LMS (LMS Test.Lab is a complete set of vibration and noise test solutions belonging to Siemens Company) test equipment, including data acquisition systems, hammers, sensors, and cables. The arrangement of the actual measuring points and the connection of the sensor installation are shown in Figure 9. The location where the hammer is actuated by the hammering method is near the measuring point in the center of the panel. Each measurement point has three degrees of freedom. The sensor uses a model 4524-B accelerometer (Brüel Kjæ 4524-B is an ultra-light three-axis piezoelectric OrthoShear®accelerometer. Each model provides three separate outputs for simultaneous measurement in three mutually perpendicular directions. Type 4524-B has a 4-pin connector) with a sensitivity of 100 mV/g. To protect the product, paste 3M tape on the product when pasting the sensor. In the test, the panel is constrained and pressed on the fixture. The tooling clamp is fixed with the rigid platform by bolts, and the panel is in a horizontal state and faces upward. The sensor port is connected with the signal acquisition system through a cable for signal transmission. Acquisition system sends output signal to the PC side for data processing. The test status is shown in Figure 10.

Measurement point and sensor arrangement of solar array panel.

Test state of solar array panel.
The test results obtained are given in Table 6.
The first five modal frequencies and modes of test.

The first two vibration modes of modal test are shown in Figure 11.

The first two modes of modal test: (a) the first order and (b) the second order.
Comparison of modal results
According to the simulation results and test results in the previous chapters, the equivalent conditions of modal frequencies and modes can be obtained by comparison. The frequency errors of each order are shown in Figure 12.

Comparison of simulation and test modal frequencies.
Comparing the simulation results with the test results, in the sandwich panel theory model, the error of the fundamental frequency is the smallest, which is 0.1%. The error of the fifth-order frequency is the largest, which is 10.7%. The first two vibration modes of the modal analysis result of simulation and experiment are the same. The fundamental frequency error of Hoff theory is 0.5%, which is the smallest among the first five modal errors. The fourth-order frequency error is the largest at 37%. The comparison of vibration mode nephograms shows that the fundamental frequency nephogram is consistent with the test, and the second-order nephogram is different from the results of the test.
It is easy to see from the modal results that the equivalent precision of each order frequency of sandwich panel theory is higher and the simulation result of vibration model is better. Therefore, combined with the simulation comparison results in the previous chapter, it is verified that the equivalent results of sandwich panel theory in the equivalent theories are the best. This made necessary preliminary preparation for the in-depth study of honeycomb panel structure in the solar array panel.
Dynamics analysis of solar array panel and its test verification
Due to the complex load of the solar array panel, it is necessary to further analyze the dynamics of the entire machine and check the final response to ensure the safety and reliability of the satellite product after the research and verification of the panel.
Dynamic analysis of solar array panel equivalent model
The dynamic analysis of the structure is to determine the influence of time-varying loads on the whole structure or components under the influence of damping and inertial effect. In the process of satellite launch and deployment, the load is complex and changeable, and coupled with its own mechanical characteristics, such as large structural span, and it is very necessary to carry out load simulation on the satellite to check the dynamic response.
Based on the content of the previous chapter, sandwich panel theory is selected as the final equivalent theory to simulate the solar array panel. The equivalent finite-element model of sandwich panel used in modal analysis is used. Finally, the sine sweep response and random response results in three directions are obtained.
Frequency response analysis of solar array panel
During the rocket’s ascent, the solar array panels are fixed to the satellite in a folded state. Under dynamic load conditions where the input acceleration varies with frequencies, the modal response method is used to examine the mechanical characteristics using a three-direction frequency response analysis. According to the actual load conditions, only the acceleration response within 100 Hz needs to be considered. The following Table 7 gives the sine sweep conditions.
Input conditions for vibration excitation.

The maximum acceleration response in the X, Y, Z directions is given in the following Table 8.
Maximum acceleration response.

The nephograms of acceleration response in three directions are shown in the following Figure 13.

The maximum acceleration response of the (a) X direction, (b) Y direction, and (c) Z direction.
Random response analysis of solar array panel
In the complex environment of aerospace, there are random vibrations that cannot be described by a deterministic function but have certain statistical laws. To meet the space launch requirements, these uncertain mechanical vibrations need to be simulated and analyzed. According to the characteristics of vibration, the vibration acceleration response with only vibration frequency within 2000 Hz should be concerned. The power spectral density loaded in different vibration frequency ranges is listed in Table 9.
Loaded power spectral density.
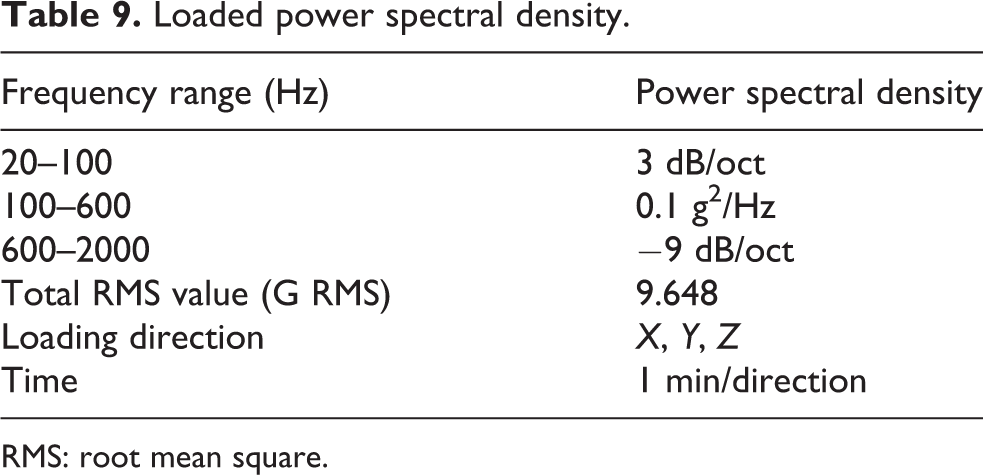
RMS: root mean square.
According to the previous analysis work experience and the results of the simulation cloud image, the center point of the honeycomb sandwich panel model is selected as a reference node for comparison.
The acceleration response cloud image and response curves in the three directions are shown in Figures 14 –16.

Acceleration response of random excitation in x direction: (a) the responsive cloud image and (b) the responsive curve.

Acceleration response of random excitation in y direction: (a) the responsive cloud image and (b) the responsive curve.

Acceleration response of random excitation in z direction (a) the responsive cloud image and (b) the responsive curve.
In the above analysis of random vibration excitation in x, y, and z directions, we can know from the response nephograms that the acceleration response values of the three directions in the middle position of the solar array panel are the largest, and their values are, respectively, 45.8, 45.1, and 45.2 g.
Take the center of the board as the reference node (node 4124572). From the response curve of the reference node in three directions, it can be seen that the acceleration response exhibits multiple large peaks in the frequency range of 600–1000 Hz, and the energy is relatively concentrated and the response distribution at different frequencies fluctuates. The maximum root mean square (RMS) value of the acceleration response of the reference node in the middle position of the solar array panel under random vibration excitation and its magnification are given in the following Table 10.
RMS value of power spectral density response.

RMS: root mean square.
Dynamics test of solar array panel
Aerospace products will undergo the final test before launch. The test will strictly simulate the specific working conditions when launching and fully consider the loaded complex environment, so the response results obtained from the test are generally regarded as the most reliable standard to measure the design quality. Aiming at the above dynamic simulation, the dynamic test of satellite solar array panel is further completed. By comparing with the analysis results, the equivalent error of finite-element model can be obtained, and the equivalent accuracy of sandwich panel equivalent theory can be evaluated scientifically.
Frequency response test of solar array panel
The frequency response of the solar array panel is tested. Fix the whole machine on the vibration table and apply the same boundary conditions as the frequency response analysis. Focus only on the maximum acceleration response in three directions within 100 Hz. Figure 17 shows the test state of frequency response and the arrangement of measurement points in the horizontal and vertical directions, respectively.

Frequency response test state: (a) the test status in X and Y directions and (b) the test status in Z direction.
According to the response results, the results of the maximum acceleration responses in all directions are given in Table 11.
The maximum acceleration response results of the test.

By comparing the test results with the simulation results of frequency response, the errors of the maximum acceleration response and its corresponding frequency are calculated. The results are also given in Table 11.
The maximum acceleration simulation response curves in three directions of the center of the panel and the middle position of the short frame are compared with the response curve of the test result, as shown in Figures 18 –20.

X direction: (a) simulation and (b) test results.
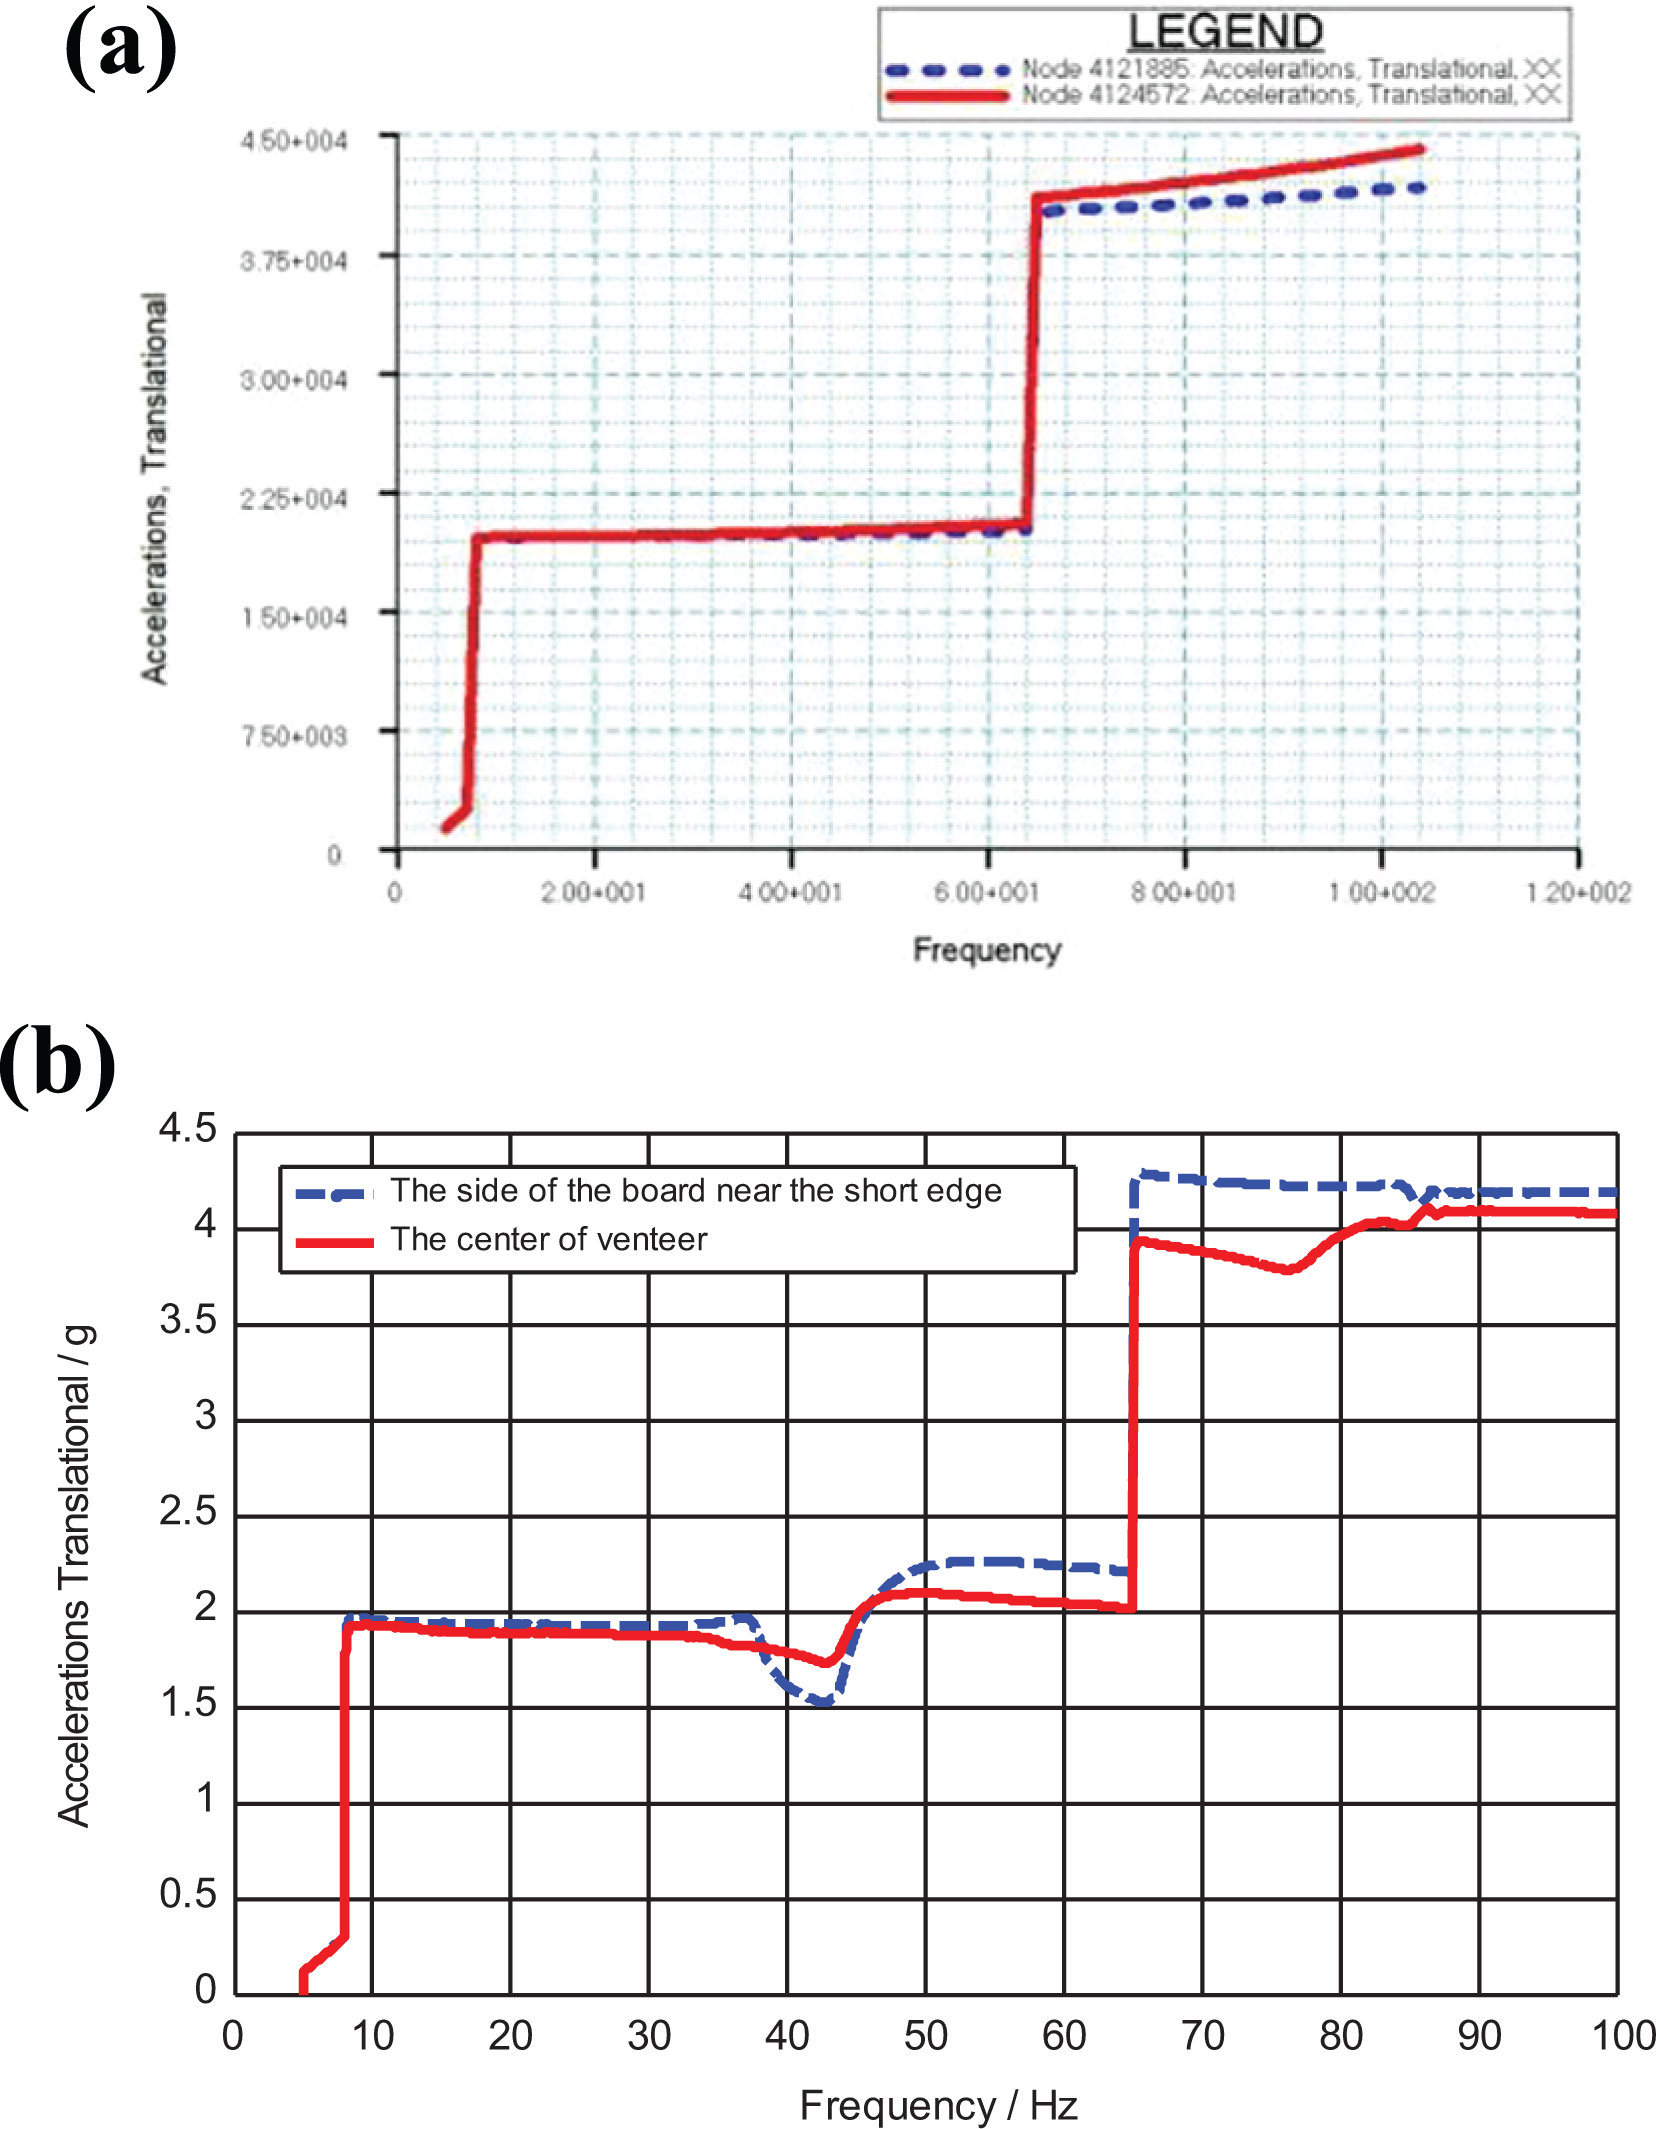
Y direction: (a) simulation and (b) test results.

Z direction: (a) simulation and (b) test results.
By comparing the simulation results with the test results in three directions, we find that the maximum acceleration response errors in three directions are within 7%, and the frequency error corresponding to the main loaded Z direction is less than 3%. The equivalent result is very satisfactory. After observing the maximum acceleration response curve, it can be seen that the acceleration response trends in the three directions are approximately the same. The response peak at 65 Hz in the Y direction is due to load fluctuations.
Random response test of solar array panel
After the frequency response test, a random test is performed on the solar array panel. The test state is consistent with the frequency response test and applied the same boundary conditions as random analysis. Focus only on the maximum acceleration response and RMS values in the three directions within 2000 Hz.
The acceleration RMS response curve of the center point of the single board in the X, Y, and Z directions obtained by the random test is shown in the following Figure 21.

Acceleration response curve of random excitation in (a) X direction, (b) Y direction, and (c) Z direction.
The maximum RMS value and magnification rate of acceleration response in three directions of reference nodes on the solar array panel under random vibration excitation are given in the following Table 12.
RMS value of power spectral density response.

RMS: root mean square.
According to the comparison between simulation and test results of the maximum RMS value of acceleration of random vibration responses in three directions, it is found that the RMS response error of the reference node in the three directions is within 11%, among which the error of Z direction that is mainly considered is 0.7%, and the equivalent result is ideal. In conclusion, sandwich panel theory can precisely analyze the dynamic response of satellite solar array panels. In the design process of satellites, this method can save time and reduce the cost of research and development while ensuring the accuracy and reliability of the results.
Conclusion
To simplify the calculation by selecting the appropriate equivalent theories in the analysis of honeycomb panel structure in satellite solar array panel, the modal comparison analysis is made between the models of sandwich panel theory, honeycomb panel theory, equivalent panel theory, and honeycomb panel firstly. Secondly, the theories with the higher equivalent accuracy are applied to the solar array panel for modal analysis, and the modal frequencies and vibration modes are compared with the test results for further verification. Finally, the most selective equivalent theory is applied to the satellite solar array panel for dynamic response analysis, and the analytical response results are compared with the test results. The final result shows the following: The results of comparative analysis of the equivalent theories show that the sandwich panel theory has the highest equivalent accuracy, followed by the Hoff theory. The comparison between the simulation results and the test results of the panel shows that the equivalent results of sandwich panel theory are better than those of Hoff theory, and the accuracy of each mode frequency and mode shape is higher. Comparison of the equivalent model modal simulation and test results of the solar array panel shows that sandwich panel theory can simulate the mechanical properties of the solar array panel with high accuracy. By comparing the dynamic simulation of sandwich panel theoretical model with the test results, the sandwich panel theory can accurately simulate the dynamic response of the solar array panel structure.
In this article, the equivalent performance of the equivalent theories is verified step-by-step through the simulation analysis of the equivalent theories and experiment on solar array panel. It is verified that the sandwich panel theory applied to satellite solar panel has the highest dynamic equivalent accuracy among the four equivalent theories, which is most suitable for analysis research and simplified calculation. This conclusion provides an important reference and basis for the design and research of honeycomb panel structure on satellite solar panels.
Since this study is based on the specific space project background, including the loading conditions and structure size, the conclusions obtained from this study are very applicable to a batch of related space products. According to the current application and feedback results, the conclusion of this study has been successfully applied to some projects, improving the efficiency of design and research. On the other hand, the conclusion of this article is proved to be reliable and feasible. Therefore, for the space products that are consistent with or similar to the target structure and design studied in this article, the conclusions obtained in this article can be referred to and applied.
Footnotes
Declaration of conflicting interests
The author(s) declared no potential conflicts of interest with respect to the research, authorship, and/or publication of this article.
Funding
The author(s) disclosed receipt of the following financial support for the research, authorship, and/or publication of this article: This research was financially supported by the National Natural Science Foundation of China [Nos 51975567 and 51505470); Liao Ning Revitalization Talents Program [XLYC1907152]; Natural Science Foundation of Liaoning Province [2019-MS-347]; State Key Laboratory of Robotics [Y7C1207]; Youth Innovation Promotion Association, CAS [No.2018237]; and Jiang Xin-song Innovation Fund [No. 20180504].