
Abstract
The aim of this study is to investigate the global buckling of a relatively long composite cord–rubber tube subjected to axial compression and its cross-sectional instability due to bending by a macromechanical nonlinear finite element (FE) model (nonlinear buckling analysis). Composite reinforcement layers are modelled as transversely isotropic ones, while elastomer liners are described by a hyperelastic material model that assumes incompressibility. Force–displacement, equivalent strain, equivalent stress results along with oblateness and curvature results for the complete process have been presented. It is justified that bending leads to ovalization of the cross section and results in a loss of the load-carrying capacity of the tube. Strain states in reinforcement layers have been presented, which imply that the probable failure modes of the reinforcement layers are both delamination and yarn-matrix debonding. There is a significant increase in strains due to cross-sectional instability, which proves that the effect of cross-sectional instability on material behaviour of the tube is crucial. A parametric analysis has been performed to investigate the effect of the member slenderness ratio on cross-sectional instability of the composite tube. It shows that Brazier force is inversely proportional to the slenderness ratio. It further shows that higher oblateness parameters occur in case of a lower slenderness ratio and that cross-sectional instability takes place at a lower dimensionless displacement in case of a lower slenderness ratio. FE results have been validated by a compression/bending test experiment conducted on a tensile test machine.
Keywords
Introduction
Polymer-based composite tubes are utilized in numerous industrial fields such as in transportation, oil industry, aeronautical and aerospace applications due to their high specific strength, high specific stiffness and corrosion resistance. 1
The most extensively utilized fabrication technique of composite tubes is filament winding because of high fibre precision, high fibre content, low void content and because of being well-suited to automation. 2 The most commonly encountered operational loads are uniaxial tension, internal pressure, biaxial tension (combined uniaxial tension and internal pressure) and bending. 3 The optimal winding angle depends on the expected load cases. The most frequently applied conventional winding angle is ±55°, which is the optimal one related to biaxial tension, where the hoop-to-axial stress ratio is 2:1. If only internal pressure is applied, the optimal conventional winding angle is considered to be ±75°, whereas in case of pure uniaxial tension, winding angle needs to be as low as possible for manufacturing considerations. 4 However, Almeida et al. 5 have created an optimized stacking sequence for filament-wound composite tubes under internal pressure based on a genetic algorithm for progressive damage by considering a 10-layer composite tube. Their results 5 have shown that non-conventional ply angles might improve pressure strength compared to conventional ones. The rubber matrix provides the composite material with favourable deformability, high flexibility and toughness. Composite tubes are subjected to bending many times during their lifetimes, which might result in a so-called Brazier instability, possibly leading to failure in extreme cases.
The Brazier effect first described by Brazier, 6 characteristic of long elastic tubes, is a form of ovalization instability, which when combined with local bifurcation buckling, causes a significant drop in stiffness and load-bearing capacity. 7 Material damage may occur during the Brazier-buckling process. ‘It is possible, however, for a cylinder to buckle elastically without material damage if the buckling strains remain sufficiently small’. 8
In case of a certain curvature, ovalization minimizes the internal energy state of the tube. As the cross section of a cylindrical tube flattens, the moment of inertia is reduced; therefore, the required bending moment increases by a decreasing slope, until a limit point is reached, and the maximum moment is often referred to as Brazier moment. 9
Ovalization often coincides with local buckling, 9 which is assumed to occur when the maximum compressive stress reaches the uniform compression critical value for a circular tube of radius equal to the local radius of the ovalized shell at the ‘critical’ point. 7
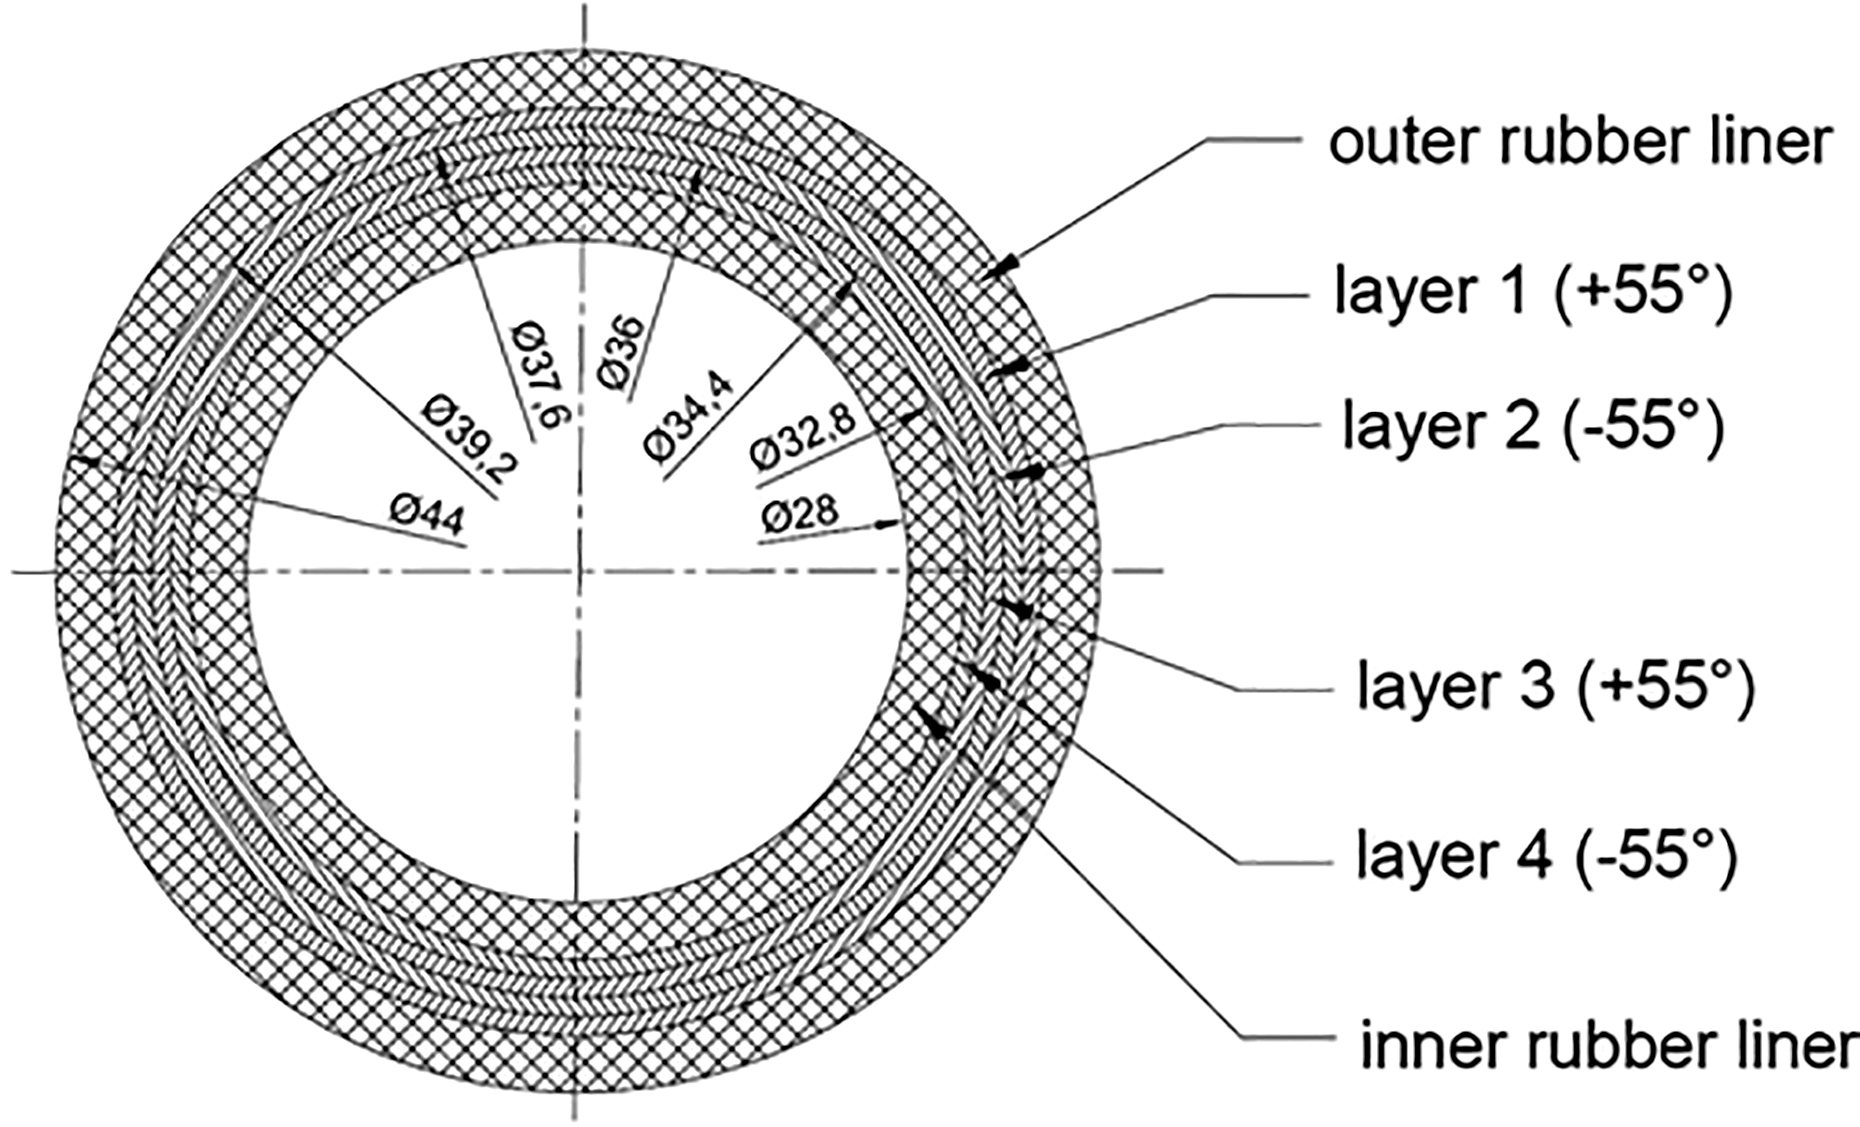
The general structure of composite tubes can be observed in Figure 1. The angle of yarns and the axis of the tube is the winding angle (or orientation angle) ω. Orientation angles of adjacent plies (α 1, α 2) are opposite in most cases (α 1 = −α 2).

Structure of the composite tube.
In a fibre coordinate system, material direction 1 denotes the direction of yarns or grainline (x 1(1) for layer 1 and x 1(2) for layer 2 in Figure 1) and material direction 2 stands for the transverse direction within the ply (x 2(1) for layer 1 and x 2(2) for layer 2 in Figure 1).
Bending of composite tubes and cylinders has been in the focus of numerous studies since the appearance of composite structures. Firstly, Lehnitskii 10 has approached the bending of cylindrically anisotropic cantilevers and has determined stress distribution in a single-layered anisotropic tube along the radius. Jolicoeur and Cardou 11 have presented an analytical solution to a single-layered orthotropic tube subjected to tensile, torsion and bending loads. Chouchaoui and Ochoa 12 have elaborated the governing equations for the bending of a multilayered composite tube by extending Jolicoeur’s solution. 11 Tarn and Wang 13 have utilized a state space approach to determine displacements and stresses, thus reducing the number of equations necessary to obtain a solution. Bending behaviour of thick-walled composite tubes has been examined by Geuchy Ahmad and Hoa, 14 who provided an estimation for the bending stiffness of composite tubes as verified by a pure bending test.
Mamalis et al. 15 have reported on bending of thin-walled composite tubes with special emphasis on crashworthiness and energy absorption capability. They have described the collapse mechanism and failure modes and strength characteristics as well, based on bending test experiments.
Fuchs and Hyer 16 have presented a theory for computing linear displacement and stress response of symmetrically laminated composite tubes under bending load. The analytical model is properly applicable to obtain a closed-form geometrically linear mechanical response of composite tubes under bending.
Fuchs et al. 8 have extensively dealt with the buckling of thin-walled composite tubes subjected to bending. It is mentioned that three classical collapse modes are related to bending of anisotropic tubes (Figure 2); for relatively short cylinders, sudden bifurcation buckling occurs on the compression side of the cylinder, for long cylinders; cross-sectional instability may arise due to the flattening or ovalization of the cross section; whereas for cylinders of intermediate length, local buckles emerge due to the interaction of both collapse modes. The point of instability has been presented; buckled shapes, deflection patterns and strain profiles have been presented for short and relatively long tubes as well. 8

Cylinder bending collapse modes. 8 (a) Compression buckling mode of short cylinder; (b) cross-sectional collapse mode of long cylinder; (c) interaction for cylinder of intermediate length.
When tubes are subjected to high compressive axial forces, global buckling occurs. ‘Global buckling is a buckling mode where the member deforms with no or negligibly small deformation in its cross-sectional shape’ 17 . Silvestre 18 has studied the non-classical effects (elastic material couplings, warping and shear deformation) on the structural behaviour of fibre-reinforced plastic (FRP) composite tubes by utilizing the generalized beam theory, unveiling the roots of linear coupling between different mode classes. If global buckling does not result in material failure (if a structure is flexible enough), the structure (e.g., a tube) is still able to bear load.
Almeida et al. 19 have investigated axial compression of composite variable axial tow cylinders by conducting linear and nonlinear buckling analyses. They further exploited buckling results for the optimization of thickness and fibre angle to sustain increased buckling loads.
Ford et al. 20 have addressed delamination failure of symmetric two-ply cord–rubber specimens subjected to uniaxial tension by a simplified axisymmetric finite element (FE) model. They have proven that delamination failure is linked to interlaminar shear strain γ 13. Delamination is attributed to higher interlaminar shear strain-to-longitudinal normal strain ratios (γ 13/ε 1). 20 Lou and Walter 21 have conducted interlaminar shear strain measurements in two-ply cord–rubber composites subjected to tension. Their results have shown that interlaminar shear strain-to-longitudinal normal strain ratios are higher if Ef /Em ratio (modulus of elasticity of fibre and matrix) is higher. Rao et al. 22 have dealt with failure behaviour of cord–rubber tire belts by a micromechanical model. Their results have shown that delamination plays an important role in failure of cord–rubber tires.
Hutapea and Pizhong 23 have determined in-plane shear moduli of composites with fibre–matrix debonding. They have demonstrated that in-plane shear and intralaminar shear strain are in connection with fibre–matrix debonding.
This article aims to investigate the global buckling of thick-walled filament-wound composite tubes subjected to axial compression and to examine cross-sectional instability due to bending, particularly to obtain nonlinear displacement, strain and stress response by an FE model created in Ansys Academic Research 17.2.
FE modelling
The geometry of the filament-wound composite tube can be observed in Figure 3. The tube consists of reinforcement layers and of inner and outer rubber liners. Reinforcement layers can be characterized by a balanced, symmetric layup [+55/−55/+55/−55] [˘] according to the manufacturer. The tube is 620 mm long, having an inner diameter of 28 mm and an outer diameter of 44 mm.
Cross section of the tube. 24
The material model of reinforcement layers is transversely isotropic, which is a special case of linear orthotropy.
Orthotropic materials have three mutually perpendicular planes of symmetry. Filament-wound composite tubes, with their fibres aligned uniaxially, are usually regarded as transversely isotropic because the plane perpendicular to the fibre direction is a plane of isotropy (E 2 = E 3, G 12 = G 13, υ 12 = υ 13). Transversely isotropic materials have five independent elastic constants (E 1, E 2, G 12, G 23, υ 12). 25
The material properties of components of reinforcement layers are as follows: the modulus of elasticity of the fibre is Ef = 2961 MPa; the Poisson’s ratio of the fibre is supposed to be υf = 0.2; the modulus of elasticity of rubber matrix is Em = Er = 6.14 MPa; and the Poisson’s ratio of the rubber matrix is supposed to be υr =0.5. 24
By using these parameters, the material properties of reinforcement layers are the following: E 1 =1338 MPa, E 2 = E 3 = 19 MPa, G 12 = G 13 = G 23 = 6 MPa, υ 12 = υ 13 = 0.37, υ 23 = 0.498. 24
Rubber liners, made of ethylene-propylene-diene-monomer-ethylene-vinyl acetate (EPDM-EVA) compound, are described by a two-parameter Mooney–Rivlin model, 24 whose parameters are the following: C 10 = −0.4982 MPa, C 01 = 1.523 MPa, D = 0 [1/MPa]; therefore, the liners are considered as incompressible. 24
These material parameters have been validated previously by uniaxial tensile tests carried out on standard test specimens and tube pieces 24 and also by three-point bending tests and standard bending tests (in accordance with literature 26 ) presented in Szabó et al. 27 ; therefore, it is sufficient to describe the material behaviour of rubber liners with a two-parameter Mooney–Rivlin model. The cross section of the tube can be observed in Figure 4.

Cross section of the tube (photograph).
The FE model is a three-dimensional full model. The geometric model, the lateral section of which is shown in Figure 5, consists of the tube and the pins utilized for positioning the tube during the bending process leading to cross-sectional instability. Rubber is vulcanized around yarns (Figure 4), so the connection of inner and outer rubber liners to reinforcement layers is modelled as bonded. There are bonded/frictional contacts between the inner lateral surface of the tube and the pins utilized for positioning the tube (the contact is frictional at the fillets of the pins, otherwise, bonded contact is defined); 70-mm long sections of the pins lay inside the tube. These pins, being rigid bodies, have holes, the centres of which serve as remote points for positioning the tube during the bending process; the distance between the centre of a hole and the base of the tube is 50 mm on each side.

Lateral section of the meshed geometry of the composite tube.
The FE model consists of 46,700 elements (8-node SOLID185 elements), with 62,400 nodes, with large-strain formulation.
Compression followed by bending has been carried out by the prescribed displacements of the remote points of the positioning pins; therefore, the simulation is displacement controlled. The left remote point translates 635 mm in positive X direction during 58 time steps (approximately 11 mm in each one), while the right remote point maintains its X-coordinate in the course of the simulation. Both remote points can rotate around Z axis but cannot translate in directions Y and Z; moreover, their rotation around X and Y axes is not possible either (Figures 5 and 6) throughout the bending process. The FE boundary conditions completely match those of the compression test experiment.

Displacement control of the nonlinear buckling simulation.
The FE simulation is a nonlinear buckling analysis, the method is analogous to Almeida and coworkers 19,28 using nonlinear static solver (Newton–Raphson procedure) combined with the modified Riks method (also known as the arc-length method). The initial global geometric imperfection has been a deflection of L/200 (Figure 6; L designates the overall length of the tube), determining the initial curvature of the tube at the beginning of the nonlinear buckling analysis.
Linear (eigenvalue) buckling analysis has been carried out to study the global buckling of the tube due to axial compression. The boundary conditions are the same as in the case of nonlinear buckling simulation, and the initial imperfection has not been taken into consideration. Lanczos Eigensolver has been used for obtaining linear buckling load. In general, linear buckling analyses, in which material properties and contact conditions are regarded as linear, serve as a means of determination of the theoretical critical force of a structure. 29 Nonlinear buckling analyses predict critical force more accurately; therefore, they are widely used in engineering practice. 30
The nonlinear buckling FE model presented above can represent the mechanical behaviour of the tube both in the compression phase (global buckling) and in the bending phase (cross section instability).
Compression test
For experimental validation, compression tests have been carried out on a Zwick Z 250 tensile testing machine with a compression speed of 100 mm/min (Figure 7). The applied preload has been 1 N. The upper tensile jaws have travelled 635 mm in the course of the experiment, while the lower tensile jaws have held their position. Compressive forces have been measured throughout the experiment.

Deflected composite tube at a vertical displacement of 350 mm.
The tube is connected to the tensile testing machine by a fixing assembly (Figure 8). A pin (2) is inserted and bonded into the tube (1). An axle (3) is placed inside the hole of the pin. The pin can rotate around the axle; two deep-groove ball bearings (4) ensure that friction in the axle-pin connection is almost negligible. The axle is fixed axially into a grip fork, consisting of a lug (5) and a crosspiece (6) joined together by screws (7) and retaining rings (8). A square-sectioned bar (9) welded to the crosspiece is utilized for fixing the assembly between the tensile jaws. The testing assembly is a non-sway structure because the square-sectioned bar (9) is fixed between the tensile jaws.

Cross section of the fixing assembly, all the dimensions are expressed in millimeters.
Results and discussion
The upper tensile jaws have travelled 635 mm in the course of the experiment until cross-sectional instability.
Figure 9 shows the compressive force results of the compression experiment as a function of the displacement of the crosshead along with the forces in direction X (Figure 5) arising at the left remote point in the FE simulation.

Compressive force–displacement curves during the compression experiment and the corresponding simulation results.
In Figure 9, the linear buckling force, shown by orange, is also illustrated (9.81 N), being much higher than the measured data and nonlinear results, similarly to Lindgaard et al. 30 Contrary to the linear buckling results, nonlinear buckling results are close to experimental results apart from being slightly different at the vicinity of global buckling (approximately 10 mm displacement) followed by a long phase, in which experimental and nonlinear simulation results have the same tendencies. The determined critical force is 6.9 N (see Figure 9), which is in good agreement with the change in the tendency of the force–displacement curve of the experiment.
Cord–rubber tubes are flexible; therefore, maintaining the axial force initiates the bending of the tube, and the force increases as compressive displacement increases. Afterwards, a plateau can be observed in the curve when the flattening of the tube is dominant. With the acceleration of flattening (and the decrease of the moment of inertia with respect to axis Z (IZ )) at the end of the experiment, the tube loses its resistance against cross-sectional instability. Cross-sectional instability occurs at 635 mm displacement, and the compressive force sharply decreases.
Experimental and simulation results are in good agreement (the difference between FE and test results is less than 5% of the test results). At the beginning of the experiment, relatively high compressive forces are needed to change the shape of the tube from straight to curvilinear and to cause global buckling, marking the end of the axial compression phase.
Figure 10 shows mesh convergence analysis results for the linear buckling analysis. The model converges properly for models containing at least 46,000 elements with a discrepancy of less than 1% in linear buckling force.

Mesh convergence analysis for the linear buckling model.
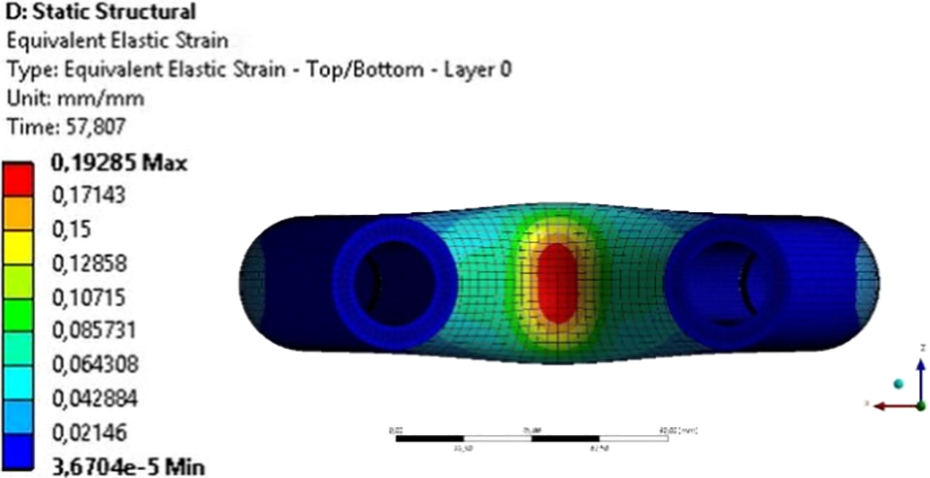
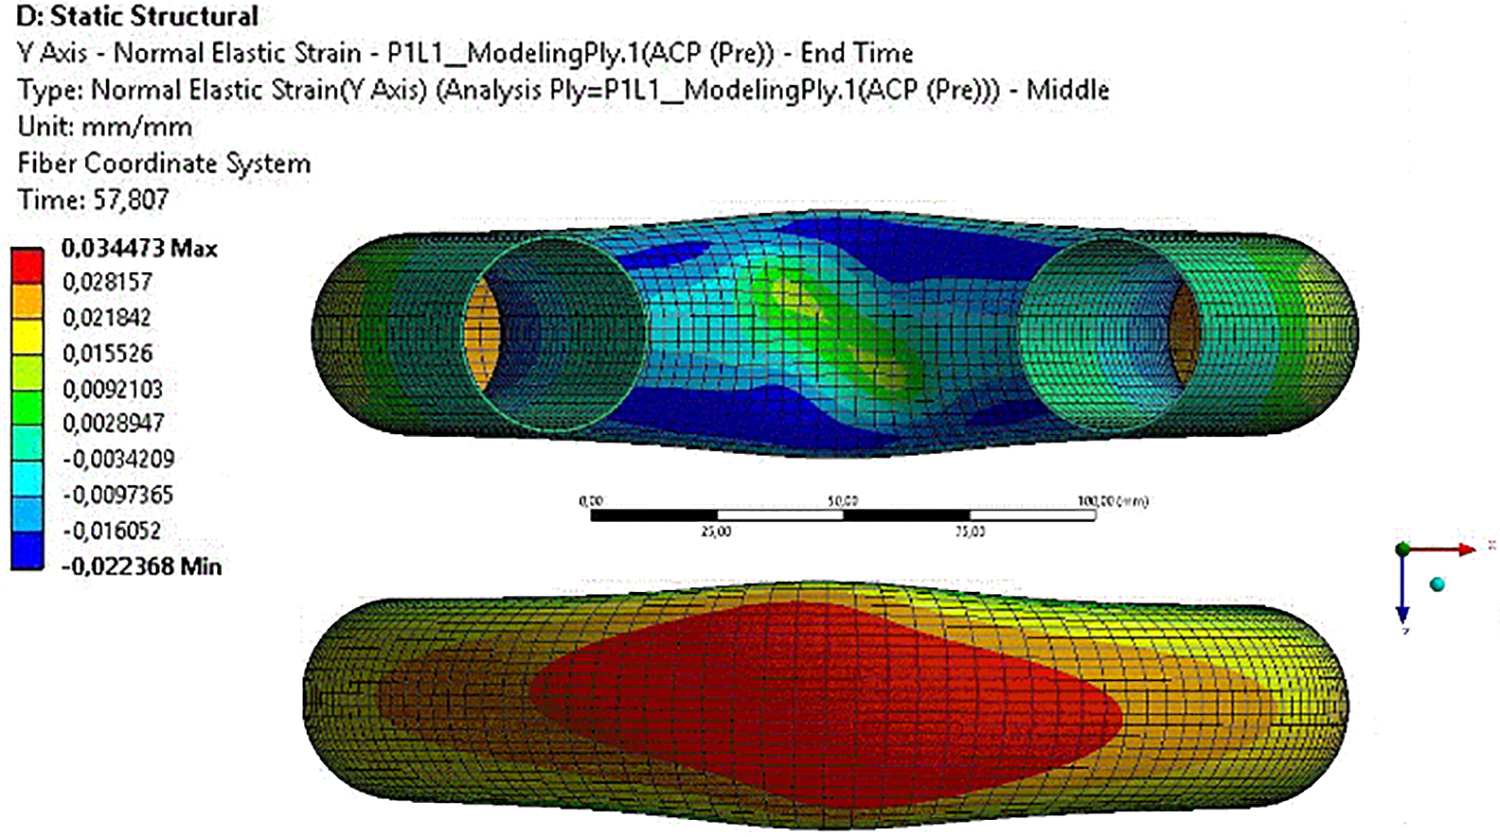
Stress and strain results, hereinafter presented, are true stress and true strain results. The equivalent von Mises strains are plotted in Figure 11 – in section in plane XY – and in Figure 12 – in top view. In these figures, noticeably large deformations can be observed. Flattening has occurred in the course of bending as detailed in the study by Fuchs et al. 8 ; and the inner circle of the cross section (taken in plane YZ), having an initial diameter of 28 mm, has turned into an ellipse, having a major axis of 36 mm and a minor axis of 10 mm. High strain values are confined to a limited zone affected by cross-sectional instability. In Figures 11 and 12, equivalent strain decreases sharply from plane YZ to the pins.

Equivalent von Mises strain at the last substep of cross-sectional instability, in lateral section, plane XY.
Equivalent von Mises strain at the last substep of cross-sectional instability, in top view.
As regards the equivalent von Mises stress (Figure 13), it can be noted likewise that peak stress values are present in the zone affected by cross-sectional instability, being of reasonably higher magnitude than the stress values listed far from the aforementioned zone. According to Figure 13, there is an observable difference in stresses between reinforcement layers and rubber liners, thus indicating that reinforcement layers are the load-bearing components of this tubular structure.

Equivalent von Mises stress at the last substep of cross-sectional instability, lateral section (XY plane).
The cross-sectional instability procedure can be observed in view of the variation of the maximal equivalent von Mises strain (Figure 14) and the maximal equivalent von Mises stress (Figure 15) during bending.

Maximal equivalent von Mises strain during the bending process; the starting point and the end of cross-sectional instability marked in red.
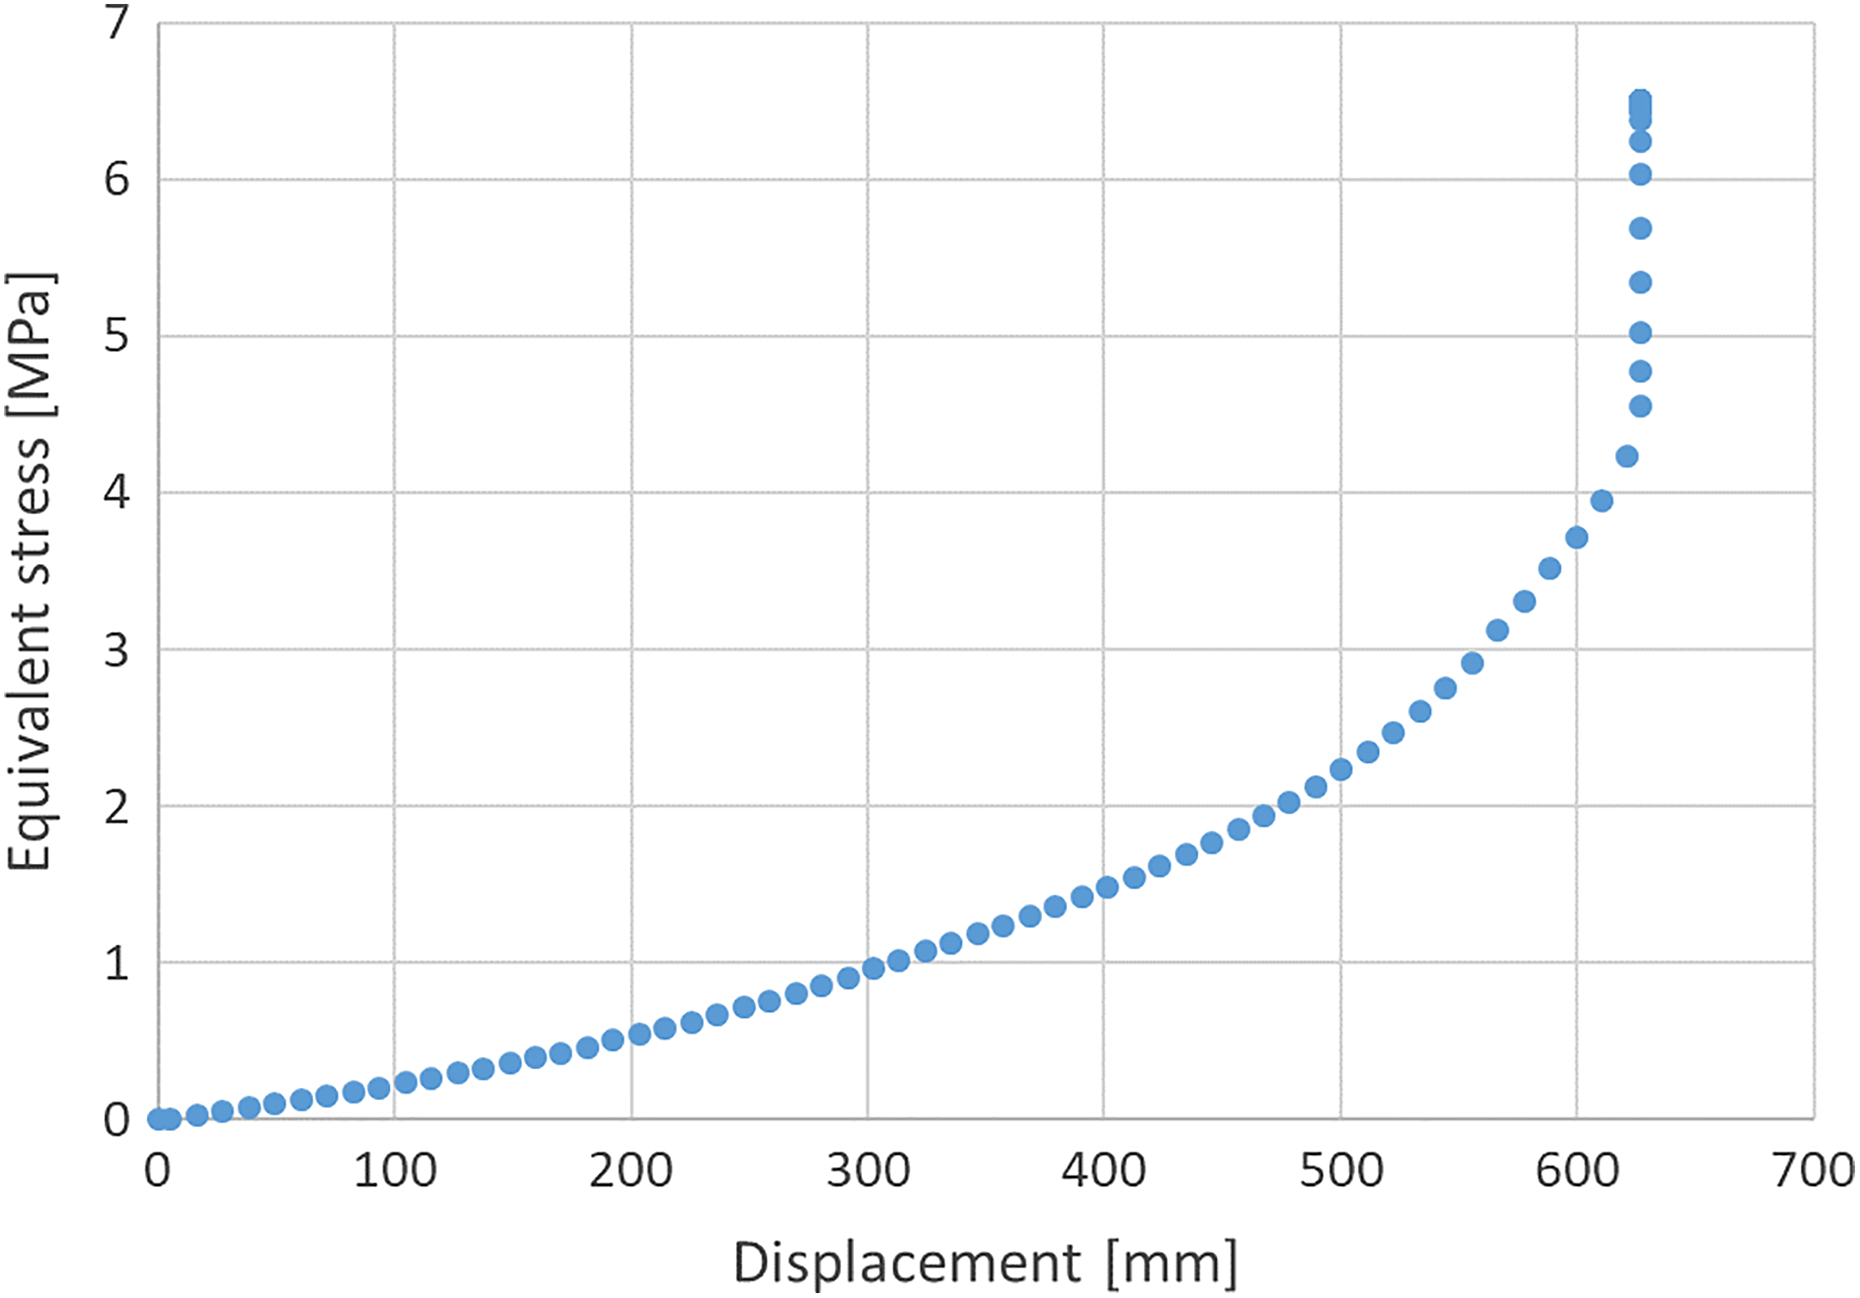
Maximal equivalent von Mises stress during the bending process.
Both the maximal equivalent von Mises strain and the maximal equivalent von Mises stress increase steadily until a displacement of approximately 560 mm. Afterwards, the rate of increase in strain and in stress is slightly elevated until time step 57. In time step 57 (just before the displacement of 635 mm), both the equivalent strain and stress increase sharply. This marks the collapse of the tube and the complete loss of the load-carrying capability. Monitoring the increase in the slope of the strain–displacement and stress–displacement curve can also be useful for forecasting cross-sectional instability.
Figure 16 displays oblateness ζ as a function of displacement. Oblateness is the change in the inner radius of the cross section relative to the initial inner radius
31
:


Oblateness parameter during bending.
where r denotes the initial inner radius of the tube and b denotes the inner minor axis of the cross section (axis Y; Figure 17).

Equivalent strain and ovalized cross section just before cross-sectional instability.
Ovalization begins at a displacement of 110 mm; the growth of the oblateness parameter can be characterized by two slopes. Firstly, the cross section is being flattened by a slightly lower growth rate until nearly 450 mm, then the growth rate of the oblateness parameter is noticeably elevated. This is accompanied by the increase in maximum equivalent strain (Figure 14) and maximum equivalent stress (Figure 15). At a displacement of nearly 635 mm, collapse of the cross section occurs at the compressed side, which leads to a sudden contraction in the cross section as it can be observed in Figures 17 and 18, which show deflected cross sections both before and after the starting point of the collapse of the cross section at 630 mm and 635 mm displacements, respectively. After a curvature of 0.02 is reached (Figure 19, where curvature is the reciprocal of rb bending radius shown in Figure 20), collapse of the cross section begins. As a consequence, the vicinity of the critical cross section is bent by an even increasing curvature, the process accelerates and, finally, the cross section collapses. The asymmetry of the cross section (Figure 18) at the end of the process is attributed to the presence of cross-sectional instability emerging on the compressed side (as described in Fuchs et al. 8 ).

Equivalent strain at cross-sectional instability in nonlinear buckling simulation, in plane YZ.

Curvature–displacement curve.

Deformed shape on the verge of cross-sectional instability, with bending radius rb
As it can be observed in Figure 18, maximal strains arise at the upper part of the outer rubber liner on the compressed side, being much higher than elsewhere; therefore, they indicate that cross-sectional instability has a significant impact on the behaviour of the structure in the zone affected by cross-section instability. By comparing Figure 19 and Figure 20, it can be noted that cross-section instability results in significantly elevated maximum equivalent elastic strains (the increase is approximately 51%; Figure 14) and the zone affected by cross-sectional instability is also expanded. It is noteworthy that due to cross-section instability, the tube undergoes significant deformation with little longitudinal displacement.
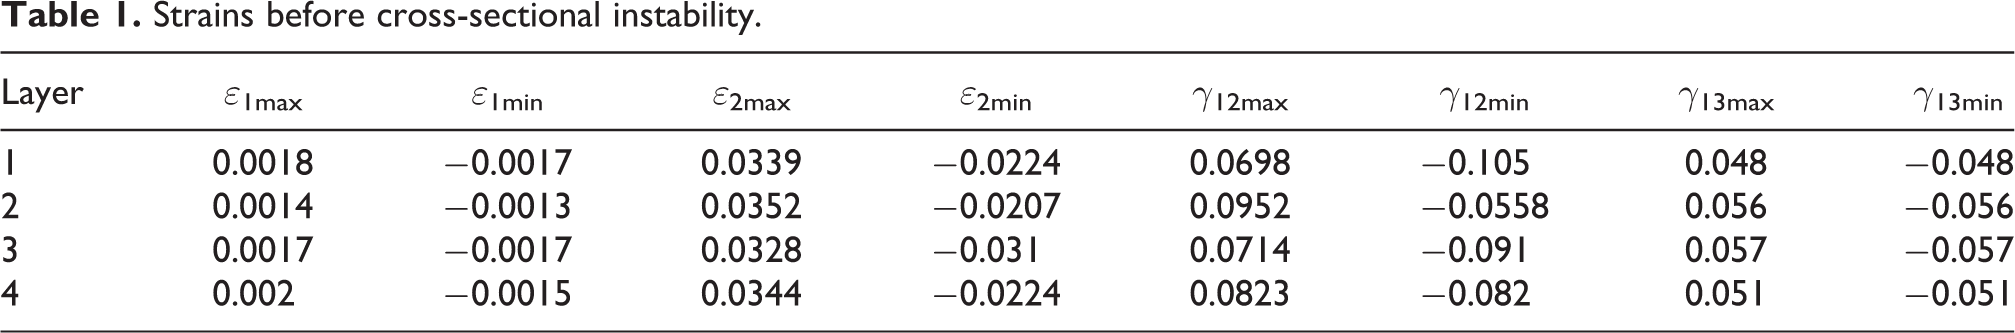
In Figure 21, intralaminar shear strain γ 12 has been plotted for the outermost layer (layer 1), while in Figure 22, interlaminar shear strain γ 13 can be observed for layer 1. Interlaminar shear strain γ 13 is associated with delamination failure mode, 20 while intralaminar shear strain γ 12 is in connection with debonding. 23 Both γ 12 (Figure 21) and γ 13 (Figure 22) are relatively high compared to ε 1 and ε 2 both at the start (Table 1) and at (Table 2) cross-sectional instability, which implies that probable failure mode of the composite tube is both delamination and yarn–matrix debonding.

Intralaminar shear strain γ 12 in reinforcement layer 1.
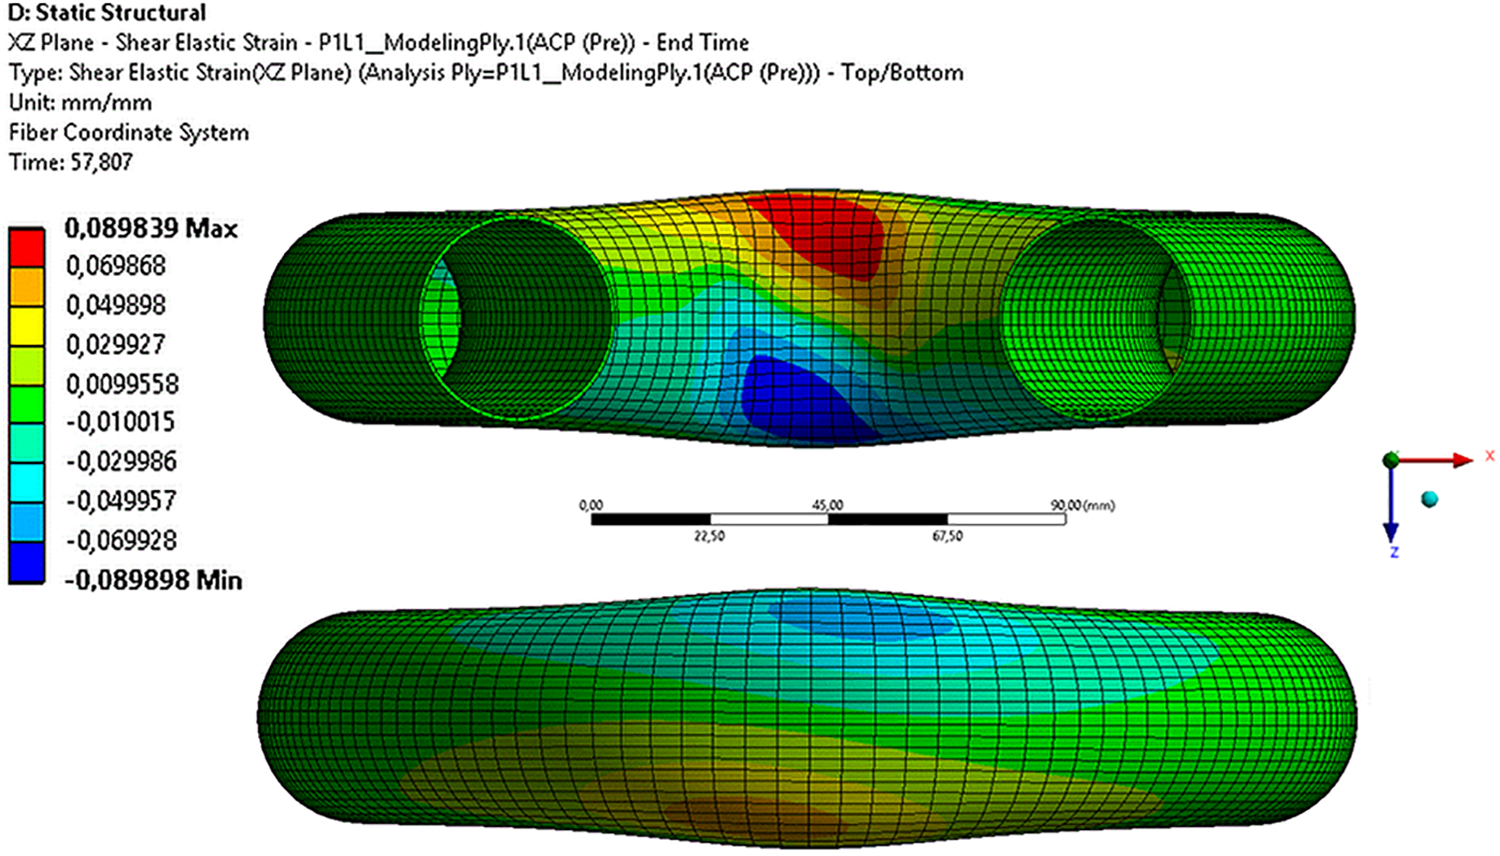
Interlaminar shear strain γ 13 in reinforcement layer 1.
The critical zones exposed to probable failure are on the two sides of the tube where both interlaminar and intralaminar shear strains are significant (Figures 21 and 22). According to Tables 1 and 2, cross-sectional instability causes a significant increase in both interlaminar (γ 13) and intralaminar (γ 12) shear strains (approximately +100% and +50%, respectively).
Strains before cross-sectional instability.
Strains at cross-sectional instability.

Strain in material direction 1 (ε 1) is negligible compared to the intralaminar (γ 12) and interlaminar (γ 13) shear strain components (Figure 23; Tables 1 and 2).
In the vicinity of plane XZ (Figure 5), tensile strains occur in material direction 1 (yarn direction), while farther, at minimal and maximal Y coordinates, compressive strains are present.

Normal strain in material direction 1, at the point of cross-sectional instability, outermost layer.
Normal strain distribution in material direction 2 (transverse direction) can be observed in Figure 24. Compressive strains occur in plane XZ (Figure 5), while at minimal and maximal Y coordinates, tensile strains are present. Comparing Figure 23 (normal strain distribution in material direction 1) to Figure 24 (normal strain distribution in material direction 2), it can be stated that in these figures, strains having opposite signs occur in the respective zones. Normal strain in material direction 1 is primarily characteristic to the yarns (possessing high modulus of elasticity), while normal strain in material direction 2 (transverse direction) reflects the mechanical response of the matrix. This contrast in strain values also serves as an explanation why shear is so significant regarding strain state of the reinforcing layers.
Normal strain in material direction 2, at the point of cross-sectional instability, outermost layer.
Brazier force (force arising at the remote point of the positioning pins at the point of Brazier instability) has been plotted as a function of member slenderness ratio λ
32
in Figure 25. Member slenderness ratio is the proportion of tube length L and radius of gyration i

where
where A is the cross-sectional area and Iz is the second moment of inertia with respect to axis Z.
For this parametric analysis, the initial cross section has been the same for each case; tubes with different overall lengths L have been considered.
As it can be observed in Figure 25, Brazier force is inversely proportional to the slenderness ratio; Brazier force decreases as the slenderness ratio increases.

Brazier force–slenderness ratio, the original case, λ = 47.55 (L=620 mm) is illustrated by a red dot.
Oblateness parameter can be observed in Figure 26 for different slenderness ratios as a function of dimensionless displacement δ, which is the ratio of longitudinal displacement d and distance of the remote points D0
(the tube is bent between these remote points, equals 720 mm in the original case):

Oblateness parameter–dimensionless displacement.
where
It can be seen in Figure 26 that higher oblateness parameters occur in case of a lower slenderness ratio than the reference slenderness (47.55); therefore, oblateness parameter ζ is inversely proportional to slenderness ratio λ.
Furthermore, it can be noted based on Figure 26 that cross-sectional instability takes place at a lower dimensionless displacement δ in case of a lower slenderness ratio λ. Ovalization begins at a dimensionless displacement of approximately 0.15 regardless of member slenderness.
According to Table 3, higher maximum equivalent strains arise at lower slenderness ratios.
Maximum equivalent strains for different slenderness ratios at cross-sectional instability.

Conclusions
The FE model presented is a means of nonlinear analysis of large deformation and cross-sectional instability of composite tubes. At first, global buckling occurs due to compression. The critical force has been determined for global buckling due to axial compression, which is in good agreement with the compressive force–displacement curve apart from the initial period.
Cross-sectional instability happens suddenly after reaching the relatively long plateau of the force approximately at 9.7 N (Figure 9), accompanied by steeply increasing equivalent stress and equivalent strain in the zone affected by cross-sectional instability.
The characteristic curves of the bending process may be utilized to help forecast the occurrence of cross-sectional instability and therefore to help prevent material failure.
Shear dominates strain state of the reinforcement layers; interlaminar and intralaminar shear strains are the highest strain components, being much higher than normal strains, which implies that the probable failure modes of the reinforcement layers are both delamination and debonding. There is a significant increase in strains (+100% in case of interlaminar and +50% in case of intralaminar shear strains) due to cross-sectional instability, which proves that the effect of cross-sectional instability on material behaviour of the tube is crucial.
A parametric analysis shows that Brazier force is inversely proportional to the member slenderness ratio λ. It further shows that higher oblateness parameters occur in case of a lower slenderness ratio and that cross-sectional instability takes place at a lower dimensionless displacement in case of a lower slenderness ratio.
FE results have been validated by a compression/bending test conducted on a tensile test machine (driven by compression).
Footnotes
Acknowledgements
The recent study and publication were realized within the Knorr–Bremse Scholarship Program supported by Knorr–Bremse Rail Systems Budapest. The authors hereby express their gratitude to the Department of Polymer Engineering, Budapest University of Technology and Economics, namely to Gábor Szebényi for providing them with the testing environment.
Declaration of conflicting interests
The author(s) declared no potential conflicts of interest with respect to the research, authorship, and/or publication of this article.
Funding
The author(s) received no financial support for the research, authorship, and/or publication of this article.