
Abstract
Friction stir welding (FSW) offers significant advantage when compared with fusion joining process such as no shield gas or flux are used, no harmful gases are produced, thereby making the FSW environmentally friendly. In this work, an experimental approach has been used for studying and optimizing the FSW process, applied on AA6082/SiC/10P composite plates. In particular, the effect of process parameters on ultimate tensile strength (UTS) of FSW joint has been investigated. The UTS of FSW joints is affected by FSW parameters. The FSW of the AA6082/SiC/10P composite plates was carried out with different combinations of FSW parameters. The experiments were conducted according to the Taguchi’s L9 orthogonal array. Taguchi method of designing the experiments was used for optimization of the FSW parameters. The signal to noise ratio and analysis of variance were used to determine the effects of FSW parameters on the UTS of the welded joints. The optimum FSW parameters for the maximum UTS were found to be the tool rotation speed of 1800 r/min, the welding speed of 100 mm/min and the tool tilt angle of 2°. UTS increased by 24.5% when FSW was carried out at optimum process parameters as compared to initial FSW parameters. Results have shown good agreement between the predicted and experimental values of UTS. High tensile strength is required for use of FSWed AA6082/SiC/10P composite joints in aerospace industry.
Introduction
Aluminium-based metal matrix composites (MMCs) are used in wide range of applications in automotive, marine and aerospace industries because of light weight, high strength, stiffness, superior wear resistance and good thermal stability. 1 However, the drawbacks like incomplete mixing of parent and filler materials, eutectic formation and presence of porosity in the fusion zone restrict these materials to be welded by conventional welding processes. 2,3 Further, the deleterious reactions in the fusion zone between reinforcement particles greatly limit the welding of aluminium-based MMCs. 1 Friction stir welding (FSW) has the potential for joining these aluminium-based MMCs. 4 FSW is ideal for joining aluminium alloys and MMCs which are difficult to weld using fusion welding since it is a solid-state welding. FSW is capable of producing strong joints because of the absence of theta phase, as it is accomplished below the melting temperature of the work pieces. 5 In FSW, the pin of rotating tool is inserted into the edges of work pieces and then the tool is traversed along the joint line. The work material is softened due to the heat generated by friction between the rotating tool and the work pieces. With the advancement of the tool in the welding direction, the softened material moves from front to the back of the pin. Hence the solid-state FSW joint is produced. 1 Welding parameters and tool geometry affect the production of joint, strength of joint and heat generation. 6 AA5754-H111 plates were welded by FSW. Two thermal indexes, the maximum temperature and the heating rate of the material, correlated to the frictional power input, were investigated for different process parameter (the travel and rotation tool speeds) configurations. The potentiality of thermography for the online monitoring of the FSW process was demonstrated along with the possibility to predict the quality of joints in terms of ultimate tensile strength (UTS) by monitoring thermal parameters. 7 The thermal behaviour of 5754-H111 plates joined by FSW was investigated. Results have shown that the thermal behaviour of joints is correlated to process parameters and that thermography can be used to perform the online monitoring of the FSW process. 8
There are few publications on the FSW of AA6082-based MMCs. Hence, this research has been carried out to investigate the effects of the FSW parameters on the UTS of AA6082/SiC/10P composites. Classical experimental design methods are typical. These are difficult to use. They also require large numbers of experiments. Taguchi design method is simple and robust in optimizing the FSW parameters. In order to reduce the number of experiments, Taguchi’s orthogonal array has been used to find optimum levels of FSW parameters.
Materials and processes
Stir casting method was used to make AA6082/SiC/10P composite plates. 9 These composite plates were welded by FSW.
Fixture used for holding the AA6082/SiC/10p composite plates during FSW is shown in Figure 1. FSW of the composite plates was carried out on a conventional milling machine PACMILL (IK YIHKUN, Taiwan) make. Specifications of the milling machine are shown in Table 1. FSW tool was fabricated from D2 tool steel. Shape of tool is simple cylindrical as shown in Figure 2. Chemical composition of American Iron and Steel Institute (AISI) D2 steel is presented in Table 2. Specifications of FSW tool are given in Table 3. Figure 3 shows the fabricated AA6082/SiC/10p composite plates.
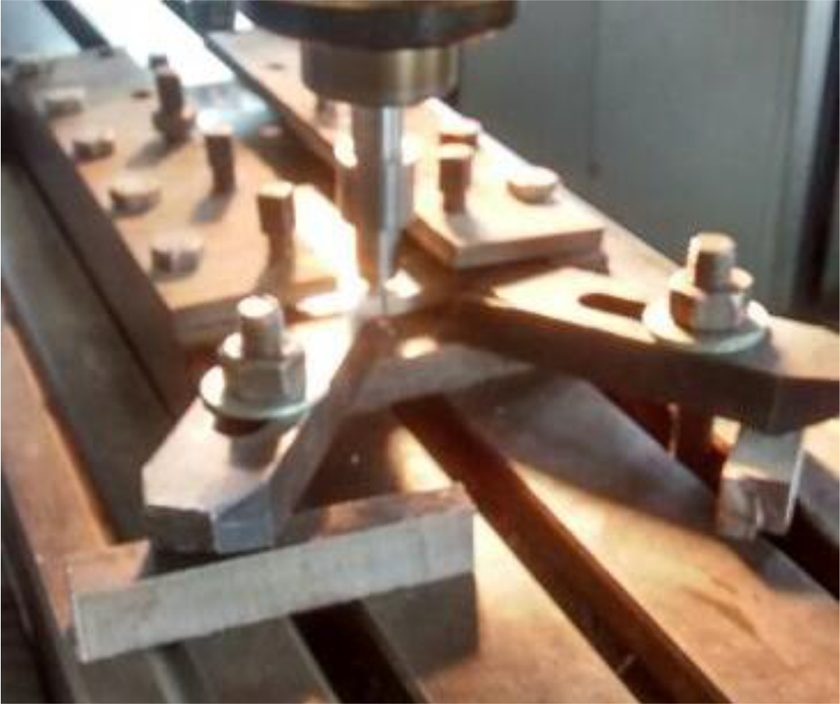
Fixture.
Specifications of conventional vertical milling machine.


FSW tool. FSW: friction stir welding.
Elements of AISI D2 steel.

FSW tool specifications.

FSW: friction stir welding.

Fabricated AA6082/SiC/10P MMC plates. MMC: metal matrix composite.
Friction stir welding
Tool rotation speed (r/min), welding speed (mm/min) and tool tilt angle (°) were selected as FSW parameters. Process parameters and their levels are tabulated in Table 4. Experiments were planned as per L9 orthogonal array. Three levels of all the three parameters were used. Nine FSW joints were made for nine experiments, as per details given in Table 5. Fixture was mounted on the table of vertical milling machine. Composite plates of size 100 × 50 × 6 mm3 were gripped in the fixture. Tool was then fed through the weld line of plates at specified welding speed. Sufficient dwell time was given to the tool for generating the heat required for FSW. After welding, the transverse tensile specimens were cut out of the welded composite plates.
FSW parameters and their levels.

FSW: friction stir welding.
Experimental design matrix and results.

FSW: friction stir welding; S/N: signal to noise; UTS: ultimate tensile strength.
Tensile testing
Tensile testing was carried out on Fuel Instruments & Engineers Pvt Ltd, (Shirel, Maharashtra, India) make UNITEK 94100 model Universal Testing Machine. Machine is shown in Figure 4. The specimens were designed in accordance with ASTM: E8/E8 M-13. The specimen geometry is shown in Figure 5. For each experiment, testing of three samples was carried out. Average value of three tensile test results was taken. UTS value for each experiment was noted down. Experimental design matrix and results are presented in Table 5.

FIE make UNITEK 94100 model UTM. FIE: Fuel Instruments & Engineers; UTM:Universal Testing Machine.

Sketch map of tensile test specimen (dimensions in mm).
Experiments show that in the FSW parameters range (tool rotation speed 1500–2100 r/min, welding speed 50–150 mm/min and tool tilt angle 1–3°), the obtained UTS varies between 223 MPa and 374 MPa.
Design of experiments
Experiments were designed using Taguchi technique. Signal to noise (S/N) ratios were also calculated. In Taguchi’s approach of design of experiments, the desirable value of the output characteristic is termed as signal and the undesirable values of output characteristic is called noise. Output characteristic in the present study is UTS. Quality characteristic deviating from desired value is evaluated using S/N ratio. The higher the better characteristic was considered for UTS of the welded plates. 6,10 The S/N ratio (η) is given as 6,11 :

where MSD is the mean square deviation for output characteristic.
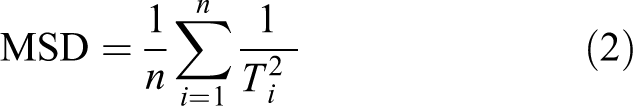
where n is the number of experiments and Ti is the value of UTS of the ith experiment. S/N ratios of the designed experiments were determined using equations (1) and (2). Values of mean S/N ratios at level 1, 2 and 3 are presented in Table 6. As per the rank in the table, tool rotation speed has the maximum influence on UTS, followed by tool tilt angle and welding speed.
S/N response table for UTS.

FSW: friction stir welding; S/N: signal to noise; UTS: ultimate tensile strength.
Results and discussion
FSW of composite plates was achieved without any distortion of plates. Orthogonal design of experiment supports in finding the influence of each FSW parameter at different levels. Minitab-14 software was used for calculation and analysis. L9 orthogonal array of Taguchi was used to design and optimize the experiments. 6,11 Mean S/N ratio was determined by calculating the average S/N ratio of individual experiment. Mean S/N ratio of FSW parameters for each level is presented in Table 6. According to the nine experiments carried out, the sum of mean S/N ratio was obtained as 49.53 dB. Effect of each FSW parameter is shown in the S/N response graphs (Figures 6 to 8). These graphs are drawn based on the results of Table 6.
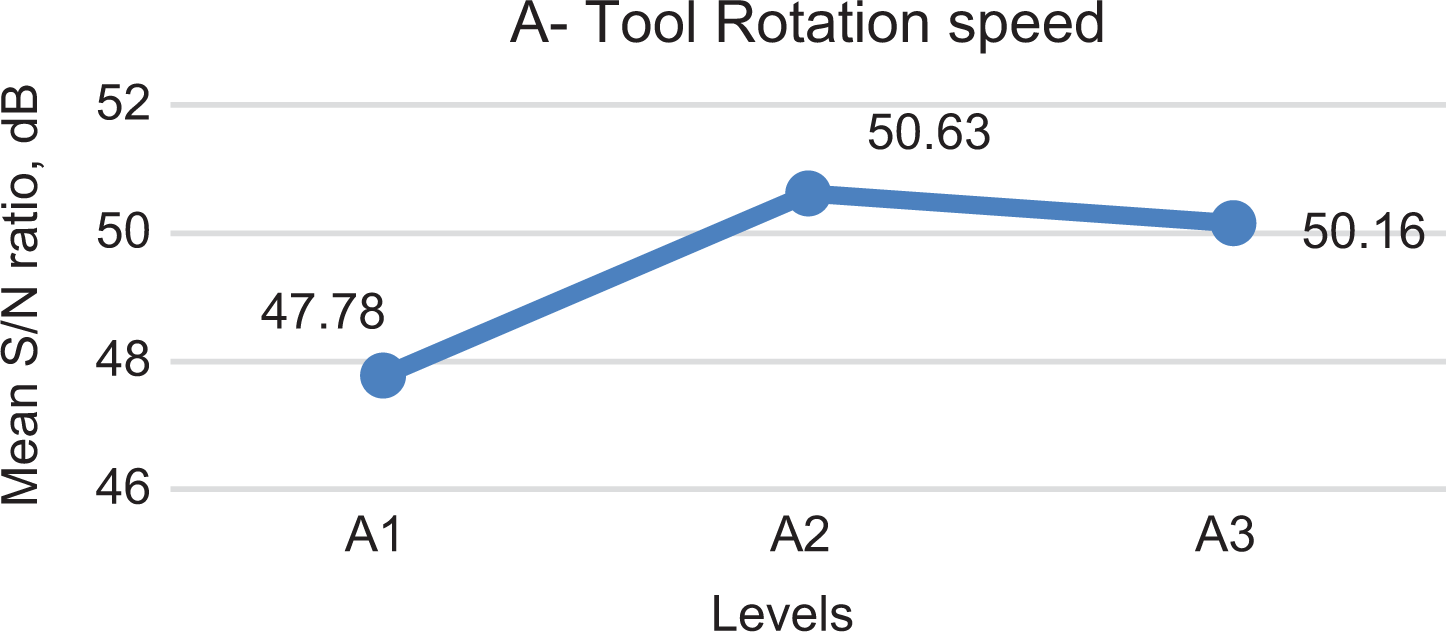
S/N response graph for tool rotation speed. S/N: signal to noise.

S/N response graph for welding speed. S/N: signal to noise.
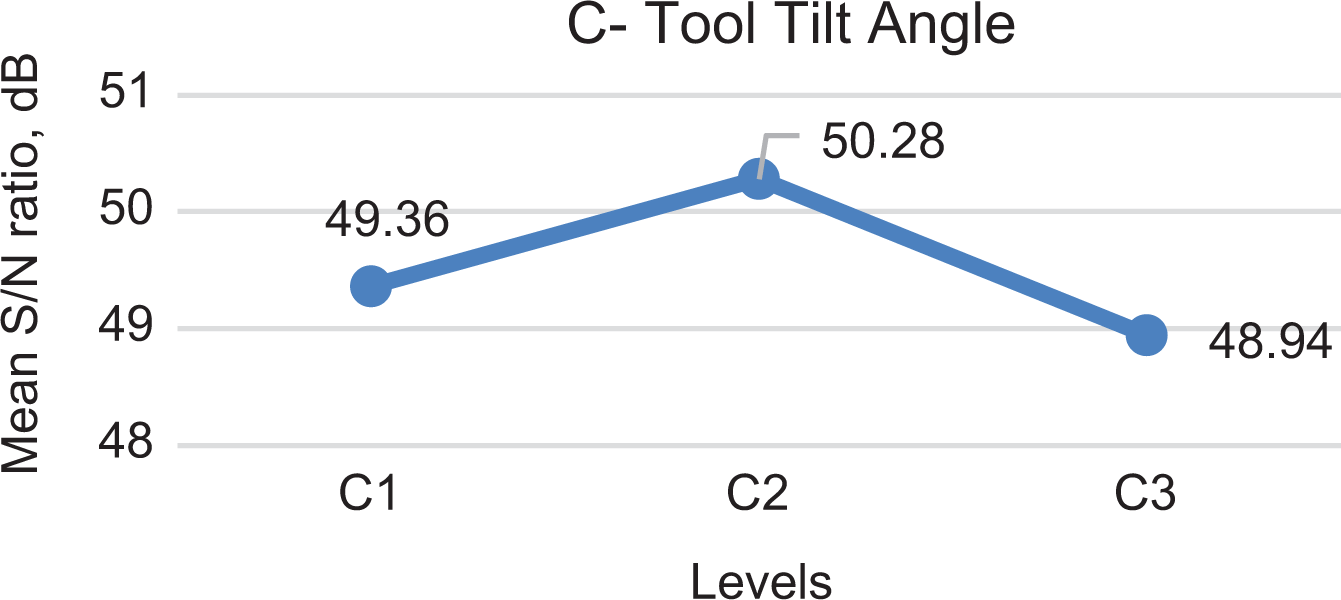
S/N response graph for tool tilt angle. S/N: signal to noise.
Effect of tool rotational speed
Graph in Figure 6 shows the effect of tool rotation speed on the UTS. S/N ratio increases from A1 to A2 and then decreases from A2 to A3. At lower tool rotational speed of 1500 r/min, heat generation at the weld zone is not sufficient to strain the plasticized material. This results in poor consolidation of material and formation of tunnel defect at the retreating side. This leads to the joint having lower tensile strength. Hence optimum tool rotational speed is essential to generate sufficient frictional heat. The maximum UTS was obtained at A2 (1800 r/min) where the S/N ratio is maximum. Optimum tool rotational speed is also needed for stirring and mixing of plasticized material around the rotating tool pin. This in turn increases the temperature of the plasticized material. Therefore, it yields adequate straining of plasticized material with fine recrystallized grains resulting in defect-free joints.
When tool rotational speed is increased beyond 1800 r/min, heat generated at the weld zone increases. This results in turbulence of strained plasticized materials and formation of macro-level defects at the weld zone. When the tool rotational speed increases to 2100 r/min, more heat is generated in the stir zone, due to increase of relative velocity between rotating tool and material. Increased heat input increases grain growth and dissolution of Mg2Si precipitates at the weld zone. All these effects lead to poor joint with reduced tensile strength. Also, higher tool rotational speed affects straining rate of plasticized material, change in grain size, precipitation of Mg2Si and insertion of wear debris of tool in the weld zone. All these effects decreased the UTS of the welded joint. Similar results were obtained by Dinaharan et al. 12 and Elangovan et al. 13
Effect of welding speed
Effect of welding speed is shown in Figure 7. At lower welding speed of 50 mm/min, higher heat is generated due to the longer contact time. Hence rate of cooling is decreased. This leads to coarsening of grains and affects the Mg2Si precipitates. Hence lower UTS is observed. UTS is maximum at B2 level of welding speed. Translation of the rotating tool moves the stirred plasticized material from the front to back of the tool pin. During the FSW thermal cycle, the rate of heat at the weld zone is the main function of welding speed. Welding speed has opposite effect on the heat generation at the weld zone. It governs the exposure time of the frictional heat per unit length of the weld. This impacts the grain growth. Lower welding speed affects the straining rate of plasticized material, change in grain size, precipitation of Mg2Si and inclusion of wear debris of tool in the weld zone. Defect-free joints obtained at the welding speed of 100 mm/min have higher tensile strength, which may be due to transportation of sufficient plasticized material and good consolidation of material with fine grains.
UTS starts decreasing with further increase in welding speed. Extra turbulence of flowing material is also possible due to high heat generation, which changes the regular flow pattern of plasticized material. This results in formation of macro-level defect in the weld zone. Due to the lesser exposure time to the frictional heat per unit length of the weld area at higher welding speed of 150 mm/min, smaller heat is generated, which results in faster cooling of the welded joint. This can substantially reduce the degree of metallurgical transformations taking place during welding (such as solubilization, reprecipitation and coarsening of precipitates). Result is the reduction of strength of individual regions across the weld zone. Reduced heat input at the weld zone at higher welding speed causes inadequate plasticized material transportation from advancing side to the retreating side.
It also results in the reduction in the softened area due to faster cooling rate, which leads to macro-level defects like tunnels in the weld region. Similar results were obtained by Karthikeyan et al. 14 and Elangovan et al. 15
Effect of tool tilt angle
Effect of tool tilt angle can be interpreted from the graph (Figure 8). UTS is maximum at C2 level of tool tilt angle. Tilt angle affects the vertical and horizontal flow of the weld material. Improper tilt angle may create tunnel and crack-like defects in the welds. At 1° tilt angle, the insufficient vertical and horizontal flow of the weld material may cause defects that reduce the strength of a weld. With the increase in tilt angle beyond 1°, there is an increase in average grain diameter. As the tilt angle increases, higher torque and vertical forces are felt. Increase in both torque and vertical force results in higher heat input, which may lead to higher peak temperature and longer cooling time. This increases the heat exposure time to nugget and UTS. Increasing the tilt angle to 2° improves the flow characteristics and tensile strength of the weld. Equiaxed shape grains are obtained in nugget zone due to dynamic recrystallization during welding. Further increase in tool angle to 3° will result in accumulation of heat and reduction in UTS.
According to the S/N response graph (Figures 6 to 8) in this study, tool rotation speed is the most effective parameter to influence the UTS.
Analysis of variance
Analysis of variance (ANOVA) is a technique to find the significance of parameters on the quality characteristic. In this study, ANOVA has been used to find out the optimal combinations of FSW parameter levels, according to their relative significance on the UTS of the welded joints. F-test is applied to determine the FSW parameters that most significantly influence the UTS. 15 Importance of the FSW parameters has been found out by separating the total variability of S/N ratio in contributions by each of FSW parameters and the error. Total sum of squared deviations (SSt) is calculated from total mean S/N ratio (ηm ) as 6,16 :

where n is the number of experiments in L9 orthogonal array and ηi is the mean S/N ratio for ith experiment. There are nine experiments in this study.

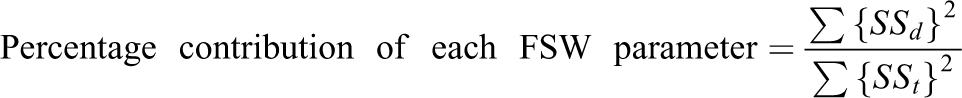
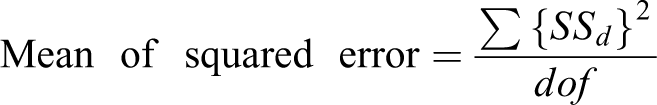
where SSt is the total sum of squared deviations, SSd is the sum of squared deviations, SSe is the sum of squared error and dof is the degree of freedom.

Design parameter is supposed to most significantly influence the quality characteristic when F > 4. 6,17
Macroscopic photograph of FSW joint by applying optimized fabrication conditions (A2B2C2) identified in this study is shown in Figure 9.

Macroscopic photograph of FSW joint. FSW: friction stir welding.
Optimization
Results of ANOVA or F-test 18 on UTS are shown in Table 7. Value of F ratio of FSW parameter gives the significance of that parameter. FSW parameter with the highest value of F ratio is the most significant one. This study revealed that the F ratio of tool rotation speed is highest, that is, 31.21, which means that the tool rotation speed is the most significant parameter for FSW of AA6082/SiC/10p composites. Tool tilt angle is found to be the second significant FSW parameter and the welding speed is the least significant parameter for UTS.
Results of ANOVA for UTS.

FSW: friction stir welding; UTS: ultimate tensile strength; ANOVA: analysis of variance.
After determination of optimum design parameters, they were verified to predict the improvement of the UTS. The estimated S/N ratio (

where ηm
is the total mean of S/N ratio,
Results of the confirmation test.

FSW: friction stir welding; S/N: signal to noise; UTS: ultimate tensile strength.
Comparison has shown that there is an improvement of 1.91 dB in the S/N ratio and the UTS is increased by 75 MPa, that is, 24.5%, compared to the UTS at initial FSW parameters. Results of the study revealed that the UTS of FSW joints of AA6082/SiC/10p composites is sufficient and comparable to the base composite material. Comparison of actual and numerical predictions of UTS shows that the FSW parameters influence the mechanical properties of FSW joints. This study divulges that an agreement in the combinations of FSW parameters is possible, which could result in good and strong FSW joints. Tool rotation speed, welding speed and tool tilt angle were found to be important for UTS of FSW joints of AA6082/SiC/10P composites.
Conclusions
FSW (i.e. environmental friendly welding) was successfully used for welding of AA6082/SiC/10P composites . UTS of AA6082/SiC/10P composites joined by FSW has been find out using Taguchi method. Results obtained from the experimental and analytical process are as follows: ANOVA results proved that the mathematical models are capable to predict the FSW parameters with 95% confidence interval. Tool rotation speed, welding speed and tool tilt angle were found to be significant for the UTS of FSW joints of AA6082/SiC/10P composite. Tool rotation speed was the most significant FSW parameter and welding speed was the least significant FSW parameter. Optimum FSW parameters for the maximum UTS are the tool rotation speed of 1800 r/min, the welding speed of 100 mm/min and the tool tilt angle of 2°. UTS increased by 24.5% when FSW was carried out at optimum process parameters as compared to initial FSW parameters.
Footnotes
Acknowledgements
The authors would like to thank Dr Balbir Singh, Dr Ankush Anand, and all the workshop staff of Shri Mata Vaishno Devi University, Katra, Jammu and Kashmir, India. The authors would like to acknowledge the technical support provided by Mr Dilip Sharma of GIMT, Kurukshetra, Haryana, India.
Declaration of conflicting interests
The author(s) declared no potential conflicts of interest with respect to the research, authorship and/or publication of this article.
Funding
The author(s) received no financial support for the research, authorship and/or publication of this article.