
Abstract
This study revealed that adipose-derived mesenchymal stem cell-facilitated ciprofloxacin therapy effectively protected the kidney parenchyma and functional integrity against acute pyelonephritis damage in rodents. In vitro studies revealed that adipose-derived mesenchymal stem cell-derived media significantly suppressed the number of bacterial colony formation units (P < 0.0001). Additionally, the combination of adipose-derived mesenchymal stem cell-ciprofloxacin was superior to either treatment alone on suppressing lipopolysaccharide-induced inflammatory reactions in macrophages and peripheral blood-derived mononuclear cells and attenuated lipopolysaccharide-induced apoptosis/DNA damage in uroepithelial cells (Simian virus Hydrologic Unit Code 1) (all P < 0.0001). Sprague-Dawley rats were categorized into groups 1 (sham-control)/2 (acute pyelonephritis)/3 (acute pyelonephritis-ciprofloxacin)/4 (acute pyelonephritis- adipose-derived mesenchymal stem cell)/5 (acute pyelonephritis-adipose-derived mesenchymal stem cell-ciprofloxacin), and kidneys were harvested by day 5 after acute pyelonephritis induction. The in vivo results revealed that the day-5 mortality rate and creatinine levels at days 2 and 5 were significantly greater in group 2 than in groups 1 and 5 (P = 0.01), whereas the kidney injury score and inflammatory cell infiltration in the kidney were highest in group 2, lowest in group 1, and significantly greater in groups 3 and 4 than in group 5; however, there was no difference between groups 3 and 4 (all P < 0.0001). The upstream inflammatory signaling (toll-like receptor-4, myeloid differentiation primary response 88, tumor necrosis factor receptor associated factor 6 and nuclear factor-kappa B) and downstream inflammatory signaling (tumor necrosis factor-alpha, interleukin-1 beta and interleukin-6) biomarkers exhibited identical patterns of kidney injury scores among the groups (all P < 0.0001). The results of the present study showed that adipose-derived mesenchymal stem cell-facilitated ciprofloxacin reduced inflammatory signaling-induced kidney parenchymal damage and acute pyelonephritis-induced mortality and preserved kidney function.

Introduction
Acute pyelonephritis (APN), an ascending infection of the genitourinary tract, not only involves bacterial invasion of the renal parenchyma but also often affects organs and life in a threatening situation 1 . The incidence of APN in the United States is increasing, especially for infants, younger women and elderly individuals with anatomic abnormalities or unusual hormonal changes 2 . Without timely intervention, the overwhelming inflammation of the renal parenchyma frequently results in scarring of the kidneys and irreversible impairment of renal function 3 . Currently, the 2018 NICE guidelines on antimicrobial prescribing for APN recommend self-care strategies and stepwise escalation of different-generation fluoroquinolones or cephalosporins according to patient age, sex, and pregnancy status 4 .
Unfortunately, even with optimal empirical antibiotic administration, the rate of antibiotic-resistant APN has been increasing worldwide5,6. In such cases, traditional antimicrobial therapies, such as fluoroquinolones and extended-spectrum beta-lactamase inhibitors, are no longer effective, indirectly increasing mortality. Antibiotic resistance to carbapenems, which are considered the best and most widely used agents for treating APN, has also emerged as a serious health issue. In the context of drug resistance, the remaining final solutions are only daptomycin, linezolid and tigecycline5–7. Therefore, in addition to preventing antibiotic overuse, finding a way to treat antibiotic-resistant APN, such as other severe systemic infections, is highly important.
There are three major mechanisms, including permeability and efflux mechanism modifications, target structure modifications and inactivation of antibiotics, to explain resistance to different-acting antibiotics in APN5,7. First, the impermeable outer membrane of gram-negative microorganisms results in decreased susceptibility to fluoroquinolone or beta-lactam antibiotics 8 . The efflux mechanism, by which antibiotic substances are pumped out of the cell, is another mechanism for resistance to the two types of antibiotics mentioned above 9 . Second, gene mutation, enzymatic modifications and the acquisition of genetic materials that alter the microstructure of the target inactivate specific types of antibiotics 10 . Finally, pathogens develop several enzyme-based defense mechanisms to inactivate antibiotics, especially beta-lactams and aminoglycosides 11 .
A number of studies have shown that several severe complications, such as renal/perinephric abscess formation, sepsis, renal vein thrombosis, papillary necrosis and renal failure, can occur in patients with drug-resistant APN, especially in those with a younger/advanced age and immunocompromised state2,12. The associated comorbidities and complications explain more than 20% of the overall mortality rate 13 .
With increasing evidence of antibiotic failure in APN, it is not wise to administer broader-spectrum antibiotics alone. Additionally, considering the complex mechanisms of antibiotic inactivation, it could be difficult to treat drug-resistant APN by either using antibiotic escalation therapy aggressively or combining several kinds of antibiotics intensively. In contrast, a therapeutic strategy beyond antibiotic treatment could be another possible pathway to resolve the clinical dilemma. For example, cell-based therapy to increase or modulate immune function might be considered a more feasible solution to overcome this unmet clinical need14,15.
Basic research has demonstrated that mesenchymal stem cells (MSCs) have strong anti-inflammatory16–20 and immunomodulatory16–21 effects and promote tissue repair and regeneration22–25. Our previous studies revealed that adipose-derived mesenchymal stem cells (ADMSCs) not only have anti-inflammatory, immunomodulatory and tissue regeneration abilities but also effectively protect organ function from ischemia-related damage26–31. Additionally, our previous studies revealed that ADMSC therapy effectively protected organs from sepsis syndrome (SS)-induced injury32,33. In this way, our studies34,35 further demonstrated that the combination of antibiotics (i.e. ciprofloxacin) and MSCs/ADMSCs would offer additional benefits in protecting the urogenital organ and kidney against SS-induced kidney damage, preserving renal function and improving the mortality rate and histopathological outcomes in rodents. On the basis of the aforementioned findings, it is rational to believe that the combination of antibiotics and ADMSCs is superior to either treatment alone for improving the outcome in APN rats with sepsis.
Materials and methods
Ethical issues
All animal procedures were approved by the Institute of Animal Care and Use Committee at Kaohsiung Chang Gung Memorial Hospital (Affidavit of Approval of Animal Use Protocol No. 2022031601) and performed in accordance with the Guide for the Care and Use of Laboratory Animals.
The animals were housed in an Association for Assessment and Accreditation of Laboratory Animal Care International (AAALAC; Frederick, MD, USA)-approved animal facility in our hospital with a controlled temperature and light cycles (24 °C and 12/12 light cycle).
Cell culture
For the purpose of the study, the SV-HUC-1 cells were grown in culture dishes containing Ham’s F-12 (11765054, GIBCO) supplemented with 7% fetal bovine serum (#SH30396, HyClone), 100 μg/ml streptomycin and 100 units/ml penicillin. RAW 264.7 cells were grown in culture dishes containing high-glucose Dulbecco’s modified Eagle’s medium (#12800-017, Gibco) supplemented with 10% fetal bovine serum (#SH30396, HyClone), 100 μg/ml streptomycin and 100 units/ml penicillin. These cell lines were grown in a 37 °C incubator with a humidified atmosphere of 5% CO2. The procedure and protocol of SV-HUC-1 cell line culture were based on our previous report 36 .
APN induction, animal grouping and strategic management
Male Sprague-Dawley (SD) rats, with age range from 8 to 10 weeks and weighing about 250-280g, was utilized (Charles River Technology, BioLASCO Co. Ltd., Taipei, Taiwan). To obtain adequate gram-negative bacteria for the induction of APN, an additional five animals were anesthetized via inhalation of 2.0% isoflurane and placed in a supine position on a warming pad at 37 °C with the abdomen shaved. Under sterile conditions, the abdominal skin and muscle were incised, and the cecum was exposed in these five animals. The cecum of each animal was then prolene sutured over its distal portion (i.e. distal ligation), and the cecum distal to the ligature was punctured twice with an 18G needle and squeezed to allow the cecal contents to be released into the peritoneum. This procedure, which is called cecal ligation and puncture (CLP) for the induction of sepsis syndrome (SS), was described in our previous report 35 . Finally, the abdominal muscle and skin were sutured, and the animals were then allowed to recover from anesthesia.
Twenty-four hours after SS induction, these additional five animals were anesthesia again. The skin and abdominal layers of these five animals were reopened, and the abdominal fluid, which contained abundant gram-negative bacteria, was collected from these animals and seeded on a bacterial culture plate. The number of bacteria was determined by adjusting the concentration of the bacterial mixture to 1 × 10⁸ colony formation units (CFUs)/ml.
For APN induction, the animals were anesthetized again. With an echo guide, 0.5 × 10⁸ CFU/ml bacteria were equally injected via a #25 needle into the bilateral kidneys. Additionally, a #24 soft plastic needle was inserted into the animal’s urethra, after which 0.5 × 10⁸ CFU/ml bacteria were injected into the urinary bladder. In this way, the APN induction procedure was complete.
Statistical analysis estimated that at least 59 animals (i.e. n = 10 in groups 1 and 5; n = 13 in groups 2 to 4) to be requited for analysis of mortality in the present study and the animals to be categorized into: group 1 (sham-operated control (SC)) received only 500 μl of PBS into each kidney and bladder), group 2 (APN + 500 μl of PBS into each kidney and bladder), group 3 (APN + ciprofloxacin [3.0 mg/kg, b.i.d. orally), the initial dosage at 3 h after APN induction, followed by once daily for 5 days), group 4 (APN + allogenous ADMSCs [1.2 × 10⁶ cells] by intravenous injection at 3 h and 18 h after APN induction]) and group 5 (APN + ciprofloxacin + autologous ADMSCs [1.2 × 10⁶ cells]). The animals in each group were euthanized by day 5 after SS-APN induction, and the kidneys were harvested for individual study. The dosage of ciprofloxacin used in the present study was based on our previous report34,35. On the other hand, the dosage of ADMSCs utilized in the present study was based on our previous studies31–34 with minimal modifications.
The time courses of APN induction, blood sampling, ADMSC administration and ciprofloxacin therapy and the time points of euthanasia are schematically illustrated in Supplementary Fig. 1.
Isolation of allogenic adipose tissues for ADMSC culture
On day 14 prior to APN induction, adipose tissue for culturing the allogenic ADMSCs was isolated from an additional 12 animals. Adipose tissues around the epididymis and abdomen were carefully isolated according to our previous reports26–30. After 14 days of culture, approximately 3.5 × 10⁶ ADMSCs were obtained from each rat.
Flow cytometric analysis for detecting apoptosis and inflammatory cells and ELISA for measuring the circulatory levels of proinflammatory cytokines
The percentages of viable and apoptotic cells were determined with an FC500 and Gallios flow cytometer (Beckman Coulter, Miami, FL, USA) using double staining with annexin V and propidium iodide (PI). Based on the previous report 37 , the early phase of apoptosis was defined as annexin V+/PI-, whereas the late phase of apoptosis was defined as annexin V+/PI+.
Additionally, to analyze the circulatory levels of CD11b/c+, Ly6G+ and myeloperoxidase (MPO)+ inflammatory cells, the blood sample was treated with RBC lysis buffer (0.15 M NH4Cl, 10 mM KHCO3, 0.1 mM Na2-EDTA, pH 7.4). The cells were then incubated with the following antibodies: anti-CD11b-PE (1: 100, BD biosciences), anti-Ly6g-Alexa Fluor 488 (1: 40, Abcam), and anti-MPO-Alexa Fluor 488 (1: 100, Abcam). Flow cytometry was conducted on Gallios Flow Cytometer (Becton Dickinson). Flow cytometry data were analyzed using Kaluza Analysis Software (Beckman Coulter). Cytofix/Cytoperm Fixation/ Permeabilization Kit (BD biosciences) offered for immunofluorescent staining of intracellular MPO cytokines.
ELISA was used to identify the time courses of the serum levels of proinflammatory cytokines, including interleukin (IL-6), IL-1β, procalcitonin (PCT) and tumor necrosis factor (TNF)-α. In detail, the whole blood was collected into anti-coagulant free tube, incubated undisturbedly at room temperature for 20 min, and then centrifuged at 720 × g for 10 min at 4°C. The serum was immediately aliquoted and stored at -80°C before use. The commercially available ELISA tests were conducted according to the instructions of the manufacturer to measure the time courses of the concentration of proinflammatory cytokines, including interleukin (IL-6, #R6000B, R&D Systems), IL-1β (#RLB00, R&D Systems), procalcitonin (PCT, #ER1235, FineTest) and tumor necrosis factor-α (TNF-α, #RTA00, R&D Systems) in serum sample.
Serially collected blood samples for assessment of renal function
In the present study, serial blood samples for assessment of circulatory levels of blood urea nitrogen (BUN) and creatinine were drawn on day 0 prior to and 2 and 5 days after ANP induction. Peripheral blood from the tail vein was collected at each time point, followed by adequate fluid supply by intraperitoneal administration.
Each time just after blood sampling. A standard laboratory method was used to measure the circulatory levels of BUN and creatinine.
Histopathologic assessment of the kidney injury score on day 5 after APN induction
The histopathological scoring of kidney injury was performed in a blinded fashion as we previously reported35,38. Briefly, the left kidney samples from all the animals were fixed in 10% buffered formalin, embedded in paraffin, sectioned at 4 µm and stained (hematoxylin and eosin; H&E) for light microscopy. The score reflects the grading of tubular necrosis, loss of brush border, cast formation, and tubular dilatation in 10 randomly chosen nonoverlapping fields (200×) for each animal as follows: 0 (none), 1 (≤10%), 2 (11%–25%), 3 (26%–45%), 4 (46%–75%), and 5 (≥76%).
Western blot analysis
The procedure and protocol were based on our previous reports26–30. Briefly, equal amounts (50 μg) of protein extracts were loaded and separated via SDS-PAGE via acrylamide gradients. After electrophoresis, the separated proteins were transferred electrophoretically to a PVDF membrane (GE Healthcare, UK). Nonspecific sites were blocked by incubation of the membrane in blocking buffer [5% nonfat dry milk in T-TBS (TBS containing 0.05% Tween 20)] overnight. The membranes were incubated with the indicated primary antibodies [toll-like receptor 4 (TLR4) (1:3000, Novus Biologicals), myeloid differentiation primary response 88 (MyD88) (1:3000, Abcam, Cambridge, UK), cleaved-caspase3 (1:1000, Cell Signaling Technology, Danvers, MA, USA), cleaved-PARP (1:1000, Cell Signaling Technology), tumor necrosis factor alpha (TNF-α) (1:1000, Cell Signaling Technology), tumor necrosis factor receptor associated factor 6 (TRAF6) (1:1000, Cell Signaling Technology), interleukin (IL)-1β (1:1000, Cell Signaling Technology), IL-6 (1:3000, Abcam), IL-10 (1:3000, Abcam), Bcl-2 (1:3000, Arigobio), and phosphorylated nuclear factor-κB (p-NF-κB) (1:1000, Cell Signaling Technology) and actin (1:10000, Merck)] for 1 hour at room temperature. Horseradish peroxidase-conjugated anti-rabbit immunoglobulin IgG (1:6000, Sigma-Aldrich) was used as a secondary antibody for 1 h of incubation at room temperature. The washing procedure was repeated eight times within 1 h. Immunoreactive bands were visualized by enhanced chemiluminescence (ECL; Amersham Biosciences, Amersham, UK) and exposed to Biomax L film (Kodak, Rochester, NY, USA). For the purpose of quantification, the ECL signals were digitized via LabWorks software (UVP, Waltham, MA, USA). Additionally, anti-rabbit IgG horseradish peroxidase–conjugated antibodies (1:2000, Cell Signaling Technology) were utilized. Furthermore, the results were normalized to beta-actin expression.
Immunofluorescence (IF)
The procedure and protocol for IF staining were described in our previous reports26–30. For IF staining, rehydrated paraffin sections were first treated with 3% H2O2 and incubated with Immuno-Block reagent (BioSB, Santa Barbara, CA, USA) for 30 minutes at room temperature. The sections were then incubated with primary antibodies specific for CD68 (1:500, Abcam), myeloperoxidase (MPO) (1:250, BIOSB), and CD11b/c (1:100, Abcam), while the sections incubated with irrelevant antibodies served as controls. Three sections of kidney and quadriceps muscle from each rat were analyzed. For quantification, three randomly chosen HPFs (200× or 400× for the IHC and IF studies) were analyzed in each section. The mean number of positively stained cells per HPF for each animal was then determined by summing all the numbers divided by 9.
Statistical analysis
The quantitative data are expressed as the means ± SDs. Statistical analysis was adequately performed by ANOVA followed by the Bonferroni multiple-comparison post hoc test. Statistical analysis was performed using SPSS statistical software for Windows version 22 (SPSS for Windows, version 22; SPSS, IL, USA). A value of P < 0.05 was considered statistically significant.
Results
ADMSCs suppressed inflammatory reactions
To test the impact of AMDSC treatment on the suppression of the inflammatory reaction, the macrophages (i.e. the RAW 264.7 cell line) were categorized into A1 (RAW 264.7 cells), A2 [RAW 264.7 cells + lipopolysaccharide (LPS) (100 ng/ml)], and A3 (RAW 264.7 + LPS + ADMSCs (1.0 × 10⁵ cells) (Fig. 1). Notably, RAW 264.7 cells + LPS were loaded at the bottom of the Transwell system. On the other hand, ADMSCs were loaded in the upper compartment of the Transwell system. After 24 h of culture, the RAW 264.7 cells were collected for individual studies.

ADMSCs suppressed inflammatory reactions. (a) Phosphorylated protein expression of nuclear factor (p-NF)-κB, * vs. other groups with different symbols (†, ‡), P < 0.001. (b) Protein expression of interleukin (IL)-1β, * vs. other groups with different symbols (†, ‡), P < 0.001. (c) Protein expression of IL-6, * vs. other groups with different symbols (†, ‡), P < 0.001. (d) Protein expression of tumor necrosis factor (TNF)-α, * vs. other groups with different symbols (†, ‡), P < 0.001. (e) Protein expression of IL-10, * vs. other groups with different symbols (†, ‡), P < 0.001. (f1–3) Illustrating the flow cytometric analysis for identification of M1+ cells. (f7) Analytical result of percentage (%) M1 cell expression, * vs. other groups with different symbols (†, ‡), P < 0.001. (f4–6) Illustrating the flow cytometric analysis for identification of M2+ cells. (f7) Analytical result of percentage (%) M2 cell expression, * vs. other groups with different symbols (†, ‡), P < 0.001. (f8) The ratio of M2 to M1, * vs. other groups with different symbols (†, ‡), P < 0.001. (f9) The ratio of cellular expression of M2 to M1, * vs. other groups with different symbols (†, ‡), P < 0.0001. (g1–3) Illustrating the flow cytometric analysis for identification of CD 11c/b+ cell expression. (g4) Cellular expression of CD 11c/b+ cells, * vs. other groups with different symbols (†, ‡), P < 0.001. (g5–7) Illustrating the flow cytometric analysis for identification of myeloperoxidase (MPO)+ cell expression. (g8) Cellular expression of MPO+ cells, * vs. other groups with different symbols (†, ‡), P < 0.001. (h1–3) Illustrating the immunofluorescent (IF) microscopic finding (400×) for identification of cell expression of macrophage migration inhibitory factor (MIF) (green color). Scale bar in right lower corner represents 20µm. (h4) Cellular expression number (%) of MIF+ cells, * vs. other groups with different symbols (†, ‡), P < 0.0001. (i) ELISA result of TNF-α derived from culture medium, * vs. other groups with different symbols (†, ‡), P < 0.001. (j) ELISA result of IL-10 derived from culture medium, * vs. other groups with different symbols (†, ‡), P < 0.001. All statistical analyses were performed by one-way ANOVA, followed by Bonferroni multiple comparison post hoc test (n = 3 for each group). Symbols (*, †, ‡) indicate significance (at 0.05 level). Cell grouping: A1 = RAW 264.7 cells; A2 = RAW 264.7 cells + lipopolysaccharide (LPS) (100 ng/ml); A3 = RAW 264.7 + LPS + ADMSCs (1 × 10⁵ cells). ADMSCs = adipose derived mesenchymal stem cells.
Western blot analysis or ELISA revealed that the protein expression levels of NF-κB, IL-1β, IL-6 and TNF-α, which are four indices of inflammation, were significantly increased in A2 compared with A1 and were significantly reversed in A3, whereas the protein expression of IL-10, an index of inflammation, exhibited the opposite pattern of NF-κB among the groups (Fig. 1a–e, Fig. 1i–j). Additionally, flow cytometric analysis revealed that the cellular expression of CD11b/c and myeloperoxidase (MPO), two indicators of inflammation at the cellular level, exhibited an identical pattern to that of MIF+ cells (Fig. 1h), whereas the ratio of M2 to M1, an anti-inflammatory indicator, exhibited an opposite pattern to that of MIF+ cells (Fig. 1f–h). Accordingly, our findings suggest that ADMSCs have anti-inflammatory effects.
ADMSC-treated RAW 264.7 and ADMSC treatment protected uroepithelial cells against inflammatory damage
To verify whether ADMSC-treated RAW 264.7 and ADMSC treatment could protect SV-40 immortalized human uroepithelial cells (SV-HUC-1) from LPS-induced damage, SV-HUC-1 cells were categorized into B1 (SV-HUC-1 cells), B2 (SV-HUC-1 cell line (loaded in the lower compartment of the Transwell) + RAW 264.7 cells + LPS (loaded in the upper compartment of the Transwell), B3 (SV-HUC-1 cells + collected RAW 264.7 cells from A3 (i.e. RAW 264.7 + LPS + ADMSCs/1.0 × 105 cells)] and A4 (SV-HUC-1 cells + LPS + ADMSCs (1 × 10⁵ cells) groups (Fig. 2).

ADMSCs-treated RAW 264.7 and ADMSCs treatment protected the uroepithelial cells against inflammatory damage. (a) Protein expression of TNF-α, * vs. other groups with different symbols (†, ‡, §), P < 0.001. (b) Protein expression of IL-6, * vs. other groups with different symbols (†, ‡, §), P < 0.001. (c) Protein expression of NF-κB, * vs. other groups with different symbols (†, ‡, §), P < 0.001. (d) Protein expression of cleaved caspase 3 (c-Casp3), * vs. other groups with different symbols (†, ‡, §), P < 0.001. (e) Protein expression of c-PARP, * vs. other groups with different symbols (†, ‡, §), P < 0.001. (f) Protein expression of IL-10, * vs. other groups with different symbols (†, ‡, §), P < 0.001. (g) Protein expression of Bcl-2, * vs. other groups with different symbols (†, ‡, §), P < 0.001. n = 3 from (a) to (e) groups. (h1–4) Illustrating the flow cytometric analysis for identification of early and late apoptosis. (h5) Analytical result of early (i.e. annexin V+/PI-), * vs. other groups with different symbols (†, ‡, §), P < 0.0001. (h6) Analytical result of late apoptosis (i.e. annexin V+/PI+), * vs. other groups with different symbols (†, ‡, §), P < 0.0001. (i1–4) Illustrating the IF microscopic finding (400×) for identification of cellular expression of γ-H2AX+ cells (pink color). Scale bar in right lower corner represents 20µm. (i6) Analytical result of number of γ-H2AX+ cells, * vs. other groups with different symbols (†, ‡, §), P < 0.0001. n = 5 from (h1) to (i5) groups. All statistical analyses were performed by one-way ANOVA, followed by Bonferroni multiple comparison post hoc test (n = 3-5 for each group). Symbols (*, †, ‡, §) indicate significance (at 0.05 level). Cell grouping: B1 (SV-HUC-1 cells), B2 (SV-HUC-1 cells + RAW 264.7 cells + LPS), B3 (SV-HUC-1 cells + ADMSCs-treated RAW 264.7) and 4 (SV-HUC-1 cells + LPS + ADMSCs). ADMSCs = adipose derived mesenchymal stem cells.
Western blot analysis revealed that the protein expression of three inflammatory biomarkers, TNF-α, IL-6 and NF-κB, and the protein expression of caspase 3 and PARP, two apoptotic biomarkers, were lowest in B1, highest in B2 and significantly lower in B4 than in B3, whereas the protein expression of IL-10, an indicator of anti-inflammatory activity, and the protein expression of Bcl-2, an indicator of antiapoptotic activity, displayed the opposite pattern of inflammatory biomarkers among the groups (Fig. 2a–g).
Flow cytometric analysis revealed that the early phase (i.e. annexin V+/PI-) and late phase of apoptosis (i.e. annexin V+/PI+) of SV-HUC-1 cells exhibited an identical pattern of inflammatory biomarkers among the groups (Fig. 2h), whereas the IF microscopic findings demonstrated that the cellular level of γ-H2AX+ cells, an indicator of DNA damage markers, exhibited an identical pattern of apoptosis among the groups (Fig. 2i). Our findings, therefore, proved that not only ADMSCs but also ADMSC-treated macrophages (i.e. RAW 264.7 cells) effectively attenuated inflammation, possibly through the release of the anti-inflammatory cytokine IL-10.
Impact of combined ADMSC and ciprofloxacin therapy on the suppression of inflammatory reactions
To verify whether combined ADMSC + ciprofloxacin therapy was superior to only one method for attenuating the inflammatory reaction, rat peripheral blood mononuclear cells (PBMNCs) were isolated and divided into the following groups: C1 (PBMNCs only), C2 [PBMNCs + LPS (100 ng/ml) incubated for 6 h, followed by culture for 24 h], C3 [PBMNCs + LPS + ADMSCs (1 × 10⁵ cells)], C4 [PBMNCs + LPS + ciprofloxacin (10 mM) incubated for 24 h], and 5 [PBMNCs + LPS + ADMSCs (1 × 10⁵ cells) + ciprofloxacin] (Fig. 3). After 12 h of culture, the cells were collected for individual studies.

Impact of combined ADMSCs and ciprofloxacin therapy on suppressing the inflammatory reaction. (a) Protein expression of toll-like receptor (TLR)-4, * vs. other groups with different symbols (†, ‡, §), P < 0.0001. (b) Protein expressions of myeloid differentiation primary response 88 (MYD88), * vs. other groups with different symbols (†, ‡, §), P < 0.0001. (c) Protein expression of TNF receptor associated factor 6 (TRAF6), * vs. other groups with different symbols (†, ‡, §), P < 0.0001. (d) Protein expression of NF-κB, * vs. other groups with different symbols (†, ‡, §), P < 0.0001. (e) Protein expression of IL-1β, * vs. other groups with different symbols (†, ‡, §), P < 0.0001. (f) Protein expression of TNF-α, * vs. other groups with different symbols (†, ‡, §), P < 0.0001. (g) Protein expression of IL-6, * vs. other groups with different symbols (†, ‡, §, ¶), P < 0.0001. (h1–5) Illustrating the flow cytometric analysis for identification of cellular expression of CD11b/c+ cells. (h6) Analytical result of level of CD11b/c+ cells, * vs. other groups with different symbols (†, ‡, §, ¶), P < 0.001. (i1–5) Illustrating the immunofluorescent (IF) microscopic finding (400×) for identification of cellular expression of CD68+ cells (green color). (i6) Analytical result of number of positively stained CD68 cells, * vs. other groups with different symbols (†, ‡, §, ¶), P < 0.0001. (j1–5) Illustrating the IF microscopic finding for identification of cellular expression of γ-H2AX+ cells (pink color). (j6) Analytical result of number of positively stained γ-H2AX cells, * vs. other groups with different symbols (†, ‡, §), P < 0.0001. Scale bar in right lower corner represents 20µm. All statistical analyses were performed by one-way ANOVA, followed by Bonferroni multiple comparison post hoc test (n = 3-6 for each group). Symbols (*, †, ‡, §, ¶) indicate significance (at 0.05 level). Cellular grouping: C1 = PBMNCs, C2 = PBMNCs + LPS, C3 = PBMNCs + LPS + ADMSCs, C4 = PBMNCs + LPS + ciprofloxacin, 5 = PBMNCs + LPS + ADMSCs + ciprofloxacin. ADMSCs = adipose derived mesenchymal stem cells; PBMNCs = peripheral blood mononuclear cells.
The results revealed that the protein expression levels of TLR-4, MyD88, TRAF6 and NF-κB, which are four indices of upstream inflammatory signaling, and the protein expression levels of IL-1β, TNF-α and IL-6, which are downstream inflammatory signals, were lowest in C1, highest in C2, and significantly lower in C5 than in C3 and C4; however, there was no difference between C3 and C4 (Fig. 3a–g). Additionally, flow cytometric analysis demonstrated that the cellular expression of CD11b/c+ cells, an indicator of inflammation at the cell level, displayed an identical pattern of inflammatory signaling among the groups (Fig. 3h). Furthermore, the IF microscopic findings revealed that the number of CD68+ cells, another index of inflammation at the cell level, and the number of γ-H2AX+ cells, an indicator of DNA damage, exhibited a similar pattern of inflammatory signaling among the groups. Our findings indicate that ADMSC-facilitated antibiotics ameliorate the inflammatory reaction (Fig. 3i–j).
TRL-4 mediated upstream and downstream inflammatory signaling in response to endotoxin stimulation, and the combination of ciprofloxacin and ADMSC-derived media suppressed bacterial CFUs
To verify whether the acute inflammatory signaling of TLR-4 was essential for upstream and downstream inflammatory signaling, the cells were categorized into the following groups: D1 (RAW 264.7 cells), D2 [RAW 264.7 cells + LPS (100 ng/ml), incubated for 6 h, followed by culture for 24 h], D3 [RAW 264.7 + LPS + ADMSCs (1 × 10⁵ cells), incubated for 6 h, followed by culture for 24 h], D4 (siRNA-TLR4 in RAW 264.7 cells + LPS) and D5 (siRNA-TLR4 in RAW 264.7 cells + LPS + ADMSCs) (Fig. 4). After 24 h of culture, the cells were subjected to Western blot analysis, and the results revealed that the protein expression levels of TLR-4, MyD88, TRAF6, NF-κB, TNF-α, IL-6, and IL-1β were notably greater in D2 than in D1, which was notably reversed in D3 and D4 and notably reversed in D5 compared with D3 and D4, indicating that TLR-4 might play a crucial role in the transport of inflammatory signaling from the extracellular membrane into the intracellular environment (Fig. 4a–g).
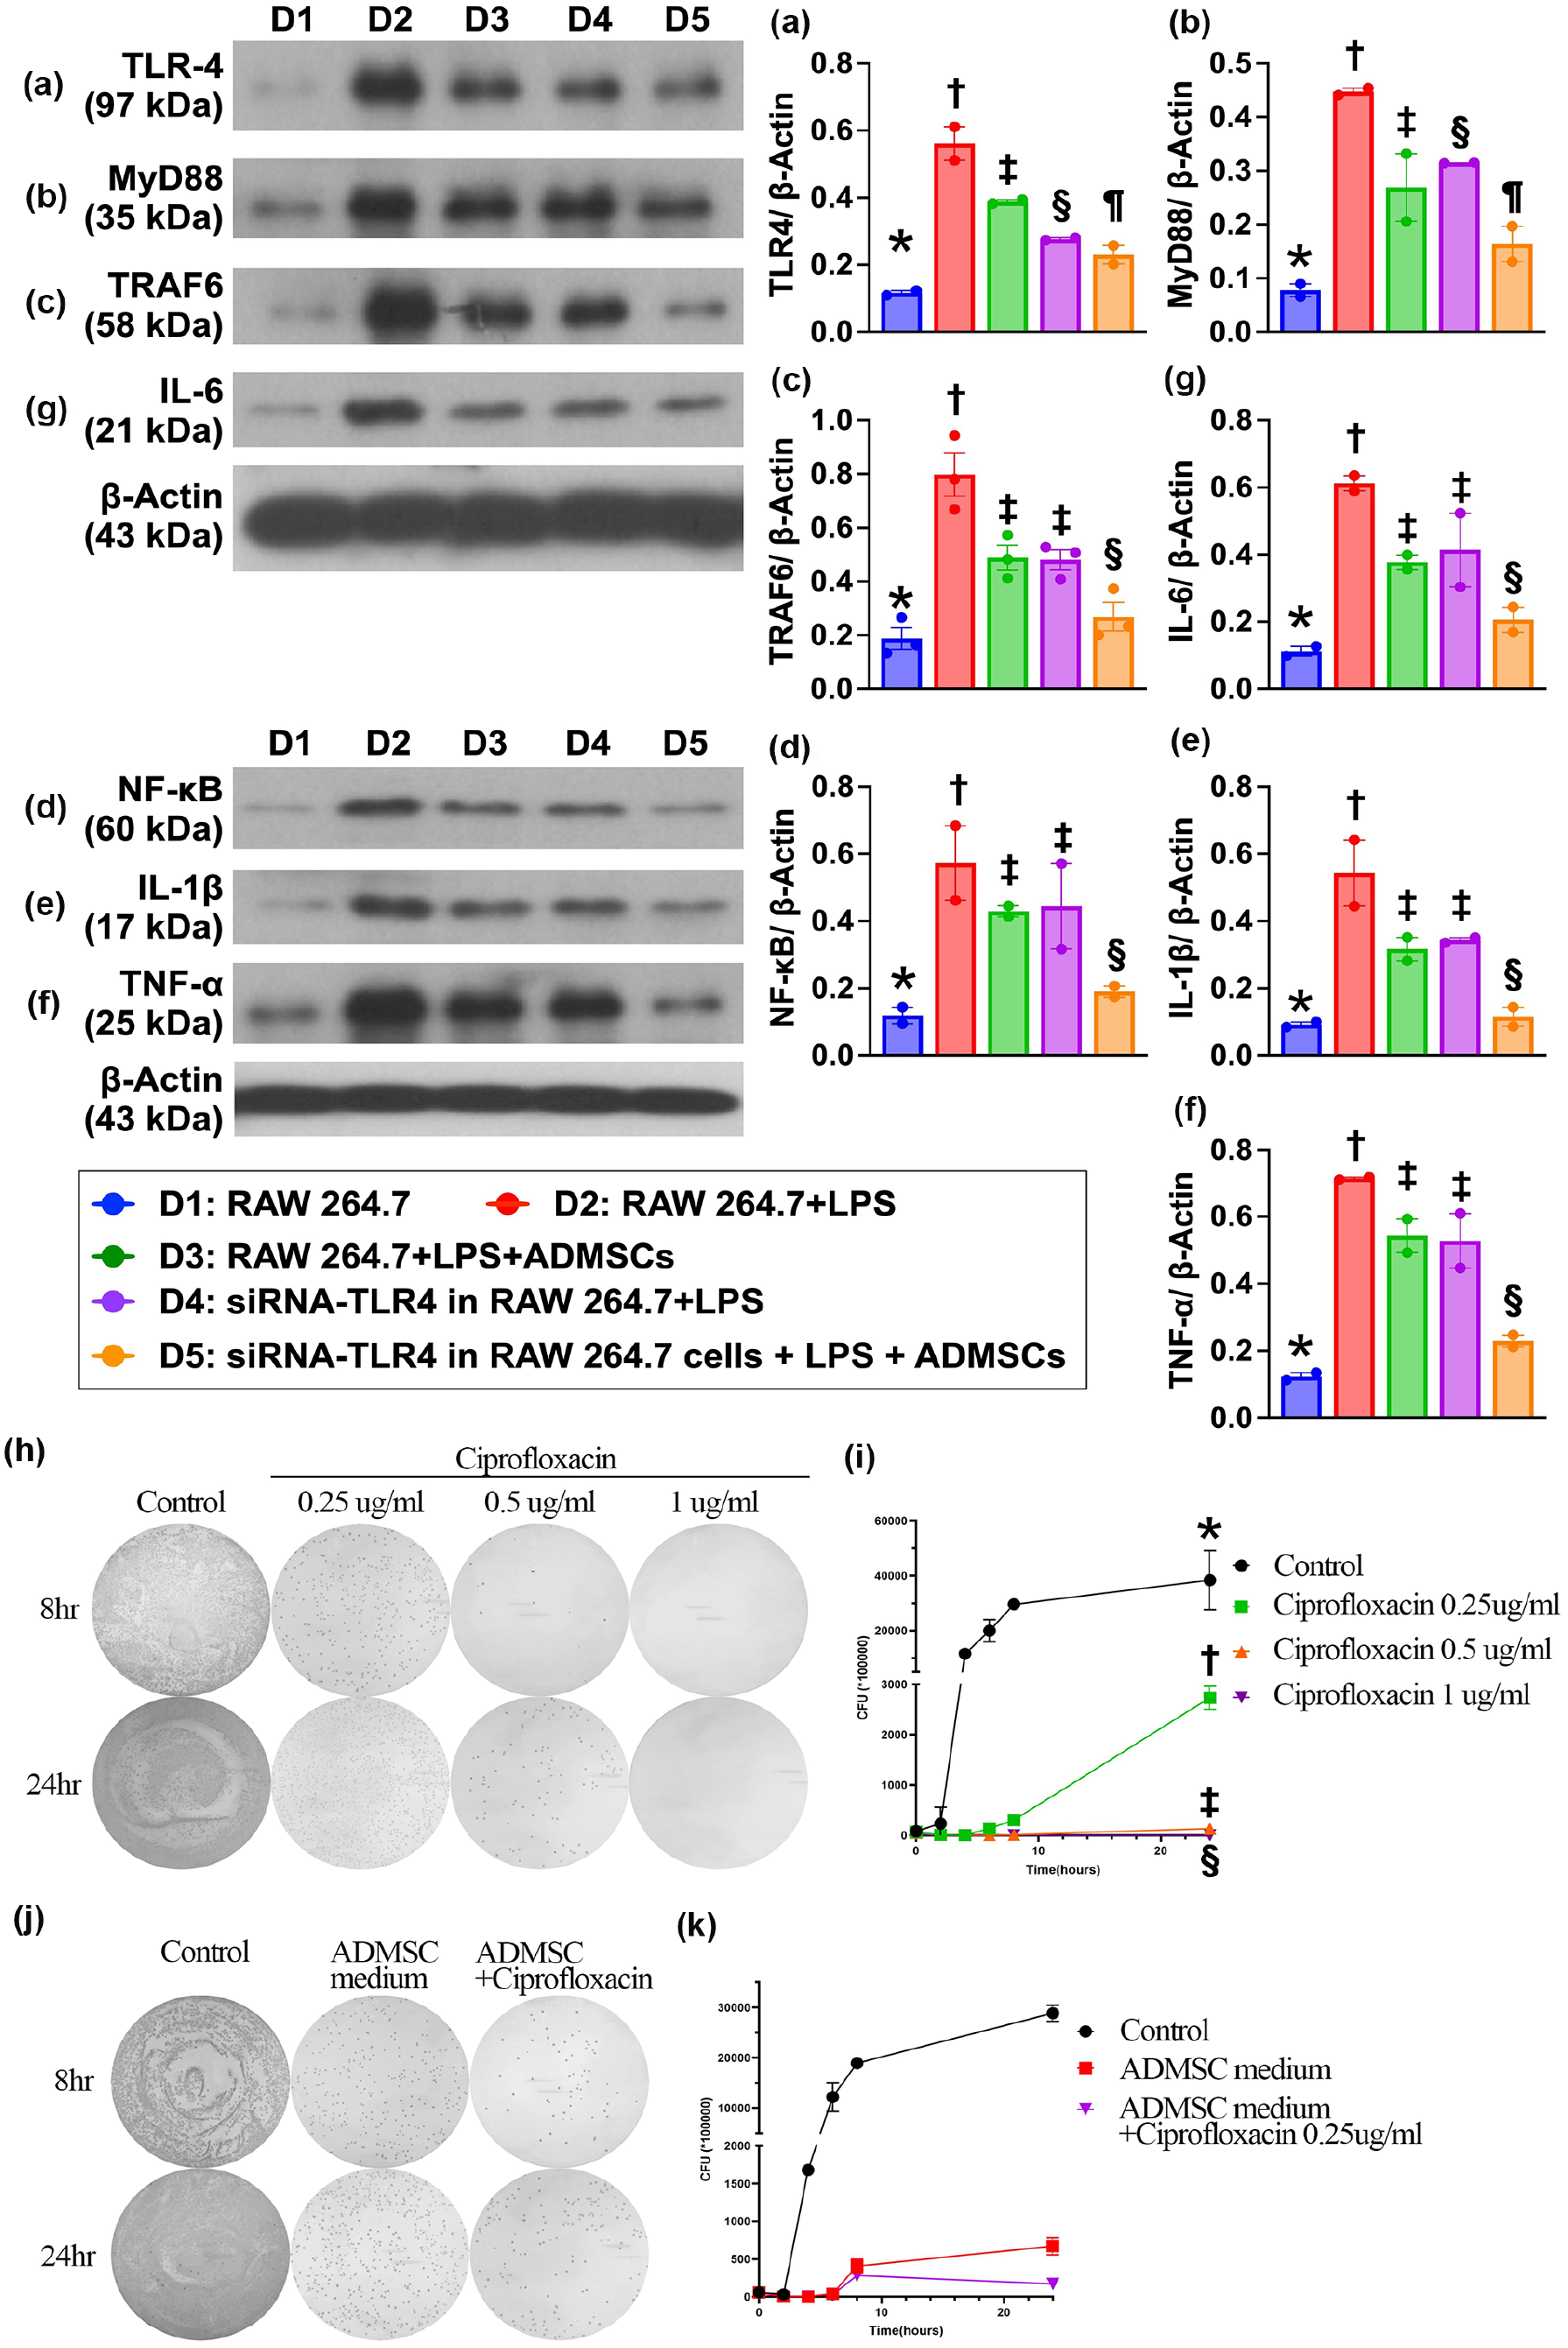
TRL-4 medicated upstream and downstream inflammatory signalings in response to endotoxin stimulation, and impact of ciprofloxacin and ADMSC-derived condition medium on suppressing the bacterial CFU. (a) Protein expression of TLR-4, * vs. other groups with different symbols (†, ‡, §, ¶), P < 0.0001. (b) Protein expression of MyD88, * vs. other groups with different symbols (†, ‡, §, ¶), P < 0.001. (c) Protein expression of TRAF6, * vs. other groups with different symbols (†, ‡, §), P < 0.0001. (d) Protein expression of NF-κB, * vs. other groups with different symbols (†, ‡, §), P < 0.0001. (e) Protein expression of IL-1β, * vs. other groups with different symbols (†, ‡, §), P < 0.001. (f) Protein expression of TNF-α, * vs. other groups with different symbols (†, ‡, §), P < 0.0001. (g) Protein expression of IL-6, * vs. other groups with different symbols (†, ‡, §), P < 0.0001. Cell grouping: D1 (RAW 264.7 cells), D2 (RAW 264.7 cells + LPS), D3 (RAW 264.7 + LPS + ADMSCs), D4 (siRNA-TLR4 in RAW 264.7 cells + LPS), D5 (siRNA-TLR4 in RAW 264.7 cells + LPS + ADMSCs). n = 3 for each group. (h) Illustrating the phenotype of colony formation unit (CFU) of bacterial growth at the time points of 8 h and 24 h with stepwisely increased concentrations (0, 0.25, 0.5 and 1.0 µg/ml) of ciprofloxacin treatment. (i) Indicated CFU plot to time curve at stepwise increased concentrations of 0, 0.25, 0.5 and 1 µg/ml. Noted that after the ciprofloxacin concentration increased up to 0.5 µg/ml, the bacteria were substantially suppressed. * vs. other groups with different symbols (†, ‡, §), P < 0.0001. n = 6 for each group. (j) Illustrating the time courses of bacterial CFU at time points of 8 h and 24 h with ADMSCs-derived condition medium or combined the condition medium and low dose of ciprofloxacin (i.e. 0.25 µg/ml) treatment. (k) Illustrating the time courses of CFU in different strategic treatment, including ADMS-derived condition medium or condition medium + ciprofloxacin 0.25 µg/ml, the bacteria were significantly suppressed by the former and more significantly by the latter treatment. Analytical results control vs. ADMSCs-derived condition medium as the culturing time passed from few hours to 24 h, P < 0.0001; P for trend <0.0001. Additionally, control vs. ADMSCs-derived condition medium + ciprofloxacin as the culturing time passed from few hours to 24 h, P < 0.0001; P for trend <0.0001. The much better effect in latter strategic treatment than in the former strategic treatment.
When we looked at the bacterial (i.e. E. coli) colony formation unit (CFU), we determined that this parameter was significant and progressively decreased as the concentration of ciprofloxacin was stepwise increased from 0, 0.25, 0.5, to 1.0 µg/ml as the culture time increased. Additionally, ADMSC-derived medium had a greater effect than low-dose ciprofloxacin on the suppression of CFUs as the culture time increased. Furthermore, when low concentrations of ciprofloxacin (i.e. 0.25 µg/ml) and ADMSC-derived media were combined, the effect on the suppression of CFUs was similar to the effect of higher doses (i.e. 0.5 µg/ml) of ciprofloxacin on the suppression of CFUs, indicating that ADMSCs facilitated the ability of antibiotics to suppress bacterial growth (Fig. 4h–k).
The mortality rate at the end of the study period and the time course of circulating levels of renal function and inflammatory biomarkers
At baseline, the circulating white blood cell (WBC) count and creatine and blood urea nitrogen (BUN) levels did not differ among the groups (Fig. 5). However, on days 2 and 5 after APN induction, the circulating levels of BUN and creatinine were significantly greater in group 2 (APN) than in groups 1 (SC), 3 (APN + ciprofloxacin), 4 (APN + ADMSCs) and 5 (APN + ciprofloxacin + ADMSCs) and significantly lower in group 1 than in groups 3, 4, and 5, but they were similar among the latter three groups.
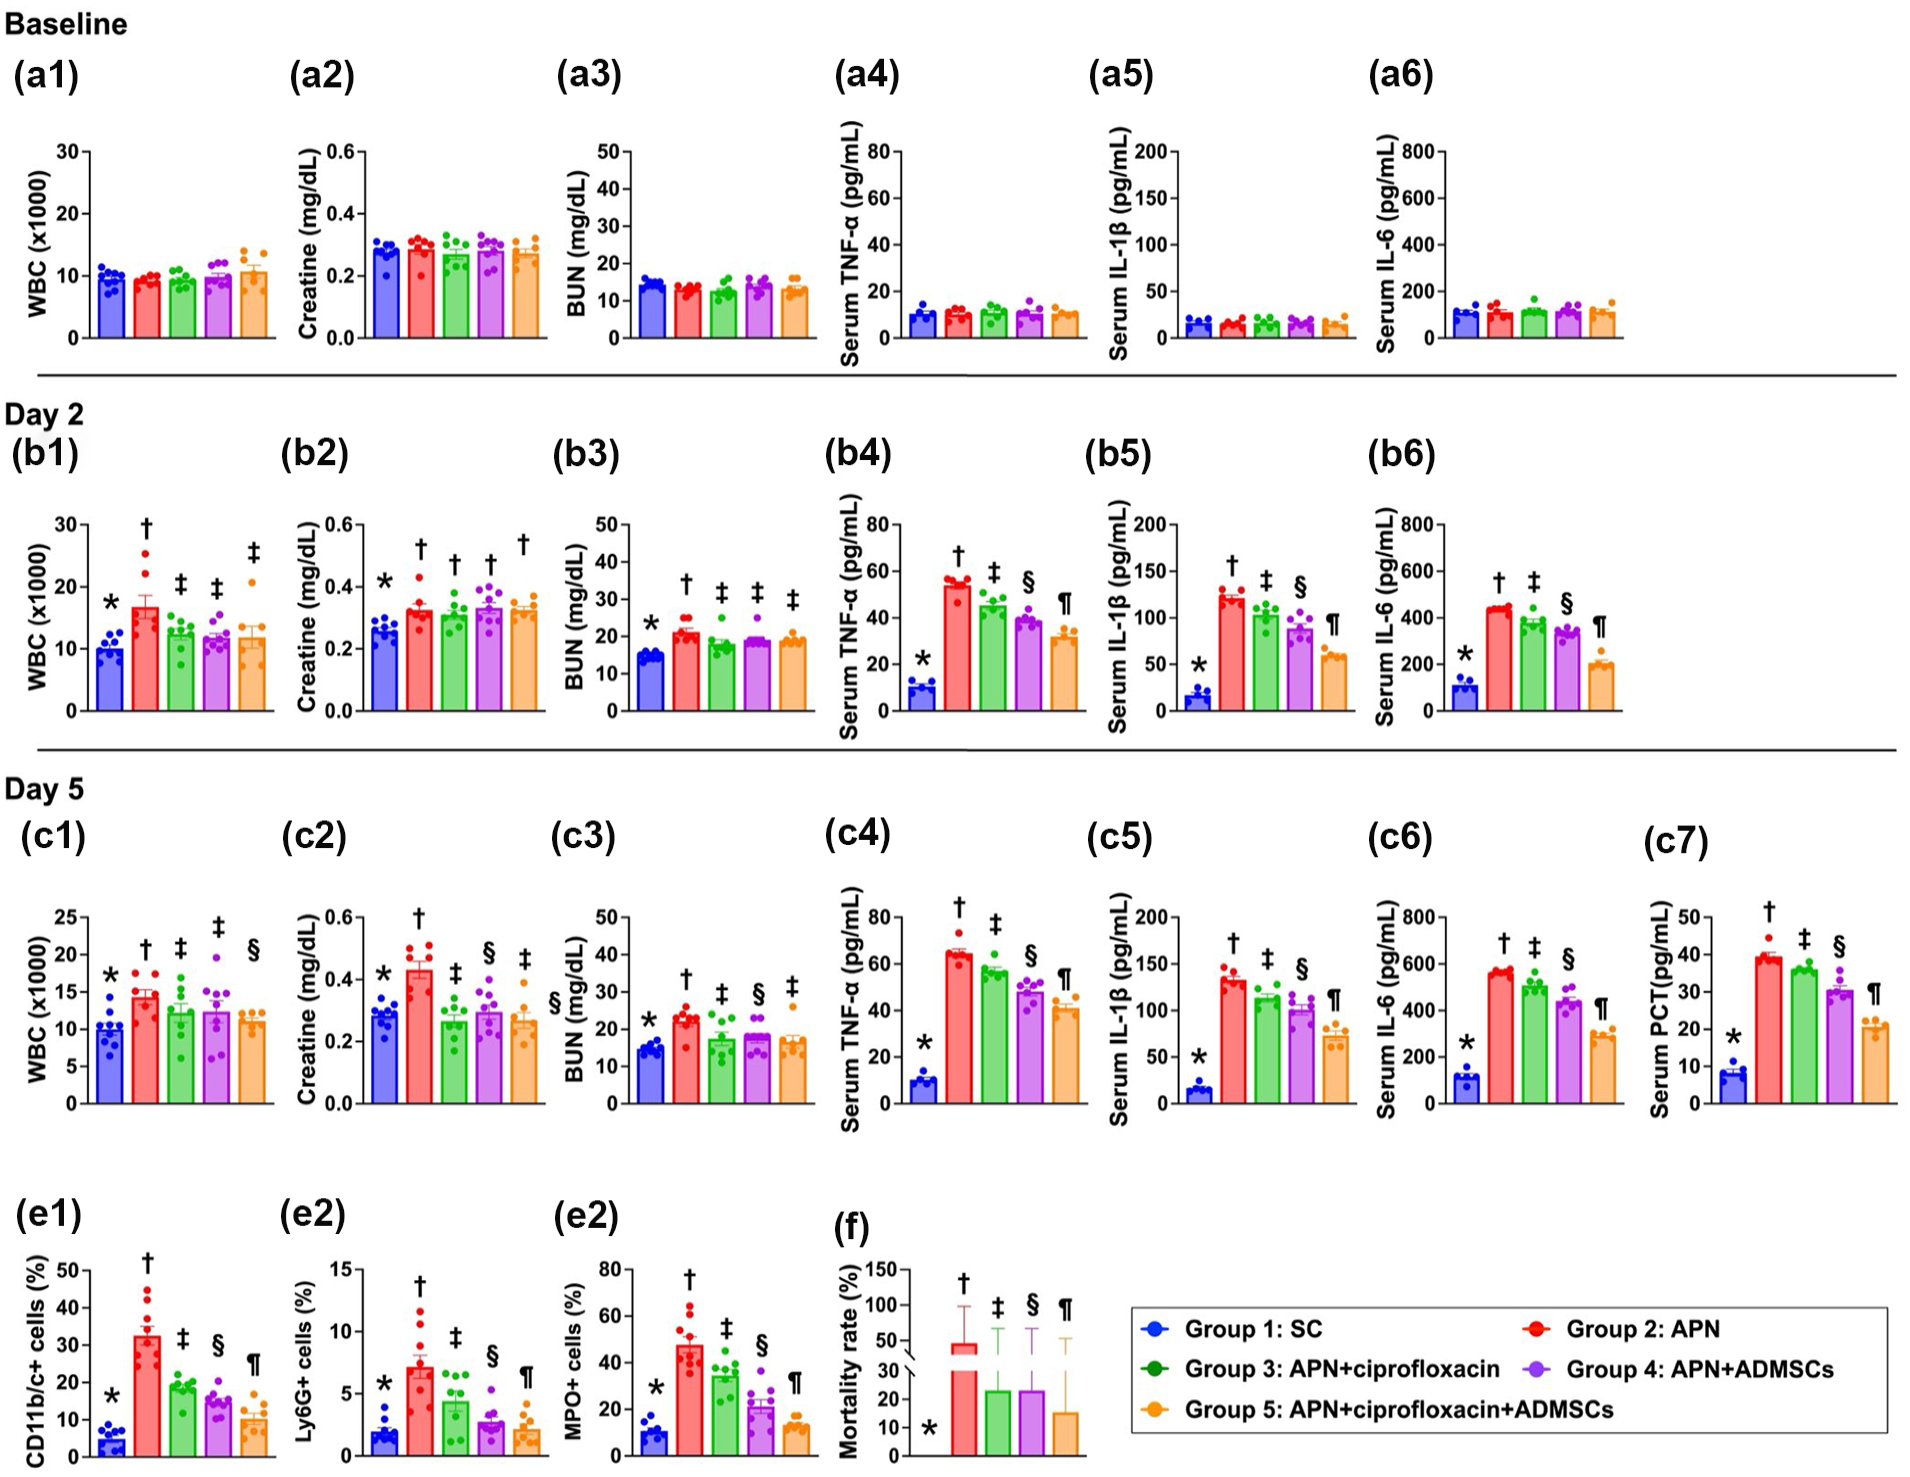
Time course of circulating levels of renal function and inflammatory biomarkers. (a1) Circulatory level of creatine at baseline, P > 0.5. (a2) Circulatory level of blood urine nitrogen (BUN) at baseline, P > 0.5. (a3) Circulatory level of white blood cell count (WBC) at baseline, P > 0.5. (a4) Circulating level of tumor necrosis factor (TNF)-α, P > 0.5. (a5) Circulating level of interleukin (IL)-1β, P > 0.5. (a6) Circulating level of IL-6, P > 0.6. (b1) Circulatory level of creatinine on day 2, * vs. †, P < 0.0001. (b2) Circulatory level of BUN on day 2, * vs. †, P < 0.0001. (b3) Circulatory level of circulating level of WBC on day 2, * vs. other groups with different symbols (†, ‡), P < 0.0001. (b4) Circulating level of TNF-α, * vs. other groups with different symbols (†, ‡, §, ¶), P < 0.0001. (b5) Circulating level of IL-1β, * vs. other groups with different symbols (†, ‡, §, ¶), P < 0.0001. (b6) Circulating level of IL-6, * vs. other groups with different symbols (†, ‡, §, ¶), P < 0.0001. (c1) Circulatory level of creatinine on day 5, * vs. †, P < 0.0001. (c2) Circulatory level of BUN on day 5, * vs. other groups with different symbols (†, ‡), P < 0.0001. (c3) Circulatory level of circulating level of WBC on day 5, * vs. other groups with different symbols (†, ‡), P < 0.0001. (c5) circulating level of TNF-α on day 5, * vs. other groups with different symbols (†, ‡, §, ¶), P < 0.0001. (c6) Circulating level of IL-6, * vs. other groups with different symbols (†, ‡, §, ¶), P < 0.0001. (c7) circulating level of IL-6 on day 5, * vs. other groups with different symbols (†, ‡, §, ¶), P < 0.0001. (c8) Circulating level of procalcitonin (PCT), * vs. other groups with different symbols (†, ‡, §, ¶), P < 0.0001. (e1) Flow cytometric analysis of circulating level of CD11b/c+ cells on day 4, * vs. other groups with different symbols (†, ‡, §, ¶), P < 0.0001. (e2) Flow cytometric analysis of circulating level of Ly6G+ cells, * vs. other groups with different symbols (†, ‡, §), P < 0.0001. (e3) Flow cytometric analysis of circulating level of myeloperoxidase (MPO)+ cells on day 4, * vs. other groups with different symbols (†, ‡, §), P < 0.0001. (f) The mortality rate on day 5, * vs. other groups with different symbols (†, ‡), p = 0.039. All statistical analyses were performed by one-way ANOVA, followed by Bonferroni multiple comparison post hoc test (n = 6-10 for each group). Symbols (*, †, ‡, §) indicate significance (at 0.05 level). group 1 (SC); group 2 (APN only); group 3 (APN + ciprofloxacin); group 4 (APN + ADMSCs); group (APN + ciprofloxacin + ADMSCs).
On days 2 and 5, after APN induction, the circulating WBC count was significantly greater in group 2 than in the other groups and significantly lower in group 1 than in groups 3, 4 and 5, but this parameter did not differ among groups 3, 4 and 5 (Fig. 5a–c).
The baseline circulatory levels of IL-1β, IL-6 and TNF-α, three proinflammatory cytokines, did not differ among the five groups. However, on days 2 and 5 after APN induction, ELISA revealed that the circulating levels of these three parameters were lowest in group 1 and significantly and progressively decreased from groups 2 to 5. Additionally, on day 5 after APN induction, the ELISA results revealed that the circulating level of PCT, an indicator of the severity of bacterial infection and sepsis, displayed a similar pattern of inflammatory cytokines among the groups (Fig. 5a–c).
On day 4 after APN induction, flow cytometric analysis revealed that the circulatory levels of CD11b/c+, MPO+ and Ly6G+ cells, three inflammatory biomarkers, were similar to the ELISA findings among the groups (Fig. 5e).
By day 5 after APN induction, the mortality rate was significantly greater in group 2 than in groups 1 and 5, but it was not different among groups 1, 3 and 5 (Fig. 5f).
Impact of ADMSC-facilitated ciprofloxacin therapy on the suppression of upstream and downstream inflammatory signaling by day 5 after APN induction
Western blot analysis was conducted to elucidate whether combined ADMSC and ciprofloxacin therapy was superior to only one treatment for suppressing the inflammatory reaction in the kidney parenchyma (Fig. 6). The results revealed that the protein expression levels of TLR-4, MyD88, TRAF6 and NF-κB, four indices of upstream signaling, and the protein expression levels of TNF-α, IL-1β and IL-6, three indicators of downstream signaling, were lowest in group 1, highest in group 2 and significantly lower in group 5 than in groups 3 and 4; however, these parameters did not differ between groups 3 and 4 (Fig. 6).

Impact of ADMSCs-facilitated ciprofloxacin therapy on suppressing the upstream and downstream inflammatory signaling by day 5 after APN induction. (a) Protein expression TLR-4, * vs. other groups with different symbols (†, ‡, §), P < 0.0001. (b) Protein expression of MyD88, * vs. other groups with different symbols (†, ‡, §), P < 0.001. (c) Protein expression of TRAF6, * vs. other groups with different symbols (†, ‡, §), P < 0.001. (d) Protein expression of NF-κB, * vs. other groups with different symbols (†, ‡, §), P < 0.001. (e) Protein expression of TNF-α, * vs. other groups with different symbols (†, ‡, §), P < 0.001. (f) Protein expression of IL-1β, * vs. other groups with different symbols (†, ‡, §), P < 0.001. (g) Protein expression of IL-6, * vs. other groups with different symbols (†, ‡, §), P < 0.001. All statistical analyses were performed by one-way ANOVA, followed by Bonferroni multiple comparison post hoc test (n = 6 for each group). Symbols (*, †, ‡, §) indicate significance (at 0.05 level). Group 1 (SC); group 2 (APN only); 3 (APN + ciprofloxacin); 4 (APN + ADMSCs); (APN + ciprofloxacin + ADMSCs).
Impact of ADMSC-facilitated ciprofloxacin therapy on the suppression of inflammatory cell infiltration and preservation of kidney parenchymal integrity by day 5 after APN induction
To assess the impact of ADMSC-ciprofloxacin therapy on alleviating cell infiltration in the kidney parenchyma, IF microscopy was conducted, and the results revealed that the cellular expression of CD68+ cells was lowest in group 1, highest in group 2 and significantly lower in group 5 than in groups 3 and 4; however, this parameter did not differ between the latter two groups (Fig. 7a–f) (Fig. 7).

Impact of ADMSCs-facilitated ciprofloxacin therapy on suppressing the inflammatory cell infiltration and preserving the kidney parenchymal integrity by day 5 after APN induction. (a–e) Illustrating the immunofluorescent (IF) microscopic finding (400×) for identification of cellular expression of CD68+ cells (green color). Scale bar in right lower corner represents 20µm. F) Analytical result of number of CD68+ cells, * vs. other groups with different symbols (†, ‡, §), P < 0.0001. (g–k) Microscopic examination (200×; H&E stain) demonstrated significantly higher loss of brush border in renal tubules (yellow arrows), tubular necrosis (green arrows), tubular dilatation (red asterisk), protein cast formation (black asterisk), and dilatation of Bowman’s capsule (blue arrows) in ANP group than in other groups. (l) Analytical result of kidney injury score, * vs. other groups with different symbols (†, ‡, §), P < 0.0001. Scale bar in right lower corner represents 50µm. All statistical analyses were performed by one-way ANOVA, followed by Bonferroni multiple comparison post hoc test (n = 6 for each group). Symbols (*, †, ‡, §) indicate significance (at 0.05 level). group 1 (SC); group 2 (APN only); 3 (APN + ciprofloxacin); 4 (APN + ADMSCs); (APN + ciprofloxacin + ADMSCs).
To evaluate the therapeutic impact of ADMSC-ciprofloxacin on protecting kidney architecture, H.E. staining was utilized in the present study. As we expected, the kidney injury score was lowest in group 1, highest in group 2 and significantly higher in groups 3 and 4 than in group 5, but there was no difference between groups 3 and 4 (Fig. 7g–l).
Impact of ADMSC-facilitated ciprofloxacin therapy on alleviating innate inflammatory cell expression in the kidney parenchyma by day 5 after APN induction
When we looked at the IF microscopic findings, we determined that the cellular expression of CD11b/c and MPO, two indices of innate inflammatory cells, was highest in group 2, lower in group 1 and significantly lower in group 5 than in groups 3 and 4, but they differed between the latter two groups (Fig. 8a–i) (Fig. 8).

Impact of ADMSCs-facilitated ciprofloxacin therapy on alleviating the innate inflammatory cell expressions on kidney parenchyma by day 5 after APN induction. (a–e) Illustrating the IF microscopic finding (400×) for identification of cellular expression of CD11b/c (red color). (f) Analytical result of number of CD11b/c+ cells, * vs. other groups with different symbols (†, ‡, §), P < 0.0001. (g–k) Illustrating the microscopic finding (400×) of immunohistochemical stain for identification of cellular expression of MPO (gray color). (f) Analytical result of number of CD11b/c+ cells, * vs. other groups with different symbols (†, ‡, §), P < 0.0001. Scale bar in right lower corner represents 20µm. All statistical analyses were performed by one-way ANOVA, followed by Bonferroni multiple comparison post hoc test (n = 6 for each group). Symbols (*, †, ‡, §) indicate significance (at 0.05 level). group 1 (SC); group 2 (APN only); 3 (APN + ciprofloxacin); 4 (APN + ADMSCs); (APN + ciprofloxacin + ADMSCs).
Discussion
This study, which included both in vitro and in vivo studies, investigated the ability of ADMSC-ciprofloxacin therapy to protect uroepithelial cells and rodent kidneys, has several promising implications. First, an in vitro study demonstrated that the ability of ADMSC-derived medium to effectively suppress bacterial CFUs was comparable to that of ciprofloxacin, and the combination of these two regimens was identified to be superior to either one for inhibiting bacterial growth. Second, ADMSC treatment markedly attenuated endotoxin-induced inflammatory reactions. Third, the ratio of M2 to M1 (i.e. the M2/M1 ratio) was significantly greater in macrophages treated with ADMSCs than in those not treated with ADMSCs, suggesting that ADMSCs educate macrophages to secrete IL-10, resulting in the suppression of inflammatory reactions. Finally, the results of the present study revealed that combined ADMSC-facilitated ciprofloxacin therapy protects the renal parenchyma and functions mainly through the downregulation of upstream and downstream inflammatory signaling.
Interestingly, a review article 39 recently emphasized that MSC-derived secretomes are composed of various biological capacities, including tissue repair, growth and immunomodulation, as well as the activation of regulatory anti-inflammatory phenotypes. One important finding in the present study was that ADMSC-derived conditioned medium was not inferior to ciprofloxacin in suppressing bacterial CFU. Another important finding was that ADMSC treatment protected uroepithelial cells against endotoxin-induced damage, resulting in alleviation of the apoptosis and DNA damage of these uroepithelial cells and PBMNCs. Accordingly, our findings were supported by a previous review 39 . The principal finding of the present in vitro study was that, using the Western blot analysis, TLR-4 mediated upstream and downstream inflammatory signaling in PBMNCs, and the inflammatory reaction played an essential role in LPS-induced SV-HUC-1 cell damage. Importantly, these inflammatory signaling pathways were suppressed by ADMSC or ciprofloxacin treatment and further suppressed by ADMSC-facilitated ciprofloxacin treatment.
MSCs are well known to have anti-inflammatory and immunomodulatory effects26–33. This is why experimental studies have shown that MSC treatment protects organs from sepsis syndrome (SS)-induced or ischemia-induced injury. Intriguingly, in this study, we found that ADMSC-treated macrophages protected uroepithelial cells (SV-HUC-1) from LPS damage. Additionally, the ratio of M2 to M1 macrophages, an anti-inflammatory indicator, was notably increased after ADMSC treatment in the in vitro study. Our findings, in addition to supporting the findings of previous studies26–33, could at least in part explain why ADMSC-treated macrophages protected SV-HUC-1 cells against LPS damage.
APN-associated obstructive uropathy (OUP) caused by urolithiasis frequently causes acute kidney injury 40 , whereas non-OUP is rarely reported to cause acute kidney injury 41 . In this experimental study, we found that the circulating levels of BUN and creatinine and the kidney injury score were significantly greater in Group 2 than in the other groups at days 2 and 5. In this way, our findings were not comparable with those of previous clinical observational studies 41 , which could, perhaps, be explained by inflammatory reactions in the kidney parenchyma.
APN is well known as a bacterial infection of the kidney and renal pelvis with the most common symptoms of flank pain, and laboratory identification of urinary tract infection as well as blood culture frequently reveals macrobacteria42–44. Without prompt diagnosis and appropriate antibiotics, APN can cause devastating sepsis and septic shock, resulting in unacceptably high mortality42–44. A principal finding in the present study was that the mortality rate was notably greater in APN animals than in APN animals treated with ADMSCs or ciprofloxacin, especially when these two regimens were combined. In this way, our findings, in addition to supporting the findings from previous studies42–44, encourage the consideration of MSC-facilitated antibiotics for those patients with emphysematous pyelonephritis, who are often refractory to a broad spectrum of antibiotics.
One would be interested in understanding the underlying mechanisms by which ADMSC-facilitated ciprofloxacin therapy protects the kidney parenchyma against APN damage and reduced mortality in the setting of APN. In fact, the underlying mechanisms were schematically illustrated in Fig. 9. Fig. 9 precisely pointed out that APN initiated acute upstream and downstream inflammatory signalings, i.e. DAMP-mediated signaling pathways (e.g. via TLR) on NF-κB activation and translocation for production of proinflammatory cytokines (TN-Fα, IL-1β, IL-6) which involved not only local but also systemic circulation, resulting in cell apoptosis, DNA damage and inflammatory cell infiltration in the kidney parenchyma. This could, at least in part, explain why APN induced kidney parenchymal damage and impaired renal function in this animal model. Importantly, these molecular-cellular perturbations were alleviated by ADMSC-ciprofloxacin therapy (i.e. the synergic effect) mainly through (1) anti-inflammation (effect from combined ADMSCs and ciprofloxacin therapy), (2) immunomodulation (effect from ADMSCs treatment) and killing the bacteria (effect from ciprofloxacin therapy) as well as promote tissue repair and regeneration (effect from ADMSCs treatment).

Schematically illustrated the underlying mechanism of ADMSCs-facilitated ciprofloxacin therapy on protecting the renal function and kidney parenchyma against APN damage.
Study limitations
Although the results of the present study are promising, the study period was relatively short and could not assess the long-term outcomes of APN rodents after receiving combined ADMSC and ciprofloxacin treatment. Second, several common inflammatory signaling pathways are known. Without the use of conditional knockdown of the TLR-4 gene in animals, we do not know that the upstream and downstream signaling reported in the present study is a novel and the only one signaling pathway that participates in APN in rodents. We could, therefore, only illustrate the underlying mechanism of upstream and downstream signaling of APN on the basis of our in vitro and in vivo studies (referred graphical abstract).
In conclusion, APN is a critical issue that should prompt diagnosis and treatment. Otherwise, it can cause high morbidity and mortality; currently, many bacteria have self-intrinsic gene modifications that frequently generate drug resistance. Accordingly, we propose that MSC-facilitated antibiotics may be a novel therapeutic modality for APN patients with severe sepsis. The results of the present study strongly support our hypothesis that MSCs could be good candidates for antibiotics to treat APN patients, especially those who are refractory to traditional treatment.
Supplemental Material
sj-docx-1-cll-10.1177_09636897251344851 – Supplemental material for Adipose-derived mesenchymal stem cell-supported ciprofloxacin therapy effectively protects the kidney parenchyma and functional integrity against acute pyelonephritis damage in rodents
Supplemental material, sj-docx-1-cll-10.1177_09636897251344851 for Adipose-derived mesenchymal stem cell-supported ciprofloxacin therapy effectively protects the kidney parenchyma and functional integrity against acute pyelonephritis damage in rodents by Chih-Chao Yang, Ya Yue, Pei-Lin Shao, Ben-Chung Cheng, Tsuen-Wei Hsu, Yi-Ling Chen, Sheung-Fat Ko, Hon-Kan Yip and Mel S. Lee in Cell Transplantation
Supplemental Material
sj-jpg-2-cll-10.1177_09636897251344851 – Supplemental material for Adipose-derived mesenchymal stem cell-supported ciprofloxacin therapy effectively protects the kidney parenchyma and functional integrity against acute pyelonephritis damage in rodents
Supplemental material, sj-jpg-2-cll-10.1177_09636897251344851 for Adipose-derived mesenchymal stem cell-supported ciprofloxacin therapy effectively protects the kidney parenchyma and functional integrity against acute pyelonephritis damage in rodents by Chih-Chao Yang, Ya Yue, Pei-Lin Shao, Ben-Chung Cheng, Tsuen-Wei Hsu, Yi-Ling Chen, Sheung-Fat Ko, Hon-Kan Yip and Mel S. Lee in Cell Transplantation
Footnotes
Acknowledgements
We thank Institute for Translational Research in Biomedical Sciences in Kaohsiung Chang Gung Memorial Hospital, which provided laboratory facilities and technical support for this study. We thank also Center for Laboratory Animals in Kaohsiung Chang Gung Memorial Hospital for the animal care.
Ethics considerations
The animal study was approved by the Institutional Animal Care and Use Committee at Kaohsiung Chang Gung Memorial Hospital (Affidavit of Approval of Animal Use Protocol No. 2022031601).
Statement of human and animal rights
This article does not contain any studies with human or animal subjects.
Statement of informed consent
There are no human subjects in this article and informed consent is not applicable.
Author contributions
CCY, YY, PLS, BCC, TWH, YLC, and SFK performed the experiments. CCY, PLS, YLC, and SFK are responsible for the analysis and interpretation of the data. YCC, HKY, and ML participated in manuscript writing. CCY, YLC and HKY designed the experiments, revised the manuscript. CCY provided financial support. All authors have read and approved the final manuscript.
Funding
The author(s) disclosed receipt of the following financial support for the research, authorship, and/or publication of this article: This study was supported by a project grant from Chang Gung Memorial Hospital, Chang Gung University [CMRPG8M0951]. We thank the molecular imaging core of the Center for Translational Research in Biomedical Sciences, Kaohsiung Chang Gung Memorial Hospital, Kaohsiung, Taiwan for technical and facility supports on Echo Vevo 2100.
Declaration of conflicting interests
The author(s) declared no potential conflicts of interest with respect to the research, authorship, and/or publication of this article.
Data availability statement
All data generated or analyzed during this study are included in this article. The datasets used during the current study are available from the corresponding author on reasonable request.
Supplemental material
Supplemental material for this article is available online.
References
Supplementary Material
Please find the following supplemental material available below.
For Open Access articles published under a Creative Commons License, all supplemental material carries the same license as the article it is associated with.
For non-Open Access articles published, all supplemental material carries a non-exclusive license, and permission requests for re-use of supplemental material or any part of supplemental material shall be sent directly to the copyright owner as specified in the copyright notice associated with the article.