
Abstract
Cord blood (CB) transplantation is a promising treatment for hematologic malignancies due to its strong graft-versus-leukemia effect and a low incidence of graft-versus-host disease. However, the risk of infection caused by delayed engraftment has limited its clinical application. In this study, we compared the single-cell RNA-seq of CB, bone marrow (BM), and granulocyte colony–stimulating factor primed BM to understand the differences between these grafts from a comprehensive view, and verified some differences in our clinical data of patients receiving transplantation. We focused on the biological features of key cell types involving the hematopoietic reconstitution and immune reconstitution. Based on the comparison of homing signal and differentiation potential of hematopoietic stem/progenitor cells (HSPCs), CB exhibited a lower content of HSPCs with weaker homing ability but higher stemness than BM. In addition, CB had a higher proportion of naïve T cells, while BM had a higher abundance of effector and memory T cells. Notably, the CD4+ naïve T cells in CB were prone to differentiate into Tregs. In response to neoantigens, the immune activation interactions between T cells and antigen-presenting cells were strong in CB, including CD40_CD40LG, IL16_CD4, and so on. In our clinical data, the subpopulation variations of T cells and the status of monocytes after transplantation were consistent with the results of the single-cell RNA-seq study above. CB, as a new birth system, is immature and active; several mechanisms contribute to its good anti-tumor effect, which can be introduced to other grafts. These findings provide insights into the development of new strategies for hematologic malignancies treatment.
Introduction
With the application of cord blood transplantation (CBT), the vivid features of cord blood (CB) are revealed. The strong graft-versus-leukemia (GVL) effect and the low incidence graft-versus-host disease (GVHD) of CBT are of interest to us1,2. Meanwhile, the wide range of sources and short waiting time after human leukocyte antigen (HLA) matching make CB as an attractive transplant option for hematological malignancies. Nonetheless, the elevated risk of infection and medical expenses resulting from the delayed engraftment of CBT remain challenging issues in clinical practice. Furthermore, the immature and initialized system state of CB poses difficulties in determining the evolutionary characteristics after transplantation.
Some studies have explored the aforementioned features of CBT. Hiwarkar et al. 3 demonstrated that CCR7+ CD8+ T cells can infiltrate tumors better, thereby promoting the cytotoxic T cells and Th1 in the tumor microenvironment. They also found that CD4+ T cells in CB demonstrate rapid proliferation, which is triggered by the T-cell receptor (TCR) signaling pathway 4 . These features are concentrated in a single-cell type of CB rather than an interacting system. In addition, CB is acquired at birth and acts as a bridge from the fetus to the adult, thus its biological characteristics differ from those of a graft from an adult or adolescent.
Currently, the use of granulocyte colony–stimulating factor (G-CSF)–primed peripheral blood stem cells (G-PBSC) and G-CSF–primed bone marrow (G-BM) for allogeneic hematopoietic stem cell transplantation (allo-HSCT) is more common than CB 5 . When we compare the transcriptome of CB, G-PBSC, and G-BM, it will provide a new perspective for us to understand the dynamic changes after transplantation. The clinical manifestations after transplantation, such as GVHD, were statistically different among these types of grafts, suggesting that at least some of the differences could be explained by the grafts’ characteristics. Although the transcriptional profiling is static, it provides a snapshot of the system’s characteristics. The projection of the high-dimensional transcriptome at a specific angle may provide insights into a patient’s specific response to different types of grafts.
With the development of single-cell RNA-seq technology, shared sequencing data have increased rapidly, which helps us to compare different grafts more comprehensively and precisely. In this study, we used three public datasets to analyze the cell lineage phenotypes in three grafts, including CB, G-BM, and the BM before G-CSF primed. Unfortunately, there is no G-PBSC data available for further exploration. Overall, these grafts differ in terms of cell composition, direction of cell differentiation, and cell interactions, all of which are related to the major post-transplantation concerns such as hematopoietic and immune reconstitution. Combined with our clinical data, the analysis results of single-cell RNA-seq were partially verified. The identification of CB characteristics is helpful for its application in transplantation.
Materials and Methods
Data Collection
The single-cell RNA-seq datasets used to analyze the features of major cell lineages in G-BM (postG-BM), BM before G-CSF primed (preG-BM), and CB were obtained from NCBI Gene Expression Omnibus (GEO) database (accession numbers GSE193138 6 and GSE162950 7 ) and CNGB Nucleotide Sequence Archive (CNSA; accession number CNP0000090 8 ). The above three datasets were generated using the 10x Genomics protocol. The GSE193138 dataset contained two preG-BM samples and two postG-BM samples from two healthy adults before and after treatment with recombinant G-CSF at a dosage of 5 μg/kg body weight per day for 5 consecutive days. Dataset No. CNP0000090 contained two CB samples, but the content of HSPCs was too small. To better explore the biological characteristics of HSPCs in CB, we introduced the dataset GSE162950. In GSE162950 dataset, the sample of CB in 40 weeks was used; since the CD34+ cells were enriched by human CD34 microbead, there were enough HSPCs to perform the analysis. The data acquisition and analysis were conducted in accordance with the relevant provisions of NCBI and CNSA.
Data Process and Cell Type Identification
The gene expression matrices were downloaded from the above databases and processed using the R package Seurat 4.0 (New York University, NY, USA) 9 . Cells with less than 300 feature genes, less than 1,000 counts, or more than 10% mitochondrial counts were removed as low-quality cells. Then the doublets were also removed by the R package DoubletFinder (University of California, CA, USA) 10 . The expressions were log-normalized and the top 2,000 highly variable genes were filtered and scaled for further analysis. As for the batch effect of four BM samples (two postG-BM samples and two preG-BM samples) and two CB samples was removed by canonical correlation analysis (CCA) of Seurat, respectively. The data were then used for dimensionality reduction by RunPCA and RunUMAP functions, clustering by FindNeighbors and FindClusters functions. In addition, the integration anchors and the dimensionality reduction were based on the first 30 principal components (PCs).
After cell projection into two-dimensional spaces and clustering, the signature genes of each cluster were identified by FindAllMarkers function. Then based on the canonical markers of HSPCs (marked by CD34, SPINK2, CRHBP, and ANGPT1), T cells (marked by CD3G, CD3D, and IL7R), natural killer (NK) cells (marked by KLRF1, GNLY, PRF1, and GZMB), B cells (marked by IGKC, IGHM, MS4A1, and CD79B), erythroid/megakaryocytes (Ery/Meko; marked by AHSP, HBG1, and TUBB1), and myeloid cells (marked by S100A8, S100A9, FCN1, and SERPINA1), the cell type of each cluster was annotated. Then the subpopulations of the major cell lineages were further distinguished by clustering and canonical markers. The above workflow was performed in each dataset respectively. When comparing the same cell type among different datasets, the batch effect was first removed by the CCA method of Seurat.
Trajectory Inference and Branch-Dependent Gene Analysis
The cell differentiation trajectory of HSPCs in three different grafts was constructed using the Monocle2 package (University of Washington, WA, USA) 11 . Genes with a mean expression larger than 0.1 were filtered by the differentialGeneTest function with the parameter of cell type. The cells were ordered based on genes with adjusted P-values <0.01 and without mitochondrial and ribosomal genes. After that, the cells were reduced in dimension by the DDRTree method and visualized by the plot_cell_trajectory function. To obtain the genes involved in cell differentiation, the branched expression analysis modeling (BEAM) was applied, and genes with both P-value and q-value <1e-5 were filtered.
Regulon Activity Calculation
To analyze the hematopoietic and T cell differentiation–related transcription factors (TFs) activity, the SCENIC package (VIB Center for Brain & Disease Research, Leuven, Belgium) was used to analyze the co-expression of target genes 12 . The regulon activity was calculated by the AU Cell package to evaluate the activity of differentiation-related TFs in same cell types from different grafts.
The Projection of CD4+ Naïve T Cells
The CD4+ naïve T cells can differentiate into Treg or Th cells, which have an impact on GVHD and GVL effects. Therefore, this study evaluated the differentiation trend of CD4+ naïve T cells. The normalized gene expression profile of Treg and Th cells in each graft was extracted and analyzed using non-negative matrix factorization (NMF). Here, the NMF was set to the “Brunet” method and performed 100 iterations with the cluster number of 2. Then the two basis vectors which can represent the biological characteristics of Treg and Th cells were used to identify the differentiation trend of CD4+ naïve T cells in each graft. The normalized gene expression profile of CD4+ naïve T cells was projected onto the two basis vectors for analysis, and the differentiation trend of CD4+ naïve T cells was divided by a diagonal in the two-dimensional space of the above two basis vectors. The method was validated by the projection of Treg and Th cells on two basis vectors.
Calculation of the Entropy of HSPCs
To analyze the differentiation potential of each subpopulation in HSPCs, the entropy of each subpopulation was calculated. The cell differentiation trends were defined through the chaos of subpopulation expression profiles. According to the elbow plot, we used 30 PCs for dimensionality reduction, and the RunPCA function of Seurat was applied to the HSPCs subset in two datasets (HSPCs in postG-BM and the HSPCs in CB) to get the cell distribution in the PC space. Then the cell distribution was calculated by Gaussian kernel density estimation, the total entropy of each subpopulation was calculated as the weighted sum of the entropy of each PC as equation (1), and the weight was the proportion of the variance of each PC in the total variance. Here,

Differentially Expressed Genes (DEGs) and Biological Function Enrichment
DEGs were identified by the FindMarkers function of Seurat, with the Wilcoxon rank-sum test employed as the methodology. To determine the DEGs, the threshold of DEGs was set as| log2-fold-change| >0.5 and adjusted P-values < 0.01. The biological functions of DEGs were enriched by gene set enrichment analysis (GSEA, Whitehead Institute/MIT Center for Genome Research, MA, USA) 13 , and the biological functions of interest genes were enriched by gene ontology (GO, Stanford University, CA, USA) analysis 14 from R package clusterProfiler (Jinan University, Guangzhou, China) 15 .
The Homing Ability Comparison of hematopoietic stem cells (HSCs)
To evaluate the homing ability of HSCs in the three grafts, we compared the normalized expression of CXCR4, since CXCR4 was an important receptor for HSCs homing to the bone marrow 16 . Prior to comparison, the batch effect was removed by CCA method of Seurat.
Cell Communication Analysis and Target Gene Prediction
Cell communications between T cells and other immune cells were inferred by the CellChat package (University of California, CA, USA) 17 , with the CellChatDB human database utilized as the reference for ligands and receptors. The presence and the information flow of interaction pathways between the same cell types were compared in the three grafts and visualized as the bubble plot. To identify the target genes of the altered interaction pathways, the potential target genes were matched according to the database of NicheNet (VIB Center for Inflammation Research, Ghent, Belgium) 18 . The strength of the regulatory relationship was measured by the correlation between the expression level of target genes and receptor genes in the same cells.
The Clinical Data Acquisition
Clinical data used to validate the transcriptome analysis results were obtained from the patients who received transplantation at Children’s Hospital of Nanjing Medical University and Nanjing Drum Tower Hospital. The Ethics Committee of Children’s Hospital of Nanjing Medical University approved the use of clinical information of patients (No. 202301006-1). Blood routine examination results of 20 patients who received CBT, peripheral blood stem cell transplant (PBSCT), and BM combination with PBSCT (BCPT) were collected in the first, second, and third months after transplantation. T cell immune function test data of these patients within 6 months after transplantation were also collected. Patients were then divided into two groups: a CBT group consisting of 10 CBT patients and a non-CBT (NCBT) group consisting of 8 PBSCT and 2 BCPT patients.
Statistical Analysis
All analyses were performed by R (4.2.1), and the packages used in each step were mentioned in the above methods. Data visualization was mainly performed using R packages ggplot2, ggsci, and ComplexHeatmap. In all figures, data were presented as the mean ± standard error of the mean, the significance analysis was performed by t-test or Wilcoxon test, and the multiple testing was adjusted by the Bonferroni method. The acceptable level of significance set at P < 0.05; P-values were shown in figures as *P < 0.05, **P < 0.01, ***P < 0.005, ****P < 0.0001, and ns: not significant.
Results
The Different Components of the Three Grafts
We collected three public datasets from GEO and CNSA databases to analyze the biological characteristics of each cell component in CB, postG-BM, and preG-BM. The detailed information of the three datasets has been described in the “Methods” section. Following the standard process of Seurat, we obtained a total of 21,955 cells from postG-BM and preG-BM datasets, 16,970 cells from the CB dataset, and 9,409 cells from the dataset only containing the HSPCs from CB.
The major cell types of the three grafts were essentially the same, as visualized by uniform manifold approximation and projection (UMAP) in Fig. 1B. The canonical markers used to distinguish HSPCs, Ery/Meko, B cells, T cells, NK cells, and myeloid cells were shown in the heatmap (Fig. 1C). As the cells in postG-BM and preG-BM dataset were fluorescence-activated cell sorting enriched by CD45 and CD66b, we did not compare the cell composition ratio of the three grafts. However, we observed a significant increase in the composition of HSPCs in BM after G-CSF priming.
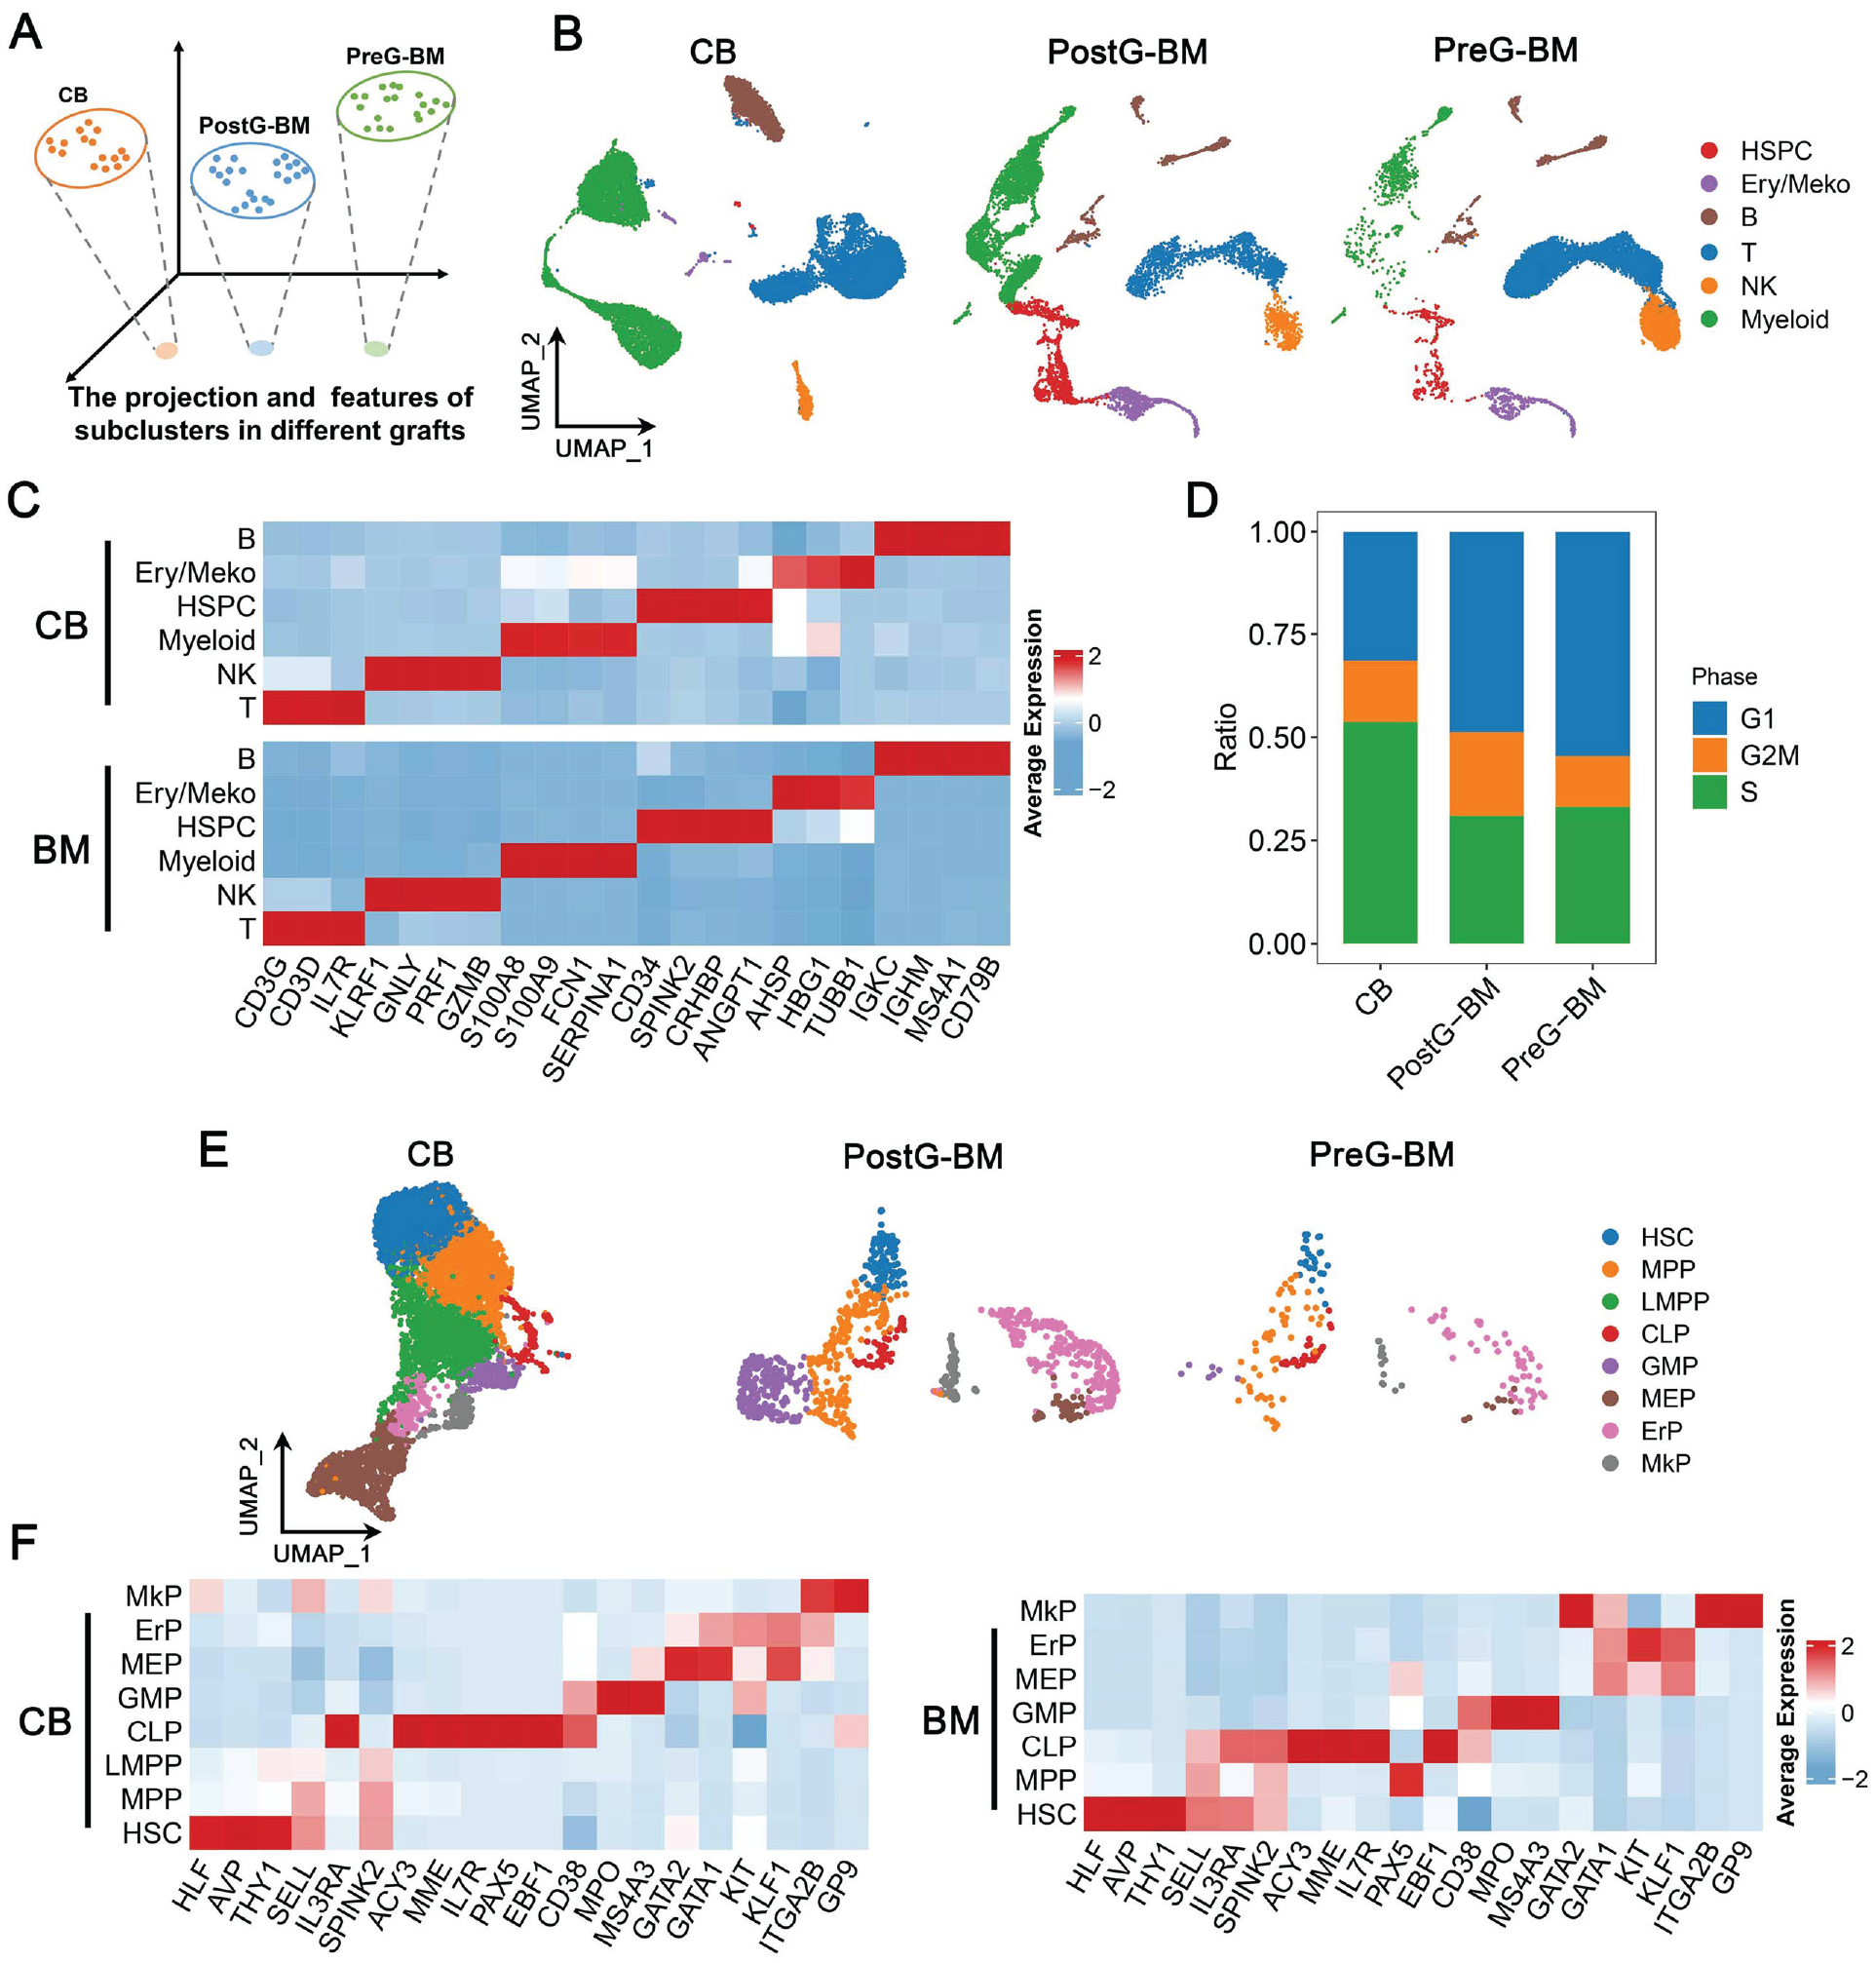
The whole landscape of CB, postG-BM, and preG-BM. (A) The major cell types of the three grafts were identified and visualized by UMAP. (B) Heatmap of scaled mean canonical markers gene expression in major cell types of CB and BM. (C) The distribution of cell cycle phase of HSPCs in the three grafts. (D) The subpopulations of HSPCs were identified and visualized by UMAP. (E) Heatmap of scaled mean canonical markers gene expression in subpopulations of HSPCs from CB and BM. CB: cord blood; BM: bone marrow; UMAP: uniform manifold approximation and projection; HSPCs: hematopoietic stem/progenitor cells; NK: natural killer; HSC: hematopoietic stem cells; MPP: multipotent hematopoietic progenitor; LMPP: lymphoid-primed multipotent progenitor; CLP: common lymphoid progenitor; GMP: granulocyte–monocyte progenitor; MEP: megakaryocyte–erythrocyte progenitor; ErP: erythrocyte progenitor; MkP: megakaryocyte progenitor.
Hematopoietic reconstitution and immune reconstitution are pivotal events in the post-transplantation period, directly impacting patient prognosis. Successful hematopoietic reconstitution ensures the replenishment of blood cells, while immune reconstitution is essential for GVL effect. T cells and antigen-presenting cells (APCs) can mediate the identification of minor histocompatibility antigens, alloantigens, and leukemia-associated antigens to induce the GVL effect 19 . Thus, we mainly investigated HSPCs, T cells, and APCs in further data analysis.
HSPCs With Higher Differentiation Potential and Lower Homing Ability in CB
As for the hematopoietic reconstitution, we first compared the HSPCs in the three grafts. According to the HSC differentiation map 20 , HSPCs were clustered into eight subpopulations, namely HSC, multipotent hematopoietic progenitor (MPP), lymphoid-primed multipotent progenitor (LMPP), common lymphoid progenitor (CLP), granulocyte–monocyte progenitor (GMP), megakaryocyte–erythrocyte progenitor (MEP), erythrocyte progenitor (ErP), and megakaryocyte progenitor (MkP; Fig. 1E). The heatmap displayed the marker genes scaled mean expression in the above subpopulation (Fig. 1F). The cell proliferation ability was shown in Fig. 1D; we calculated the cell phase distribution of HSPCs without HSCs, because the proliferation of HSCs can be affected by cell stemness and the niche in which the cell is located 21 . According to the cell phase distribution, a higher proportion of HSPCs from CB was in the S and G2M phases, suggesting that the proliferation rate of HSPCs in CB after transplantation may be faster than that of BM. Furthermore, after the G-CSF priming, there were more HSPCs in the G2M state in BM.
Then we ordered HSPCs in pseudo-time trajectories (Fig. 2A), and set the branch containing the most HSCs as the “root,” in other words, the starting point of differentiation. There were two branches, one containing mainly CLP and GMP, known as Lym/Gran fate, and the other containing mainly MEP, Erp, and MkP, known as the Ery/Meko fate. This was consistent with the neutrophil engraftment and platelet engraftment after transplantation. We observed a higher quantity of LMPP in CB than in BM, and distinguishing between LMPP and MPP in BM was challenging.

The differentiation features and potential of HSPCs in CB, postG-BM, and preG-BM. (A) The HSPCs differentiation trajectory was inferred by monocle2. (B) The entropy of each subpopulation in HSPCs of CB and postG-BM. (C) The heatmap of branch-dependent genes expression with trajectory pseudo-time in CB. These genes were clustered and their biological process function was shown in the right panel. (D) The heatmap of branch-dependent gene expression with trajectory pseudo-time in postG-BM. (E) The heatmap of branch-dependent gene expression with trajectory pseudo-time in preG-BM. (F) The scaled mean activity of TFs in HSC, LMPP, and MPP from CB, postG-BM, and preG-BM. (G) The CXCR4 relative mean expression of HSCs from CB, postG-BM, and preG-BM compared to the CXCR4 mean expression of all HSPCs in the same graft. HSPCs: hematopoietic stem/progenitor cells; CB: cord blood; BM: bone marrow; TFs: transcription factors; HSC: hematopoietic stem cells; LMPP: lymphoid-primed multipotent progenitor; MPP: multipotent hematopoietic progenitor; CLP: common lymphoid progenitor; GMP: granulocyte–monocyte progenitor; MEP: megakaryocyte–erythrocyte progenitor; ErP: erythrocyte progenitor; MkP: megakaryocyte progenitor; UMAP: uniform manifold approximation and projection.
To compare the specificity of HSPCs differentiation potential, we obtained the distribution of cells in the PC space by linear dimension reduction to calculate the entropy of each HSPC subpopulation. As the content of HSPCs in preG-BM samples was too low, we only compared the content of HSPCs in CB and postG-BM samples. The entropy of HSPCs in CB was higher than that of postG-BM, possibly indicating that the hematopoietic lineage in CB has not yet specialized, and even has higher stemness (Fig. 2B). In addition, the entropy of subpopulations in the same graft decreased from HSC to MkP, except for the MEP in CB, which was similar to the differentiation process of pseudo-time trajectories.
The branch-dependent genes play a crucial role in determining the cell fate at the branch point. To identify the branch-dependent genes, the BEAM of monocle was implemented. As shown in Fig. 2C–E, the differentiation of HSPCs in CB was observed to be highly active, with numerous branch-dependent genes displaying significant variation in this process. These genes were mainly involved in iron ion transport to promote erythroid development, megakaryocyte differentiation, and the generation of T cells, B cells, and neutrophils. In addition, HSPCs in preG-BM maintained normal hematopoiesis and immune function by producing erythroid, megakaryocyte, T cells, and B cells. In postG-BM, the hematopoietic system responded to the priming of G-CSF, leading to the negative regulate of immune system, enhanced cell migration, and myeloid hematopoiesis. Therefore, HSPCs differentiation in CB and G-BM did not show any bias toward Lym/Gran or Ery/Meko, while in postG-BM, HSPCs tend to differentiate toward Ery/Meko.
The branch-dependent genes of the three grafts overlapped partly, and these genes performed basic biological functions, such as lymphocyte activation in CB and preG-BM, and cell response to the oxidative stress in preG-BM and postG-BM (Supplemental Fig. S1). Furthermore, the expression profile of specific branch-dependent genes in each graft was found to be an adaptive response to the physiological environment. In general, CB was characterized by the response to childbirth, postG-BM was characterized by the response to G-CSF, and the expression profile of preG-BM represented the steady state of the biological system.
Moreover, the variation of TFs and chromatin accessibility were essential in hematopoiesis. To assess the activity of hematopoietic lineage differentiation–associated TFs in HSC, MPP, and LMPP, we utilized SCENIC, which regards the TFs and their target genes as regulons and calculates the activity of regulons by transcriptomes to reflect the activity of TFs. As shown in Fig. 2F, TFs that played an important role in hematopoietic differentiation were active in CB. To further distinguish the activity of TFs in BM, we generated a heatmap at the bottom; TFs such as TCF3 and STAT1 were active in preG-BM, which was related to the direction of CLP differentiation. The TFs associated with erythroid (GATA1 and GATA2) and myeloid (CEBPE and CEBPA) differentiation were active in postG-BM 22 . Therefore, the activity of TFs was consistent with the differentiation tendency of HSPCs in the three grafts as determined by trajectory analysis. Subsequently, we compared the homing ability of HSCs in the three grafts by analyzing the normalized expression level of CXCR4, which is the receptor of SDF-1/CXCR4 and a major pathway responsible for directing the homing of HSCs. According to the average expression level of CXCR4, the homing ability of HSCs was found to be highest in postG-BM, while it was weakest in CB.
Immature and Active T Cells in CB
To investigate immune reconstitution after transplantation, we focused on T cells and APCs. The expression profiles of T cells in each graft were extracted, and the subpopulations of T cells were visualized by UMAP in Fig. 3A. There were nine subpopulations identified and the heatmap of canonical markers expression in each subpopulation was presented in Supplemental Fig. S2. CD4+ and CD8+ naïve T cells (CD4/8_Naive) were the main component of T cells in CB, especially the CD4_Naive, while CD4+/CD8+ effector T cells (CD4/8_TE) and CD4+/CD8+ central memory T cells (CD4/8_TCM) were the main component of T cells in preG-BM and postG-BM (Fig. 3B). In the early post-transplantation period, the T cells from the grafts expanded to make up the low lymphocytes in recipient 23 . Thus, the features of CD4_Naive in CB have an important impact on the early immune reconstitution.

The features of T cells in CB, postG-BM, and preG-BM. (A) The subpopulations of T cells were identified and visualized by UMAP. (B) The proportion of subpopulation of T cells in the three grafts. (C) The CD4_Naive T cells DEGs of CB and postG-BM, CB and preG-BM, and postG-BM and preG-BM. (D) The dot plot showed the GSEA results of DEGs from Fig. 3C. (E) The CD4_Naive T cells projected onto two basis vectors of Treg and Th to indicate the cell phenotype. (F) The violin plot showed the activity of CD4_Naive T cell differential-related regulons in the three grafts. CB: cord blood; BM: bone marrow; UMAP: uniform manifold approximation and projection; DEGs: differentially expressed genes; GSEA: gene set enrichment analysis; TE: effector T cells ; TCM: central memory T cells; ILC: innate lymphoid cells; NES: normalized enrichment score.
To compare the biological differences of CD4_Naive among the three grafts, we found their DEGs first (Fig. 3C). In these comparisons, we did not observe any significantly downregulated genes. Therefore, we only plotted the upregulated genes in Fig. 3C. According to the results of GSEA (Fig. 3D), the immune development and activation pathways were enriched in CD4_Naive from CB, while the cell migration and negative regulation of cell death were enriched in CD4_Naive from postG-BM, which was in response to G-CSF stimulation. To identify the differentiation direction of CD4_Naive, the expression profile of CD4_Naive was projected onto the two basis vectors, which represented the biological characteristic of Treg and Th cells in the same graft (Fig. 3E). As shown in the “Results” section, the Treg and Th cells were well separated by these two basis vectors, indicating that this method can effectively reflect the potential biological properties. CD4_Naive in CB showed more characteristics of Treg, while CD4_Naive in BM showed more characteristics of Th.
To further explore the differentiation trends of CD4_Naive after transplantation, we also compared the TF activity in the three grafts (Fig. 3F). Foxp3, which is crucial for the development and function of Treg24,25, was found to be more active in CB than in BM. The other TFs analyzed in this study were related to the differentiation of multiple Th subsets. Specifically, SPI1 was related to the differentiation of Th9, and other TFs were related to the differentiation of Th1, Th2, and Tfh. Except for SPI1, the activity of these TFs was higher in BM than in CB. This partly explained the low incidence of GVHD in CBT. Moreover, Th9 has a specific effect on tumor cells. Thus, the unique biological properties of CB can create a specific immune landscape after transplantation26,27.
Monocyte With Strong Immune Regulation Effect in CB
We further extracted the expression profiles of myeloid cells from three grafts and clustered into nine subpopulations (Fig. 4A), and the canonical markers expression of each subpopulation was shown in the heatmap (Supplemental Fig. S3). It was evident that the myeloid cells increased significantly in BM following G-CSF priming. Several studies have highlighted the role of monocytes in CBT pre-transplant syndrome, so CD14+ monocytes were further explored for the major APC subsets in CB and BM.
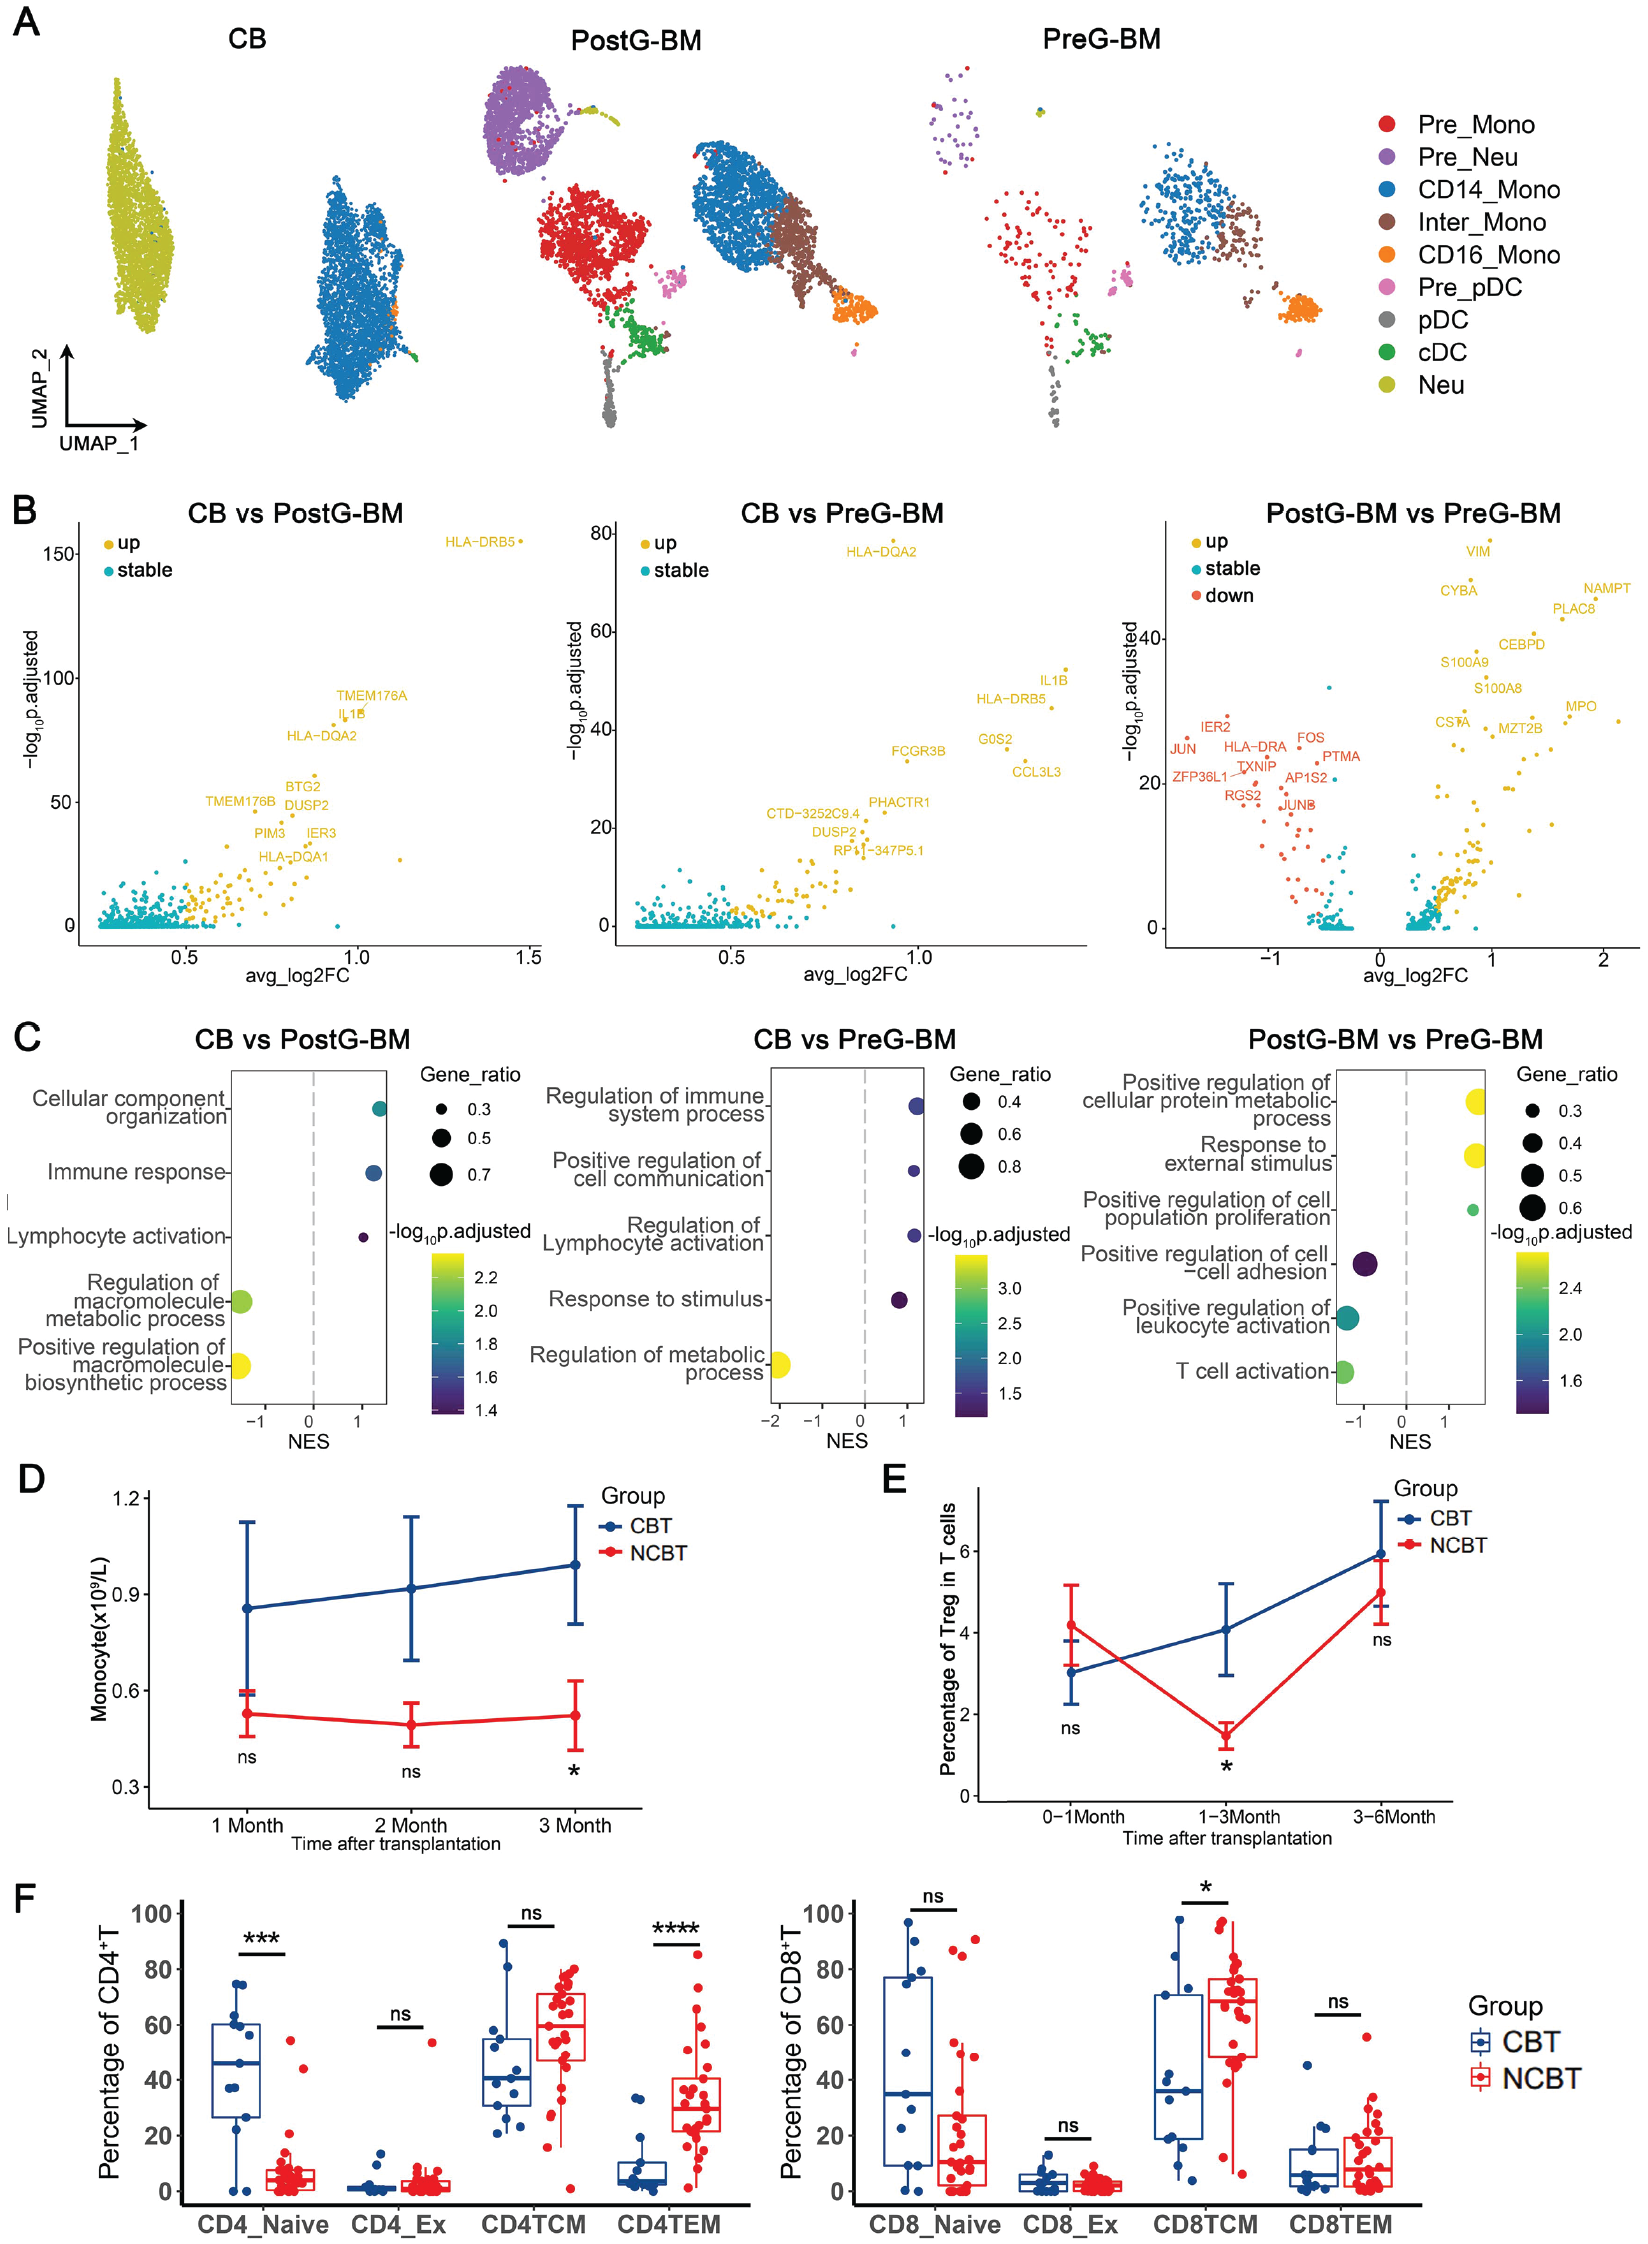
The features of monocytes in the three grafts and the clinical manifestations after allo-HSCT. (A) The subpopulations of monocytes were identified and visualized by UMAP. (B) The CD14+ monocytes DEGs of CB and postG-BM, CB and preG-BM, and postG-BM and preG-BM. (C) The dot plot showed the GSEA results of DEGs from Fig. 4B. (D) The monocyte counts of CBT and NCBT were compared at the first, second, and third months after transplantation. (E) The percentage of Tregs in T cells of CBT and NCBT was compared at 0–1, 1–3, and 3–6 months after transplantation. (F) The percentages of naïve T, exhausted T, central memory, and effector memory T in CD4+ T cells and CD8+ T cells of CBT and NCBT were compared at 1–6 months after transplantation, respectively. allo-HSCT: allogeneic hematopoietic stem cell transplantation; UMAP: uniform manifold approximation and projection; DEGs: differentially expressed genes; CB: cord blood; BM: bone marrow; GSEA: gene set enrichment analysis; CBT: cord blood transplantation; NCBT: non-cord blood transplantation; pDC: plasmacytoid dendritic cells; cDC: conventional dendritic cells.
We compared the DEGs of monocytes among the three grafts (Fig. 4B), and found that T cell activation and antigen presentation–related genes, including IL1B, HLA-DQA2, and HLA-DRB5 in CB, were upregulated. In addition, the GSEA results of these DEGs also supported that the lymphocyte development and activation pathways were activated in CB (Fig. 4C). With G-CSF stimulation, immune activation pathways were downregulated. In summary, monocytes in CB can promote antigen recognition and activation of T cells, thereby contributing to immune activation.
The Consistency Between the Analysis Results of the Grafts and the Clinical Features After Transplantation
Hematopoietic and immunological reconstitution features of CB and BM were obtained by analysis of the static high-dimensional transcriptomes. We were interested in whether these characteristics could be observed in the clinical manifestations following transplantation. As there were few patients who received BMT, we collected clinical data from 10 CBT patients as the CBT group, and 8 PBSCT patients and 2 BCPT patients as the NCBT group to analyze the characteristics of different grafts. In addition, the patients who received CBT using a single portion of CB and the grafts of BCPT were obtained by collecting BM on the first day and PBSC on the following days after G-CSF priming. Relevant clinical information regarding allo-HSCT was listed in Supplemental Table S1.
We compared the monocytes in CBT and NCBT groups (Fig. 4D). From the first to the third month following transplantation, the monocyte count was higher in the CBT group than in the NCBT group. However, this difference was only statistically significant at the third month. This suggested that monocytes may play a more important role in the clinical manifestations after transplantation in the CBT group than in the NCBT group, which was consistent with the positive role of monocytes in immune activation based on our previous analysis.
Regarding immune reconstitution, we collected all data from T cell function tests within 6 months after transplantation. This is because, in the early stages of post-transplantation, T cell immunity is primarily derived from the grafts, and thymus function has not yet been restored 23 . Due to the variable time points of the Treg proportion test, the change in Treg percentage in T cells over time was divided into three periods, namely 0–1 month, 1–3 months, and 3–6 months after transplantation. As our department only detected the distribution of T cell activation status of a patient after transplantation one or two times, we did not divide the time of this test. The percentages of naïve T, exhausted T, central memory T, and effector memory T in CD4+ T cells and CD8+ T cells were directly compared between the CBT and NCBT groups at 0–6 months after transplantation.
The comparison results (Fig. 4E, F) showed that the percentage of Treg in the CBT group was initially lower than that in the NCBT group within 1 month after transplantation. However, the percentage of Treg in the CBT group gradually increased, and the difference was statistically significant at 1–3 months after transplantation. This suggests that CD4_Naive T cells may be more inclined to differentiate into Tregs in the CBT group. Regarding the distribution of cell activation status, there were more naïve T cells in the CBT group, while there were more central memory and effector memory T cells in the NCBT group, which were similar to the composition of T cells in the graft. In addition, central memory and effector memory T cells increased after transplantation in the CBT group.
The Interaction Can Modulate the T Cell Activity
Since the recipient’s immune system has been destroyed before transplantation, the immune interaction in the graft was the main mechanism affecting the activity of T cells after transplantation. In this study, we analyzed the alteration of cell interactions among the three grafts (Fig. 5A, C). Interestingly, the major histocompatibility complex class Ι (MHC-Ι) pathways between CD8+ naïve T cells and the APCs (CD16+ monocyte, CD14+ monocyte, cDC, and B cells) were more active in CB than in BM, but the MHC-Ι pathways between CD8+ effector T cells and the APCs in CB were more active in BM than in CB. A similar condition existed in the lymphocyte-specific protein tyrosine kinase (LCK) pathway, which was related to the activation of the TCR pathway. In short, the T cell subpopulation that played a major role in CBT and BMT was different. In addition, in CB, the immune activation pathways CD40_CD40LG and IL16_CD4 between B cells and T cells showed high information flow28–31, while the immune suppression pathway LGALS9_HAVCR2 between CD8_TE and APCs also showed high information flow 32 . These characteristics indicated that T cells in the recipient were more likely to mediate immune response through neoantigen recognition after CBT.
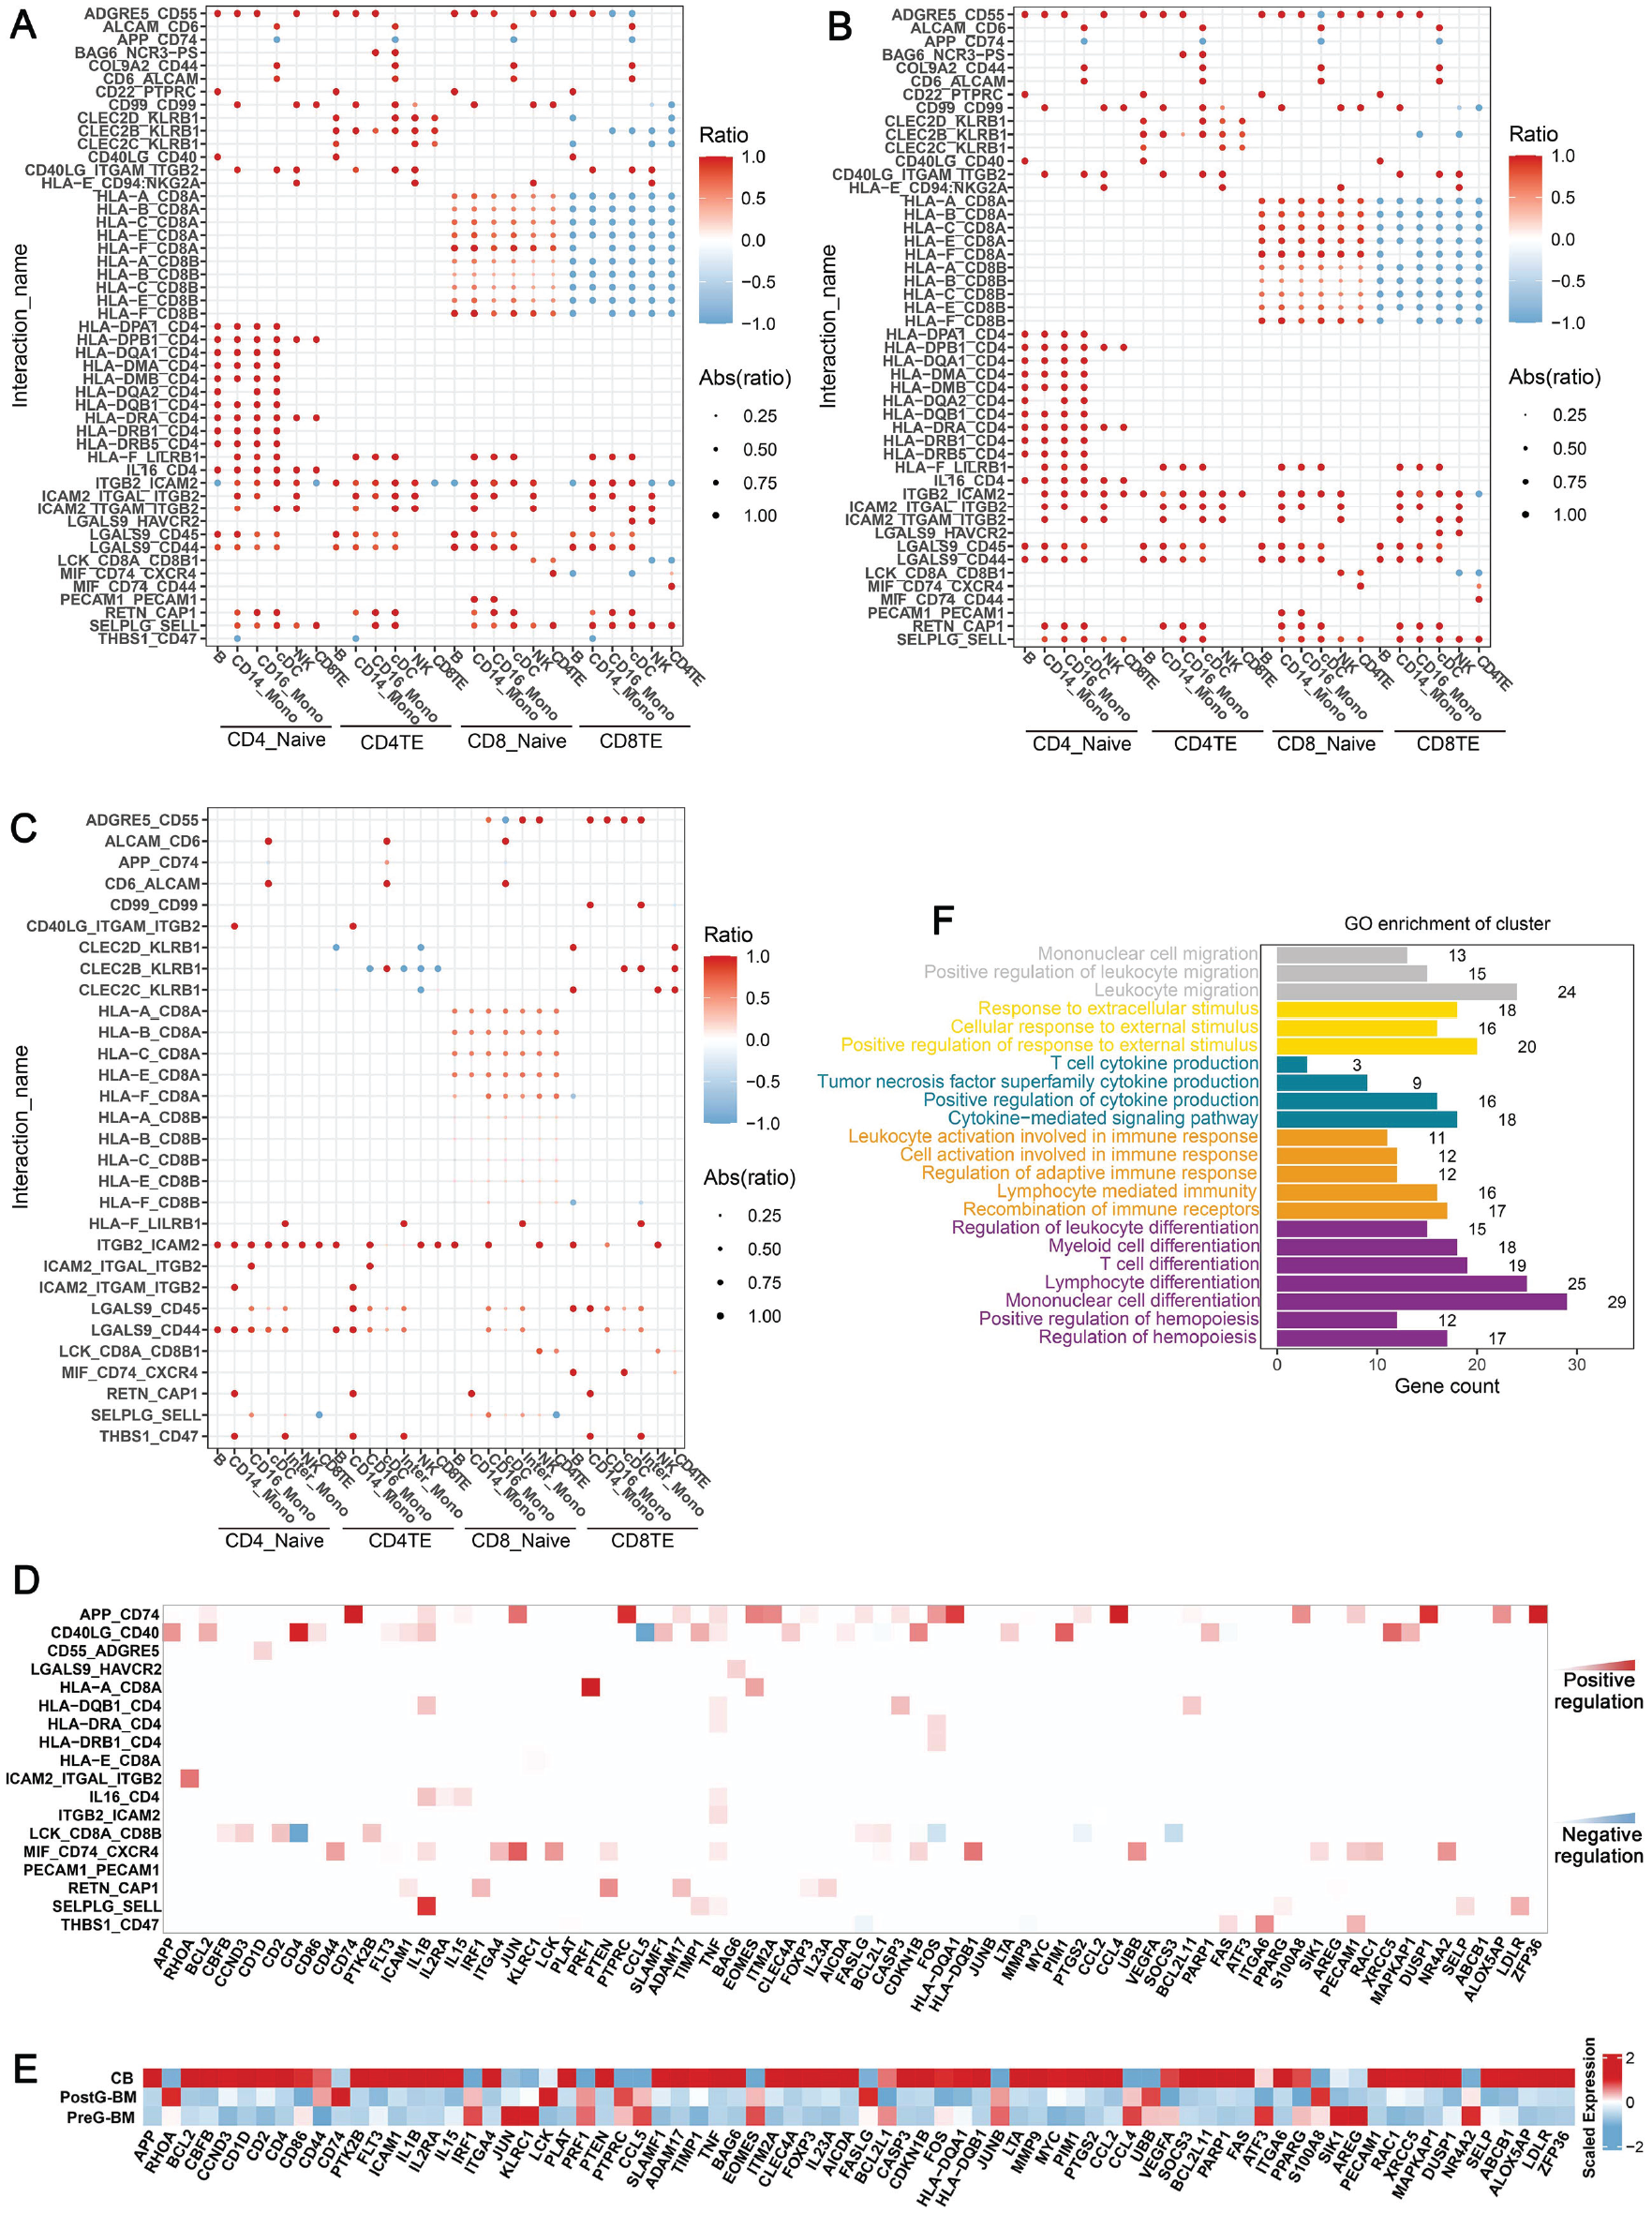
The different interactions between T cells and other immune cells in CB, postG-BM, and preG-BM. (A) The different interactions between T cells and other immune cells in CB and postG-BM. (B) The different interactions between T cells and other immune cells in CB and preG-BM. (C) The different interactions between T cells and other immune cells in postG-BM and preG-BM. (D) The predicted target genes of the main different interactions, with the regulation relationship represented by the heatmap, and the color depth indicating regulation intensity. (E) The scaled mean expression of predicted target genes from Fig. 5D in the three grafts. (F) The GO enrichment of predicted target genes from Fig. 5D, with different colors representing different biological functions. CB: cord blood; BM: bone marrow; GO: gene ontology.
Based on the database of interaction pathways and target genes from the NicheNet package, the regulatory relationships between the major alteration interaction pathways and target genes were calculated (Fig. 5D), and the average expression of target genes was shown in the heatmap (Fig. 5E). The expression level of target genes was correlated with the strength of the interaction pathway. Finally, we enriched the biological functions of the target genes (Fig. 5F), which primarily included lymphocyte differentiation and activation, immune cell migration, and other related functions.
In general, T cells and APCs were active in CB and preG-BM. In addition, CD4_Naive in CB tended to differentiate into Tregs, which can further regulate the intensity of the immune response. A large number of interactions between naïve T cells and APCs can effectively promote the recognition of neoantigens and mediate the immune response after transplantation. Furthermore, studies have shown that the TCR repertoire of T cells in CB is more abundant compared to T cells from adults and can cope with abundant neoantigens 33 . Although the above process of CB is slower compared to BM, it is also more plastic. To summarize the comparisons, we have listed the results in Table 1.
Comparison of Different Grafts.
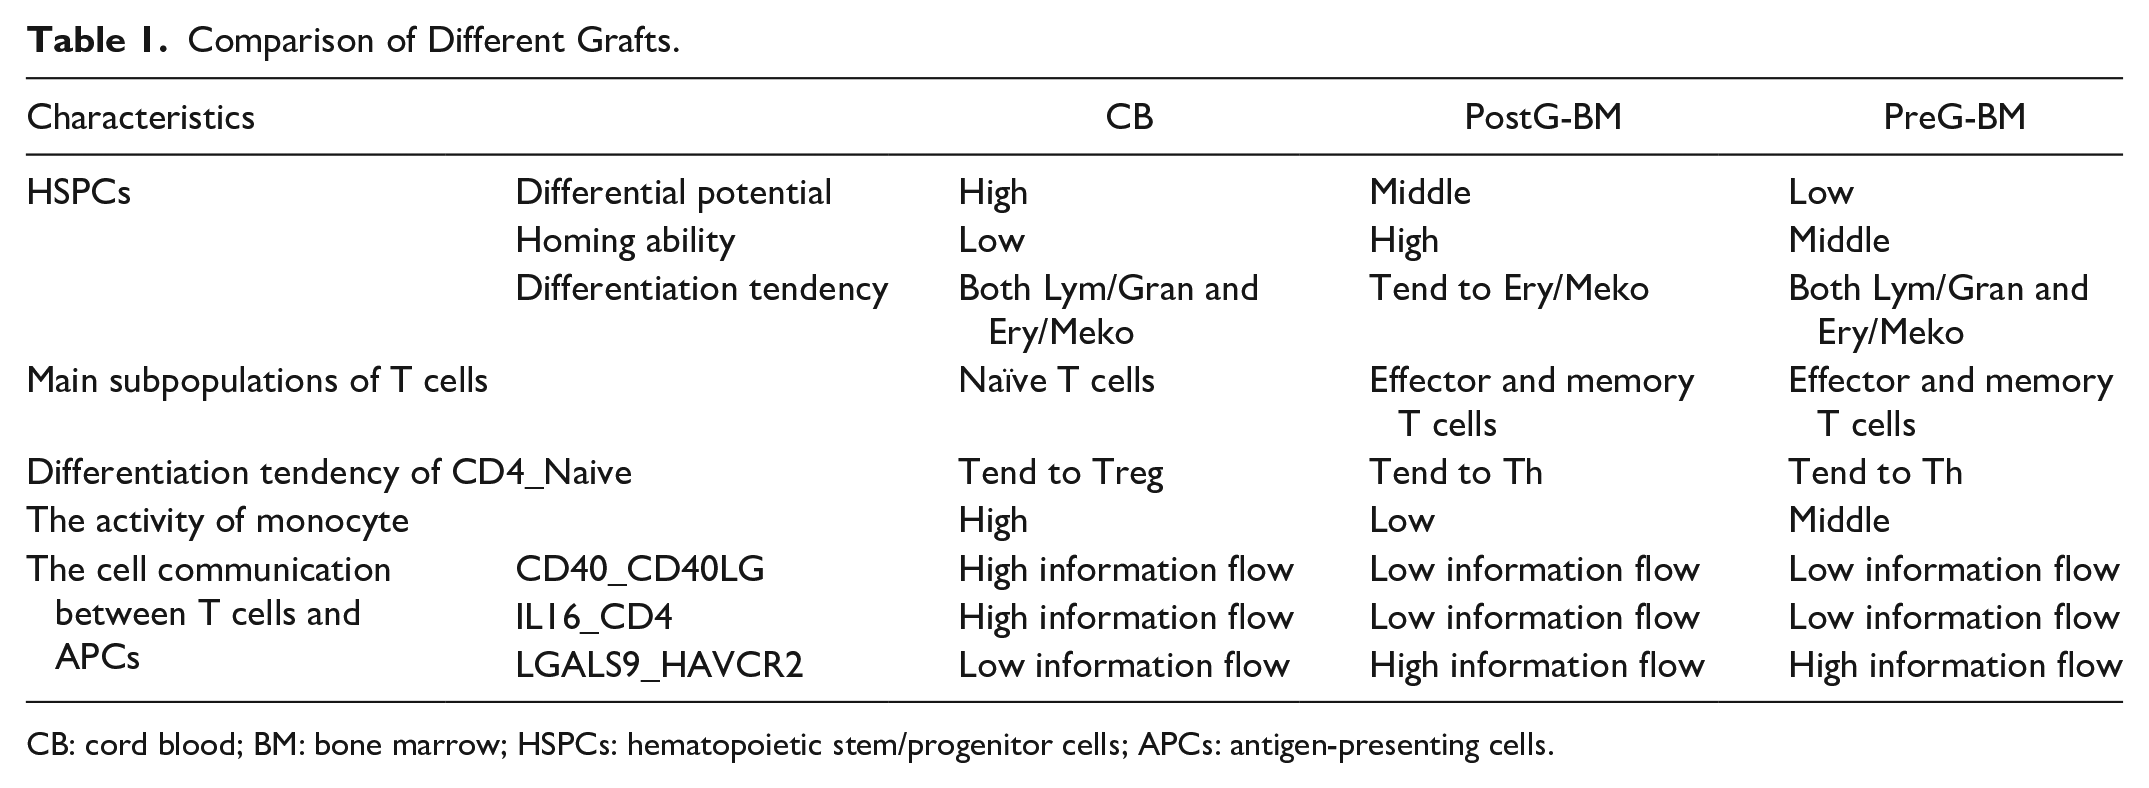
CB: cord blood; BM: bone marrow; HSPCs: hematopoietic stem/progenitor cells; APCs: antigen-presenting cells.
Discussion
This study focused on the differences among CB, postG-BM, and preG-BM and the effect of these differences on blood and immune reconstitution. Through comparison, we found that the HSPCs in CB were more multi-potential, but their homing ability was weaker than that in BM. As a result, HSPCs in CBT may exhibit delayed engraftment, but they possess strong proliferation and differentiation abilities. Furthermore, the immune interactions between T cells and APCs were active in CB, with several immune activation pathways exhibiting higher information flow in CB, especially the CD40_CD40L and IL16_CD4 signaling pathways between naïve T cells and APCs. In addition, these immune-activated interactions co-exist with the MHC pathway, thus promoting immune activation based on antigen recognition. Therefore, the immune characteristics of CB were suitable for hematological malignancies.
As there is currently no public dataset available for G-PBSC, it was not possible to compare the biological properties of G-PBSC with CB in this study. However, G-PBSC was the most commonly used graft and it is necessary to clarify the detailed single-cell landscape of G-PBSC. This will enable us to gain a deeper understanding of certain responses of G-PBSCT and G-BMT, such as the different incidences of GVHD 34 .
Furthermore, in this research, we wanted to explain the dynamic evolution characteristics after transplantation based on the static phenotype of grafts. Here, the speculations were obtained by the analysis of high-dimensional transcriptomes from specific perspectives. Although some of these speculations were verified in clinical data after transplantation, it is still necessary to establish maps of different grafts at particular time points after transplantation and infer their dynamic evolution process. This will enable us to identify the underlying mechanisms of the distinct clinical manifestations in these grafts after transplantation. Since each type of graft still exhibits certain clinical characteristics after transplantation based on individual differences, indicating that there are biological differences that play an important role in the dynamic evolution after transplantation. This exploration will help us to find ways to improve the outcome of transplantation.
Supplemental Material
sj-docx-1-cll-10.1177_09636897231193067 – Supplemental material for Aligning the Cord Blood–Bone Marrow Differences and the Post-transplantation Clinical Manifestations by Single-Cell RNA-Seq
Supplemental material, sj-docx-1-cll-10.1177_09636897231193067 for Aligning the Cord Blood–Bone Marrow Differences and the Post-transplantation Clinical Manifestations by Single-Cell RNA-Seq by Jiali Wang, Yaping Wang, Yong Xu, Wenfeng Fu, Liucheng Rong, Yao Xue and Yongjun Fang in Cell Transplantation
Footnotes
Acknowledgements
The authors are grateful to Dr Guoju You, Dr Hanna K. A. Mikkola, and Mr Yi Zhao for their shared single-cell RNA-seq datasets.
Author Contributions
JLW contributed in conceptualization, data interpretation, and writing—original draft. YPW and YX contributed in data collection, data interpretation, and writing—review, editing, and revision. WFF, RLC, and YX contributed in data collection and data interpretation. YJF contributed in conceptualization and writing—review, editing, and revision.
Availability of Data and Material
The public single-cell RNA-seq datasets can be obtained from GEO and CNSA databases according to the accession numbers. And the other data that support the findings of this study are available from the corresponding author on request.
Ethical Approval
This study was approved by the Ethics Committee of Children’s Hospital of Nanjing Medical University (No. 202301006-1).
Statement of Human and Animal Rights
The study conformed to the standards set by the Declaration of Helsinki and and was approved by Ethics Committee of Children’s Hospital of Nanjing Medical University (NO.202301006-1). This article does not contain any studies with animal subjects.
Statement of Informed Consent
Explicit permission was obtained from each participant, and informed consent was provided by the patient.
Declaration of Conflicting Interests
The author(s) declared no potential conflicts of interest with respect to the research, authorship, and/or publication of this article.
Funding
The author(s) disclosed receipt of the following financial support for the research, authorship, and/or publication of this article: This study was supported by the China Postdoctoral Science Foundation-funded project (grant no. 2021M701764), Jiangsu Funding Program for Excellent Postdoctoral Talent (grant no. 323721), Nanjing Postdoctoral Research Funding Program (grant no. 323721), and Nanjing Medical University Science and Technology Development Fund (grant no. NMUB20220015).
Supplemental Material
Supplemental material for this article is available online.
References
Supplementary Material
Please find the following supplemental material available below.
For Open Access articles published under a Creative Commons License, all supplemental material carries the same license as the article it is associated with.
For non-Open Access articles published, all supplemental material carries a non-exclusive license, and permission requests for re-use of supplemental material or any part of supplemental material shall be sent directly to the copyright owner as specified in the copyright notice associated with the article.