
Abstract
Glaucoma is a serious complication of glucocorticoid (GC) therapy arising through elevations in intraocular pressure (IOP). Dexamethasone (DEX) is reported to contribute to elevated IOP through different effects on the trabecular meshwork but whether DEX contributes to glaucoma development through the induction of cellular senescence is still unclear. We explored the actions of DEX on transformed human trabecular meshwork cells (HTMCs) using RNA-seq and conducted bioinformatic analyses to determine the affected pathways. Among the 4,103 differentially expressed genes identified in transformed HTMCs treated with 400 nM DEX (2,036 upregulated and 2,067 downregulated genes, respectively), bioinformatic analyses revealed significant enrichment and potential interplay between the transforming growth factor beta (TGFβ)41; signaling and cellular senescence pathways. DEX treatment induced senescence changes in primary and transformed HTMCs as indicated by increases in SA-β-gal positivity, interleukin (IL)-6 secretion, and senescence-associated heterochromatin foci (SAHF) along with selective accumulation of senescence marker p15 and elevations in reactive oxygen species (ROS) levels. Notably, the DEX-induced senescence changes were rescued by treatment with the TGFβ/Smad3 pathway inhibitor SIS3. Furthermore, we show that DEX increases cellular ROS levels via upregulation of NADPH oxidase 4 (NOX4) through activation of Smad3, and that SIS3 decreases ROS levels by downregulating NOX4. Instructively, inhibiting NOX4 with GLX351322 and scavenging ROS with NAC were both effective in preventing DEX-induced senescence changes. Similarly, we found in the mouse model that DEX-ac upregulated p15 and NOX4 expression in the trabecular meshwork, with cotreatment with GLX351322 alleviating elevations in IOP. We establish that DEX induces senescence changes in HTMCs by increasing ROS levels via the TGFβ/Smad3/NOX4 axis, increasing IOP and contributing to glaucoma development.
Introduction
Glaucoma is the first leading cause of irreversible blindness, and primary open-angle glaucoma (POAG) is the most common type of glaucoma1–3. Currently, nearly 60.5 million people worldwide are affected by this indolent disorder, with projected estimates, this will climb to 111.8 million by the year 2040 4 .
Elevated intraocular pressure (IOP) is the major risk factor of glaucoma, with aqueous humor flow responsible for generating IOP. IOP is generated through a combination of aqueous humor flow rate, uveoscleral outflow rate, total aqueous humor outflow resistance, and episcleral venous pressure (EVP) with aqueous humor mainly flowing through the trabecular meshwork; hence increases in aqueous humor output and/or obstacles to flow promote elevated IOP5,6. In general, increased outflow resistance leads to elevated IOP, which eventually promotes glaucoma development. Many factors can affect trabecular meshwork function including extracellular matrix (ECM) accumulation (fibrosis), mitochondrial damage, endoplasmic reticulum (ER) stress, oxidative stress, and cellular senescence7–11. Notably, IOP is an important and modifiable risk factor for the development and progression of POAG. First-line treatments for POAG generally involve topical drugs with subsequent treatments involving interventions with laser trabeculoplasty, micro-invasive surgery, or lastly the placement of shunts. Therefore, lowering IOP by either pharmacological or surgical intervention remains the major therapeutic approach to slow disease progression12,13.
Glucocorticoids (GCs) such as dexamethasone (DEX) have been used for the treatment of a wide range of disorders including various ocular diseases involving inflammation. Nevertheless, a significant proportion of patients (3%–8%) treated by GC develop ocular hypertension with DEX treatment leading to glaucoma by inducing ECM accumulation in the trabecular meshwork 14 . DEX has also been shown to remodel the cytoskeleton of trabecular meshwork cells to affect their function15,16. Different signaling pathways are implicated in these processes with roles identified for the TGFβ2/Smad3, Hippo/YAP/TAZ, and Autotaxin-LPA pathways along with ER stress17–21.
Of interest to this report is the role played by TGFβ2 in the pathology of glaucoma which has been shown to engage different downstream elements including Smads and bone morphogenetic proteins (BMPs) 22 . And many of the signaling actions of TGFβ2 align with the pathological effects of DEX on the trabecular meshwork 17 . Indeed, high levels of TGFβ2 occur in aqueous humor associated with many cases of glaucoma, with instructive reports showing that TGFβ2 promotes many defects in trabecular meshwork cells, including ECM accumulation and oxidative stress caused by reactive oxygen species (ROS)23–25. The latter is an important in many diseases, with higher ROS levels eliciting effects including DNA damage, fibrosis, and senescence 26 . Oxidative stress and the associated production of ROS are regarded as major factors that trigger so-called stress-induced premature senescence (SIPS). Cells in replicative senescence share common features with cells in SIPS: morphology, senescence-associated beta-galactosidase activity, cell cycle regulation, gene expression, and telomere shortening27,28. One of the primary sources of ROS are the NADPH oxidases (NOXs), with mounting evidence showing that NOXs are an important source of ROS and oxidative stress in glaucoma and other retinal diseases. In particular, NOX4 upregulation by TGFβ2 can mediate fibrosis in trabecular meshwork cells29,30.
In this study, we sought to expand the knowledge of how GCs such as DEX promote the degeneration of the trabecular meshwork. Toward this, we first conducted high-throughput mRNA-seq to find how DEX changes the transcriptome of transformed human trabecular meshwork cells (HTMCs). Based on significant enrichment for pathway signatures encompassing the TGFβ signaling and cellular senescence pathways, we focused our experiments on their predicted interactions. We show that DEX induces senescence changes in transformed HTMCs and primary HTMCs through the activation of p15 linked to upstream activation of the TGFβ2/Smad3 pathway. Strikingly, we find inhibition of Smad3 activation with SIS3 rescues senescence changes caused by DEX treatment. Mechanistically, we show DEX increases intracellular ROS levels through activated Smad3 to promote increased NOX4 expression. And notably, inhibition of NOX4 with GLX351322, or ROS scavenging with NAC reduces ROS level increases to rescue senescence changes caused by DEX treatment. Finally, using a mouse model of glucocorticoid-induced glaucoma (GCIG), we found that GLX351322 can prevent increases in IOP associated with DEX treatment, also inhibiting the increases in p15 level within the trabecular meshwork. Thus, our work discloses a mechanism whereby DEX induces premature senescence of trabecular meshwork through Smad3/NOX4/ROS axis to cause glaucoma development.
Materials and Methods
HTMC Culture
Immortalized (SV40-transformed) HTMCs were purchased from iCell Bioscience Inc. (Shanghai, China), with the cells derived from primary human trabecular meshwork cells (ScienCell Research Laboratories, Catalog Number 6590; Lot Number 16930; CA Number 0002981). Cells were maintained in DMEM/F12 medium (CD0001, SparkJade, China) supplemented with 15% fetal bovine serum (FBS), 100 U/mL penicillin, 100 mg/mL streptomycin. Experiments performed on transformed HTMCs with five to seven passages. Patient eye specimens were received after enucleation surgery, with the trabecular meshwork tissue dissected under a microscope. Trabecular meshwork tissues were then digested using the tissue dissociation kit (130-101-540, Miltenyi Biotec, Teterow, Germany) for 2 h at 37°C. Trabecular meshwork cells were released after digestion by gentle passage several times through a micropipette before transfer to culture dishes. The adherent primary trabecular meshwork cells were maintained in DMEM/F12 (SparkJade, China) medium supplemented with 15% FBS, 100 U/mL penicillin, 100 mg/mL streptomycin. Cells were treated with DEX and analyzed for the expression and release of myocilin, consistent with published recommendations 31 . The study used cultured primary TM cells from two separate donors with experiments performed on cells with five to eight passages. Human eyes collection was approved by the Medical Ethical Committee of Henan Eye Hospital (HNEECKY-2022(18)).
Pharmacological Agents
Where indicated, cells were treated with DEX (400 nM, HY-14648, MedChemExpress, China) for 72 h alone or in combination with inhibitors targeting pSmad3 (SIS3, 100 nM, HY-100444, MedChemExpress, China), NOX4 (GLX351322, 10 μM, HY-100111, MedChemExpress, China), ROS (NAC, 40 μM, HY-B0215, MedChemExpress, China), or TGFβ receptors (LY364947, 5 μM, HY-13462, MedChemExpress, China). Stocks of all agents were prepared in DMSO with control groups treated with an equal volume of DMSO.
MRNA-Seq and Bioinformatic Analyses
Transformed HTMCs were treated with DEX (400 nM) for 72 h before preparation of total RNA using the Trizol reagent (SparkJade, China). mRNA-seq was commercially performed by the Shanghai Sinomics Corporation (Shanghai, China). Briefly, paired-end libraries were synthesized using the TruSeq™ RNA Sample Preparation Kit (Illumina, USA) following the TruSeq™ RNA Sample Preparation Guide. Clustering was generated by cBot with the library diluted to 10 pM and then sequenced on an Illumina NovaSeq 6000 (Illumina, USA). Differential regulated genes were assigned by applying thresholds of log2FC≥1.5 and log2FC≤−1.5 with P < 0.05 and presented as a Volcano plot. To assess functional associations, differentially regulated gene data were uploaded to the STRING database (http://www.string-db.org/) to create a protein–protein interaction (PPI) network based on the TGFβ signaling and cellular senescence pathways.
SA-β-gal Staining
Cells were seeded into six-well plates and treated for 72 h before performing SA-β-gal staining according to the manufacturer’s recommendations (C0602, Beyotime Biotechnology, China).
ELISA Assay
Cells were seeded overnight in 12-well plates before changing to FBS-free medium containing the indicated drug combinations. After 72 h, cell culture supernatants were collected, centrifuged at 10,000 × g for 10 minutes at 4°C and used to perform the indicated ELISA assays according to the manufacturer’s recommendations (4A Biotech, China).
Western Blot
Cells were lysed with RIPA buffer (P0013B, Beyotime, China) supplemented with a protease inhibitor cocktail (P1049, Beyotime, China) before clarification by centrifugation (14,000 × g × 10 minutes at 4°C). Protein concentrations of cell lysates were measured by the bicinchoninic acid (BCA) method using bovine serum albumin (BSA) as a standard (P0010S, Beyotime, China) and 10 μg total/sample electrophoresed on hand cast 12% SDS-PAGE gels using SparkJade kit reagents (Jinan, China). After transfer to nitrocellulose membranes, protein loading and transfer was validated by Ponceau S staining before subsequent incubation of the membranes with blocking solution (SparkJade, China) for 20 min at room temperature. Thereafter, membranes were incubated overnight at 4°C with diluted primary antibodies, washed three times with TBST for 20 min and then incubated with HRP-conjugated secondary antibodies (Affinipure Goat Anti-Rabbit IgG, Proteintech, SA00001-2, China) in TBST (TBST: Tris Buffer Solution with Tween-20) for 1 h at room temperature. After further washing, the antibody-decorated bands were visualized using a chemiluminescent substrate (Epizyme ECL PicoLight Substrate, SQ202-1, China) and images recorded using a ChemiDoc MP system (BioRad). Primary antibodies used included anti-p21 (Proteintech, 10355-1-AP, China), p27 (huabio, ET1608-61, China), p15 (Affnity, AF0230, USA), p16 (Proteintech, 10883-1-AP, China), GAPDH (Proteintech, 10494-1-AP, China), NOX4 (Proteintech, 14347-1-AP, China), Smad3 (Proteintech, 66516-1-Ig, China), pSmad3(Cell signaling technology, 9520S, USA), myocilin (Santa Cruz Biotechnology, sc-137233, USA), and TGFβ2 (Proteintech, 19999-1-AP, China).
Immunofluorescence Staining of Cultured Cells
Cells were allowed to attach to glass coverslips before applying the indicated treatments, then washed with phosphate buffered saline (PBS) before 15-min fixation with 4% paraformaldehyde (PFA) in PBS solution. Thereafter, the samples were washed in PBS buffer, permeabilized with 0.5% Triton X-100 in PBS for 15 min, further washed with PBS before blocking with 4% BSA in PBS (0.22 μm filtered) for 60 min at room temperature. The coverslips were then successively incubated with diluted primary antibodies overnight at 4°C and secondary antibodies (donkey anti Rabbit 488, Jackson ImmunoResearch Inc., 711-545-152, USA) for 60 min at room temperature, both diluted in blocking solution. After nuclear counterstaining with DAPI solution (MedChemExpress, HY-D1396, China) for 5 min, the coverslips were mounted onto glass slides and images captured using a Leica DMi8 confocal microscope. The primary antibodies used included anti-p15 (Affnity, AF0230, USA) and H3K9me3 (Cell signaling technology, 13969S, USA), phospho(p)-H2A.X (Ser139) (Cell signaling technology, 80312, USA).
ROS Assay
Cells were seeded into live imaging culture dishes (Biosharp, BS-20-GJM, China) before adding the diluted DCFH-DA probe (1:1000, Beyotime, S0033S, China) along with Hoechst 33342 (500×, Beyotime, C1027, China) in culture medium at 37°C. The cells were subsequently incubated for 20 min, washed cells three times with 37°C medium before capturing images with a Leica DMi8 (Germany) confocal microscope using the 488-nm laser line.
Animal Experiments
Female C57BL/6J mice (8 weeks old) purchased from GemPharmatech (Nanjing, China) were used to establish the model. The periocular conjunctival fornix of one eye was injected with the indicated drugs using 32G needles as previously reported 32 . Mice were anesthetized using a small animal gas anesthesia instrument (Shenzhen RWD Life Technology Co., Ltd, China) using isoflurane (2.5% v/v) in oxygen at a flow rate of 0.8 L/min for ~2 mins. Injections were conducted once a week over 4 weeks with treatment groups consisting of a sterile physiological saline solution (1 μl PSS; 0.9% NaCl in water), DEX acetate (DEX-ac, MedChemExpress, China) alone (1 μl 0.5 μM DEX-ac diluted in PSS) or DEX-ac plus GLX351322 groups (1 μl DEX-ac with 1 μM GLX351322). IOPs were measured consecutively each week at 10 a.m. with three repeats using the TonoLab instrument with the mean value of three repeats used for analysis. Four weeks later, mice were humanely sacrificed and the excised eye fixed with formaldehyde and embedded in paraffin section for later immunostaining. Animal experiments complied with the Association for Research in Vision and Ophthalmology Statement. All animal experiments were approved by Animal Ethics Committee of Zhengzhou University (ZZU-LA20220729).
Immunofluorescence Staining of Mouse Eye Sections
Eyes were fixed by 4% PFA dissolved in PBS buffer for 2 h at room temperature, dehydrated with graded alcohols (30%–100%), immersed two times in xylene for 15 min and then in paraffin overnight at 65°C before embedding into paraffin molds. Sections (5 μm) were cut with a microtome and tissues adhered to glass slides, deparaffinized with xylene and rehydrated with graded alcohols (100%–50%) before immersing in pure water for 5 min followed by PBS for 5 min. Thereafter, antigen retrieval was conducted by heating sections in 0.1 M sodium citrate buffer inside a pressure cooker for 2.5 min after reaching the boiling point. The sections were then washed in PBS for 5 min followed by blocking with 4% BSA/0.5%Triton X-100/PBS solution for 60 min. Afterwards, primary antibodies were applied overnight at 4°C before washing with PBS and application of secondary antibodies for 60 min at room temperature. All antibodies were diluted in blocking buffer prior to use. Finally, the sections were incubated with DAPI solution for 5 min at room temperature, washed with PBS for three times, and coverslips applied with mounting medium.
Statistical Analysis
Statistical analyses were performed with GraphPad Prism version 7.0. All results are presented as mean ± SD of at least three independent experiments with raw data provided in the Supplementary materials. We assumed the data conformed to a normal distribution and assessed statistical differences using the unpaired student’s t-test for two group comparisons or analysis of variance (ANOVA) with a Tukey correction factor for multiple group comparisons. P < 0.05 was considered as statistically significant.
Results
RNA-Seq Characterization of DEX-Induced Changes in Trabecular Meshwork Cells Links TGFβ Signaling With Cellular Senescence
The clinical symptoms and pathology of GCIG are considered similar to those observed in POAG. To more comprehensively understand the underlying mechanisms and to find potential therapeutic targets, we employed GCIG as a model to study POAG. High throughput RNA sequencing was conducted on transformed HTMCs treated with DEX (400 nM) for 72 h and compared to a drug vehicle (DMSO) control group (Fig. 1A). Hierarchical clustering of the differentially expressed genes (DEGs) showed striking transcriptome changes between the DEX and control groups HTMCs (Fig. 1B). Using log2foldchange > 1.5 or < −1.5 and P < 0.05 as cutoffs, this analysis uncovered 4,103 genes with significant expression changes, including 2,036 upregulated and 2,067 downregulated genes, respectively (Fig. 1C). Pathway enrichment analysis of the DEGs showed DEX affected many important and relevant pathways, including regulation of actin cytoskeleton, ECM-receptor interaction, autophagy and the TGFβ signaling pathway, all of which are known to be affected by DEX treatment7,17,33,34. Intriguingly, among these changes, we also identified cellular senescence as being involved in the actions of DEX (Fig. 1D). Previous reports have linked cellular senescence with acute glaucoma 13 , but whether senescence is an important factor in GCIG or POAG is still unclear, and we sought to clarify this point further in our study.
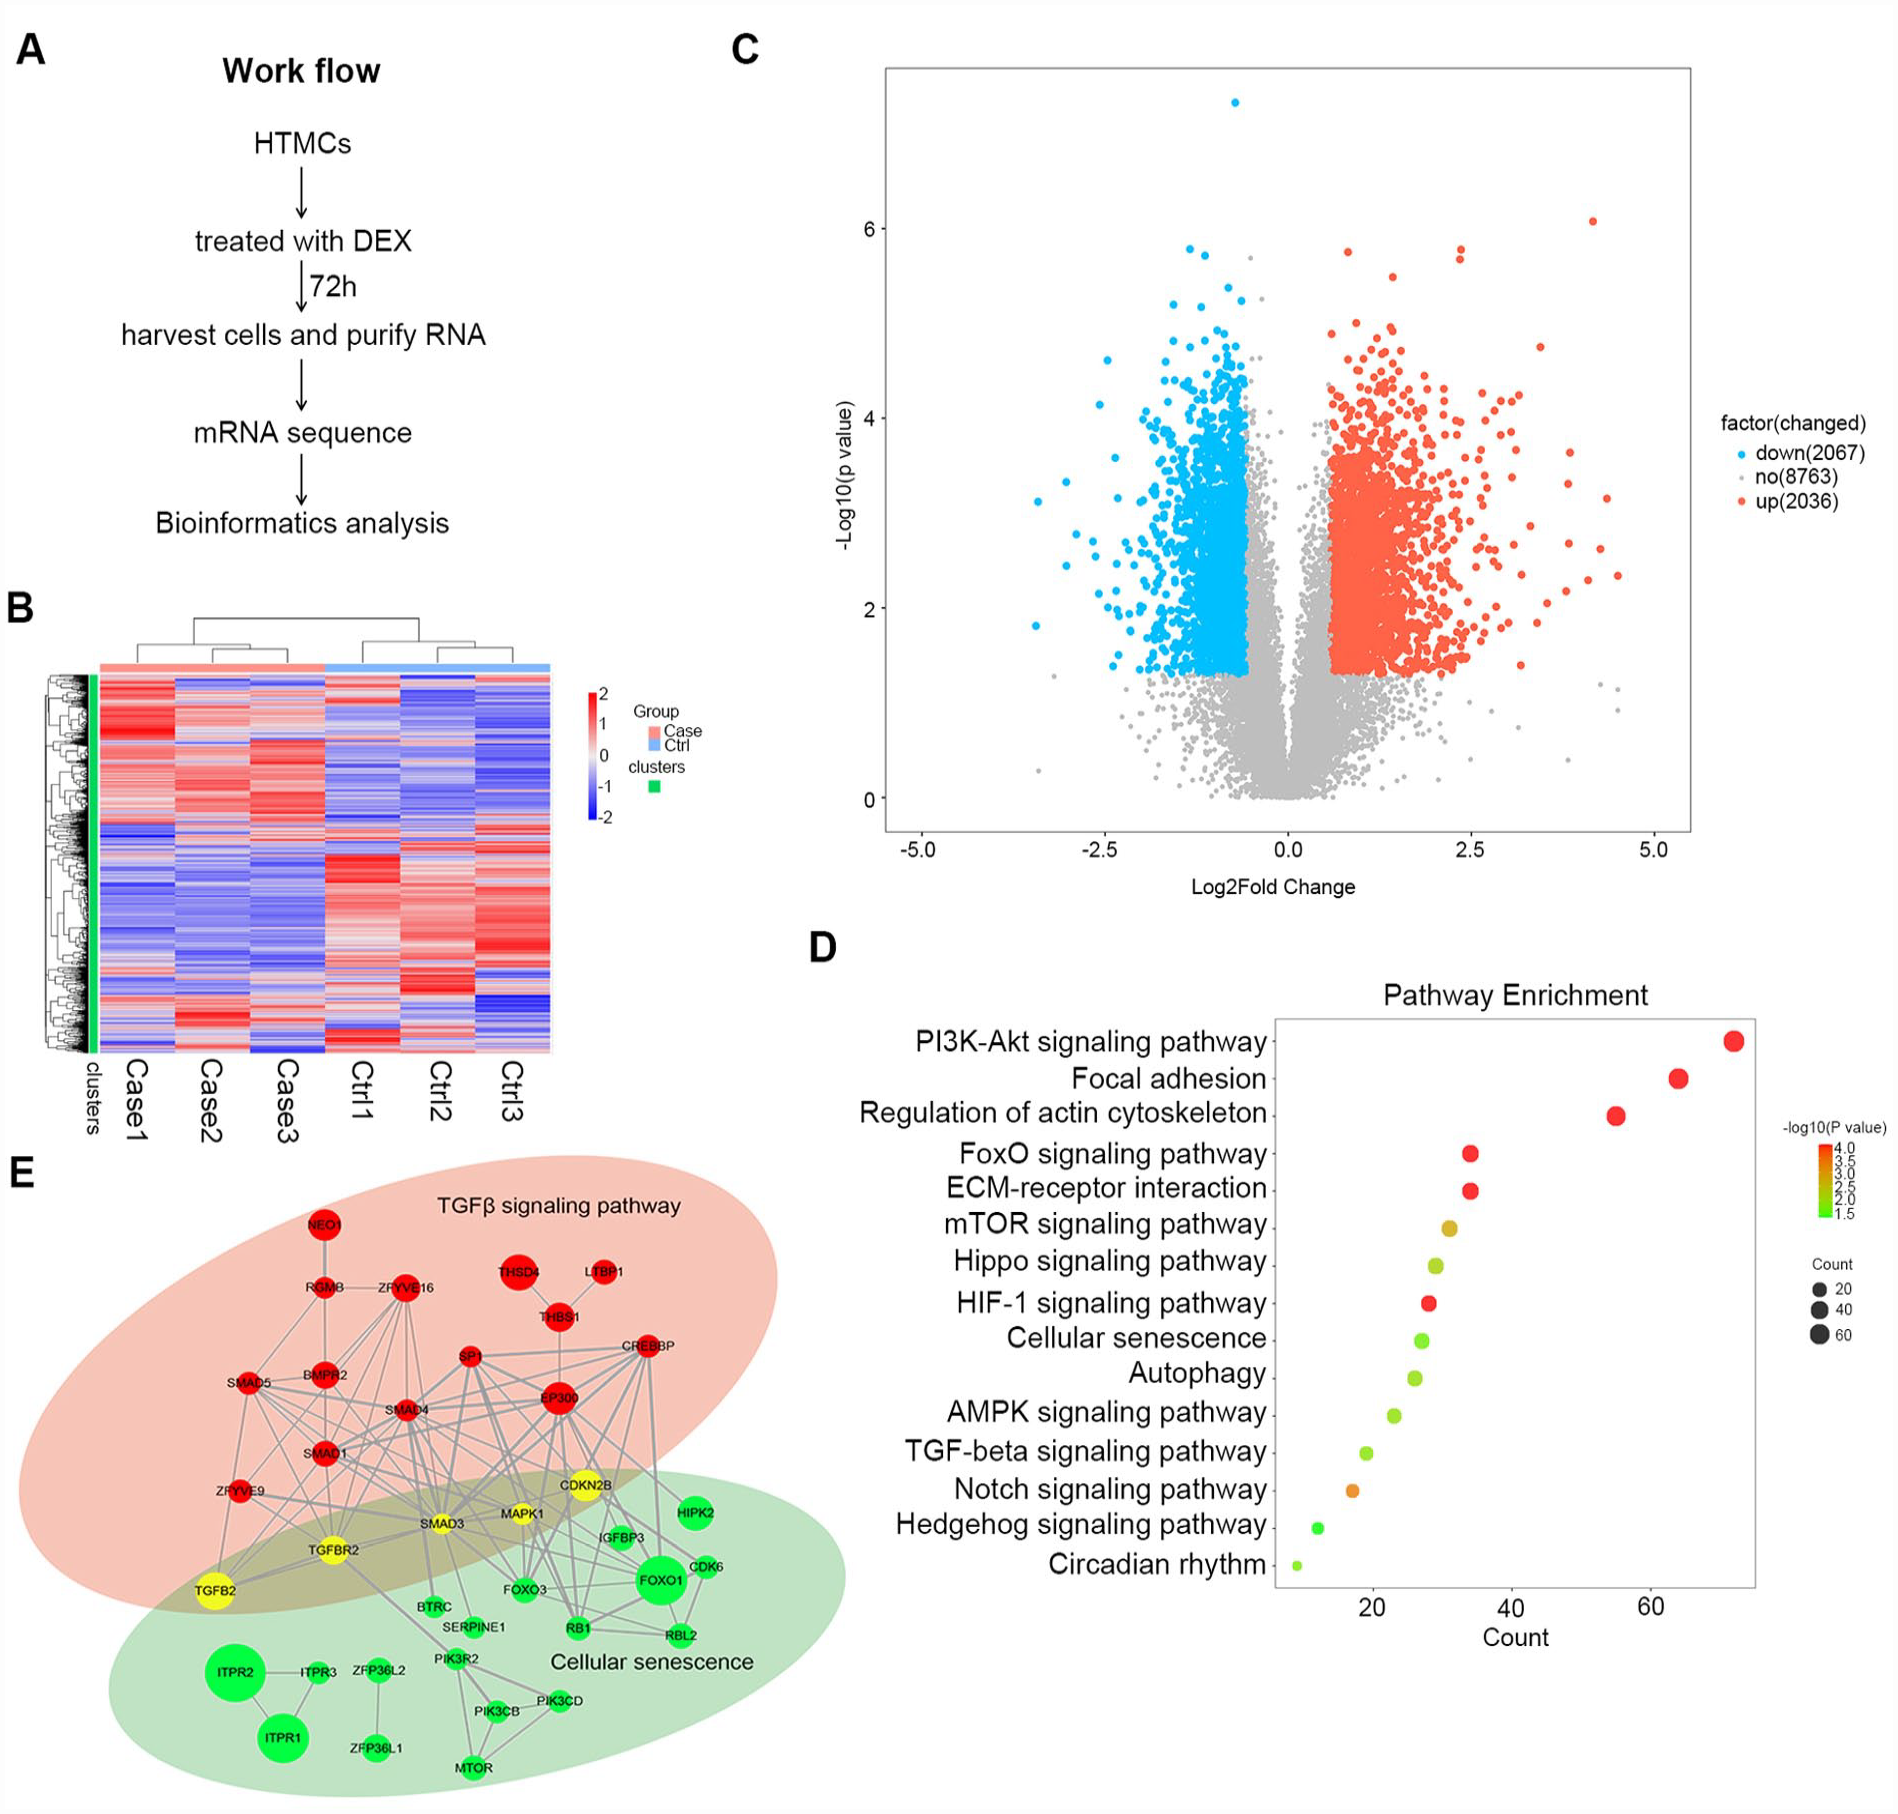
Characterization of transcriptome changes in trabecular meshwork cells following dexamethasone. (A) Experimental workflow. Transformed HTMCs were treated with 400 nM DEX or DMSO control for 72 hours before conducting RNA-seq analysis. (B, C) Differentially expressed genes (DEGs) following DEX treatment shown as a heatmap (B) or Volcano plot (C). Of the 12,866 genes detected, 2,036 and 2,067 were upregulated and downregulated, respectively, according to log2foldchange > 1.5 or log2foldchange < −1.5. (D) Top 15 pathway enrichments according to the DEGs from (C) based on KEGG database analysis. (E) Protein–protein interactions (PPI) based on the DEGs from (C) showing interactions and interconnections in and between the TGFβ signaling and cellular senescence pathways. The bubble size is an indicator of the foldchange of the individual genes. DEX: dexamethasone; HTMC: human trabecular meshwork cells; RNA, ribonucleic acid; KEGG: Kyoto Encyclopedia of Genesand Genomes; DMSO: Dimethyl sulfoxide.
When next analyzed DEGs associated with the TGFβ signaling and cellular senescence pathways using PPI software to construct potential regulatory networks. Instructively, this analysis revealed significant crosstalk between TGFβ signaling and cellular senescence. Notably, the key TGFβ signaling component Smad3 regulates many cellular senescence pathway genes, including CDKN2B (encoding the p15 protein), FOXO3, FOXO1, and SERPINE1 35 . In particular, CDKN2B is not only linked to TGFβ signaling through Smad3 but shows links to other regulators including Smad4, SP1, and CREBBP (Fig. 1E). Based on these findings, we hypothesized that DEX promotes cellular senescence of transformed HTMCs by activating the TGFβ/Smad3 pathway.
DEX Induces Senescence-Associated Changes of Trabecular Meshwork Cells
To clarify whether DEX causes cellular senescence in vitro, we employed both immortalized (SV40-transformed) and primary HTMCs prepared in-house. We first confirmed the expression of the TM cell marker myocilin in both cell line models which increased upon DEX treatment for 48 h (Supplementary Fig. 1). Thereafter, we treated transformed HTMCs with DEX (400 nM) for 72 h and performed a series of assays which measure senescence changes. First, microscopic examination of SA-β-gal staining showed there was a higher percentage of SA-β-gal-positive cells in DEX-treated cells compared with controls (Fig. 2A), with quantification showing an approximate three-fold increase in SA-β-gal positive cells associated with DEX treatment (Fig. 2B). Next, we measured the levels of IL-6, a key cytokine marker of the senescence-associated secretory phenotype (SASP). ELISA assays against cell supernatants showed significantly increased levels of IL-6 in the DEX-treated HTMC cultures (Fig. 2C). Next, we measured expression changes in key mediator proteins related to senescence, including p21, p27, p16, and p15 35 . Instructively, western blotting analysis showed that DEX markedly upregulated p15 but did not affect p21, p16, or p27 levels (Fig. 2D). In addition, we also we verified that DEX treatment selectively increased the levels of p15 but not p21, p16, and p27 in primary HTMC cultures (Fig. 2E). Further experiments with DEX treatment showed that the extent of p15 induction largely coincided with the acquisition of SA-β-gal positivity in transformed HTMCs in both time course and dose response experiments (Supplementary Fig. 2), providing further evidence that DEX induces senescence changes in HTMCs through a p15-dependent mechanism.
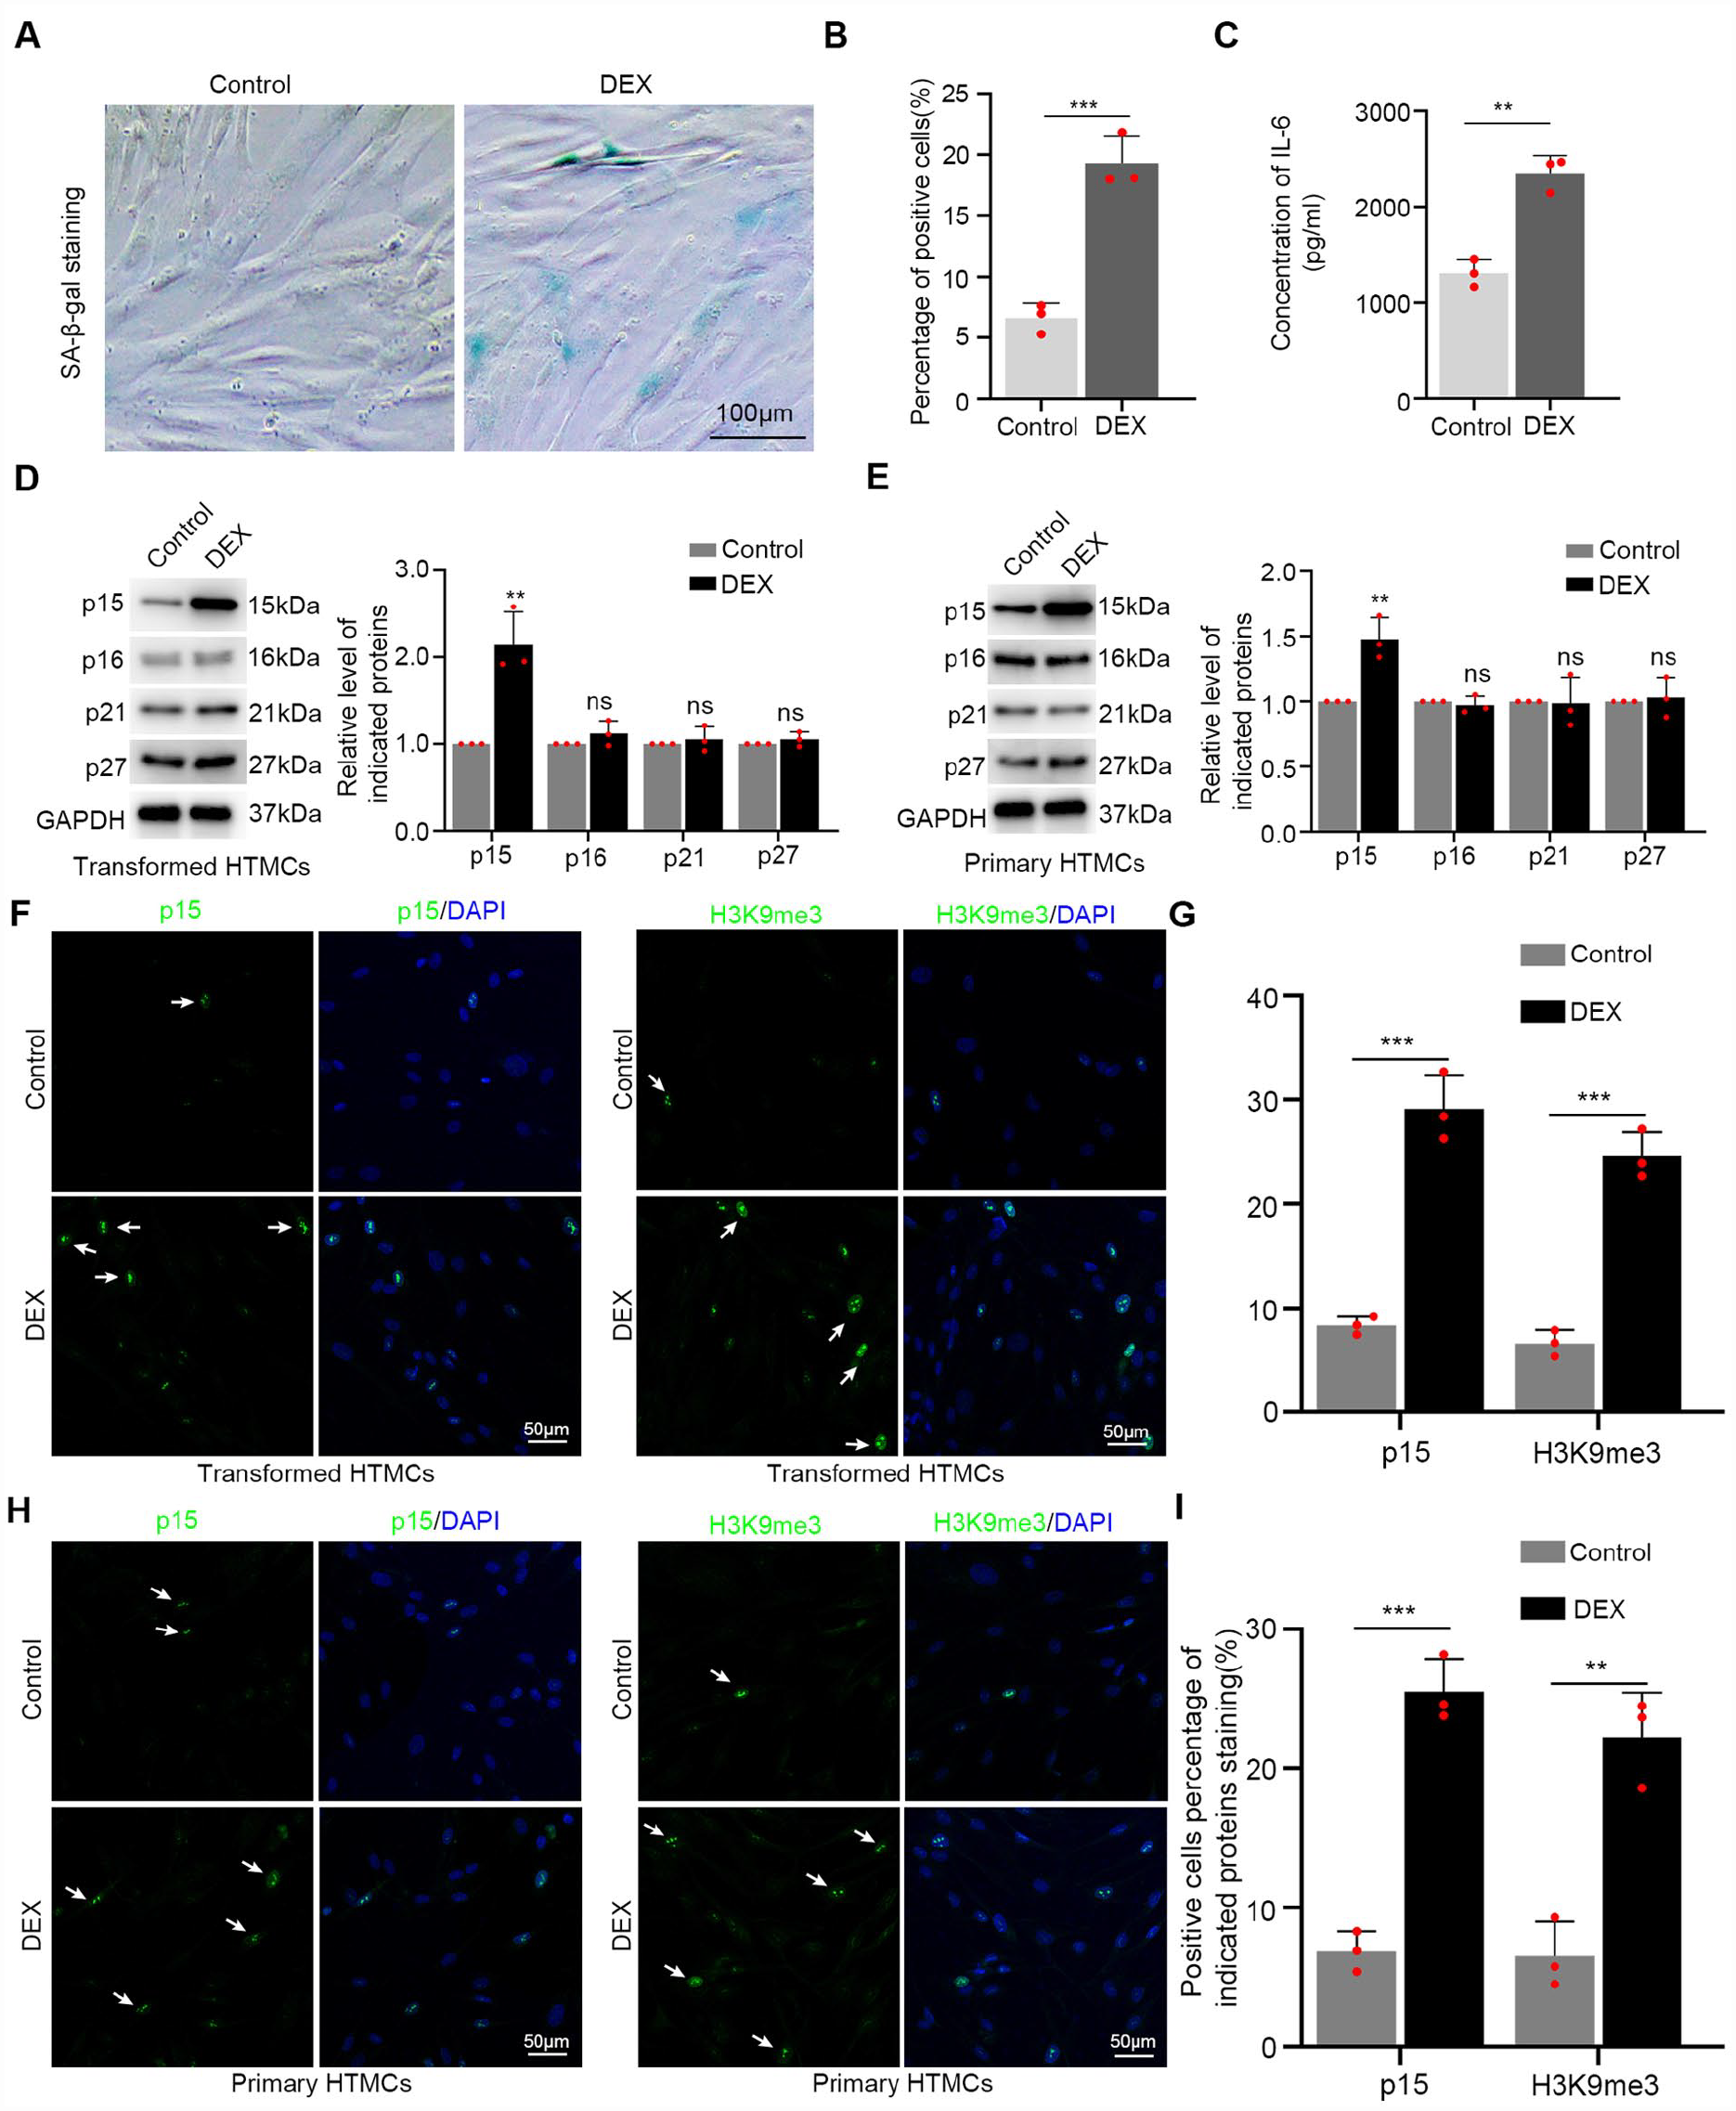
DEX induces senescence changes of trabecular meshwork cells. (A, B) SA-β-gal staining was conducted in transformed HTMCs after treating with 400 nM DEX or DMSO control for 72 h to detect senescent cells. Representative images of SA-β-gal staining, blue color indicates positive cells (A) with quantification data from three independent experiments (B). (C) Cell culture supernatants were collected from the cells in (A) and ELISA assays conducted to measure the levels of IL-6 (n=3 independent experiments). (D) Western blotting analysis of the cells from (A) against p15, p16, p21, and p27 level along with a GAPDH loading control (left) with quantification from three independent experiments (right). (E) The experiment in (D) was repeated in primary HTMCs. (F–I) Confocal images of staining against p15 (green, left panels) and H3K9me3 (green, right panels), and positive cells percentage quantification (n = 3) of p15 and H3K9me3 in control or DEX-treated transformed HTMCs (F, G) or primary HTMCs (H, I). Cell nuclei are stained with DAPI (blue). 20 times magnification and arrow shows positive cells. ANOVA: analysis of variance; DEX: dexamethasone; HTMC: human trabecular meshwork cells; DMSO: Dimethyl sulfoxide; DAPI: 4′,6-diamidino-2-phenylindole; ELISA: Enzyme-linked immunosorbent assay. **P < 0.01 unpaired student’s t-test; ns means no significance.
In parallel with these assays, we employed immunofluorescence staining combined with confocal microscopy to detect changes in the expression and cellular localization of p15 in response to DEX. Consistent with the western blotting data, DEX-treated transformed HTMCs cells expressed high levels of p15 staining compared to control cells, with a notable increase in the percentage of p15-positive cells (Fig. 2F,G). To supplement these findings, we assessed the expression of H3K9me3, a marker used to decorate senescence-associated heterochromatin foci (SAHF) which accumulate in senescent cells 36 . Comparative confocal images and quantification data showed DEX treatment increased the percentage of H3K9me3-positive cells compared to control-treated cells, with images showing H3K9me3 staining present as nuclear puncta representing SAHF (Fig. 2F, G). We also examined the changes in these markers in primary HTMCs. Consistently, DEX treatment in primary HTMCs resulted in increased nuclear staining of both p15 and H3K9me3 puncta (Fig. 2H, I). Consistently, the expression of an additional senescence marker, Ser139 phosphorylated (p)-histone H2A.X showed that DEX treatment increased the percentage of p-H2A.X-positive staining cells compared to controls in both transformed and primary trabecular meshwork cell cultures (Supplementary Fig. 3).
Collectively these results conclusively establish that DEX induces senescence changes in HTMCs through p15-mediated signaling, with the further suggestion that this process contributes to GCIG. However, it remained to be determined if DEX promotes senescence changes of HTMCs through TGFβ/Smad3 signaling as suggested by our previous findings, or whether another mechanism is involved.
Inhibition TGFβ2/Smad3 Pathway Can Rescue Senescence-Associated Changes Caused by DEX Treatment
Our preliminary experiments showed that DEX increased the levels of activated (phosphorylated) (p)Smad3 in HTMCs (Fig. 3A) which was associated with increases in TGFβ2 levels (Supplementary Fig. 4A, B). The small molecule agent SIS3 has been shown to be an efficient inhibitor of Smad3, acting to decrease the levels of pSmad3 37 . We first tested whether SIS3 could effectively antagonize pSmad3 activation caused by DEX. Accordingly, western blot analysis showed 100 nM SIS3 could efficiently inhibit pSmad3 level increases without impacting total Smad3 levels (Fig. 3A). Consistent with the involvement of TGFβ2 signaling, the addition of the TGFβ receptor inhibitor LY364947 completely reversed elevations in p-Smad3 levels caused by DEX treatment (Supplementary Fig. 4C, D).

Inhibition of TGFβ2/Smad3 signaling rescues senescence changes induction caused by DEX. (A) Transformed HTMCs were treated with 400 nM DEX or DMSO control with or without 100 nM SIS3 for 72 h before conducting western blot analysis against phosphorylated (p)-Smad3, total Smad3 and a GAPDH loading control. (B, C) Confocal images (B) of staining against Smad3 (green) and positive cells percentage quantification (n = 3 independent experiments) from three independent experiments (C) in the cells from (A). (D, E) Representative images (D) of SA-β-gal staining in the cells from (A) along with quantification data from three independent experiments (E). (F) Cell culture supernatants were collected from the cells in (A) and ELISA assays conducted to measure the levels of IL-6 (n = 3 independent experiments). (G) Western blotting analysis of the cells from (A) against p15 along with a GAPDH loading control (top) with quantification from three independent experiments (bottom). (H, I) Confocal images (H) of staining against p15 (green, left panels) and H3K9me3 (green, right panels) and positive cells percentage quantification (I) from three independent experiments in control or DEX-treated transformed HTMCs. Cell nuclei are stained with DAPI (blue). 20 times magnification, and arrow shows positive cells. ANOVA: analysis of variance; DEX: dexamethasone; HTMC: human trabecular meshwork cells; DMSO: Dimethyl sulfoxide; DAPI: 4′,6-diamidino-2-phenylindole; ELISA: Enzyme-linked immunosorbent assay. **P < 0.01; ***P < 0.001, ANOVA with a Tukey correction factor.
Activation of Smad3 by phosphorylation is associated with its translocation to the nucleus 38 . Therefore, immunofluorescence staining was conducted to clarify whether DEX affected the location of Smad3 within HTMCs. Notably, DEX treatment promoted the translocation of Smad3 to the nucleus, while this effect was entirely prevented by SIS3 treatment (Fig. 3B, C). Thus, DEX activates Smad3 in HTMCs which can be inhibited by SIS3 treatment. We then argued if DEX promotes HTMCs senescence changes by activating TGFβ/Smad3 signaling, then SIS3 treatment should rescue the senescent phenotype. Indeed, consistent with our hypothesis, SIS3 cotreatment with DEX significantly decreased SA-β-gal staining in HTMCs, reversing the percentage of SA-β-gal-stained cells to control levels (Fig. 3D, E). Consistent with these observations, SIS3 cotreatment also reversed the SASP phenotype resulting from DEX with the levels of secreted IL-6 in DEX + SIS3 treated HTMCs similar to control cells (Fig. 3F). Moreover, SIS3 cotreatment was also effective in preventing p15 protein increases caused by DEX (Fig. 3G). And similarly, assessment of p15 and H3K9me3 expression and localization by immunostaining showed SIS3 reduced the percentage of positive cells for both markers compared with the DEX-treated group (Fig. 3H, I). Based on these data, we concluded that DEX promotes cellular senescence changes of HTMCs by activating the TGFβ/Smad3 pathway. However, further mechanistic details remained to be clarified.
DEX Increases ROS Levels Through Upregulation of NOX4
ROS is a key factor promoting age-related senescence. Previously it was shown that TGFβ2/Smad3 promotes NOX4 expression to increase ROS levels29,30, which potentially could contribute to DEX-mediated HTMCs senescence changes through TGFβ/Smad3 pathway activation 17 . To test this hypothesis, we employed the DCFH-DA probe to measure changes in the ROS levels of transformed HTMCs after DEX treatment. Strikingly, confocal microscope images show that ROS levels and the percentage of DCF positive cells were upregulated after DEX treatment (Fig. 4A) with quantitative measurements confirming the levels were significantly increased (Supplementary Fig. 5A). Then to determine if these increases were reflected in changes in NOX4 expression in transformed HTMCs, we conducted western blotting. In accordance, this analysis showed that DEX significantly promoted the expression of NOX4 (Fig. 4B). Ensuring these findings were also relevant to primary cells, repeating the confocal and western blot assays showed that DEX increased ROS and NOX4 levels in primary HTMCs (Fig. 4C, D and Supplementary Fig. 5B).
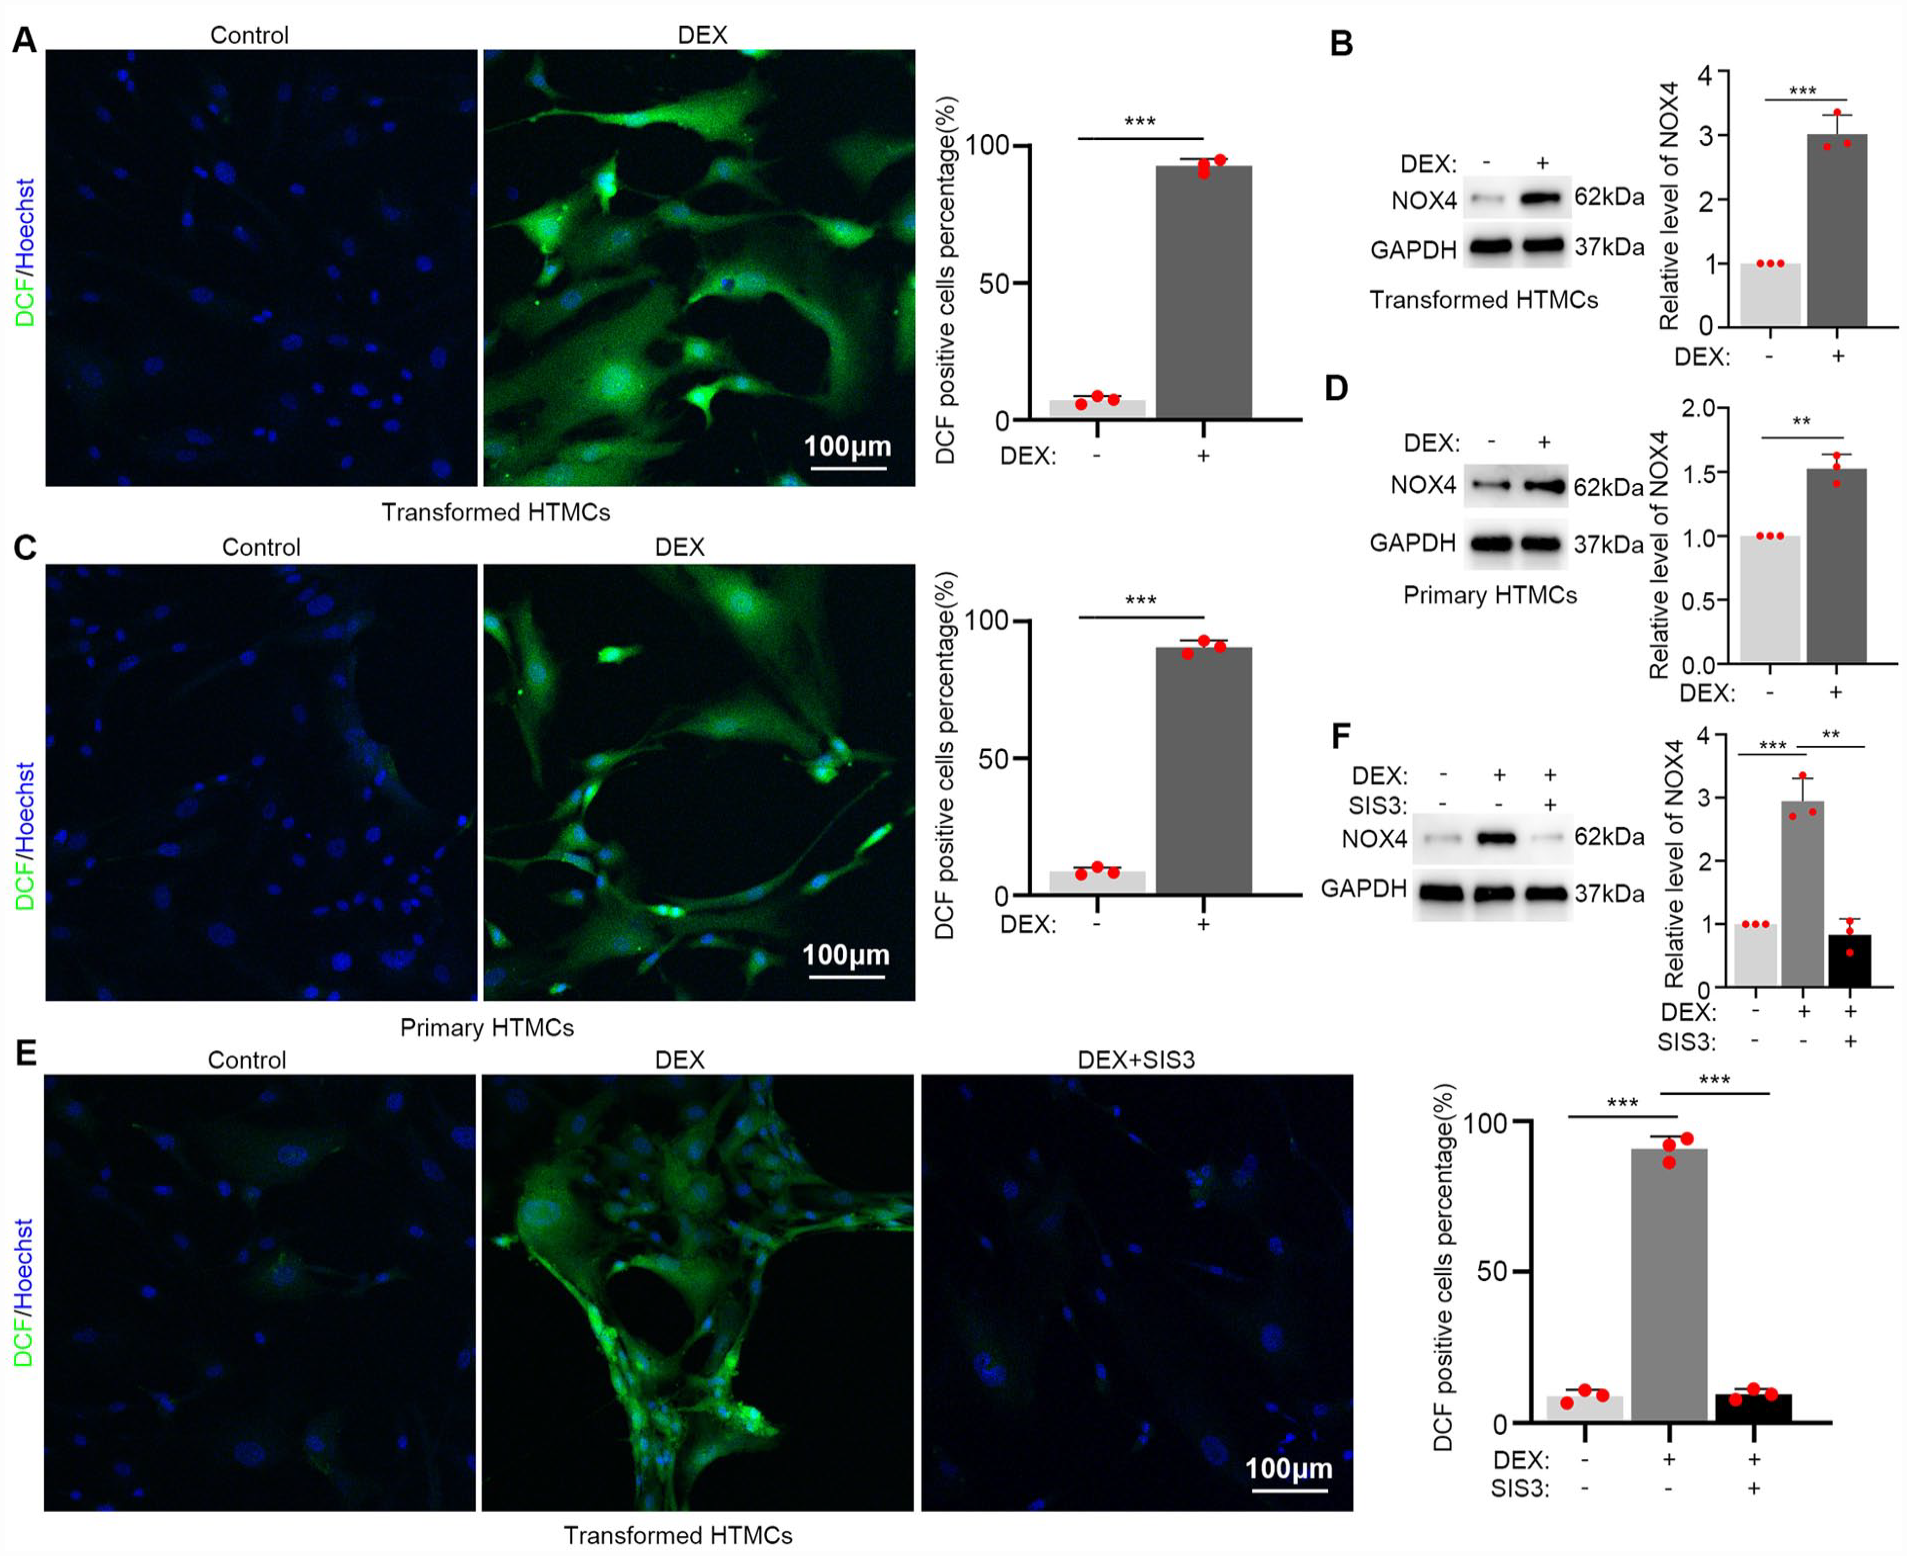
DEX increases ROS levels via upregulation of NOX4. (A) Transformed HTMCs were treated with 400 nM DEX or DMSO for 72 h before measuring ROS levels using the DCFH-DA probe. Confocal images (left) and quantitation of the percentage of DCF-positive cells from three independent experiments (right). (B) Western blotting analysis of the cells from (A) against NOX4 along with a GAPDH loading control (left) with quantification from three independent experiments (right). (C, D) The experiments in (A, B) were repeated in primary HTMCs. (E) Transformed HTMCs were treated with 400 nM DEX or DMSO control with or without 100 nM SIS3 for 72 h. Confocal images revealing staining with the DCFH-DA ROS probe (left) and quantitation of the percentage of DCF-positive cells from three independent experiments (right). (F) Western blotting analysis of the cells from (E) against NOX4 along with a GAPDH loading control (top) with quantification from three independent experiments (bottom). Twenty times magnification with cell nuclei stained using Hoechst (blue). ANOVA: analysis of variance; DEX: dexamethasone; HTMC: human trabecular meshwork cells; ROS: reactive oxygen species; DMSO: Dimethyl sulfoxide; DCFH-DA: Dichlorodihydrofluorescein. **P < 0.01; ***P < 0.001, unpaired student’s t-test for A-D, ANOVA with a Tukey correction factor for E and F.
To formally connect the DEX-induced increases in ROS levels with NOX4 and TGFβ/Smad3 signaling, we again used the Smad3 inhibitor SIS3. Importantly, the addition of SIS3 cotreatment with DEX was able to rescue the increased ROS levels caused by DEX treatment in transformed HTMCs (Fig. 4E and Supplementary Fig. 5C) along with diminishing the increased levels of NOX4 (Fig. 4F). Together, these data demonstrate that DEX increases ROS levels by upregulating NOX4 levels via activating the TGFβ/Smad3 pathway. Nevertheless, it remained to be formally demonstrated that this mechanism underlies the induction of cell senescence changes in HTMCs.
DEX Induces Senescence-Associated Changes by Increasing ROS in Trabecular Meshwork Cells
To clarify whether DEX-induced senescence changes depend on increasing ROS levels through NOX4, we treated transformed HTMCs with DEX in combination with either the NOX4 inhibitor GLX351322 (10 μM) or the ROS inhibitor NAC (40 μM). These experiments showed that both GLX351322 and NAC could effectively decrease the elevated ROS levels induced by DEX treatment (Fig. 5A–C). Moreover, treatment of transformed HTMCs with either GLX351322 or NAC decreased the percentage of SA-β-gal-positive cells compared to DEX treatment alone (Fig. 5D, E). Consistently, the results of ELISA assays showed that GLX351322 and NAC both significantly inhibited IL-6 production in DEX-treated cells (Fig. 5F). Finally, western blotting showed that GLX351322 and NAC suppressed the increased levels of p15 in DEX-treated cells (Fig. 5G) with parallel immunostaining assays also showing the inhibitors effectively decreased the positive percentage of staining against p15 and H3K9me3, respectively (Supplementary Fig. 6A, B). These collective experiments therefore reveal that DEX induces senescence changes in transformed HTMCs via NOX4 generated increases in cellular ROS.

DEX induces senescence changes through increasing ROS levels in trabecular meshwork cells. (A-C) Transformed HTMCs were treated with 400 nM DEX alone or in combination with the NOX4 inhibitor GLX351322 (10 μM), or ROS inhibitor NAC (40 μM) for 72 h. Confocal images revealing staining with the DCFH-DA ROS probe (A), quantitation of the percentage of DCF-positive cells from three independent experiments (B), and quantitation of ROS levels using a microplate reader from four independent experiments (C). Twenty times magnification with cell nuclei stained using Hoechst (blue). (D, E) Representative images (D) of SA-β-gal staining in the cells from (A) along with quantification data from three independent experiments (E). (F) Cell culture supernatants were collected from the cells in (A) and ELISA assays conducted to measure the levels of IL-6 (n = 3 independent experiments). (G) Western blotting analysis of the cells from (A) against p15 along with a GAPDH loading control (left) with quantification from three independent experiments (right). ANOVA: analysis of variance; DEX: dexamethasone; HTMC: human trabecular meshwork cells; ROS: reactive oxygen species; ELISA: Enzyme-linked immunosorbent assay; DCFH-DA: Dichlorodihydrofluorescein; NAC: N-Acetyl-L-cysteine. **P < 0.01; ***P < 0.001, ANOVA with a Turkey correction factor.
DEX Induces Senescence-Associated Changes in Trabecular Meshwork Cells in vivo
A pertinent question remained as to whether DEX induces senescence changes in trabecular meshwork cells in vivo? Toward an answer, we adopted the same experimental strategies using pharmacological inhibitors in a GCIG mouse model. Accordingly, we injected the periocular conjunctival fornix of mice with DEX-ac alone or in combination with the NOX4 inhibitor (GLX351322) while control group mice were injected with physiological salt solution (Fig. 6A). Weekly IOP measurements confirmed that DEX-ac injections induced sustained increases in IOP compared to the control group throughout the experiment, with increases in IOP being rescued by cotreatment with GLX351322 (Fig. 6B). Furthermore, examination of eye sections using immunostaining showed that DEX-ac treatment increased the intensity of p15 in trabecular meshwork cells, which was rescued by GLX351322 treatment (Fig. 6C, D). Moreover, the levels of NOX4 in trabecular meshwork cells was also increased compared to control eyes, while NOX4 levels were not affected by GLX351322 co-treatment (Fig. 6E, F).

Dexamethasone induces senescence changes in vivo through ROS via the Smad3-NOX4 axis. (A, B) An in vivo mouse model was established by injecting DEX-ac alone or in combination with the NOX4 inhibitor GLX351322 into the periocular conjunctival fornix once a week (A). Every group had five mice with IOPs measured weekly (B). (C, D) Representative confocal images of eye sections from (A) showing immunostaining against p15 (C) and relative intensity of p15 in TM tissues were quantified (D). Cell nuclei were decorated with DAPI (blue) with the boxed area indicating the trabecular meshwork. (E, F) Representative confocal images of eye sections from (A) showing immunostaining against NOX4 (E) and relative intensity of NOX4 in TM tissues were quantified (F). Cell nuclei were decorated with DAPI (blue) with the boxed area indicating the trabecular meshwork. ANOVA: analysis of variance; DEX: dexamethasone; ROS: reactive oxygen species; TM: trabecular meshwork; DAPI: 4’,6-diamidino-2-phenylindole. ***P < 0.001, ANOVA with a Tukey correction factor.
Our collective data propose a molecular mechanism for GCIC whereby DEX activates the TGFβ/Smad3 signaling pathway with the resulting activation of Smad3 driving increased NOX4 with concordant increases in ROS levels. And the resulting increases in oxidative stress induce senescence changes in trabecular meshwork cells (Fig. 7). Moreover, the same underlying mechanism appears active in the in vivo context, suggesting that senescence contributes to pathological development of glaucoma.

Model of the molecular mechanism. Working model of DEX-mediated activation of the TGFβ2/Samd3 signaling pathway. Smad3 up-regulates NOX4 levels, increasing ROS levels and oxidative stress to induce senescence changes in trabecular meshwork cells. DEX: dexamethasone; ROS: reactive oxygen species.
Discussion
Glaucoma is a complex disease but most workers in the field recognize the key role played by the elevation of IOP. This is intimately related to the disfunction of trabecular meshwork cells which represent an important regulator of outflow resistance of the aqueous humor. Consequently, much of the research related to glaucoma has focused on the function of trabecular meshwork cells. Here using DEX as a representative GC, we initiated our study by conducting high-throughput transcriptomics in a GCIG model employing transformed HTMCs. This analysis yielded a surprisingly large collection of 4103 differently expressed genes after DEX treatment. And among the many pathways enriched based on KEGG analysis, we chose to focus on the cellular senescence and TGFβ signaling pathways to better understand pathological effects of DEX with experiments involving both primary and transformed HTMCs together with employing a murine model.
High expression levels of TGFβ2 in aqueous humor have been previously associated with glaucoma22,24,25, and shown to strongly promote ECM-related gene expression through the activation of Smad3, causing fibrosis of the trabecular meshwork 22 . TGFβ2 has also been shown to upregulate NOX4 expression with the elevated ROS levels similarly associated with trabecular meshwork fibrosis. Nevertheless, the relationship between high ROS levels and altered ECM gene expression in this setting is still unclear. DEX can also increase ECM gene expression through the TGFβ/Smad3 pathway, indicative that this pathway also contributes to glaucoma pathology through promoting fibrosis. However, our PPI analysis of DEGs regulated by DEX indicated there was likely strong crosstalk between TGFβ/Smad3 signaling and cellular senescence. It has been reported that TGFβ2 induces senescence changes in HTMCs, for instance, in vitro TGFβ2 treatment increases lipid peroxidation to induce senescence changes via activation of the p16-pRb signal transduction pathway 39 . Our study showed that DEX treatment similarly induced a similar phenotype in HTMCs via TGFβ2-Smad3 pathway activation but with the senescent signal delivered through a different molecular mechanism involving p15.
Previous work has implicated p15 in POAG pathogenesis and further show that DEX increases senescence changes via p15, a key enforcer of cell cycle arrest which acts by inhibiting the function of CDK4 and CDK6 40 . Notably, p15 is known to be selectively activated through TGFβ signaling to drive cells into an acute senescent state, which may be eliminated by the immune system or otherwise be transformed to chronic senescence 41 . Thus, as the main functions of DEX involve anti-inflammatory/immune responses, DEX may not only induce acute senescence in HTMCs but also in the in vivo context, impair the immune clearance of senescent cells to allow the accumulation of chronic senescent cells. This latter notion will require further substantiation but highlights the clearly multifaceted effects of DEX on glaucoma pathogenesis.
Various factors can induce cellular senescence, including oxidative stress. We found that DEX increases ROS levels via upregulation of NOX4, the key enzyme producing ROS in many cell types. Moreover, inhibiting Smad3 with SIS3 repressed NOX4 expression, indicating that activated Smad3 plays a key role in inducing NOX4 in HTMCs. Furthermore, inhibition of NOX4 or elimination of ROS was able to suppress the senescence changes induced by DEX treatment. This reveals the important principle that preventing excessive ROS can protect trabecular meshwork cells from the effects of GCs. We found the same phenomenology applied in vivo where inhibiting NOX4 with GLX351322 reduced the induction of p15 following DEX periocular conjunctival fornix injections. Encouragingly, GLX351322 also rescued the elevation of IOP promoted by DEX, providing proof-of-principle that elevated IOP can be alleviated by targeting NOX4 and potentially prevent glaucoma. However, while these results are encouraging, the practicality of using anti-ROS or anti-senescence therapies to protect trabecular meshwork cells during GCIG and POAG still requires further investigation.
Finally, we must acknowledge some limitations of our study. Although we have linked DEX increased ROS to effects on the Smad3/NOX4 axis, the resulting senescence-associated changes are not the sole mechanism involved in glaucoma development. Rather, as we have expounded above, senescence constitutes one component of a multi-interactive network of processes which also includes fibrosis and inflammation42,43. Embedded within our mRNA-seq data we also found pathway enrichments for mTOR signaling, AMPK signaling, and autophagy. The involvement of autophagy has previously been reported in glaucoma44–46, but whether DEX regulates mTOR signaling and AMPK signaling to induce downstream autophagy in HTMCs remains an avenue of worthy investigation. In addition, there are differences in the circadian rhythm of IOP in humans and mice 47 , but whether DEX disturbs the rhythm to causes elevation of IOP is also a promising scientific question. Notwithstanding these points, our study serves to clearly position senescence changes in trabecular meshwork cells as a contributory factor in glaucoma, also disclosing new mechanistic details which provide strategies to counter GCIG and POAG.
Supplemental Material
sj-docx-1-cll-10.1177_09636897231177356 – Supplemental material for Dexamethasone Induces Senescence-Associated Changes in Trabecular Meshwork Cells by Increasing ROS Levels Via the TGFβ/Smad3-NOX4 Axis
Supplemental material, sj-docx-1-cll-10.1177_09636897231177356 for Dexamethasone Induces Senescence-Associated Changes in Trabecular Meshwork Cells by Increasing ROS Levels Via the TGFβ/Smad3-NOX4 Axis by Haijun Li, Jing Ren, Huiling Cui, Di Wang, Rumeng Zhao, Xiaohui Liu, Shuai Tian, Jing Wang, Jingyi Zhang, Peng Li, Rick F. Thorne and Shichao Duan in Cell Transplantation
Supplemental Material
sj-docx-2-cll-10.1177_09636897231177356 – Supplemental material for Dexamethasone Induces Senescence-Associated Changes in Trabecular Meshwork Cells by Increasing ROS Levels Via the TGFβ/Smad3-NOX4 Axis
Supplemental material, sj-docx-2-cll-10.1177_09636897231177356 for Dexamethasone Induces Senescence-Associated Changes in Trabecular Meshwork Cells by Increasing ROS Levels Via the TGFβ/Smad3-NOX4 Axis by Haijun Li, Jing Ren, Huiling Cui, Di Wang, Rumeng Zhao, Xiaohui Liu, Shuai Tian, Jing Wang, Jingyi Zhang, Peng Li, Rick F. Thorne and Shichao Duan in Cell Transplantation
Supplemental Material
sj-docx-3-cll-10.1177_09636897231177356 – Supplemental material for Dexamethasone Induces Senescence-Associated Changes in Trabecular Meshwork Cells by Increasing ROS Levels Via the TGFβ/Smad3-NOX4 Axis
Supplemental material, sj-docx-3-cll-10.1177_09636897231177356 for Dexamethasone Induces Senescence-Associated Changes in Trabecular Meshwork Cells by Increasing ROS Levels Via the TGFβ/Smad3-NOX4 Axis by Haijun Li, Jing Ren, Huiling Cui, Di Wang, Rumeng Zhao, Xiaohui Liu, Shuai Tian, Jing Wang, Jingyi Zhang, Peng Li, Rick F. Thorne and Shichao Duan in Cell Transplantation
Footnotes
Authors’ Contributions
S.D. and H.L. conceived the project; S.D., R.F.T., and P.L. directed the project; H.L., J.R., H.C., and S.T. performed major in vitro experiments; D.W., R.Z., X.L. and J.W. did mice-related experiments; J.Z. and P.L. did the bioinformatic analysis. S.D., R.F.T., H.L. and P.L. designed experiments, interpreted data, and wrote the paper.
Data Availability Statement
The RNA seq data used in this study is available in the public data set PRJNA877628 from SRA (National Center for Biotechnology Information).
Ethical Approval
This study was approved by the Medical Ethical Committee of Henan Eye Hospital (HNEECKY-2022(18)).
Statement of Human and Animal Rights
All animal experiments complied with the Association for Research in Vision and Ophthalmology Statement. All animal experiments were approved by Animal Ethics Committee of Zhengzhou University (ZZU-LA20220729).
Statement of Informed Consent
Written informed consent was obtained from each eye donor.
Declaration of Conflicting Interests
The author(s) declared no potential conflicts of interest with respect to the research, authorship, and/or publication of this article.
Funding
The author(s) disclosed receipt of the following financial support for the research, authorship, and/or publication of this article: This work was supported by the National Natural Science Foundation of China (grant no. U1904166), and Henan Medical Science and technology research plan (grant no. SBGJ2018072).
Supplemental Material
Supplemental material for this article is available online.
References
Supplementary Material
Please find the following supplemental material available below.
For Open Access articles published under a Creative Commons License, all supplemental material carries the same license as the article it is associated with.
For non-Open Access articles published, all supplemental material carries a non-exclusive license, and permission requests for re-use of supplemental material or any part of supplemental material shall be sent directly to the copyright owner as specified in the copyright notice associated with the article.