
Abstract
This study tested whether combined hyperbaric oxygen (HBO) and allogenic adipose-derived mesenchymal stem cells (ADMSCs) would be superior to either one for improving the locomotor recovery in rat after acute traumatic spinal cord injury (TSCI) in rat. Adult-male Sprague–Dawley rats were equally categorized into group 1 (sham-operated control), group 2 (TSCI), group 3 (TSCI + HBO for 1.5 h/day for 14 consecutive days after TSCI), group 4 (TSCI + ADMSCs/1.2 × 106 cells by intravenous injection at 3 h and days 1/2 after TSCI), and group 5 (TSCI + HBO + ADMSCs), euthanized, and spinal cord tissue was harvested by day 49 after TSCI. The protein expressions of oxidative-stress (NOX-1/NOX-2), inflammatory-signaling (TLR-4/MyD88/IL-1β/TNF-α/substance-p), cell-stress signaling (PI3K/p-AKT/p-mTOR), and the voltage-gated sodium channel (Nav1.3/1.8/1.9) biomarkers were highest in group 2, lowest in group 1, and significantly lower in group 5 than in groups 3/4 (all P <0.0001), but they did not differ between groups 3 and 4. The spinal cord damaged area, the cellular levels of inflammatory/DNA-damaged biomarkers (CD68+/GFAP+/γ-H2AX+ cells), mitogen-activated protein kinase family biomarkers (p-P38/p-JNK/p-ERK1/2), and cellular expressions of voltage-gated sodium channel (Nav.1.3, Nav.1.8, and Nav.1.9 in NF200+ cells) as well as the pain-facilitated cellular expressions (p-P38+/peripherin+ cells, p-JNK+/peripherin+ cells, p-ERK/NF200+ cells) exhibited an identical pattern of inflammation, whereas the locomotor recovery displayed an opposite pattern of inflammation among the groups (all P < 0.0001). Combined HBO-ADMSCs therapy offered additional benefits for preserving the neurological architecture and facilitated the locomotor recovery against acute TSCI.
Keywords
Introduction
An effective way to improve function of those traumatic spinal cord injury (TSCI) patients is urgent and worthy, but it is regrettably still lacking, especially in consideration of the preservation of the residual neurological function and increase in the functional recovery are the two main goals for those patients. Currently, it is a formidable challenge for physicians to achieve these missions1–4.
Generation of reactive oxygen species (ROS) 5 , mitochondria dysfunction 6 , and cytokine release by neutrophil in situation of inflammatory reaction after TSCI will elicit local water retention, cell swelling as alternation of cell-membrane water channel dysfunction7,8, which in turn causes tissue edema, produces compression pressure to the local microcirculation, and further reduces tissue perfusion, that is, a vicious cycle formation. This vicious cycle which enhances local ischemia and amplifies inflammation, resulting in even more ROS production and cell apoptosis, is the main theme to be overcome 9 . An unacceptable high prevalence (ie, estimated to be more than 60%–80%) of painful sensation is one of notorious outcome in TSCI patients. Regrettably, the treatment for this painful sensation is rarely successful 10 . In addition, joint deformity, muscle atrophy, and bladder and bowel dysfunction always cause the resting life of TSCI patient miserable and dark.
Plentiful data from experimental and clinical trials have shown that cell therapy effectively improved ischemia-related organ dysfunction11–14. The underlying mechanism for improving the organ dysfunction after cell therapy has been proposed to be that the stem cells, especially those of adipose-derived mesenchymal stem cells (ADMSCs), have capacities of anti-inflammation, immunomodulation, suppression of oxidative stress/ROS, and tissue regeneration15–17. Interestingly, our previous studies have further demonstrated that ADMSC therapy significantly improved the neurological function and markedly reduced infarct volume in rat after acute ischemic stroke18,19. Other recent studies have also demonstrated that ADMSC therapy effectively protected the brain in rodent after acute ischemic injury20,21. Interestingly, the results of some experimental studies have recently further recommended that ADMSCs therapy could offer benefit for spinal cord injury mainly through regenerative neuronal tissue22–24. However, whether ADMSC therapy for spinal cord injury would really improve the outcome is still not fully addressed 25 , raising the need of furthermore evidence to support a conclusion.
Hyperbaric oxygen (HBO) therapy is an original therapy for patients with ischemic peripheral arterial occluded disease26–28. The underlying mechanism of HBO therapy involved in improving ischemic organ has been proposed to be mainly through an increase of vascular wall permeability and productions of hypoxia-inducible factor-1α and stromal cell–derived factor that enhance the angiogenesis and blood flow in the ischemic area 28 as well as the mobilization of stem cell into the ischemia region 29 . In addition, our recent study has further shown that HBO therapy rescued the rat limb from critical limb ischemia injury mainly through anti-inflammation and reduction of the oxidative stress 29 .
Based on the aforementioned issues, we proposed that HBO-assisted ADMSCs might offer a synergic effect for rescuing the spinal cord function and improving the neurological outcome as well as suppressed the molecular–cellular perturbations against acute TSCI in rat.
Materials and Methods
Ethics
All animal procedures were approved by the Institute of Animal Care and Use Committee at Kaohsiung Chang Gung Memorial Hospital (Affidavit of Approval of Animal Use Protocol No. 2019062504) and performed in accordance with the Guide for the Care and Use of Laboratory Animals.
Animals were housed in an Association for Assessment and Accreditation of Laboratory Animal Care International (Frederick, MD, USA)–approved animal facility in our hospital with controlled temperature and light cycles (24°C and 12/12 light cycle).
Animal Model of Acute TSCI
The procedure and protocol were based on the previous reports30–32 with some modification. Pathogen-free, adult-male Sprague–Dawley (SD) rats (n = 40) weighing 300 to 325 g (Charles River Technology, BioLASCO Taiwan Co. Ltd., Taiwan) were utilized in the present study. In detail, animals were anesthetized by inhalational 2.0% isoflurane and placed in prone position on a warming pad at 37°C for laminectomy. Sham-operated control (SC) animals underwent opening the skin and muscle layers only, while acute TSCI groups received acute TSCI procedure. The step-by-step procedure for creating an animal model of acute TSCI is listed below:
(1) The rats were anesthetized by inhalation of 2.0% isoflurane, then placed in prone position on a warming pad at 37°C to secure the head and shave the back hair.
(2) Skin incision was carried out at the T10–T12 levels, subperiosteal dissection of the paraspinal muscle, and then a laminectomy was performed at T10–T12 to expose the spinal cord.
(3) A modified aneurysm clip was used to create an impact-compression injury of the spinal cord. The clip was left for compressing the spinal cord for 30 s prior to be removed by the operator.
(4) After induction of the aforementioned TSCI, the muscles were sutured using 3–0 vicryl suture (Ethicon, Somerville, NJ, USA) and the skin/muscle layers were finally closed with Michel clips.
(5) The animals recovered from anesthesia in a portable animal intensive care unit (ThermoCare®) for 24 h, then were allowed to recover in a cage. Bladders were expressed three times daily until spontaneous voiding occurred, and any hematuria or urinary tract infection was treated with ampicillin (100 mg/kg by subcutaneous administration twice daily for 5 days).
(6) Post-op wound care and the motor/sensory neurologic function assessment were performed consistently.
(7) Walking feature and neurological status were recorded by days 1, 3, 7, 14, 28, 35, 42, and 49 after TSCI procedure.
Animal Grouping
The animals (n = 54) were categorized into group 1 [SC (only open the skin and muscle layer of spinal cord area), n = 12], group 2 (acute TSCI, n = 10), group 3 [TSCI + HBO (1.5 h per day for 14 consecutive days with the first time point at 3 h after the acute TSCI procedure), n=14], group 4 [TSCI + ADMSCs (1.2 × 10⁶ cells/per time) by intravenous injection (ie, from the tail vein) at 3 h and days 1 and 2 after acute TSCI procedure, n = 8], and group 5 (TSCI + HBO + ADMSCs, n = 10), respectively. Animals in each group were euthanized by day 49 after TSCI procedure and the spinal cord specimen in each animal was harvested for individual study. The detail procedures of TSCI, time points of cell/HBO therapy, and Basso, Beattie, Bresnahan (BBB) functional scale assessment were schematically illustrated in Supplementary Fig. 1.
Isolation of Adipose Tissue for Culturing Mesenchymal Stem Cells
For preparation of allogenic ADMSCs, additional 12 rats were utilized in the present study. The procedure and protocol have been clearly described in our previous reports18,19. Briefly, rats in groups 4 and 5 were anesthetized with inhalational 2.0% isoflurane 14 days before TSCI procedure for harvesting the adipose tissue surrounding the epididymis. The tissue was then being cut into <1 mm3 pieces using a pair of sharp, sterile surgical scissors. Sterile saline (37°C) was added to the homogenized adipose tissue in a ratio of 3:1 (saline: adipose tissue) by volume, followed by the addition of working solution of collagenase II (#C6885, Sigma, Germany) to a final concentration of 1.0 g/ml. The cells obtained were placed to the rocker for incubation. The contents of the flask were transferred to 50 ml tubes after digestion, followed by centrifugation at 600× g for 5 min at room temperature. The flow-through was pipetted to a 40-µm filter into a new 50-ml conical tube. The tubes were centrifuged for a third time at 600× g for 5 min at room temperature. The cells were resuspended in saline again. Isolated ADMSCs were cultured in a 100-mm diameter dish with 10 ml Dulbecco’s modified eagle medium (DMEM) culture medium containing 10% fetal bovine serum (FBS) for 14 days. Approximately, 2–3 × 10⁶ ADMSCs were obtained from each rat by three to five passages. Flow cytometric analysis was performed for identification of cellular characteristics after cell-labeling with appropriate antibodies on day 14 prior to transfusion (refer to Supplementary Fig. 2).
BBB Functional Scale for Assessment of the Locomotor Capacity of Rats After Acute TSCI
The animals were followed for 7 weeks (ie, 49 days) after acute TSCI procedure (refer to Supplementary Fig. 1). The procedure and protocol of BBB scale were based on the previous reports33,34. In detail, after the aforementioned period each rat was placed in an 80 × 80 × 30 cm3 clear box lined with a blue non-slippery material and stimulated to move freely. Their movement was video-recorded. Identical copies of the edited videos were given to two independent evaluators who were blinded with regard to the degree of injury severity. Each evaluator made a determination of the locomotor capacity of the rats using the BBB functional scale. Finally, the parameters in each rat were summed and calculated by averaging scores collected from both right and left limbs by these two evaluators.
HBO Therapy
The procedure and protocol of HBO therapy were based on a recent report 29 (refer to Supplementary Fig. 1). Briefly, to induce tissue-level hyperoxia, SD rats were subjected to HBO administration in an animal tabletop chamber (Piersol-Dive, model 4934) with the animals exposed to 100% oxygen at 2.4 atmospheres absolute for 90 min one session for 14 consecutive days.
Western Blot Analysis
The spinal cords from the rats of the sham control and experimental groups were harvested as previously described 35 . Equal amounts (50 µg) of protein extracts from each animal were loaded and separated by sodium dodecyl sulfate polyacrylamide gel electrophoresis (SDS-PAGE) using 8% to 12% acrylamide gradients. After electrophoresis, the separated proteins were transferred electrophoretically to a polyvinylidene difluoride membrane (Amersham Biosciences, Germany). Nonspecific sites were blocked by incubation of the membrane in blocking buffer [5% nonfat dry milk in T-tris buffered saline (TBS containing 0.05% Tween 20)] overnight. The membranes were incubated with the indicated primary antibodies (refer to Supplementary Table 1) and actin (1:10,000, Millipore) for 1 h at room temperature. Horseradish peroxidase–conjugated anti-rabbit immunoglobulin IgG (1:2,000, Cell Signaling) was used as the secondary antibody for 1-h incubation at room temperature. The washing procedure was repeated eight times within an hour, and immunoreactive bands were visualized by enhanced chemiluminescence (ECL; Amersham Biosciences) after exposure to Biomax L film (Kodak, Japan). For quantification, ECL signals were digitized using Labwork software (UVP, Canada). Finally, mean of six groups for each parameter for detailed statistical analysis was adequately performed.
Immunofluorescent (IF) Staining
IF staining proceeded as we previously reported 35 . In detail, the rehydrated paraffin sections were first treated with 3% H2O2 for 30 min and incubated with Immuno-Block reagent (BioSB, Santa Barbara, CA, USA) for 30 min at room temperature. Sections were then incubated with indicated primary antibodies (refer to Supplementary Table 1). Sections incubated with irrelevant antibodies served as controls. Three sections of DRG specimens were analyzed in each rat. For quantification, three randomly selected high-power fields (HPFs) were analyzed per section. The mean number of positively stained cells per HPF for each animal was determined across all nine HPFs.
Histological Quantification of Spinal Cord Injured Area
The hematoxylin and eosin (H&E) stain was used for identifying the area of spinal cord injury. The spinal cord specimens were sectioned at 4 µm for light microscopy for each animal. Three spinal cord sections from each rat were analyzed and three randomly selected HPFs (10×) were examined in each section. The integrated area (µm2) of spinal cord injury on each section was calculated using the Image Tool 3 (IT3) image analysis software (University of Texas, Health Science Center, San Antonio; Image Tool for Windows, Version 3.0, USA). Three randomly selected HPFs (10×) were analyzed in each section. After assessment of the number of pixels in each injured area per HPF, the numbers of pixels obtained from three HPFs were summed. The procedure was repeated in two other sections for each animal. The mean pixel number per HPF for each animal was then calculated by summing up all pixel numbers and divided by nine. The mean integrated area (µm2, ie, the morphological destructive area) of per HPF was obtained using a conversion factor of 19.24 (1 µm2 corresponded to 19.24 pixels).
Statistical Analysis
Quantitative data were expressed as mean ± SD. Statistical analysis was adequately performed by one-way analysis of variance (ANOVA) followed by Bonferroni multiple-comparison post hoc test. In addition, for case of motor analysis, additional method, that is, a one-way ANOVA for repeated measures, was also utilized in the present study (refer to Supplementary Table 1). Statistical analysis was performed using SAS statistical software for Windows (Version 8.2; SAS institute, Cary, NC, USA). A probability value <0.05 was considered statistically significant.
Results
Illustrating the Morphological Feature of ADMSCs and the Flow Cytometric Analysis of the Distribution (%) of MSC Surface Markers
By day 14 after the cell culturing, abundant ADMSCs were observed (Supplementary Fig. 2). The flow cytometric analysis showed that CD29+, CD73+, and CD90+ cells were the predominant phenotypes, an estimated more than 93%. In addition, microscopic findings demonstrated that the majority of morphological feature of ADMSCs was spindle shape.
The Time Courses of Assessment of the Locomotor Recovery After TSCI Procedure
First, the BBB functional scale for assessment of the locomotor capacity of rats was performed for each rat on days 1, 3, 7, 14, 28, 35, 42, and 49 after acute TSCI induction (Fig. 1 and Supplementary Table 1). By days 1 and 3, the BBB score, that is, from summation of left and right lower limb, was significantly higher in group 1 (ie, SC) than in groups 2 (ie, TSCI), 3 (ie, TSCI + HBO), 4 (ie, TSCI + ADMSCs), and 5 (ie, TSCI + HBO + ADMSCs), but it did not differ among groups 2 to 5 at these time points.

Time courses of BBB score among the five groups after acute TSCI procedure. (A) By days 1 and 3: * versus †, P < 0.0001; symbol † indicated the P-value >0.5 among the groups of TSCI, TSCI + HBO, TSCI + ADMSCs, and TSCI + HBO + ADMSCs at these time points. (B) By days 7, 14, and 28: ‡ versus other groups with different symbols (§, ¶), P < 0.0001; § indicated the P-value >0.5 among the groups TSCI + HBO, TSCI + ADMSCs, and TSCI + HBO + ADMSCs at these time points. (C) By days 35 and 49: α versus other groups with different symbols (β, γ, κ), P < 0.0001; γ indicated the P-value >0.5 between the groups TSCI + HBO and TSCI + ADMSCs at these time points. (D) By day 42: α versus other groups with different symbols (β, κ), P < 0.0001; β indicated the P-value >0.5 among the groups TSCI + HBO, TSCI + ADMSCs, and TSCI + ADMSCs at this time point. All statistical analyses were performed by one-way ANOVA, followed by Bonferroni multiple comparison post hoc test (n = 8–14 for each group). Symbols (‡, §, ¶) or (α, β, γ, κ) indicate significance (at 0.05 level). SC: sham-operated control; TSCI: traumatic spinal cord injury; HBO: hyperbaric oxygen; ADMSCs: adipose-derived mesenchymal stem cells; ANOVA: analysis of variance; BBB: Basso, Beattie, Bresnahan.
However, by day 7 after TSCI procedure as compared with groups 2 and 4, the BBB score was significantly higher in groups 3 and 5 but it showed no significant difference between groups 2 and 4 or between groups 3 and 5. In addition, by days 7 to 49 (ie, the end of study period), this parameter was still significantly and persistently higher in group 1 than that of those groups 2 to 5.
By days 14 to 49 after TSCI induction, the BBB score was significantly and persistently higher in groups 3 to 5 than in group 2, whereas this parameter did not differ between groups 3 and 4.
By days 14, 28, and 42 after TSCI induction, the BBB score showed no significant difference among groups 3 to 5. However, by days 35 and 49 after TSCI induction, this parameter was significantly increased in group 5 than in groups 3 and 4.
These findings implicated the attainment of a steady state of locomotor recovery after days 7 to 49 following TSCI procedure among groups 3, 4, and 5 animals as compared with group 2. In addition, the combined therapy was found to be better to either one alone for improvement of locomotor function after TSCI procedure at the end of study period. Our findings implicated that HBO-ADMSC therapy effectively improved locomotor recovery after TSCI procedure in rat.
The Spinal Cord Damaged Area by Day 49 After TSCI Procedure
Second, the microscopic finding of H&E stain revealed that the spinal cord damaged area (longitudinal sections) was significantly higher in group 2 than in other groups (P < 0.0001), significantly lower in group 1 than in groups 3, 4, and 5, significantly lower in group 5 than in groups 3 and 4, and significantly lower in group 3 than in group 4 (all P <0.001). Our findings suggested that HBO-ADMSC therapy remarkably preserved the integrity of spinal cord architecture after TSCI procedure in rat (Fig. 2).

The spinal cord damaged area by day 49 after TSCI procedure. (A to E) Illustrating the microscopic finding (10×) of H&E for identification of spinal cord injured area (red arrows) in longitudinal section. (F) Analytical result of spinal cord damaged area, * denotes statistical significance versus other groups with different symbols (†, ‡, §), P < 0.0001. All scale bars in lower right corner represent 1.0 mm. All statistical analyses were performed by one-way ANOVA, followed by Bonferroni multiple comparison post hoc test (n = 6 for each group). Symbols (*, †, ‡, §) indicate significance (at 0.05 level). SC: sham-operated control; TSCI: traumatic spinal cord injury; HBO: hyperbaric oxygen; ADMSCs: adipose-derived mesenchymal stem cells; ANOVA: analysis of variance; H&E: hematoxylin and eosin.
The Protein Expressions of Oxidative Stress and Upstream/Downstream Inflammatory Signalings in Spinal Cord Tissue by Day 49 After TSCI Procedure
To further elucidate the oxidative stress and inflammatory signaling pathways, the Western blot was utilized in the present study (Fig. 3). The result demonstrated that as compared with group 1 the protein expressions of NOX-1 and NOX-2, two inflammatory indicators, were significantly higher in group 2 that were significantly reversed in group 3, further significantly reversed in group 4, and furthermore significantly reversed in group 5 (all P-values <0.0001). In addition, the protein expressions of TLR-4, Mal, MyD88, TRAF6, IKK-α, IKK-β, NF-κB, IL-1β, TNF-α, and substance-p, 10 indices of up-stream and down-stream inflammatory signaling pathways, displayed an identical pattern of oxidative stress among the groups (all P-values <0.0001). The results of our findings supported that HBO-ADMSC therapy ameliorated oxidative stress and inflammatory reaction.

The protein levels of oxidative stress and upstream and downstream inflammatory signalings in spinal cord tissue by day 49 after TSCI procedure. (A) Protein expression of NOX-1, * versus other groups with different symbols (†, ‡, §), P < 0.0001. (B) Protein expression of NOX-2, * versus other groups with different symbols (†, ‡, §), P < 0.0001. (C) Protein expression of TLR-4, * versus other groups with different symbols (†, ‡, §, ¶), P < 0.0001. (D) Protein expression of myelin and lymphocyte protein (Mal), * versus other groups with different symbols (†, ‡, §), P < 0.0001. (E) Protein expression of Myeloid differentiation primary response 88 (MyD88), * versus other groups with different symbols (†, ‡, §), P < 0.0001. (F) Protein expression of TRAF6, * versus other groups with different symbols (†, ‡, §), P < 0.0001. (G) Protein expression of IKK-α, * versus other groups with different symbols (†, ‡, §, ¶), P < 0.0001. (H) Protein expression of IKK-β, * versus other groups with different symbols (†, ‡, §, ¶), P < 0.0001. (I) Protein expression of NF-κB, * versus other groups with different symbols (†, ‡, §), P < 0.0001. (J) Protein expression of IL-1β, * versus other groups with different symbols (†, ‡, §, ¶), P < 0.0001. (K) Protein expression of TNF-α, * versus other groups with different symbols (†, ‡, §), P < 0.0001. (L) Protein expression of substance-p, * versus other groups with different symbols (†, ‡, §, ¶), P < 0.0001. All statistical analyses were performed by one-way ANOVA, followed by Bonferroni multiple comparison post hoc test (n = 6 for each group). Symbols (*, †, ‡, §, ¶) indicate significance (at 0.05 level). SC: sham-operated control; TSCI: traumatic spinal cord injury; HBO: hyperbaric oxygen; ADMSCs: adipose-derived mesenchymal stem cells; TLR: toll-like receptor; TRAF6: tumor necrosis factor receptor associated factor 6; IKK: IκB kinase; NF: nuclear factor; IL: interleukin; TNF: tumor necrosis factor; ANOVA: analysis of variance.
The Protein Expressions of Cell-Stress Signaling and Voltage-Gated Sodium Channel in Spinal Cord Tissue by Day 49 After TSCI Procedure
We also utilized the Western blot to evaluate the cell-stress signaling in the current study (Fig. 4). As we expected, the protein expressions of PI3K, phosphorylated (p)-AKT, and p-mTOR, three indicators of cell-stress signaling, and the protein expressions of Nav1.3, Nav1.8, and Nav1.9, three indicators of the voltage-gated sodium channel, were significantly increased in group 2 than in other groups, significantly reduced in group 1 than in groups 3, 4, and 5, significantly reduced in group 5 than in groups 3 and 4, and significantly reduced in group 3 than in group 4 (all P-values <0.0001). Our findings implicated that HBO-ADMSC therapy notably downregulated the cell-stress signaling and voltage-gated sodium channel, that is, lowering the painful threshold.

Protein expressions of cell-stress signaling and voltage-gated sodium channel in spinal cord tissue by day 49 after TSCI procedure. (A) Protein expression of PI3K, * versus other groups with different symbols (†, ‡, §), P < 0.0001. (B) Protein expression of phosphorylated (p)-AKT, * versus other groups with different symbols (†, ‡, §, ¶), P < 0.0001. (C) Protein expression of p-mTOR, * versus other groups with different symbols (†, ‡, §, ¶), P < 0.0001. (D) Protein expression of Nav1.3, * versus other groups with different symbols (†, ‡, §), P < 0.0001. (E) Protein expression of Nav1.8, * versus other groups with different symbols (†, ‡, §), P < 0.0001. (F) Protein expression of Nav1.9, * versus other groups with different symbols (†, ‡, §), P < 0.0001. All statistical analyses were performed by one-way ANOVA, followed by Bonferroni multiple comparison post hoc test (n = 6 for each group). Symbols (*, †, ‡, §, ¶) indicate significance (at 0.05 level). SC: sham-operated control; TSCI: traumatic spinal cord injury; HBO: hyperbaric oxygen; ADMSCs: adipose-derived mesenchymal stem cells; ANOVA: analysis of variance.
The Cellular Levels of Inflammation in Spinal Cord Tissue by Day 49 After TSCI Procedure
Not only the protein level but also the cellular level of inflammation was determined in the present study (Fig. 5). The IF microscopic finding demonstrated that as compared with group 1, the cellular expressions of CD68 and GFAP, two indicators of inflammation, and cellular expression of γ-H2AX, an indicator of DNA-damaged biomarker, were significantly upregulated in group 2 (P < 0.0001). However, as compared with that of the group 2, these cellular parameters were significantly downregulated in group 4, further significantly downregulated in group 3, and furthermore significantly downregulated in group 5 (all P-values <0.001). Accordingly, the results supported that HBO-ADMSC therapy alleviated the cellular levels of inflammation and DNA-damage response.

Cellular levels of inflammation in spinal cord tissue by day 49 after TSCI procedure. (A to E) Illustrating the immunofluorescent (IF) microscopic finding (400×) for identification of CD68+ cell infiltration in spinal cord (red color). (F) Analytical result of percentage of CD68+ cells, * versus other groups with different symbols (†, ‡, §), P < 0.0001. (G to K) Illustrating the IF microscopic finding (400×) for identification of glial fibrillary acidic protein (GFAP)+ cell in spinal cord (green color). (L) Analytical result of fluorescent intensity of GFAP+ cells, * versus other groups with different symbols (†, ‡, §), P < 0.0001. (M to Q) Illustrating the IF microscopic finding (400×) for identification of cellular expression of γ-H2AX (red color). (R) Analytical result of percentage of γ-H2AX+ cells, * versus other groups with different symbols (†, ‡, §), P < 0.0001. All scale bars in lower right corner represent 20 µm. All statistical analyses were performed by one-way ANOVA, followed by Bonferroni multiple comparison post hoc test (n = 6 for each group). Symbols (*, †, ‡, §) indicate significance (at 0.05 level). SC: sham-operated control; TSCI: traumatic spinal cord injury; HBO: hyperbaric oxygen; ADMSCs: adipose-derived mesenchymal stem cells; ANOVA: analysis of variance.
The Cellular Expressions of Mitogen-Activated Protein Kinase (MAPK) Family Biomarkers in Spinal Cord Tissue by Day 49 After TSCI Procedure
The expressions of p-P38 (Fig. 6) and p-JNK (Fig. 7) in peripherin+ cells (ie, double staining) and p-ERK (Fig. 8) in NF200+ cells, three indicators of pain-facilitated cellular expressions, were significantly higher in group 2 than in other groups, significantly higher in group 4 than in groups 1, 3, and 5, significantly higher in group 3 than in groups 1 and 5, and significantly higher in group 5 than in group 1 (all P-values <0.001). Our findings, once again, supported that HBO-ADMSC therapy mitigated the pain threshold after TSCI induction.

Immunofluorescent (IF) microscopic finding of colocalization of p-P38 and peripherin in spinal cord neurons by day 49 after TSCI procedure. (A to E) Illustrating the IF microscopic finding (200×) of positively stained p-P38 in spinal cord neurons (red color spots). (F to J) Illustrating the IF microscopic finding (200×) of positively stained peripherin cells (green color). (K to O) Illustrating the IF microscopic finding (200×) of merged positively stained p-P38 and peripherin (green–red colocalization). (P) Analytical results of number of p-P38+/peripherin+ cells, * denotes statistical significance versus other groups with different symbols (†, ‡, §), P < 0.0001. All scale bars in lower right corner represent 20 µm. All statistical analyses were performed by one-way ANOVA, followed by Bonferroni multiple comparison post hoc test (n = 6 for each group). Symbols (*, †, ‡, §) indicate significance (at 0.05 level). SC: sham-operated control; TSCI: traumatic spinal cord injury; HBO: hyperbaric oxygen; ADMSCs: adipose-derived mesenchymal stem cells; ANOVA: analysis of variance.

Immunofluorescent (IF) microscopic finding of colocalization of p-JNK and peripherin in spinal cord neurons by day 49 after TSCI procedure. (A to E) Illustrating the IF microscopic finding (200×) of positively stained p-JNK in spinal cord neurons (red color spots). (F to J) Illustrating the IF microscopic finding (200×) of positively stained peripherin cells (green color). (K to O) Illustrating the IF microscopic finding (200×) of merged positively stained p-JNK and peripherin (green–red colocalization). (P) Analytical results of number of p-JNK+/peripherin+ cells, * denotes statistical significance versus other groups with different symbols (†, ‡, §), P < 0.0001. All scale bars in lower right corner represent 20 µm. All statistical analyses were performed by one-way ANOVA, followed by Bonferroni multiple comparison post hoc test (n = 6 for each group). Symbols (*, †, ‡, §) indicate significance (at 0.05 level). SC: sham-operated control; TSCI: traumatic spinal cord injury; HBO: hyperbaric oxygen; ADMSCs: adipose-derived mesenchymal stem cells; ANOVA: analysis of variance.
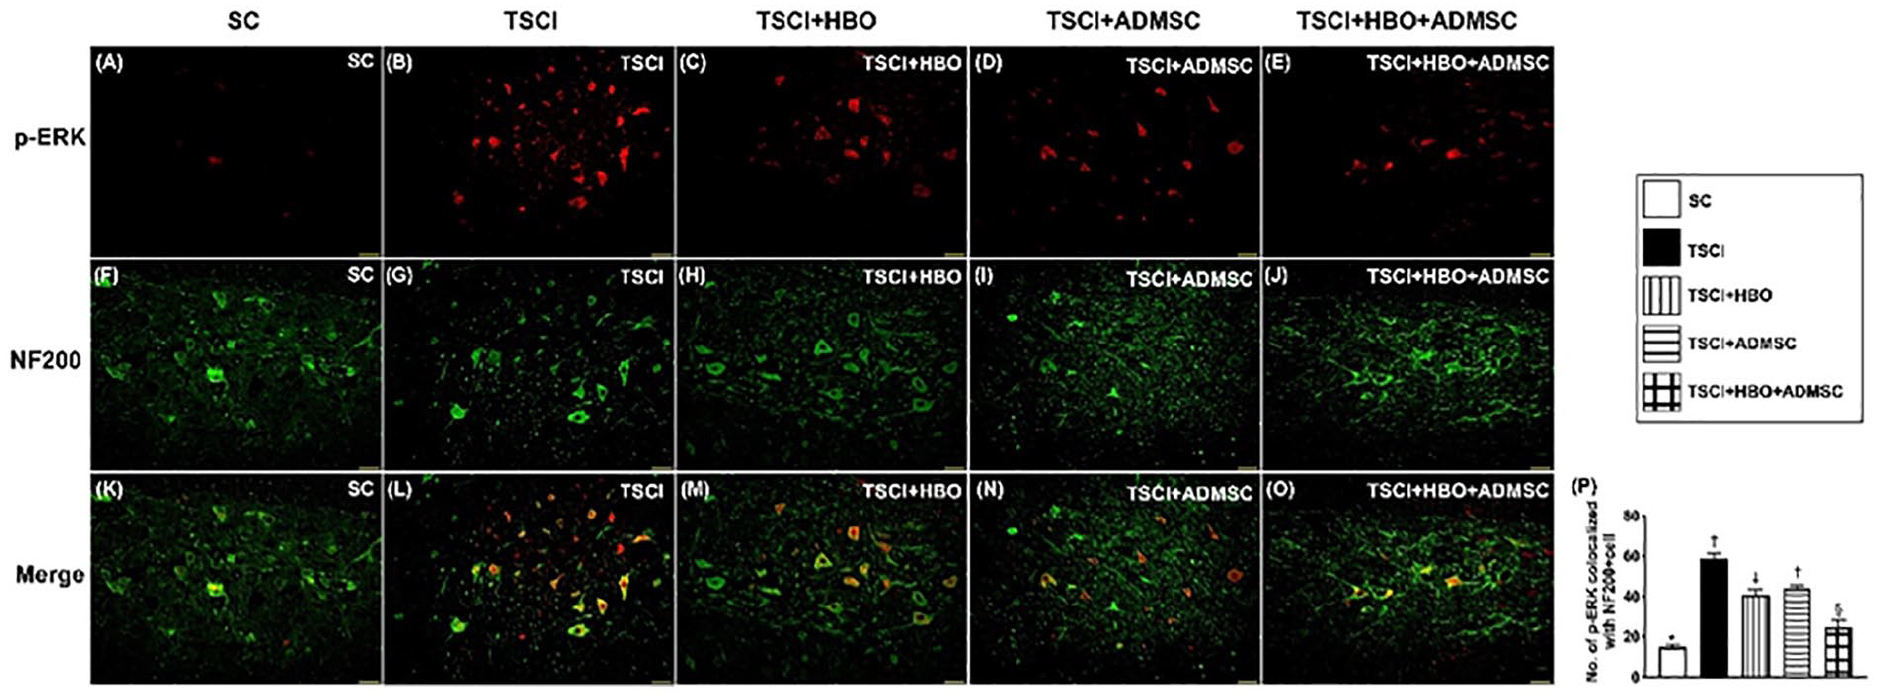
Immunofluorescent (IF) microscopic finding of colocalization of p-ERK and NF200 in spinal cord neurons by day 49 after TSCI procedure. (A to E) Illustrating the IF microscopic finding (200×) positively stained p-ERK in spinal neurons (red color spots). (F to J) Illustrating the IF microscopic finding (200×) positively stained NF200 cells (green color). (K to O) Illustrating the IF microscopic finding (200×) of merged positively stained p-ERK and NF200 (green–red colocalization). (P) Analytical results of number of p-ERK+/NF200+ cells, * denotes statistical significance versus other groups with different symbols (†, ‡, §), P < 0.0001. All scale bars in lower right corner represent 20 µm. All statistical analyses were performed by one-way ANOVA, followed by Bonferroni multiple comparison post hoc test (n = 6 for each group). Symbols (*, †, ‡, §) indicate significance (at 0.05 level). SC: sham-operated control; TSCI: traumatic spinal cord injury; HBO: hyperbaric oxygen; ADMSCs: adipose-derived mesenchymal stem cells; ANOVA: analysis of variance.
The Cellular Expressions of Voltage-Gated Sodium Channel in Spinal Cord Tissue by Day 49 After TSCI Procedure
It is well recognized that voltage-gated sodium channel plays an essential role for ectopic discharges or activities in response to stimulation/damage36,37. In the present study, we found that as compared with group 1 the expressions of Nav1.3 (Fig. 9), Nav1.8 (Fig. 10), and Nav1.9 (Fig. 11) colocalized with NF200+ cells, three indicators of voltage-gated sodium channel, were significantly higher in group 2. However, as compared with group 2 these cellular perturbations were significantly reversed in group 4, further significantly reversed in group 3, and furthermore significantly reversed in group 5 (all P-values <0.0001). The results of the present study, once more, support that HBO-ADMSC therapy might attenuate the pain threshold after TSCI induction.

Immunofluorescent (IF) microscopic finding of colocalization of Nav1.3 and NF200 in spinal cord neurons by day 49 after TSCI procedure. (A to E) Illustrating the IF microscopic finding (200×) positively stained Nav1.3 in spinal neurons (red color spots). (F to J) Illustrating the IF microscopic finding (200×) positively stained NF200 cells (green color). (K to O) Illustrating the IF microscopic finding (200×) of merged positively stained Nav1.3 and NF200 (green–red colocalization). (P) Analytical results of number of Nav1.3+/NF200+ cells, * denotes statistical significance versus other groups with different symbols (†, ‡, §), P < 0.0001. All scale bars in lower right corner represent 20 µm. All statistical analyses were performed by one-way ANOVA, followed by Bonferroni multiple comparison post hoc test (n = 6 for each group). Symbols (*, †, ‡, §) indicate significance (at 0.05 level). SC: sham-operated control; TSCI: traumatic spinal cord injury; HBO: hyperbaric oxygen; ADMSCs: adipose-derived mesenchymal stem cells; ANOVA: analysis of variance.

Immunofluorescent (IF) microscopic finding of colocalization of Nav1.8 and NF200 in spinal cord neurons by day 49 after TSCI procedure. (A to E) Illustrating the IF microscopic finding (200×) of positively stained Nav1.8 in spinal neurons (red color spots). (F to J) Illustrating the IF microscopic finding (200×) of positively stained NF200 cells (green color). (K to O) Illustrating the IF microscopic finding (200×) of merged positively stained Nav1.8 and NF200 (green–red colocalization). (P) Analytical results of number of Nav1.8+/NF200+ cells, * denotes statistical significance versus other groups with different symbols (†, ‡, §), P < 0.0001. All scale bars in lower right corner represent 20 µm. All statistical analyses were performed by one-way ANOVA, followed by Bonferroni multiple comparison post hoc test (n = 6 for each group). Symbols (*, †, ‡, §) indicate significance (at 0.05 level). SC: sham-operated control; TSCI: traumatic spinal cord injury; HBO: hyperbaric oxygen; ADMSC: adipose-derived mesenchymal stem cell; ANOVA: analysis of variance.

Immunofluorescent (IF) microscopic finding of colocalization of Nav1.9 and NF200 in spinal cord neurons by day 49 after TSCI procedure. (A to E) Illustrating the IF microscopic finding (200×) of positively stained Nav1.9 in spinal neurons (red color spots). (F to J) Illustrating the IF microscopic finding (200×) of positively stained NF200 cells (green color). (K to O) Illustrating the IF microscopic finding (200×) of merged positively stained Nav1.9 and NF200 (green–red colocalization). (P) Analytical results of number of Nav1.9+/NF200+ cells, * denotes statistical significance versus other groups with different symbols (†, ‡, §), P < 0.0001. All scale bars in lower right corner represent 20 µm. All statistical analyses were performed by one-way ANOVA, followed by Bonferroni multiple comparison post hoc test (n = 6 for each group). Symbols (*, †, ‡, §) indicate significance (at 0.05 level). SC: sham-operated control; TSCI: traumatic spinal cord injury; HBO: hyperbaric oxygen; ADMSC: adipose-derived mesenchymal stem cell; ANOVA: analysis of variance.
Discussion
This study which investigated the therapeutic impact of HBO-ADMSCs on protecting the locomotor function (ie, locomotor capacity) and architectural integrity of spinal cord yielded several striking implications. First, we successfully created an animal model of acute TSCI that was reproducible for different treatment strategies. Second, the underlying mechanism of how TSCI acting on damaging the spinal cord had been clearly delineated. Third, we proved that combined HBO-ADMSC therapy was superior to either HBO or ADMSCs for protecting the integrities of spinal cord architecture and locomotor function, suggesting the combined therapy offered a synergic effect.
The most important finding in the present study was that the locomotor capacity (ie, evaluated by BBB score) was significantly impaired in TSCI group than in SC counterpart. However, as compared with TSCI only, this parameter was remarkably recovered in TSCI animals after receiving HBO or ADMSCs and furthermore remarkably recovered in HBO-ADMSCs treatment, suggesting that combined HBO-ADMSCs offered additional benefits for the animals. When looking at the integrity of architecture of spinal cord undergoing the microscopic examination, we found that the anatomical structure of the spinal cord remarkably devastated in TSCI group than in SC group, while notably preserved in HBO- or ADMSC-treated and moreover in HBO-ADMSC–treated TSCI animals. This finding could, at least in part, explain why the locomotor function was significantly restored and the macro-anatomical structure of spinal cord was remarkably preserved in that of HBO-ADMSC–treated animals and highlight that this combined therapy may pose as a therapeutic potential for neuro-restoration in the TSCI patients, especially those who are refractory to conventional therapy. In view of the promising results in the present study and there still has no effective treatment for TSCI 10 as well as there still lacking data to address the impact of HBO-ADMSCs therapy for those disabled patients after TSCI, our findings may encourage to consider the utilization of HBO-ADMSCs therapy for these patients, especially for those patients who are refractory to all traditional management.
An association between organ damage and vigorous inflammatory reaction as well as generation of oxidative stress which in turn causes furthermore organ/tissue damage resulting in organ failure has been well investigated13,15–19. In the present study, we found that the cellular–molecular levels of inflammatory biomarkers were substantially increased in TSCI animals than in those of the SC animals. In this way, our findings were consistent with the findings of the previous studies13,15–19. Of distinctive finding was that HBO or ADMSC therapy markedly suppressed and combined these two regimens further markedly suppressed these molecular–cellular perturbations. Of particularly distinctive finding was that not only the successful treatment (ie, included the parameters of locomotor behavior and spinal cord architecture were restored) was identified, but also the upstream and downstream inflammatory signalings that participated in the spinal cord damage were clearly clarified in the present study (refer to Fig. 12). Accordingly, our finding highlights that the identified signaling pathway may be served as a useful reference when some medications will be considered as an accessory strategic management for those TSCI patients.

Schematic illustration of the underlying mechanism of signaling pathways activated after acute TSCI and the effective treatment of HBO-ADMSCs on protecting the neurological function via regulating these signaling pathway. TSCI: traumatic spinal cord injury; three signaling pathways: (1) cell-stress signaling, (2) pain-facilitated signaling, (3) oxidative stress signaling; HBO: hyperbaric oxygen; ADMSC: adipose-derived mesenchymal stem cell; TLR: toll-like receptor; TRAF6: tumor necrosis factor receptor associated factor 6; TNF: tumor necrosis factor; IKK: IκB kinase; NF: nuclear factor; IL: interleukin; GFAP: glial fibrillary acidic protein; MAPK: mitogen-activated protein kinase.
Cell-stress signaling is commonly elicited in setting of ischemia-reperfusion (IR) condition that has been identified to be strongly predictive of unfavorable outcome after organ IR injury 38 . An essential finding in the present study was that as compared with the SC group, the cell-stress signaling was remarkably upregulated in TSCI group (refer to Fig. 12). In this way, our finding was consistent with the finding of previous study 38 . Intriguingly, the expression of this signaling pathway was significantly downregulated by HBO or ADMSC therapy and further significantly downregulated by combining these two regimens. In this way, the results of our study opened up an innovative treatment for TSCI patients.
It is well recognized the protein and cellular levels of voltage-gated sodium channel 35 and those of members of MAPKs, such as p38, ERK, and JNK (ie, MAPK family) 39 , have all participated in the pain propagation and facilitation of pain sensation. A principal finding in the present study was that aforementioned parameters were notably increased in TSCI animals than in those of SC animals. The results of our and previous studies35,39 could explain why the majority of TSCI patients frequently encounter intractable pain in their lives. Of important finding in the present study was that those parameters of voltage-gated sodium channel and MAPK family in injured spinal cord were significantly attenuated by HBO or ADMSC therapy and further significantly attenuated by combined HBO-ADMSC treatment. Our findings could be considered as an alternative strategic management for those TSCI patients suffering intractable pain refractory to conventional management.
The readers would want to know what the primary cause of a better motor recovery in this study was. When we looked at Fig. 1 and Supplementary Table 1, we could find that the locomotor recovery occurred as early as at day 7 after TSCI induction. Accordingly, the underlying mechanism of neuromotor recovery in this setting of TSCI could be due to a consequence of neuroprotection, followed by neuro-regeneration and neuro-restoration processes.
Study Limitation
Despite the results were attractive and promising, our study has limitations. First, without stepwise titrating the dose of ADMSCs and the duration of HBO therapy, we did not know which dosage and duration were the most suitable for the animals. Second, the data showed that HBO therapy appeared to be better than that of the ADMSC therapy. However, perhaps the different duration of therapy might be one of the reasons to explain this phenomenon. Third, despite the locomotor function was notably improved by day 49, that is, the end of the study period, the long-term outcome of these strategic management remains uncertain. Finally, for the purpose of SCI tissues could be homogenously harvested for accurate molecular–cellular studies, the TSCI rather than that of the spinal cord contusion model was utilized in the present study, implicating that this might not be completely imitate the clinical setting of contusion SCI in patients.
In conclusion, the results of the present study demonstrated that HBO-ADMSC therapy effectively protected the spinal cord against acute TSCI in rodent.
Supplemental Material
sj-docx-1-cll-10.1177_09636897221133821 – Supplemental material for Synergic Effect of Combined Therapy of Hyperbaric Oxygen and Adipose-Derived Mesenchymal Stem Cells on Improving Locomotor Recovery After Acute Traumatic Spinal Cord Injury in Rat Mainly Through Downregulating Inflammatory and Cell-Stress Signalings
Supplemental material, sj-docx-1-cll-10.1177_09636897221133821 for Synergic Effect of Combined Therapy of Hyperbaric Oxygen and Adipose-Derived Mesenchymal Stem Cells on Improving Locomotor Recovery After Acute Traumatic Spinal Cord Injury in Rat Mainly Through Downregulating Inflammatory and Cell-Stress Signalings by Tsung-Cheng Yin, Pei-Lin Shao, Kuan-Hung Chen, Kun-Chen Lin, John Y. Chiang, Pei-Hsun Sung, Shun-Cheng Wu, Yi-Chen Li, Hon-Kan Yip and Mel S. Lee in Cell Transplantation
Footnotes
Author Contributions
Investigation, Tsung-Cheng Yin, Pei-Lin Shao, Kuan-Hung Chen, Kun-Chen Lin, John Y. Chiang, Pei-Hsun Sung, Shun-Cheng Wu, Yi-Chen Li, Yi-Chen Li, Hon-Kan Yip, and Mel S. Lee; Methodology, Tsung-Cheng Yin, Pei-Lin Shao, Kuan-Hung Chen, Kun-Chen Lin, John Y. Chiang, Pei-Hsun Sung, Shun-Cheng Wu, Yi-Chen Li, Yi-Chen Li, Hon-Kan Yip, and Mel S. Lee; Supervision, Tsung-Cheng Yin, Hon-Kan Yip, and Mel S. Lee; Writing—review & editing, Tsung-Cheng Yin, Hon-Kan Yip, and Mel S. Lee.
Availability of Data and Materials
The data that support the findings of this study are available from the corresponding authors upon reasonable request.
Ethical Approval
This study was approved by our institutional review board.
Statement of Human and Animal Rights
This article does not contain any studies with human or animal subjects.
Statement of Informed Consent
There are no human subjects in this article and informed consent is not applicable.
Ethics Approval and Consent to Participate
All animal experimental procedures were approved by the Institutional Animal Care and Use Committee at Kaohsiung Chang Gung Memorial Hospital (Affidavit of Approval of Animal Use Protocol No. 2019062504) and performed in accordance with the Guide for the Care and Use of Laboratory Animals, 8th edition (NIH publication No. 85-23, National Academy Press, Washington, DC, USA, revised 2011).
Declaration of Conflicting Interests
The author(s) declared no potential conflicts of interest with respect to the research, authorship, and/or publication of this article.
Funding
The author(s) disclosed receipt of the following financial support for the research, authorship, and/or publication of this article: This study was supported by a program grant from Chang Gung Memorial Hospital, Chang Gung University (Grant number: CMRPG8J0641).
Supplemental Material
Supplemental material for this article is available online.
References
Supplementary Material
Please find the following supplemental material available below.
For Open Access articles published under a Creative Commons License, all supplemental material carries the same license as the article it is associated with.
For non-Open Access articles published, all supplemental material carries a non-exclusive license, and permission requests for re-use of supplemental material or any part of supplemental material shall be sent directly to the copyright owner as specified in the copyright notice associated with the article.