
Abstract
Bisphosphonates (BPs) are widely used to treat several metabolic and oncological diseases affecting the skeletal system. Despite BPs’ well-known therapeutic potential, they also displayed important side effects, among which is BPs-related osteonecrosis of the jaw, by targeting osteoclast activities, osteoblast, and osteocyte behavior. The aim of this study is to evaluate the biological effects of zoledronic acid (ZOL) in an in vitro model of periodontal ligament stem cells (PDLSCs) by using an experimental setting that resembles the in vivo conditions. PDLSCs were treated with different concentrations of ZOL ranging from 0.1 to 5 μM. The effects of ZOL exposure were evaluated on cell viability via 3-[4,5-Dimethylthiaoly]-2,5-diphenyltetrazolium bromide (MTT), cell cycle analysis, apoptosis detection, and immunofluorescence. Quantitative real-time polymerase chain reaction (PCR), colorimetric detection of alkaline phosphatase activity, and Alizarin Red S staining were performed to investigate the osteogenic potential of PDLSCs exposed to ZOL. MTT analysis showed that the viability of PDLSCs exposed to ZOL concentration ≥1.5 μM for 3 and 6 days was significantly lower (P < 0.001) than that of untreated cells. The percentage of apoptotic cells was significantly higher in PDLSCs exposed for 4 days to ZOL at 2 μM (P < 0.01) and 5 μM (P < 0.001) when compared to the control. Moreover, ZOL treatment (3 days) accounted for alterations in cell cycle distribution, with an increase in the proportion of cells in G0/G1 phase and a reduction in the proportion of cells in S phase. Chronic exposure (longer than 7 days) of PDLSCs to ZOL accounted for the downregulation of ALP, RUNX2, and COL1 genes at all tested concentrations, which fit well with the reduced alkaline phosphatase activity reported after 7 and 14 days of treatment. Reduced Col1 deposition in the extracellular matrix was reported after 14 days of treatment. Increased calcium deposits were observed in treated cells when compared to the control cultures. In conclusion, chronic exposure to 1 μM ZOL induced significant reduction of osteogenic differentiation, while ZOL concentrations ≥1.5 μM are required to impair PDLSCs viability and induce apoptosis.
Introduction
Bisphosphonates (BPs) are a class of drugs developed to treat several metabolic and oncological diseases affecting the skeletal system, such as osteoporosis, osteogenesis imperfecta, Paget’s disease, and bone involvement in hematological or solid malignancies 1 . The pharmacological activity of BPs is due to their high affinity for calcium crystals, which allows them to bind to hydroxyapatite and inhibits osteoclast-mediated bone resorption. On the basis of structure and molecular mechanism of action, the BPs can be classified into simple and nitrogen-containing BPs (N-BPs) 2 . N-BPs are more potent in their antiresorptive capabilities than non-N-BPs. The mechanisms by which non-N-BP and N-BP exert their effects on osteoclast appear different. Non-N-BPs, considered as first-generation BPs, are incorporated by osteoclast from the bone surface during physiological remodeling. Following the uptake, non-N-BPs induce the formation of a novel ATP analog (1-adenosin-5′-yl ester 3-(3-methylbut-3-enyl) ester triphosphoric acid; ApppI) which is nonhydrolyzable, accounting for the depletion of energy and cell apoptosis 3 . On the contrary N-BPs, further classified into second- and third-generation BPs (alkyl-amino and heterocyclic N-BPs, respectively) 4 , act by inhibiting farnesyl pyrophosphate synthase (FPPS), a key regulatory enzyme in the mevalonic acid pathway 3,5 . In addition, inhibition of FPPS generates the accumulation of isopentenyl pyrophosphate (IPP), the metabolite upstream of FPPS, which accounts for a transient inflammatory acute phase response. Moreover, osteoclast can function as antigen-presenting cells, able to activate both cluster of differentiation (CD)4+ and CD8+ T cells 6 . BPs inhibit bone resorption by also preventing osteoclast formation and activation 7 .
Despite BPs’ well-known therapeutic potential, they also display important side effects. In particular, prolonged exposure to BPs seems to predispose to the development of side effects affecting bone, such as BPs-related osteonecrosis of the jaw (BRONJ) and atypical femoral fractures 8,9 . Although the pathogenesis of these conditions are far to be clarified, in both cases the alteration of the physiological bone remodeling process is evident. BRONJ, first described in 2003 by Marx, was soon recognized as a multifactorial disease 10 . Antiangiogenic action of BP, inflammation, genetic predisposition, and immune status have been recognized as favoring factors for the development of BRONJ 11 . In an elegant paper, Otto S. et al reported a clear classification of risk factors involved in the development of BRONJ 12 . Risk factors have been classified into three groups. The first group includes the type of BPs (potency) and the administration route. In particular, N-BPs display a stronger association with BRONJ than non-N-BPs, and intravenous administration appears more frequently associated to BRONJ than oral administration 12 . The drug concentration and frequency exposure result important, as well. In particular, zoledronic acid (ZOL; approved in the USA for clinical use in 2001) is the N-BP with the most potent antibone-resorptive effect, but is associated with higher prevalence of BRONJ 13,14 . The second group of risk factors includes systemic risk factors, such as the specific pathological conditions that require BP treatment and potential co-medications. Finally, many local risk factors have been associated to BRONJ development. Among them, mechanical trauma and inflammation have been recognized as the most common triggering factors 12,15 . It has been years since our group is interested in the development of new strategies aimed to achieve advance in BRONJ treatment 16 –18 .
Although BPs primarily target osteoclasts activity to inhibit bone resorption, a direct action on osteoblast and osteocyte as well as fibroblast and epithelial cells has also been demonstrated 19 –25 . Conversely, the action of BPs on the mesenchymal stem cells (MSCs) appears to be poorly investigated. Oral cavity harbors several sources of MSCs, which display interesting reparative and regenerative potential according to their embryological derivation and location, i.e., where the specific MSC populations reside. Among them, periodontal ligament stem cells (PDLSCs) play a key role in the continuous regeneration of PDL during both physiological and pathological conditions. Moreover, in comparison with other oral MSCs, PDLSCs display the potential to regenerate cementum and alveolar bone more readily 26 . Given the fact that the blockade of MSCs’ renewal-and-repair processes is required for the development of necrosis in BRONJ, the aim of our work is to evaluate the biological effects of different concentrations of ZOL in an in vitro model of PDLSCs, focusing the attention on cell renewal, vitality, and osteogenic potential.
Material and Methods
Samples and Cell Culture
The study was conducted according to the Declaration of Helsinki on medical protocol and ethics after the approval of the regional Ethical Review Board of Central Calabria (reference for Magna Graecia University of Catanzaro). After the surgical extraction, five impacted third molars were collected from five patients aged 19–25 years (mean age = 22.7 years) recruited at the Unit of Oral Surgery—Academic Hospital of Magna Graecia University of Catanzaro. PDL was collected as previously reported 27 . Briefly, small pieces of tissue were digested using 2 mg/mL collagenase type I solution (no. 17018029; Gibco, Life Technologies, Milan, Italy) for 2 h at 37°C and PDLSCs were seeded into a 6-multiwell plate (Eppendorf, Milan, Italy) with Dulbecco’s Modified Eagle Medium (DMEM) (no. D57961; Sigma Aldrich, Milan, Italy) supplemented with 10% fetal bovine serum (no. 10270106; Life Technologies, Milan, Italy), 100 U/mL penicillin (P4333, Sigma, Milan, Italy), and 100 μmol/mL streptomycin (no. P4333; Sigma Aldrich). When the cell cultures reached 80%–90% confluency between 7 and 14 days, the PDLSCs were subcultivated as the first-cell passage in MesenPRO RS Medium (no. 12746012; Gibco, Life Technologies). The cells were seeded at 4,000 cell/cm2. When the cells became 80%–90% confluent, they were subcultured and used for subsequent analyses between four and six passages. For each experiment, cells derived from at least three different individuals were used.
Pharmacological Treatment
For all the experiments, PDLSCs were seeded at 4,000 cell/cm2 in MesenPro RS Medium added with ZOL (PHR1893, Sigma, Milan, Italy) dissolved in NaOH (S5881, Sigma, Milan, Italy) 0.1N. Cells cultivated in the absence of the drug were used as control. The ZOL concentration range chosen for this study was based on the literature and, above all, on the lack of information about the drug concentration in the alveolar bone. We tested the effects of ZOL between 0.1 and 100 μM. The observation of the maximum cytotoxic effect at 5 μM allowed us to set up 5 μM as the high concentration in our study.
3-[4,5-Dimethylthiaoly]-2,5-diphenyltetrazolium bromide (MTT) Assay
The MTT method was applied to test the sensitivity of PDLSCs to ZOL as previously reported with some adjustments 27 . Briefly, cells (2 × 10³) were seeded into 96-well plates (Eppendorf, Milan, Italy) with 100 µL culture medium per well. Each drug concentration was tested on 16 wells. After 3 and 6 days of treatment, 10 µL MTT solution (M2128, Sigma, Milan, Italy) (2.5 mg/mL) was added to each well. Plates were incubated at 37°C for 3 h and then the supernatant was removed. Formazan crystals were solubilized by adding 0.08N HCl (H1758, Sigma, Milan, Italy) in isopropanol (I9516, Sigma, Milan, Italy) for 30 min at 37°C. The absorbance was measured at 595 nm using a microplate reader (iMark, Bio-Rad Laboratories, Milan, Italy). Values obtained in the absence of cells were considered as control.
Cell Cycle Analysis
The effect of ZOL on cell cycle distribution was evaluated after 3 days of treatment. About 5 × 10⁵ PDLSCs were collected and treated as previously reported. Briefly, cells were drop-wise fixed by adding 1 mL of 70% ethanol (51976, Sigma, milan, Italy) with gentle vortex mixing. The cell suspension was kept at 4°C for 30 min and then washed with cold PBS three times. Successively, cells were stained using 50 μg/mL propidium iodide (PI; Sigma, Milan, Italy) and 50 μg/mL DNase-free RNase A (Sigma) dissolved in 0.5 mL phosphate-buffered saline (PBS, 10010056, Life technologies, Monza, Italy) at room temperature for 15 min. Cell fluorescence was assessed using a BD FACSCanto II cytometer (Becton-Dickinson). For each sample, 30,000 events were recorded. The percentage of cells in each phase of the cell cycle was determined using Flowjo Software (Becton-Dickinson, Milan, Italy).
Apoptosis and Necrosis
Apoptosis of PDLSCs was quantified using the fluorescein isothiocyanate (FITC) Annexin V/Dead Cell Apoptosis Kit (no. V13242; Life Technologies), according to the manufacturer’s instructions. Briefly, after 4 days of exposure to different concentrations of ZOL (0.1–5 µM), 5 × 10⁵ cells were washed with cold PBS, resuspended in 100 µL annexin-V binding-buffer 1X (V13242, Life Technologies, Monza, Italy) and stained with 5 µL annexin-V-FITC and 1µL PI (100 μg/mL) for 15 min in the dark at room temperature. Subsequently, samples were diluted with 400 µL of annexin-V binding-buffer 1X and were analyzed using BD FACSCanto II cytometer. Flowjo software version 8.8.6 was used to determine the percentage of apoptotic cells. The amount of early apoptosis, late apoptosis, and necrosis was evaluated as the percentage of annexin-V+/PI−, annexin-V+/PI+, and annexin-V−/PI+ cells, respectively.
Flow Cytometric Characterization of PDLSCs
Immunophenotyping of PDLSCs was performed as described by Di Vito et al. (2019) 28 . Briefly, after 5 days of treatment, 1 × 10⁵ cells were washed twice in PBS and then stained with anti-CD14-PE (clone M5E2; Becton-Dickinson, Franklin Lakes, NY, USA), anti-CD34-phycoerythrin (PE) (clone AC136; Miltenyi Biotec, Bergisch Gladbach, Germany), anti-CD45-PE (clone 5B1; Miltenyi Biotec), anti-CD105-FITC (clone 43A4E1, Miltenyi Biotec), anti-CD73-PE (clone AD2; Miltenyi Biotec), and anti-CD90-PE (clone DG3; Miltenyi Biotec) in the dark for 30 min at 4°C. After incubation, the cells were washed twice with PBS. Fluorescence intensity was measured using BD FACSCanto II flow cytometry. The data were analyzed with Flowjo software version 8.8.6 and the forward and side scatter profile gated out debris and dead cells.
Immunofluorescence Analysis
Immunofluorescence was performed as previously described with some improvements 29 . PDLSCs were treated with ZOL for 72 h for phalloidin and vimentin (M0725, Agilent Technologies, California, US) staining, and for 7 and 14 days for collagen 1 (COL1) staining. The cells were washed with PBS1X twice and then fixed with 0.3% gluteraldeyde (G5882, Sigma, Milan, Italy) for 10 min. PDLSCs were then treated with 0.1% Triton X-100 (T8787, Sigma, Milan, Italy) at room temperature for 5 min and then with 1% bovine serum albumin (BSA, 05470, Sigma, Milan, Italy) for 30 min in order to block the nonspecific binding sites. For actin staining, Alexa Fluor-546-conjugated phalloidin (A22283, Life Technologies, Monza, Italy) 1% BSA was added to stain the cells for 30 min at room temperature. PDLSCs were washed twice with PBS1X and counterstained with 4',6-Diamidino-2-Phenylindole (DAPI) (200 ng/mL; Sigma) for 10 min.
Treated and untreated cells were incubated with either anti-COL1 (no. ab34710; 1:500, rabbit; Abcam, Cambridge, UK) or anti-vimentin (no. 347 M; clone V9, ready to use, mouse; Sigma) for 16 h (4°C) and 1 h (room temperature), respectively, and then with FITC-conjugated anti-rabbit or FITC-conjugated anti-mouse (1:400; Life Technologies) for 60 min at room temperature. The cells were counterstained with DAPI.
All the samples were mounted using a fluorescent mounting medium. Images were acquired at ×63 oil immersion with an SP8 Leica confocal laser-scanning microscope (Leica Microsystems, Milan, Italy).
Osteogenic Differentiation
The PDLSCs were cultured in MesenPro RS Medium until passage 4. Then, the cells were plated at a density of 4,000 cell/cm2 for histological and molecular analysis. The next day, the media were replaced with osteogenic differentiation medium (no. A1007201; StemPro Osteogenesis Differentiation Kit, Life Technologies) added with ZOL at different concentrations. The medium was replaced every 4 days. For long-term cultivation (31 days), ZOL treatment was interrupted after the first 2 weeks of osteogenesis, due to the high drug toxicity.
Quantitative Real-Time Polymerase Chain Reaction (PCR)
After 3, 7, and 10 days of differentiation, untreated and ZOL-treated cells were rinsed with PBS, and total cellular ribonucleic acid (RNA) was extracted using TRIzol reagent (Life Technologies) according to the manufacturer’s instructions. The purity and the integrity check of each RNA sample, the reverse transcription of RNA, and Quantitative real-time PCR (q-RT-PCR) were performed as previously reported 30 . Briefly, complementary DNA (cDNA) was synthesized from 1 µg of RNA using a reverse transcriptase system kit (no. 4368814; Thermo Fisher Scientific, Milan, Italy). q-RT-PCR was performed using SYBR Green Universal PCR Master Mix (no. 4368706; Life Technologies). The reactions were performed in triplicate and analyzed using the ▵▵Ct method with glyceraldehyde-3-phosphate dehydrogenase (GAPDH) as a normalization control. Primer sets used in this study are reported in Table 1.
Primers Used for q-RT-PCR Analysis.

ALP: alkaline phosphatase; COL1: collagen type I; OCN: osteocalcin; q-RT-PCR: quantitative real-time PCR; RUNX2: runt-related transcription factor 2.
Colorimetric Detection of Alkaline Phosphatase (ALP) Activity
After 7 and 14 days of induction, untreated and ZOL-treated cells grown in 12-well plates were washed twice with PBS and then fixed with 10% formalin (F8775, Sigma, Milan, Italy) for 10 min. After fixation, the cells were washed twice with PBS and stained with 5-bromo-4-chloro-3-indolyl phosphate (BCIP) and nitro blue tetrazolium (NBT; no. B3804; Sigma Aldrich, Sigma, Milan, Italy) for 30 min and then washed twice with distilled water. All procedures were performed at room temperature.
Alizarin Red S Staining
Osteogenic differentiation and maturation of MSCs were assessed by Alizarin Red staining 31 . After 31 days of osteo-induction, untreated and ZOL-treated cells grown in 12-well plates were washed twice with PBS and then fixed with 10% formalin for 10 min. After fixation, the cells were washed twice with PBS and stained with 2% solution of Alizarin Red S (red color; no. A5533; Sigma Aldrich), pH 7.2, for 30 min, and then the cellular matrices were washed with distilled water. All procedures were performed at room temperature.
Statistical Analysis
All the experiments were performed at least three times. Descriptive data are summarized as the mean ± standard error of the mean (SEM). The statistical analysis was performed by a Student’s t test. In each analysis, a P value of <0.05 was considered to be statistically significant.
Results
Cell Viability
MTT analysis showed that the viability of PDLSCs exposed to ZOL concentration ≥1.5 μM for 3 and 6 days was significantly lower (P < 0.001) than that of untreated cells. No effects were reported in PDLSCs treated for 3 days with lowest drug concentration (0.1 and 1 μM) with respect to the control group (Fig. 1A).

Effects of ZOL on the viability and cell cycle distribution of PDLSCs. MTT analysis of PDLSCs at 3 and 6 days of exposure (A). Flow cytometry analyses of PDLSCs upon 3 days of drug treatment. Representative plots of cells in G1, S, and G2 cell cycle phases are shown. Histogram representative of four independent experiments shows percentage of cells in the different cell cycle phases in the presence or absence of ZOL (B). Representative dot plots of dose-dependent apoptosis increase in PDLSCs after dose escalation of ZOL evaluated with annexin-V/PI assay after 4 days, data analysis are shown in the histogram (C). Representative images of phalloidin staining highlighting F-actin rearrangement after 3 days of treatment; please note the presence of blebs (arrowheads) in cells exposed to 2 μM ZOL as well as the loss of actin stress fibers (asterisks) in cells treated with 5 μM ZOL. Nuclei are indicated in blue. Images were collected using Leica TCS SP8 confocal microscopy system (63×; D). Each assay was performed at least three times on biological replicates. Data are presented as the mean. For statistical analysis, Student’s t test was applied. *, P < 0.05; **/b, P < 0.01; ***/c, P < 0.001; DIV: days in vitro; PDLSCs: periodontal ligament stem cells; PI: propidium iodide; ZOL: zoledronic acid.
Detection of Cell Cycle Arrest
In order to evaluate the effect of ZOL on cell cycle progression of PDLSCs, fluorescence-activated cell sorting (FACS) analysis was applied to describe the distribution of cells in the phases of cell cycle. Cells were treated with increasing concentrations of ZOL for 3 days. Untreated cells showed a distribution in the phases of cell cycle typical for proliferating cells, with an average of 54.2% of cells in G0/G1 phase, 41.65% of cells in S phase, and 2.2% of cells in G2/M phase (Fig. 1B). ZOL treatment accounted for dose-dependent alterations in cell cycle distribution, with a significant induction of cytostasis. Its effects started at the concentration of 3 μM, with an increase in the proportion of cells in G0/G1 phase (+27%, P < 0.05 at 3 μM and +31%, P < 0.001 at 5 μM) and a decrease in the proportion of cells in S phase (–44%, P < 0.05 at 3 μM and –39%, P < 0.01 at 5 μM; Fig. 1B).
Detection of Apoptosis
The extent of apoptotic cascade activation was evaluated in PDLSCs exposed to 1, 1.5, 2, and 5 μM ZOL for 4 days. A moderate but significant reduction of cell viability was observed after exposure to 2 μM ZOL (–15%; P < 0.01) that reached its peak after exposure to ZOL at 5 μM (–86%; P < 0.001) when compared to control group. The population of necrotic cells (annexin-V-negative, PI-positive cells) in the ZOL group was similar (P > 0.05) to the control. Conversely, percentage of apoptotic cells (early and end stages) was significantly higher in PDLSCs exposed to ZOL at 2 μM (+101.6%; P < 0.01) and 5 μM (+857.7%; P < 0.001) when compared to control (Fig. 1C).
Apoptosis activation was also confirmed via confocal microscopy. Phalloidin labeling in PDLSCs exposed to the highest ZOL concentrations (2 μM and 5 μM) highlighted strong rearrangements of filamentous actin. In particular, treated cells appeared partially detached from the substrate and round-shaped, actin microfilament became thinner, tense, and disordered. Moreover, the loss of actin stress fibers and formation of membrane protrusions, known as blebs, have also been observed (Fig. 1D).
PDLSCs Exposed to ZOL Express MSCs Surface Markers
The expression profile of typical positive (CD73, CD90, and CD105) and negative (CD14, CD34, and CD45) MSCs markers for PDLSCs exposed to ZOL was assessed. FACS analysis demonstrated that PDLSCs exposed to different drug concentrations still showed positive expression for the mesenchymal markers and negative expression for hematopoietic (CD34 and CD45) and monocyte markers (CD14; positive rate <2%; data not shown), confirming MSCs characteristics. Nevertheless, exposure of PDLSCs to ZOL 5 μM accounted for very strong increase (+165.66%) and moderate decrease (–47.31%) of mean intensity for CD73 and CD105, respectively, with respect to untreated cells (Fig. 2A). Interestingly, exposure of cells to the highest concentration (5 μM) also accounted for a moderate but significant decrease (–43.62%; P < 0.001) of CD105-positive cells when compared to untreated cells (Fig. 2A). No alterations were reported for CD90 expression levels in all experimental conditions.
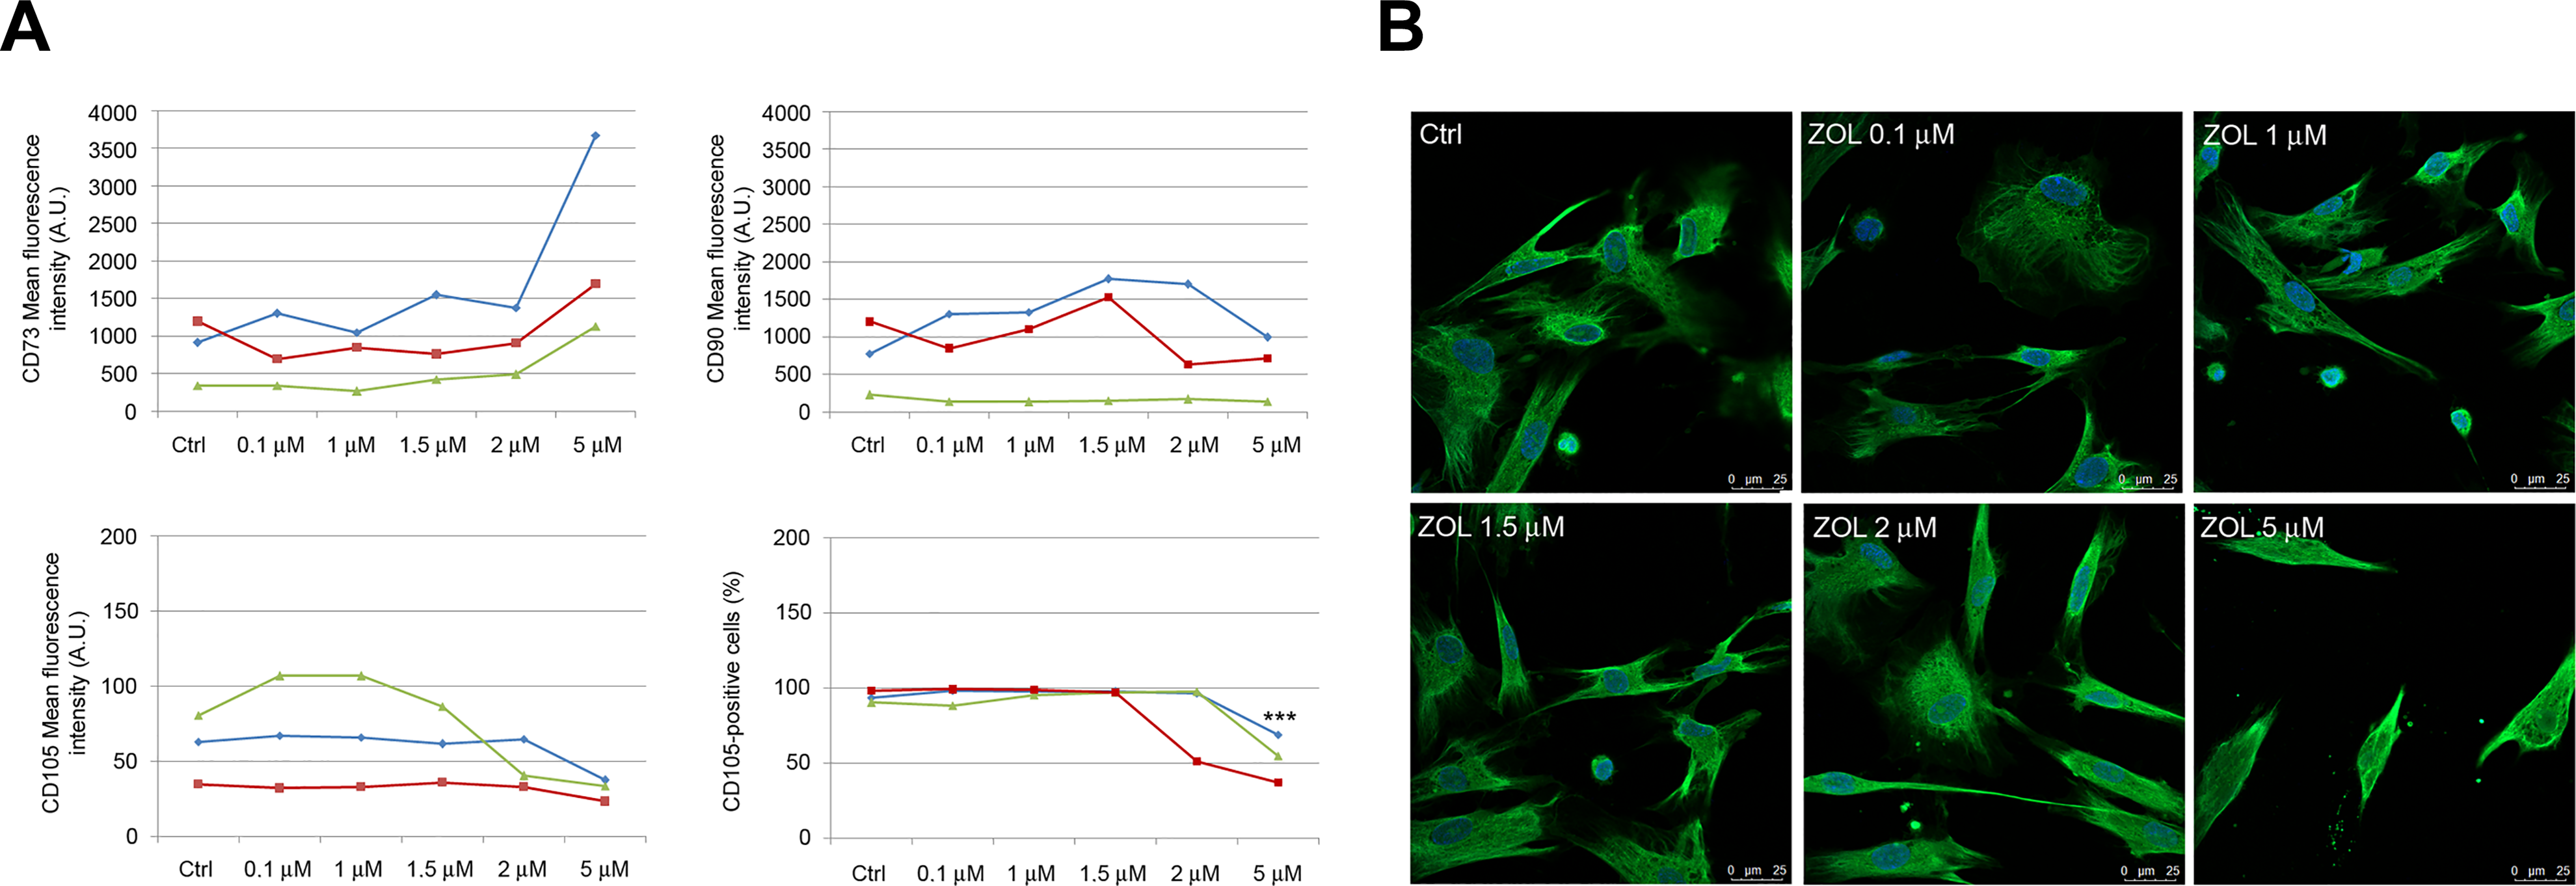
Immunophenotypic profile of PDLSCs after 5 days exposure to ZOL. Flow cytometry analysis showed mean fluorescence intensity of CD73, CD90, and CD105 (data obtained from three patients are reported, indicated as blue, red, and green lines) after dose escalation of ZOL. Please note that a significant reduction of the percentage of CD105-positive cells was only reported after exposure to 5 μM ZOL (A). Representative images of immunofluorescence analysis of vimentin in PDLSCs untreated and treated with ZOL. Nuclei are indicated in blue. Images were collected using Leica TCS SP8 confocal microscopy system (63×; B). Each assay was performed at least three times on biological replicates. Data are presented as the mean. For statistical analysis, Student’s t test was applied. ***, P < 0.001. PDLSC: periodontal ligament stem cell; ZOL: zoledronic acid.
Immunofluorescence analysis indicated the preservation of mesenchymal phenotype in ZOL-treated cells, as confirmed by the high vimentin expression reported after exposure to the highest drug concentration (Fig. 2B).
Osteogenic Differentiation Assessment
The extent of osteogenic differentiation of PDLSCs in treated and untreated cultures was evaluated using q-RT-PCR, immunofluorescence for Col1, BCIP/NBT substrate, and Alizarin Red S staining (Fig. 3A). q-RT-PCR was directed to the evaluation of the expression levels of osteocalcin (OCN), runt-related transcription factor 2 (RUNX2), ALP, and collagen type I (COL1). Exposure (3, 7, and 10 days) of PDLSCs to increasing concentration of ZOL (1, 1.5, and 2 μM) accounted for gradual downregulation of messenger RNA (mRNA) expression level for ALP and COL1 (Fig. 3B, D). Similarly, long-term exposure (10 days) to increasing concentration of ZOL accounted for gradual downregulation of mRNA expression level for RUNX2. Conversely, no significant alteration was reported in the mRNA expression level for OCN in PDLSCs exposed to ZOL when compared to the untreated cells (Fig. 3F). A dose-dependent reduction of ALP activity was reported in PDLSCs treated with 1, 1.5, and 2 μM ZOL after 7 and 14 days of exposure (Fig. 3C). Qualitative immunofluorescence analysis was also conducted in order to confirm the inhibitory effect of ZOL toward the Col1 expression. Evident alterations occurred after 14 days of osteogenic differentiation in the presence of the drug, where an evident upregulation of Col1 was observed at the low concentrations of ZOL (1 and 1.5 μM), as compared to the same samples on day 7. The same tendency was observed for Col1 gene expression after 10 days of culture (Fig. 3D), as compared to the 1 μM ZOL and 1.5 μM ZOL samples on day 7. As for 2 μM ZOL condition, no changes were observed in the extracellular Col1 expression up to 14 days of culture (Fig. 3E). In order to analyze the formation of mineralized nodules in PDLSCs exposed to ZOL, we performed drug treatment for 14 days in osteo-inductive conditions; after the first 2 weeks of osteogenic differentiation, the drug was removed in order to prevent the death of all of the cells at the highest drug concentration. Nevertheless, treated and untreated PDLSCs grew in osteogenic medium for further 17 days. During differentiation protocol, control PDLSCs continued to proliferate and undergo several rounds of division until they became confluent. Conversely, PDLSCs exposed to ZOL undergo cell cycle arrest and/or apoptosis, as confirmed by the reduced cell number and the altered phenotype (Fig. 3G). When stained with Alizarin Red, after 31 days of osteogenic induction, moderate calcium deposition was detected in untreated PDLSCs. Treated PDLSCs showed increased Alizarin-stained calcium deposits when compared to the control cultures (Fig. 3G).

Osteogenic differentiation of PDLSCs after chronic exposure to ZOL. Figure shows the schema of the experimental setup (A). Relative mRNA expression level of ALP at DIV3, DIV7, and DIV10 was normalized to GAPDH and displayed as fold increase or decrease respect to untreated cells at DIV3. Please note the upregulation of ALP mRNA in untreated cells during osteogenic differentiation (B). ALP activity was qualitatively evaluated after 7 and 14 days of osteo-induction (C). Relative mRNA expression level of COL1 at DIV3, DIV7, and DIV10 was normalized to GAPDH and displayed as fold increase or decrease respect to untreated cells at DIV3. Please note the upregulation of COL1 mRNA in untreated cells during osteogenic differentiation (D). Representative images of immunofluorescence analysis of Col1 in PDLSCs untreated and treated with ZOL for 7 and 14 days. Nuclei are indicated in blue. Arrows indicate Col1 deposits in extracellular space. Images were collected using Leica TCS SP8 confocal microscopy system (63×; E). Relative mRNA expression levels of RUNX2 and OCN in PDLSCs after differentiation culture for 10 days (F). Detection of the osteogenic differentiation of PDLSCs by Alizarin Red S (G) staining after 31 days of osteo-induction. Arrows indicate calcium deposits. Each assay was performed at least three times on biological replicates. Data are presented as the mean. For statistical analysis, Student’s t test was applied. *, P < 0.05; **, P < 0.01; ***, P < 0.001. ALP: alkaline phosphatase; COL1: collagen type 1; DIV: days in vitro; OCN: osteocalcin; PDLSC: periodontal ligament stem cell; RUNX2: runt-related transcription factor 2; ZOL: zoledronic acid.
Discussion
In this work, we investigated the action of different concentrations of ZOL on the survival, mesenchymal phenotype, and osteogenic potential of PDLSCs. Without a doubt, the goal of similar research is to clarify the effects of the drug in experimental settings that resemble very well the in vivo conditions. Unfortunately, as pointed out by many authors, the determination of ZOL concentration in patient alveolar bone is very difficult. Chen et al. recognized ZOL concentrations ≥1 μM as local drug concentrations in dental alveolar socket, where bone remodeling is very high 32 . Given the lack of univocal data on ZOL accumulation in periodontal space and alveolar bone, we preliminary tested a wide range of concentration of ZOL (0.1 × 10⁻⁶ to 1 × 10⁻⁴ M) on cell viability and evaluated the effects after 3 and 6 days of treatment. The observation of the maximum cytotoxic effect at 5 μM after 3 days of treatment allowed us to set up 5 μM as the higher concentration for the subsequent experiments in our study.
In the last decade, some authors provided us with interesting data about the action of ZOL on proliferation capability and survival of human pre-osteoblast, oral fibroblast, and epithelial cells, as well as osteoclast and bone marrow stem cells-derived osteoblast 33 –35 . Nevertheless, the action of ZOL on PDLSCs has been poorly investigated. We reported that 0.1 and 1 μM ZOL did not significantly decrease cell viability. The cell viability decreased significantly when the PDLSCs were exposed to ZOL concentration ≥1.5 μM for 3 and 6 days. Interestingly, such result well fits with the observation that nanomolar concentration of ZOL did not impair cell viability of pre-osteoblasts as well as periodontal fibroblast, while higher concentration accounted for strong cytotoxic action 33,36 –38 . In order to clarify if the reduced cell population was the consequence of cytotoxic effects of ZOL, we evaluated the apoptotic events in PDLSCs exposed to ZOL for 4 days. The strong increase of apoptotic cell percentage in cultures treated with 2 and 5 μM ZOL confirmed the induction of apoptotic death. In particular, we observed an increase in both early and late apoptosis, with the latter becoming more evident at the higher ZOL concentration. ZOL treatment also accounted for a concomitant induction of cell cycle arrest in the G0/G1 phase. Similar data well fit with previous observations, where ZOL selectively induced cytostasis and/or cell death in the precursor population of human osteoblast-like cells 39 . Moreover, Huang et al. showed that ZOL induces G0/G1 arrest in osteoblasts by increasing the expressions of cyclin-dependent kinase (CDK) inhibitors p21 and p27 40 . The general mechanism by which ZOL accounted for cell death has been largely described; however, the specific signaling pathways were not yet clarified 3,5 . Briefly, following NBPs incorporation into osteoclast, the inhibition of protein isoprenylation accounts for the disruption of cellular process such as stress fiber assembly and membrane ruffling, resulting in cell apoptosis. Accordingly, we also showed that ZOL treatment caused cell morphological changes via F-actin rearrangement. We found that after exposing the cells to ZOL concentration ≥1.5 μM for 3 days, actin microfilament became thinner, tense, and disordered, confirming apoptosis activation. Interestingly, also in this case, a dose-dependent action of ZOL appeared evident. Although the pro-apoptotic action of ZOL in PDLSCs has been scarcely described, dose-dependent effects of such a drug have been described 36,41 . In particular, Agis et al. reported that concentrations of free ZOL lower than 30 µM failed to cause cytotoxic effects in PDL fibroblasts. Tanaka et al. reported that ZOL at 1 μM was not toxic to periodontal ligament, while at 10 μM it significantly reduced cell viability. Furthermore, the intracellular pro-apoptotic pathway activated in response to ZOL exposure is still unknown. Previous studies suggested the involvement of reactive oxygen species (ROS) and glycogen synthase kinase (GSK)-3β activation, which further causes mitochondrial damage and results in apoptosis of osteoclast precursor cells 42 . Agis et al. showed upregulation of cleaved poly (ADP-ribose) polymerase (PARP), an enzyme that mediates DNA repair after exposure to ZOL 30 μM for 48 h 36 . Others reported ZOL-mediated induction of DNA fragmentation, downregulation of b-cell lymphoma-2 (Bcl-2), and increase in caspase 3/7 enzyme activity 43 –46 . However, further investigations are required in order to identify the molecular pathways activated in PDLSCs.
The regenerative potential of PDLSCs appeared strongly related to their mesenchymal phenotype. As a matter of the fact, it is widely accepted that the maintenance of mesenchymal phenotype in vitro is a fundamental requisite for cell employment in vivo. For this purpose we investigated the effects of ZOL exposure on the expression pattern of mesenchymal markers CD90, CD73, and CD105 as well as on the distribution pattern of vimentin. Treatment with 5 μM ZOL for 5 days accounted for a strong increase in the expression (mean fluorescence intensity values) of CD73 while CD105 expression appeared decreased. From a review of the literature we found just one paper investigating the action of ZOL on mesenchymal phenotype of PDLSCs. Rodríguez-Lozano et al. reported that after 72 h of treatment with increasing concentrations of ZOL, PDLSCs showed a slight decrease in the levels of expression of CD90 and CD105, and a slight increase in the expression of CD73, mainly from 5 μM ZOL; however, the mechanisms have been not explained 47 . Such a result together with the observation of ZOL concentrations lower than 5 μM in ZOL-treated patients suggested that ZOL did not alter significantly the expression of mesenchymal markers in PDLSCs. Accordingly, confocal analysis indicated that 72-h ZOL exposure was not sufficient to alter vimentin expression in our study.
In order to elucidate the ZOL effect on osteogenic differentiation in PDLSCs, we examined the expression levels of the osteogenic genes OCN, RUNX2, ALP, and COL1 by quantitative q-RT-PCR, Col1 protein expression, the ALP activity, and the mineralization capacity of PDLSCs. All these considerations were carried out at ZOL concentrations ≥1 μM. These results suggested that ZOL exposure accounted for an impairment of osteogenic potential of PDLSCs under osteogenic conditions. Indeed, the significant reduction of ALP expression levels after 3, 7, and 10 days of exposure well fits with the reduced ALP activity reported after 7 and 14 days of treatment. Accordingly, in the reduced COL1 mRNA expression reported after 3, 7, and 10 days of drug exposure, we observed a gradual reduction of Col1 accumulation in extracellular matrix after 14 days of osteogenic differentiation. This result strongly suggests a reduced osteogenic differentiation, accordingly to evidences about the role of Col1 as an indispensable extracellular matrix protein for new bone formation 48 . Interestingly, calcium deposits at osteo-induction-day 31 were still evident in PDLSCs treated with ZOL 2 μM. In this case, the experimental setup required the suspension of ZOL treatment after 14 days of osteo-induction, due to the high drug toxicity, while both treated and untreated cells were further maintained in osteogenic medium for 17 days and then tested for mineralization extent. We can speculate that the removal of ZOL allowed PDLSCs to reactivate differentiation program. Accordingly, the extent of mineralization appeared higher in treated PDLSCs than untreated and resulted higher in cells treated with ZOL 2 μM than those treated with ZOL 1 μM. Actually, molecular mechanisms underlying such biological event were unknown; however, we can hypothesize that a pro-osteogenic action of ZOL occurred. As a matter of fact, Ebert et al. showed that brief exposure to micromolar concentrations of ZOL or permanent exposure to concentrations <100 nM enhanced osteogenic differentiation of hMSC in vitro, while 2–3 days exposure to >5 μM ZA as well as permanent exposure to concentrations >200 nM impaired hMSC viability and induced apoptosis 49 . The dual action of ZOL and other BPs in relation to their concentration has been reported by many authors, as pointed out by Maruotti et al 37 . Other studies suggested a clear inhibitory action of ZOL on osteogenic program. Indeed, Lekic et al. demonstrated that BPs decreased the width of the periodontal space by modulating the differentiation of PDLSCs in vivo; however, molecular mechanisms have not been suggested 50 . Obviously, our data appeared slightly different due to the different cell origins and above all to the different exposure times. However, further investigations are required in order to clarify this aspect.
In conclusion, in this work we evaluated the PDLSCs response to ZOL chronic exposure, with drug concentrations ranging from 100 nM through 5 μM. Exposure to 1 μM ZOL did not alter viability of PDLSCs; however, exposure to ZOL concentration >1.5 μM impaired PDLSCs viability and induced apoptosis. Osteogenic differentiation of PDLSCs was also affected by the chronic exposure to ZOL, especially when treated with highest concentrations of the drug (>1.5 μM). Further analyses are required for the investigation of the molecular mechanisms governing ZOL-activated apoptosis and osteogenic program in PDLSCs.
Footnotes
Declaration of Conflicting Interests
The authors declared no potential conflicts of interest with respect to the research, authorship, and/or publication of this article.
Ethical Approval
The study was conducted according to the Declaration of Helsinki on medical protocol and ethics after the approval of the regional Ethical Review Board of Central Calabria, Italy (reference for Magna Graecia University of Catanzaro).
Funding
The author(s) disclosed receipt of the following financial support for the research, authorship, and/or publication of this article: The research referred to in this paper was funded by the Department of Health Science, University Magna Graecia of Catanzaro and by the Master in Oral Surgery and Implantology. Publication of this article was supported by the Department of Clinical and Experimental Medicine, University Magna Graecia of Catanzaro.