
Abstract
The acute cell-mediated immune response presents a significant barrier to xenotransplantation. Immune-privileged Sertoli cells (SC) can prolong the survival of co-transplanted cells including xenogeneic islets, hepatocytes, and neurons by protecting them from immune rejection. Additionally, SC survive as allo- and xenografts without the use of any immunosuppressive drugs suggesting elucidating the survival mechanism(s) of SC could be used to improve survival of xenografts. In this study, the survival and immune response generated toward neonatal pig SC (NPSC) or neonatal pig islets (NPI), nonimmune-privileged controls, was compared after xenotransplantation into naïve Lewis rats without immune suppression. The NPSC survived throughout the study, while NPI were rejected within 9 days. Analysis of the grafts revealed that macrophages and T cells were the main immune cells infiltrating the NPSC and NPI grafts. Further characterization of the T cells within the grafts indicated that the NPSC grafts contained significantly more cluster of differentiation 4 (CD4) and cluster of differentiation 8 (CD8) regulatory T cells (Tregs) at early time points than the NPI grafts. Additionally, the presence of increased amounts of interleukin 10 (IL-10) and transforming growth factor (TGF) β and decreased levels of tumor necrosis factor (TNF) α and apoptosis in the NPSC grafts compared to NPI grafts suggests the presence of regulatory immune cells in the NPSC grafts. The NPSC expressed several immunoregulatory factors such as TGFβ, thrombospondin-1 (THBS1), indoleamine-pyrrole 2,3-dioxygenase, and galectin-1, which could promote the recruitment of these regulatory immune cells to the NPSC grafts. In contrast, NPI grafts had fewer Tregs and increased apoptosis and inflammation (increased TNFα, decreased IL-10 and TGFβ) suggestive of cytotoxic immune cells that contribute to their early rejection. Collectively, our data suggest that a regulatory graft environment with regulatory immune cells including CD4 and CD8 Tregs in NPSC grafts could be attributed to the prolonged survival of the NPSC xenografts.
Introduction
Organ transplantation has the potential to provide treatment for end-stage organ failure. However, the shortage of suitable organ donors limits its application. Xenotransplantation could provide an unlimited supply of tissue for clinical transplantation, thereby providing the ultimate solution to the shortage of donors 1 . However, the aggressive cell-mediated immune rejection of xenografts is a major obstacle to clinical application 2 and most of the immune suppressive drugs used to extend the survival of xenografts are highly toxic with some not suitable for human use 3 –7 .
Typically, cell-mediated rejection of xenografts is T cell dependent and is characterized by infiltration of the graft by immune cells 8 –11 . Antigen-presenting cells (APCs) present graft antigens to T cells which secrete cytokines that stimulate the proliferation and activation of effector cells including T cells, natural killer (NK) cells, and macrophages. It has been reported that cluster of differentiation 4 (CD4) T cells are necessary and sufficient for porcine islet xenograft rejection 12,13 and that xenografts survive following transplantation into nude mice lacking mature T cells 14 and in T cell receptor-deficient mice 15 . Interestingly, macrophages are the main graft-infiltrating immune cells following islet xenotransplantation 8,14 –16 and it was shown previously that macrophages activated by CD4 T cells are key effector immune cells mediating xenograft rejection 17,18 .
Regulatory T cells (Tregs) have potential to suppress cell-mediated responses generated against xenogeneic tissue thus improving graft survival 19 –21 . Use of CD40-CD154 blockade has led to long-term survival of porcine islet xenografts in diabetic mice 22 –24 . Using a combination of anti-lymphocyte function associated antigen (LFA)-1 and anti-CD154 mAbs to prolong graft survival, Arefanian et al. demonstrated that CD4+Foxp3+ Tregs (CD4 Tregs) were responsible for this survival as CD4 Treg depletion resulted in graft rejection and reconstitution of B6 rag−/− mice with splenocytes from these tolerant mice resulted in prolonged porcine islet xenograft survival 22,23 . Recently, the importance of CD4 Tregs in prolongation of islet xenografts was confirmed using only the anti-CD154 monoclonal antibody (mAb) 24 . They also found Treg depletion led to graft rejection and adoptive transfer of CD4 Tregs from anti-CD154 mAb-treated mice provided prolonged islet xenograft survival in these Treg recipients 24 . Collectively, this suggests that CD4 Tregs generated using anti-CD154 mAb treatment are critical in prolonging xenograft survival 24 . However, anti-CD154mAb is not applicable clinically as it causes thromboembolic side effects 3,7 . But recently a modified anti-CD154 mAb (BMS-986004) reduced the risk of platelet activation and significantly prolonged allograft survival when used in combination with a conventional immunosuppressive regimen 25 , its efficacy to prolong xenograft survival still needs to be validated. Additionally, unlike islet allotransplantation 26,27 , the importance of cluster of differentiation 8 (CD8)+Foxp3+ Tregs (CD8 Tregs) in islet xenotransplantation has not been examined. Therefore, further studies focusing on other methods of CD4 Treg generation along with the role of CD8 Tregs in xenotransplantation are warranted.
Sertoli cells (SC) are immune regulatory cells that reside within the seminiferous tubules of the testis where they protect the germ cells against an autoimmune response, since the development of peripheral immune tolerance precedes the appearance of the auto-antigenic germ cells 28,29 . SC protect the germ cells in part by creating the blood–testis barrier that sequesters most of the auto-antigenic germ cells within the adluminal compartment of the seminiferous tubules. Additionally, SC express several immunomodulatory factors that allow them to survive ectopically and create an immunoprotective environment. Interestingly it has been shown that SC survive xenotransplantation long term (≥90 days) without any immune suppressive therapy 30 and prolong the survival of co-grafted cells such as xenogeneic islets, neurons, and hepatocytes (reviewed in Kaur et al. 31 ). This is unique as most other tissue requires immunosuppression to prevent immune rejection.
Recently, it was reported that SC can induce CD4 Tregs in vitro 32,33 . Moreover, CD4 Tregs have been implicated in prevention and reversion of diabetes in nonobese diabetic (NOD) mice after transplantation with neonatal porcine SC 34 , suggesting Tregs may be a component of SC immune regulation and that SC could provide a novel source of Tregs to prolong survival of xenografts. Thus, understanding the immune regulatory mechanism(s) utilized by SC to survive transplantation could be advantageous in developing improved transplantation strategies that require less toxic immune suppressive therapy and bring the practice of clinically applicable xenotransplantation closer to fruition. In this study, we investigated the mechanism of neonatal pig SC (NPSC) survival after xenotransplantation, by comparing the cell-mediated immune response generated against immune-privileged NPSC and nonimmune-privileged neonatal pig islets (NPI) transplanted in Lewis rats.
Materials and Methods
Animals
Male neonatal pigs (1–3 days old, Texas Tech University Research and Experimental Farm, New Deal, TX, USA) were used as SC and islet cell donors. Male Lewis rats (151–175 g, Charles Rivers Laboratories, Wilmington, MA, USA) were used as transplant recipients. Care and maintenance of all animals was in accordance with the Institute for Laboratory Animal Research Care and Use of Laboratory Animals and TTUHSC Institutional Animal Care and Use Committee approved protocols and the guidelines of the National Institutes of Health (NIH, Bethesda, MD, USA).
Cell Isolation and Transplantation
NPSC and NPI were isolated as described previously 35 . Prior to transplantation the number of cells was determined by measuring the total cellular DNA content using the Quant-iT PicoGreen dsDNA quantification assay (Invitrogen, Carlsbad, CA, USA) 35 . Aliquots consisting of 11 × 106 cells were gently placed under the kidney capsule of isofluorane-anesthetized Lewis rats 35 .
DNA Extraction and Polymerase Chain Reaction (PCR)
Graft-bearing kidneys were collected at 4 and 20 days post-transplantation (n = 3/time-point). Tissue from these grafts and nongraft-bearing kidneys (used as controls) was frozen immediately and stored at −80°C for DNA isolation. DNA isolation and PCR for cytochrome oxidase II (COII) and glyceraldehyde-3-phosphate dehydrogenase (GAPDH) were performed as described previously 30 . PCR for COII was nested (two staged) and GAPDH was single stage. The primers are listed in SDC Table 1.
Immunohistochemical Analysis and Quantification of Apoptosis
The graft-bearing kidneys (n ≥ 3) were collected at different time-points post-transplantation and processed for analysis as either paraffin-embedded or frozen tissue. Immunostaining was performed as described previously 35 . The primary antibodies are listed in SDC Table 2. Terminal deoxynucleotidyl transferase-mediated dUTP nick-end labeling (TUNEL) assay was performed on tissue sections as described 36 . Apoptosis, tumor necrosis factor (TNF) α, and interleukin 10 (IL-10) expression was quantified by ImageJ software. The area of TUNEL-positive cells was determined using particle analysis (internal function of ImageJ) in pixels 2 for each image. Contrast enhancement was used to expand the dynamic range of images, and color threshold was set at a constant value, which only selected the positive staining areas. To control for graft size, the total area of TUNEL, TNFα, or IL-10 fluorescence was divided by the total area of the graft.
Quantification of Immune Cells by Flow Cytometry
The graft-bearing kidneys, blood, spleen, and lumbar lymph nodes (LLNs) (n = 3) were collected from the transplanted animals at days 4, 6, and 13 post-transplantation. Specifically, blood was collected from the inferior vena cava into lithium heparin coated tubes (Becton, Dickinson and Company, Franklin Lakes, NJ, USA) and stored on ice. Spleens were de-capsulized with frosted glass slides and cells were collected and stored on ice. Both blood and spleen cells were then layered onto a Lympholyte-M solution (CedarLane Labs, Burlington, NC, USA) and centrifuged at 3500 rpm for 20 min at room temperature in order to isolate lymphocytes. After centrifugation, the supernatant containing the buffy coat (lymphocytes) was collected. Grafts and LLNs were finely chopped and filtered (35 µm nylon mesh, Corning Inc., Corning, NY, USA). At least 2 million cells per sample were used for quantification. Cells were blocked with mouse anti-rat CD32 (1:50 dilution; BD Biosciences, San Jose, CA, USA) to prevent Fc-mediated nonspecific binding as per the manufacturer’s protocol. Cells were then stained with fluorochrome-coupled antibodies (see SDC Table 3) in buffer containing PBS, 1% fetal bovine serum, and 5% ethylenediaminetetraacetic acid. Briefly, anti-CD3, CD4, CD8a, CD25, Foxp3 (BD Biosciences), and CD68 (AbD Serotec, Hercules, CA, USA) were used for quantification of total T cells, CD4 T cells, CD8 T cells, Tregs, and macrophages, respectively (SDC Table 3). Flow cytometric data was acquired using BD Accuri C6 (BD Biosciences) and analyzed using Accuri C6 software (BD Biosciences). Flow cytometric compensation was performed using single-stained cells and fluorescence minus one cells were used to account for background antibody fluorescence.
RNA Extraction and RT-PCR
RNA was extracted from NPSC and NPI collected prior to transplantation (n = 4) and transcribed to complementary deoxyribonucleic acid (cDNA) as described previously 35 . Real-time PCR for immunoregulatory factors (transforming growth factor (TGF) β, Assay ID—Ss03382325_u1; thrombospondin-1 (THBS1), Assay ID—Ss03373620_m1; indoleamine-pyrrole 2,3-dioxygenase (IDO), Assay ID—Ss04322730_m1; galectin-1, Assay ID—Ss03388270_m1; and GAPDH, Assay ID—Ss03375629_u1) was performed using TaqMan Gene expression assay (Applied Biosystems/Thermo Fisher Scientific, Dallas, TX, USA). The real-time PCR was conducted in triplicate for the four biological samples. Nontemplate controls contained water instead of cDNA. The expression level of the gene of interest was evaluated using the comparative Ct method. Threshold values (Ct) for the gene of interest and the housekeeping gene GAPDH were determined using QuantStudioTM 12 K Flex software (Applied Biosystems/Thermo Fisher Scientific). Ct values for the gene of interest were normalized to Ct values for GAPDH in each sample and then the fold change for the gene of interest was calculated relative to the level in the reference sample (NPSC).
Statistical Analysis
Data are expressed as mean ± standard error of the mean (SEM) of n independent experiments. Significant differences between two independent groups were calculated by unpaired Student’s t-test using GraphPad Prism software (GraphPad Software, Inc., La Jolla, CA, USA). Statistical significance of difference between multiple comparisons was calculated by one- or two-way analysis of variance (ANOVA) followed by Fisher’s protected least significant difference (PLSD) post hoc test using GraphPad Prism software. A P-value of ≤0.05 was considered significant.
Results
Survival of NPSC or NPI After Xenotransplantation
NPSC or NPI were transplanted as xenografts under the kidney capsule of naïve Lewis rats. Grafts were collected between days 0 and 20 post-transplantation and analyzed for cell survival by PCR using primers specific to porcine COII and immunohistochemistry for insulin (islet cell marker) or Wilms’ tumor 1 (WT1; NPSC marker; Fig. 1). As expected, the NPI grafts were completely rejected by day 9 post-transplantation. From days 0 (graft collected on the day of transplant) to 4 post-transplantation 100% of the NPI grafts contained many insulin-positive cells (Table 1 and Fig. 1A, D). By day 6, no insulin-positive cells were detected in eight of nine grafts (Fig. 1B, E); the one exception had a very small patch of insulin-positive cells (Table 1). From days 9 to 20, NPI were completely rejected as indicated by the absence of insulin staining (Table 1 and Fig. 1C, F). This was confirmed by PCR where 100% (3/3) of the NPI grafts at day 4 contained porcine tissue, while no porcine tissue was detected at day 20 post-transplantation (0%, 3/3) (lanes 6 and 7, Fig. 1M). On the contrary NPSC survived throughout the study. Abundant WT1-positive NPSC were present in the grafts at all time-points, that is, days 0–20 (Table 1 and Fig. 1G–L). Consistently, porcine tissue, as determined by COII PCR, was detected in 100% (3/3) of the NPSC grafts at days 4 and 20 after transplantation (lanes 3 and 4, Fig. 1M).

Survival of NPSC or NPI after xenotransplantation. NPSC or NPI grafts were collected for immunostaining (A–L) or DNA isolation (M) to assess cell survival. (A–L) Grafts were collected at days 3 (A, D, G, and J; n = 3 for NPSC and NPI), 6 (B, E, H, and K; n = 8 for NPSC and 9 for NPI), and 20 (C, F, I, and L; n = 6 for NPSC and 3 for NPI) post-transplantation and immunostained for NPI marker, insulin (brown, A–F), or NPSC marker, WT1 (brown, G–L). D, E, F, J, K, and L are higher magnification images of A, B, C, G, H, and I, respectively. Cell nuclei were stained with hematoxylin (blue, A–L). (M) DNA was isolated from graft-bearing kidneys collected at days 4 (lanes 3 and 6) and 20 (lanes 4 and 7). PCR was performed using pig-specific COII primers to determine survival of NPSC (lanes 3 and 4; n = 3) or NPI (lanes 6 and 7; n = 3). GAPDH was used as a control for rat DNA. The COII primers were specific to pig tissue as no positive signal was detected in nontransplanted rat kidney control (lane 8) and COII was detected in NPSC or NPI collected prior to transplantation (lanes 2 and 5, respectively). Lane 1 is the 1 kb plus DNA ladder (Invitrogen). COII: cytochrome oxidase II; GAPDH: glyceraldehyde-3-phosphate dehydrogenase; NPI: neonatal pig islets; NPSC: neonatal pig Sertoli cells; pre-tx: pre-transplantation; WT1: Wilms’ tumor 1.
NPSC and NPI Graft Survival After Transplantation into Lewis Rats.

At least three independent experiments (n = 3–9) were performed for each time-point. The survival percentage was determined by dividing the number of WT1- or insulin-positive grafts by the total number of grafts collected at that particular time point. Day 0 grafts were collected on the day of transplantation.
NPSC: neonatal pig Sertoli cells; NPI: neonatal pig islets; WT1: Wilms’ tumor 1.
The grafts were further analyzed for apoptosis using the TUNEL assay. In agreement with the NPSC survival, the relative number of TUNEL-positive cells in the NPSC grafts was low and remained low with no significant changes throughout the study (Fig. 2D–G). In contrast the relative number of apoptotic cells in the NPI grafts was significantly increased at days 4, 6, and 13 compared to NPSC grafts, indicating increased cell death in the NPI grafts (Fig. 2A–C, G). Overall, this demonstrates that NPSC survive when transplanted as xenografts in rats, while NPI are rejected, and suggests these grafts can be used to analyze the immune response to NPSC compared to rejected grafts in order to identify mechanism(s) for SC survival.

Quantification of cell death. NPSC (D–F) or NPI (A–C) grafts were collected at days 4 (A and D; n = 9 for NPSC and 3 for NPI), 6 (B and E; n = 8 for NPSC and 9 for NPI), and 13 (C and F; n = 4 for NPSC and 3 for NPI) post-transplantation and tissue sections were analyzed for apoptotic cells by TUNEL assay (green color, A–F). Sections were counterstained with 4′,6-diamidino-2-phenylindole (DAPI; blue color, A–F) to detect cell nuclei. (G) Apoptosis was quantified by ImageJ software as described in the Materials and Methods section. The values were normalized to day 1 NPSC values and the relative fold change in apoptosis in NPI (grey bar) or NPSC (white bar) grafts was graphed. All values are expressed as the mean ± SEM. An asterisk represents a significant difference (P ≤ 0.05) from corresponding NPSC values as determined by one-way ANOVA followed by Fisher’s PLSD. ANOVA: analysis of variance; NPI: neonatal pig islets; NPSC: neonatal pig Sertoli cells; SEM: standard error of the mean; TUNEL: terminal deoxynucleotidyl transferase-mediated dUTP nick-end labeling.
Immune Cell Infiltration Within the NPI and NPSC Grafts
To identify the mechanism(s) for SC xenograft survival, immune cell infiltration in the NPSC and NPI grafts was analyzed and quantified by immunostaining and flow cytometry, respectively. Specifically, we analyzed the cells involved in the cell-mediated immune response including NK cells, T cells, and macrophages. NK cells were not detected at any time points in the NPSC or NPI grafts (data not shown). Therefore, we focused on macrophages and T cells for the remainder of the experiments.
Quantification of Macrophages
Previously, it was reported that macrophages are the main cell-infiltrating islet xenografts and that CD4 T cells mediate islet xenograft rejection indirectly by activating antigen-primed macrophages 17,18 . Thus, we first examined macrophage infiltration, using an anti-CD68 antibody that detects monocytes/macrophages, in the NPI and NPSC grafts by immunostaining and flow cytometry. In both NPSC and NPI grafts, very few CD68-positive macrophages, mainly confined to the perigraft area (periphery of the graft close to the kidney), were detected at day 1 (data not shown). Macrophage infiltration steadily increased by day 4 (Fig. 3A, C) and from day 6 (Fig. 3B, D) onwards macrophages were present throughout the NPSC and NPI grafts. Quantification of macrophage infiltration in the grafts by flow cytometry revealed that macrophages made up a significantly higher portion of the NPI grafts at days 4 and 6 post-transplantation as compared to the NPSC grafts (Fig. 3E).

Macrophage infiltration in NPI or NPSC grafts. NPI (A, B) or NPSC (C, D) grafts were collected at days 4 (A, C; n = 9 for NPSC and 3 for NPI) and 6 (B, D; n = 8 for NPSC and 9 for NPI) post-transplantation and immunostained for monocytes/macrophages marker, CD68 (brown, A–D). Cell nuclei were stained with hematoxylin (blue, A–D). The dotted line separates the kidney from the graft. (E) Macrophage/monocyte infiltration in the NPSC (n = 3) and NPI (n = 3) grafts was quantified by flow cytometry. Specifically, the percentage of CD68-positive cells, gated on the total graft cells, was quantified and plotted as a bar graph. The data shown are the mean ± SEM for three different experiments per time-point. An asterisk represents a significant difference between NPSC and NPI values as determined by one-way ANOVA followed by Fisher’s PLSD (P ≤ 0.05). ANOVA: analysis of variance; NPI: neonatal pig islets; NPSC: neonatal pig Sertoli cells; SEM: standard error of the mean.
Quantification of T Cells
T-cell-mediated responses generated against xenogeneic tissue play a critical role in xenograft rejection (reviewed in Vadori and Cozzi and Scalea et al. 7,11 ). Therefore, total percentage of T cells was analyzed in the grafts by flow cytometry using CD3 as a marker. Quantification of CD3 T cells revealed that T cells were present in both sets of grafts. Moreover, the percentage of CD3 cells in the NPI grafts significantly increased from day 4 onwards while no significant change in CD3 cells was detected in the NPSC grafts (Fig. 4G). Thus, NPI grafts contained a significantly higher percentage of CD3 T cells at day 13 post-transplantation compared to NPSC grafts (Fig. 4A, G). In general, no significant difference in the percentage of CD3 T cells was detected in the spleen, blood, and LLNs of NPSC- versus NPI-transplanted animals (Fig. S1) except in the spleen and blood at days 6 and 13, respectively (Fig. S1A, B).

Quantification of T-cell infiltration in NPI or NPSC grafts. NPI (A, C, D, and G) or NPSC (A, E, F, and G) grafts were collected at days 4 (A, C, E, G; n = 3 for NPSC and NPI), 6 (A, D, F, G; n = 3 for NPSC and NPI), and 13 (A, G; n = 3 for NPSC and NPI) post-transplantation for flow cytometry. The percentage of CD3-positive cells, gated on the total graft cells, was quantified and plotted as a bar graph (A). The cells were then gated on the lymphoid cell population (indicated by red dotted line) based on cell size and granularity (SSC vs FSC) (B) and then histograms were plotted to quantify CD3 T cells (C–F). (A and G) Data shown are the mean ± SEM for three different experiments per time-point. An asterisk represents a significant difference between NPSC and NPI values; same letters denote NPSC recipients are not significantly different at different timepoints and different numbers denote significant difference between NPI recipients at different time-points as determined by two-way ANOVA followed by Fisher’s PLSD (P ≤ 0.05). ANOVA: analysis of variance; FSC: forward scatter; NPI: neonatal pig islets; NPSC: neonatal pig Sertoli cells; SEM: standard error of the mean; SSC: side scatter.
Next the CD3 T cells were further characterized for CD4 and CD8 T-cell expression. In rats, CD4 and CD8 are expressed on both T cells and macrophages 37,38 . In agreement, CD4 and CD8 expression was detected on both T cells and macrophages in NPI and NPSC grafts (Figs. 5A–D and 6A–I) which was based on cell morphology (small round cells represent T cells while large irregularly shaped cells represent macrophages). Subsequently, flow cytometry was used to specifically analyze the T cells; cells were first gated on CD3 T cells and then analyzed for specific T-cell markers (CD4 and CD8). The majority of the CD3 T cells infiltrating the NPSC and NPI grafts were CD4 T cells (ranges from 43.6% ± 0.9% to 77.3% ± 1.0%; Fig. 5E) as compared to CD8 T cells (ranges from 18.9% ± 3.0% to 34.2% ± 0.6%; Fig. 6J).

Infiltration of CD4-positive cells in NPSC or NPI grafts. NPI (A and B) or NPSC (C and D) grafts were collected at days 4 (A, C; n = 3 for NPSC and NPI) and 6 (B, D; n = 3 for NPSC and NPI) post-transplantation and immunostained for CD4 (brown, A–D). Grafts contain macrophages (arrowhead) and T cells (arrow) that are both positive for CD4. Cell nuclei were stained with hematoxylin (blue, A–D). Insets are higher magnification images. (E) CD4 T-cell infiltration in the NPSC (n = 3) and NPI (n = 3) grafts was quantified by flow cytometry. Cells were first gated on the CD3 T cells and the percentage of CD4 T cells was determined. Data shown are the mean ± SEM for three different experiments per time-point. An asterisk represents a significant difference between NPSC and NPI values; different letters denote significant difference between NPSC recipients at different time-points and different numbers denote significant difference between NPI recipients at different time-points as determined by two-way ANOVA followed by Fisher’s PLSD (P ≤ 0.05). ANOVA: analysis of variance; NPI: neonatal pig islets; NPSC: neonatal pig Sertoli cells; SEM: standard error of the mean.

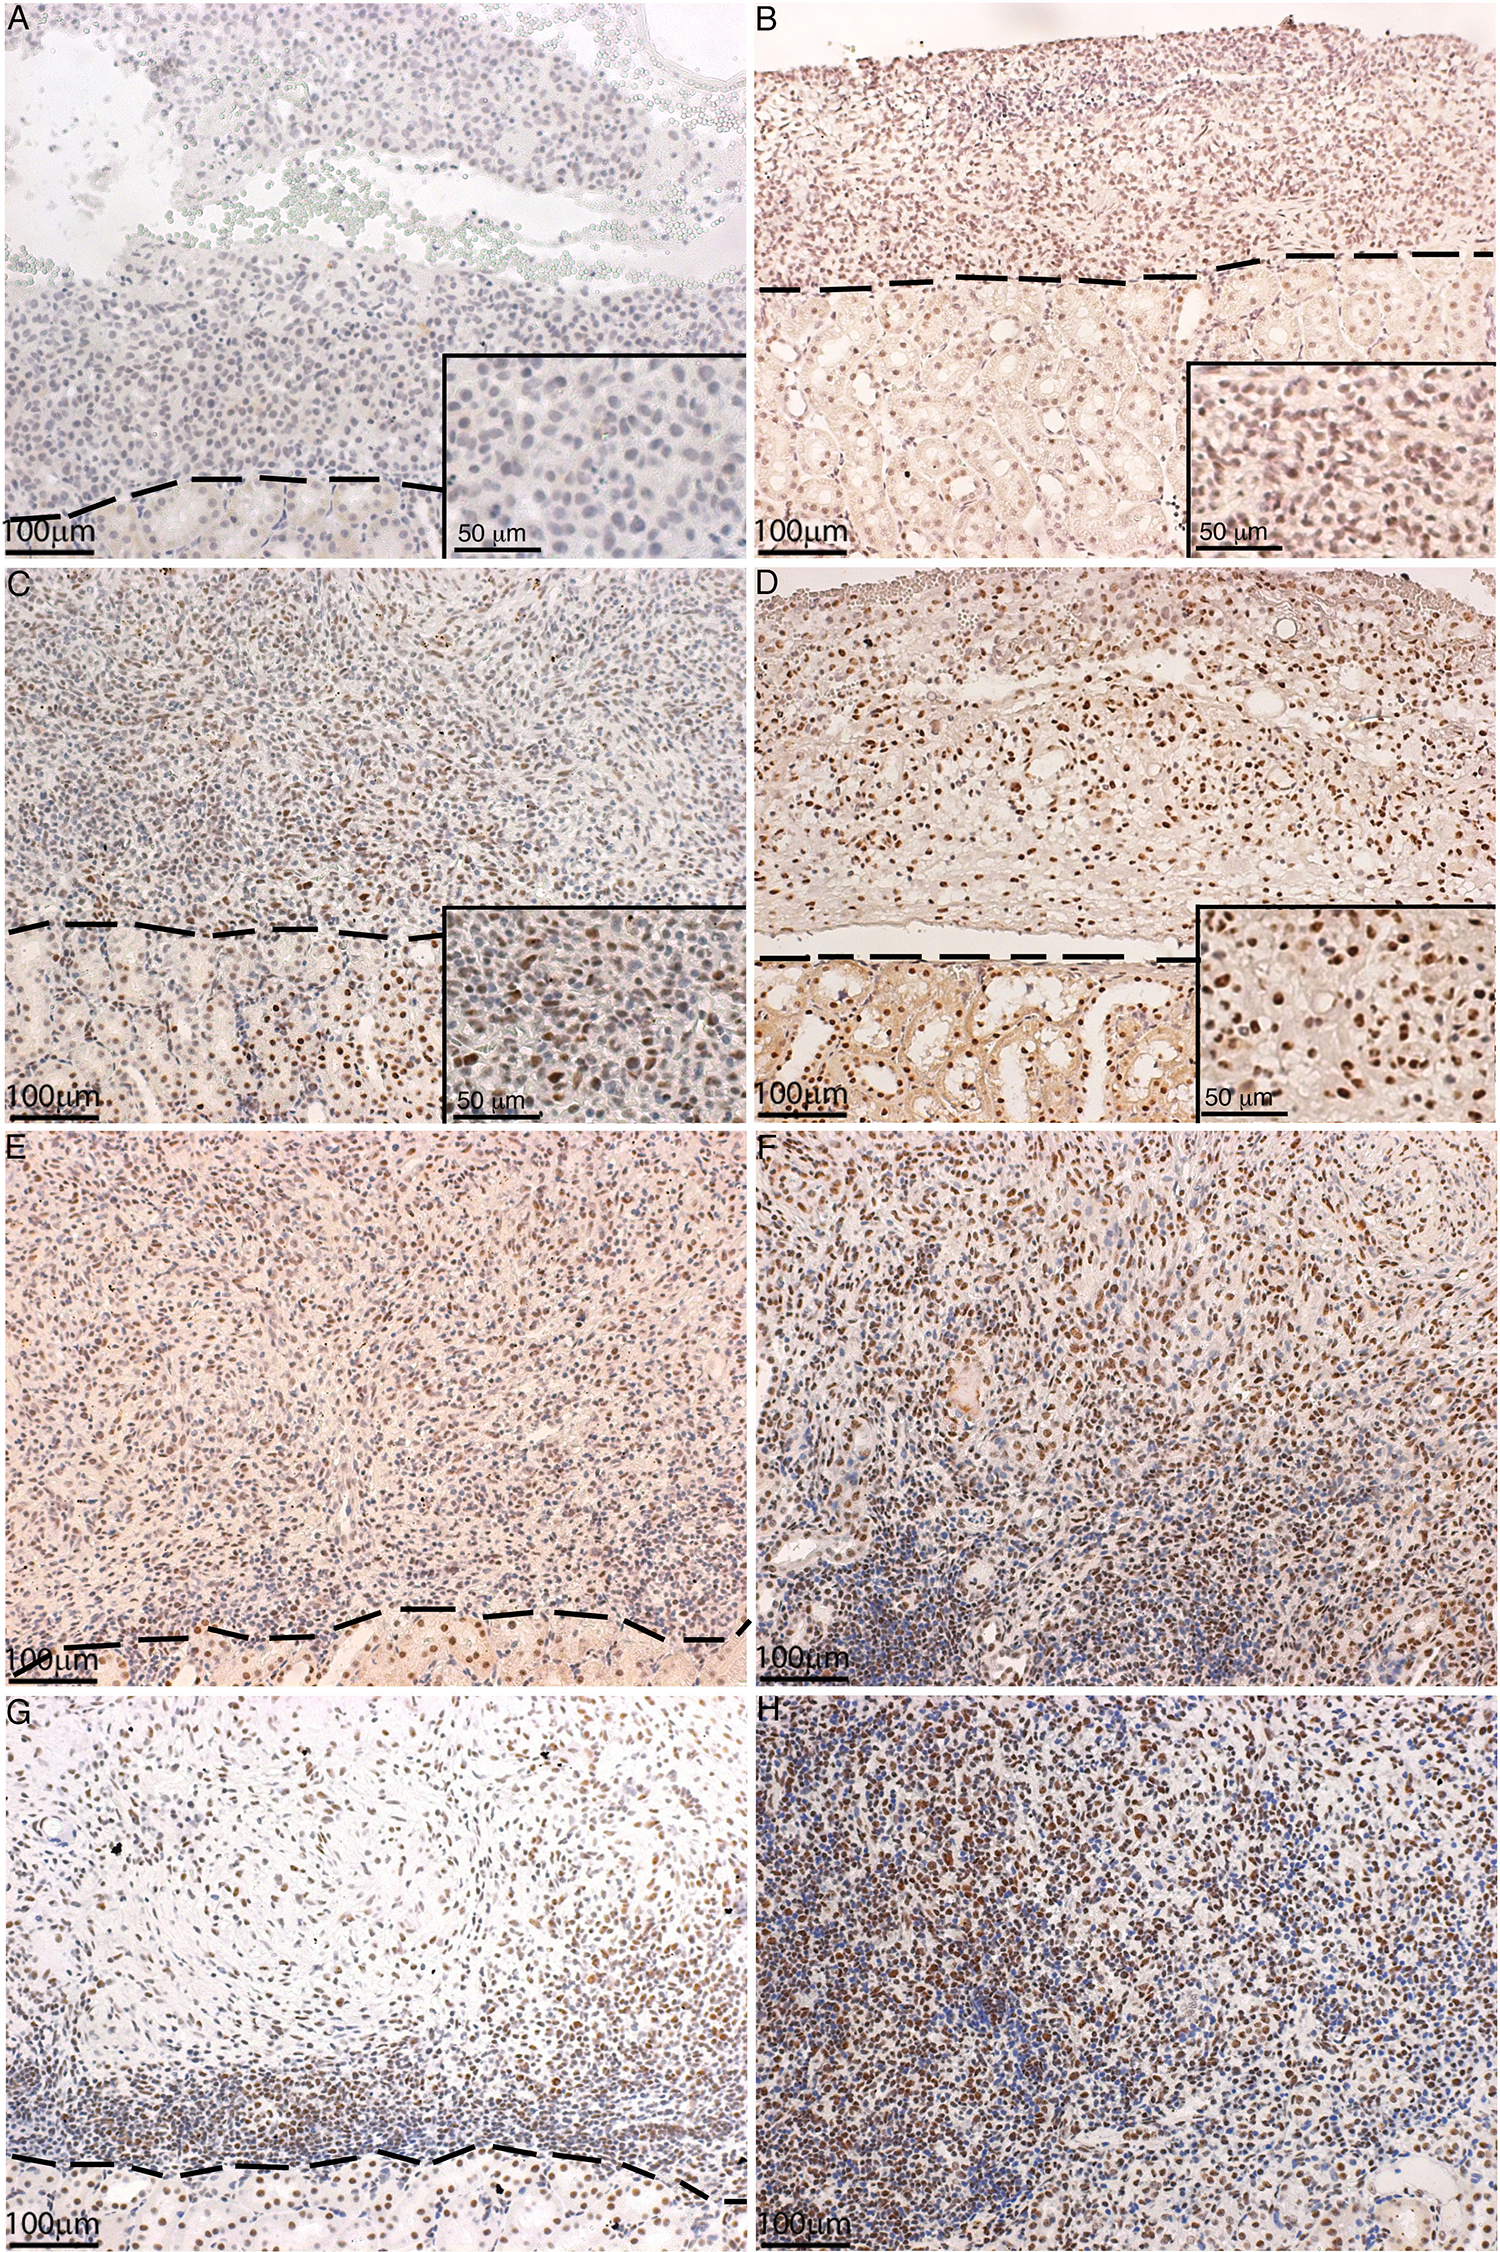
Infiltration of CD8-positive cells in NPSC or NPI grafts. NPI (A–C) or NPSC (D–F) grafts were collected at days 4 (A, D; n = 9 for NPSC and 3 for NPI), 6 (B, E; n = 8 for NPSC and 9 for NPI), and 13 (C, F; n = 4 for NPSC and 3 for NPI) post-transplantation and immunostained for CD8 (brown, A–F). Grafts contain macrophages (arrowhead) and T cells (arrow) that are both positive for CD8. Cell nuclei were stained with hematoxylin (blue, A–F). The dotted line separates the kidney from the graft. Insets are higher magnification images. (G–I) NPI grafts collected at day 4 post-transplantation were double-immunostained for monocytes/macrophage marker (CD68, green, G) and CD8 (red, H) to detect CD8-positive macrophages (yellow cells, I). (J) CD8 T-cell infiltration in the NPSC (n = 3) and NPI (n = 3) grafts was quantified by flow cytometry. Cells were first gated on the CD3 T cells and the percentage of CD8 T cells was determined. Data shown are the mean ± SEM for three different experiments per time-point. An asterisk represents a significant difference between NPSC and NPI values; different letters denote significant difference between NPSC recipients at different time-points and same numbers denote NPI recipients are not significantly different at different time-points as determined by two-way ANOVA followed by Fisher’s PLSD (P ≤ 0.05). ANOVA: analysis of variance; NPI: neonatal pig islets; NPSC: neonatal pig Sertoli cells; SEM: standard error of the mean.
There was no difference in the percentage of CD4 T cells in NPI compared to NPSC grafts at days 4 and 6 (Fig. 5E). Interestingly, comparison of CD4 T cells infiltrating the NPSC or NPI grafts over time revealed that the percentage of CD4 T cells in the NPSC grafts at day 13 was significantly decreased compared to days 4 and 6 NPSC graft recipients (Fig. 5E). On the contrary, the percent of CD4 T cells in the NPI grafts was significantly increased at days 6 and 13 when compared to day 4 post-transplantation (Fig. 5E).
There was no change in the percentage of CD4 T cells in the spleen, LLNs, or blood of NPI graft recipients at any time after transplantation (Fig. S2). The percentage of CD4 T cells in the spleen and LLNs was not different between the NPI- and NPSC-transplanted animals at the early time-points (days 4 and 6), while their number in NPSC-transplanted rats significantly decreased compared to rats transplanted with NPI at day 13 post-transplantation (Fig. S2A, C). The number of circulating CD4 T cells in the blood was significantly lower at days 6 and 13 post-transplantation in NPSC-transplanted rats as compared to NPI-transplanted rats (Fig. S2B).
For CD8 T cells, at day 4 the percentage of CD8 T cells within the NPI grafts was significantly lower than the NPSC grafts (Fig. 6J). The percentage of CD8 T cells did not change in the NPI grafts from day 4 to 13, while there was a decline in the percentage of CD8 T cells within the NPSC grafts. As such there was no difference in the percentage of CD8 T cells within the NPSC and NPI grafts at days 6 and 13. When comparing the spleen, blood, and LLNs, there were no significant differences in the percentage of CD8 T cells between NPI- and NPSC-transplanted animals (Fig. S3), except in the spleen and blood at days 13 and 4, respectively (Fig. S3A, B).
Regulatory T cells
Tregs have been implicated in graft protection; therefore, CD4 and CD8 T cells were further analyzed for the presence of regulatory T cells. Initially grafts were double immunostained for CD4 or CD8 and Foxp3 expression. CD4 and CD8 Tregs were detected in NPSC grafts at days 4 and 6 and NPI grafts at day 6 post-transplantation only (Figs. 7A–D and 8A–D). Tregs were quantified by flow cytometry for CD4 Tregs (CD4, CD25, and Foxp3) or CD8 Tregs (CD8, CD25 and Foxp3) (Figs. 7E and F, S4, 8E and F, and S5). There were significantly more CD4 Tregs at day 4 and CD8 Tregs at days 4 and 6 in the NPSC grafts compared to the NPI grafts. For the NPSC grafts, CD4 Tregs were significantly higher at day 4 and then decreased at days 6 and 13 (although they still comprised 20% of the CD4 T cells), while the CD8 Tregs increased between days 4 and 6 and remained high at day 13. In the NPI grafts, both CD4 and CD8 Tregs were first detected at day 6 as compared to day 4 in NPSC grafts, which correlated with the loss of islets (Fig. 1B, E and Table 1). When comparing the ratio of Treg (CD4+, CD25hi, Foxp3+) to T effector (CD4+, CD25lo, Foxp3–) cells in the grafts, there were 0.85, 0.48, and 0.52 in the NPSC grafts compared to 0, 0.39, and 0.33 in the NPI grafts at days 4, 6, and 13, respectively. Overall this suggests that Tregs in the NPSC grafts at early time-points could be important for NPSC graft protection, while the lack of Tregs in the NPI grafts until day 6 may be too late to prevent their rejection and instead could contribute to the resolution of the cytotoxic immune response.

CD4 Tregs detected in NPSC grafts at early time-point. NPI (A and B; n = 3) or NPSC (C and D; n = 3) grafts were collected at days 4 (A, C) and 6 (B, D) post-transplantation and immunostained for CD4 (green color, A–D) and Foxp3 (red color, A–D). Sections were counterstained with DAPI (blue color, A–D) to detect cell nuclei. (E and F) To quantify CD4 Tregs by flow cytometry, cells were gated on CD3 followed by CD4 and then the percentage of CD25 and Foxp3-positive cells was calculated and plotted as bar graph (F; n = 3 for NPSC and NPI). The representative dot plots are shown in E. Data shown are the mean ± SEM for three different experiments per time-point. An asterisk represents a significant difference between NPSC and NPI values; different letters denote significant difference between NPSC recipients at different time-points and different numbers denote significant difference between NPI recipients at different time-points as determined by two-way ANOVA followed by Fisher’s PLSD (P ≤ 0.05). ANOVA: analysis of variance; DAPI: 4′,6-diamidino-2-phenylindole; NPI: neonatal pig islets; NPSC: neonatal pig Sertoli cells; SEM: standard error of the mean; Tregs: regulatory T cells.

Presence of CD8 Tregs in NPSC grafts. NPI (A and B; n = 3) or NPSC (C and D; n = 3) grafts were collected at days 4 (A, C) and 6 (B, D) post-transplantation and immunostained for CD8 (green color, A–D) and Foxp3 (red color, A–D). Sections were counterstained with DAPI (blue color, A–D) to detect cell nuclei. (E and F) To quantify CD8 Tregs by flow cytometry, cells were gated on CD3 followed by CD8 and then the percentage of CD25 and Foxp3-positive cells was calculated and plotted as bar graph (F; n = 3 for NPSC and NPI). The representative dot plots are shown in E. Data shown are the mean ± SEM for three different experiments per time-point. An asterisk represents a significant difference between NPSC and NPI values; different letters denote significant difference between NPSC recipients at different time-points and different numbers denote significant difference between NPI recipients at different time-points as determined by two-way ANOVA followed by Fisher’s PLSD (P ≤ 0.05). ANOVA: analysis of variance; DAPI: 4′,6-diamidino-2-phenylindole; NPI: neonatal pig islets; NPSC: neonatal pig Sertoli cells; SEM: standard error of the mean; Tregs: regulatory T cells.
Interestingly, analysis of CD4 Tregs in the spleen, blood, and LLNs revealed significantly higher percentage of CD4 Tregs at day 13 in the NPSC graft recipients as compared to NPI graft recipients (Fig. S4). This was also true for CD8 Tregs in the blood of NPSC-transplanted rats (Fig. S5A). But, CD8 Tregs were higher in the blood and LLN at day 4 in NPI-transplanted rats compared to NPSC recipients (Fig. S5B, C).
Analysis of the Graft Microenvironment
The presence of Tregs in the NPSC grafts suggests graft survival is associated with an immunoregulatory environment. Therefore, we analyzed the graft environment for pro-inflammatory cytokine TNFα and anti-inflammatory cytokines TGFβ and IL-10. Consistent with the rejection of the NPI grafts, significantly higher levels of TNFα were detected in NPI grafts compared to NPSC grafts at days 1–13 post-transplantation (Fig. 9G). TNFα was detected throughout the NPI grafts while its expression was limited to the perigraft area in the NPSC grafts (Fig. 9A–F). pSMAD2 (mothers against decapentaplegic homolog 2; downstream marker for active TGFβ 39 ) was used as a marker of active TGFβ. It was detected as early as day 1 in NPSC grafts (Fig. 10B) and was present in NPSC grafts throughout the study, with the intensity and number of positive cells increasing from days 1 to 13 post-transplantation (Fig. 10B, D, F, H). TGFβ within the NPSC grafts as early as day 1 after transplantation could be important for promoting Tregs within the grafts, leading to resolution of the immune response and contributing to prolonged NPSC graft survival. In contrast, pSMAD2-positive cells were not detected until day 4 in NPI grafts (Fig. 10C). The number of pSMAD2-positive cells detected in NPI grafts increased at days 6 and 13 post-transplantation (Fig. 10E, G), although the staining intensity was lower than that in the NPSC grafts. The later appearance of TGFβ in the NPI grafts is concurrent with the rejection of the NPI grafts and suggests it is involved in resolution of the immune response. IL-10 was observed at days 4, 6, and 13 in both sets of grafts (Fig. 11). IL-10 expression was quantified at days 4 and 6 and was significantly higher in NPSC grafts compared to NPI grafts (Fig. 11G). pSMAD2 and IL-10 were also present in the kidney possibly due to the secretion of active TGFβ and IL-10 into the surrounding kidney tissue. Overall, this suggests transplantation of NPSC is associated with an immunoregulatory environment at the graft site that contains anti-inflammatory cytokines and regulatory immune cells, specifically Tregs.

TNFα production. NPI (A, C, and E) or NPSC (B, D, and F) grafts were immunostained for TNFα (red, C and D) at day 4 post-transplantation (n = 9 for NPSC and 3 for NPI). Sections were counterstained with DAPI (blue color, A and B) to detect cell nuclei. E and F are the merged pictures of A, C and B, D, respectively. The dotted line separates the kidney from the graft. (C) Quantification of TNFα production in NPI or NPSC grafts collected at various time-points (days 1–13 post-transplantation; the number of biological n’s as indicated in Table 1) was calculated by ImageJ software as described in the Materials and Methods section. The values were normalized to day 1 NPSC values and the relative fold change in TNFα in NPI or NPSC grafts was graphed. Data shown are the mean ± SEM for at least three different experiments per time-point. An asterisk represents a significant difference between NPSC and NPI values as determined by two-way ANOVA followed by Fisher’s PLSD (P ≤ 0.05). ANOVA: analysis of variance; DAPI: 4’,6-diamidino-2-phenylindole; NPI: neonatal pig islets; NPSC: neonatal pig Sertoli cells; SEM: standard error of the mean; TNF: tumor necrosis factor.
TGFβ production in the grafts. Tissue sections were immunostained for active TGFβ marker, pSMAD2. NPI (A, C, E, and G) or NPSC (B, D, F, and H) grafts were collected at days 1 (A, B; n = 6 for NPSC and NPI), 4 (C, D; n = 9 for NPSC and 3 for NPI), 6 (E, F; n = 8 for NPSC and 9 for NPI), and 13 (G, H; n = 4 for NPSC and 3 for NPI) post-transplantation. The dotted line separates the kidney from the grafts. Cell nuclei were stained with hematoxylin (blue, A–H). Insets are the higher magnification images. NPI: neonatal pig islets; NPSC: neonatal pig Sertoli cells; pSMAD2: mothers against decapentaplegic homolog 2; TGF: transforming growth factor.
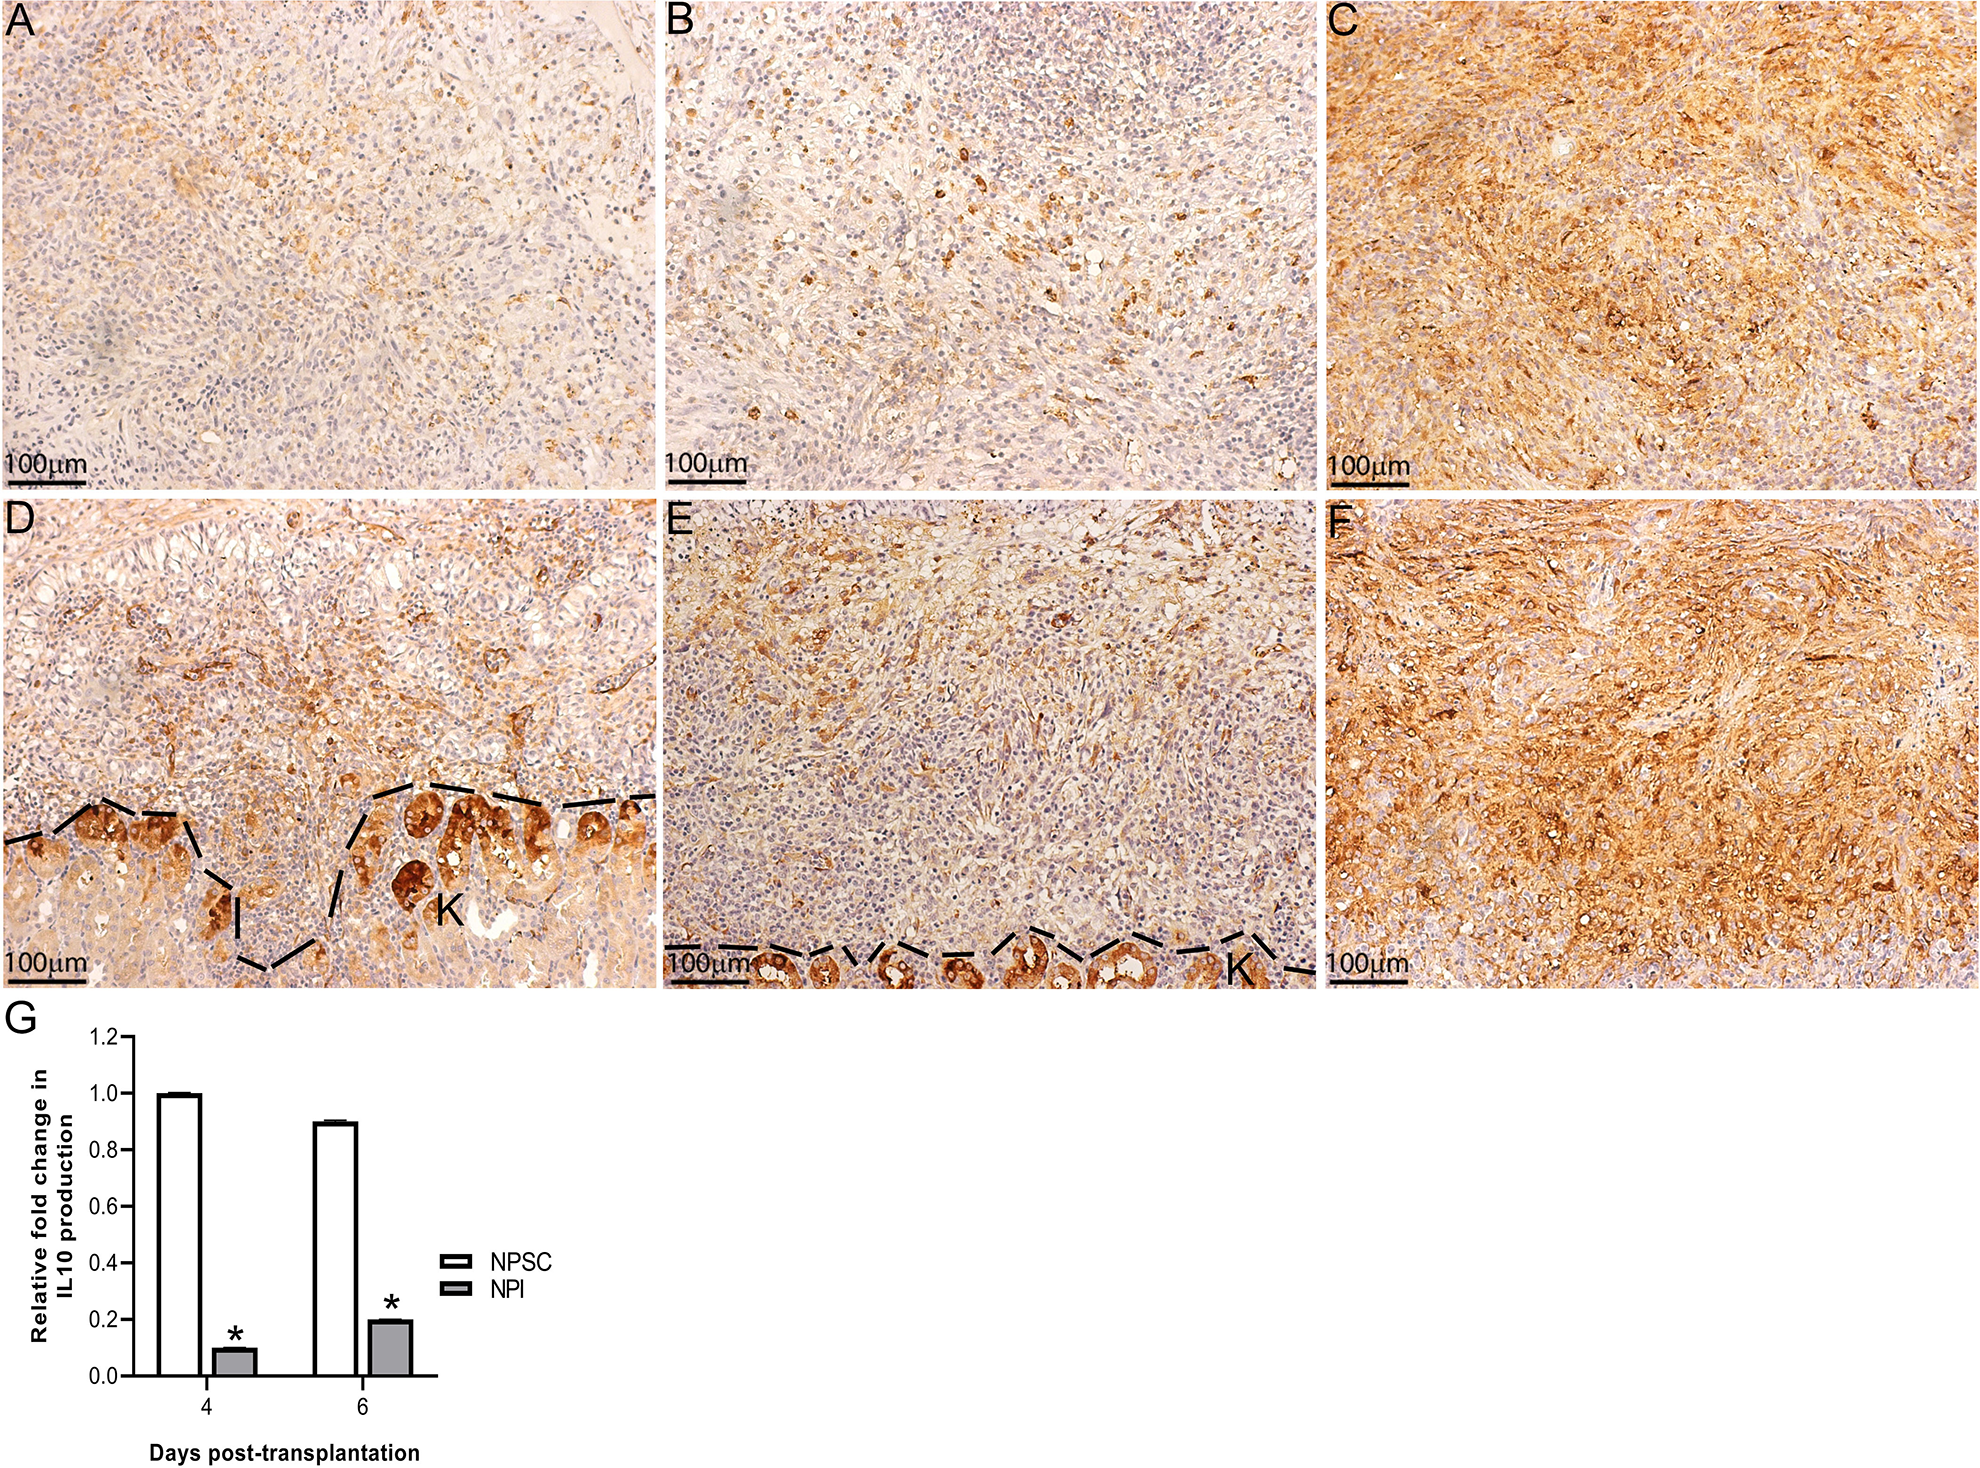
IL-10 production in the grafts. NPI (A–C) or NPSC (D–F) grafts were collected at days 4 (A, D; n = 9 for NPSC and 3 for NPI), 6 (B, E; n = 8 for NPSC and 9 for NPI), and 13 (C, F; n = 4 for NPSC and 3 for NPI) post-transplantation and immunostained for IL-10 (brown, A–F). Cell nuclei were stained with hematoxylin (blue, A–F). The dotted line separates the kidney from the grafts. (G) Immunofluorescence was performed to quantify the expression of IL-10 production in the grafts and was calculated by ImageJ software as described in the Materials and Methods section. The values were normalized to day 4 NPI values and the relative fold change in IL-10 production in NPSC or NPI grafts was plotted. All values are expressed as the mean ± SEM. An asterisk represents a significant difference from NPSC values as determined by Student’s unpaired t-test (P ≤ 0.05). NPI: neonatal pig islets; NPSC: neonatal pig Sertoli cells; SEM: standard error of the mean.
In addition, expression of the immunoregulatory factors TGFβ, IDO, THBS1, and galectin-1 by NPSC and NPI (collected prior to transplantation) was assessed by real-time PCR. NPSC express significantly higher levels of TGFβ, IDO, THBS1, and galectin-1 messenger ribonucleic acid (mRNA) compared to NPI (Fig. 12). These factors are associated with the generation of Tregs, tolerogenic APCs, and cell survival. Thus, expression of these factors by NPSC could be involved in their survival as xenografts.
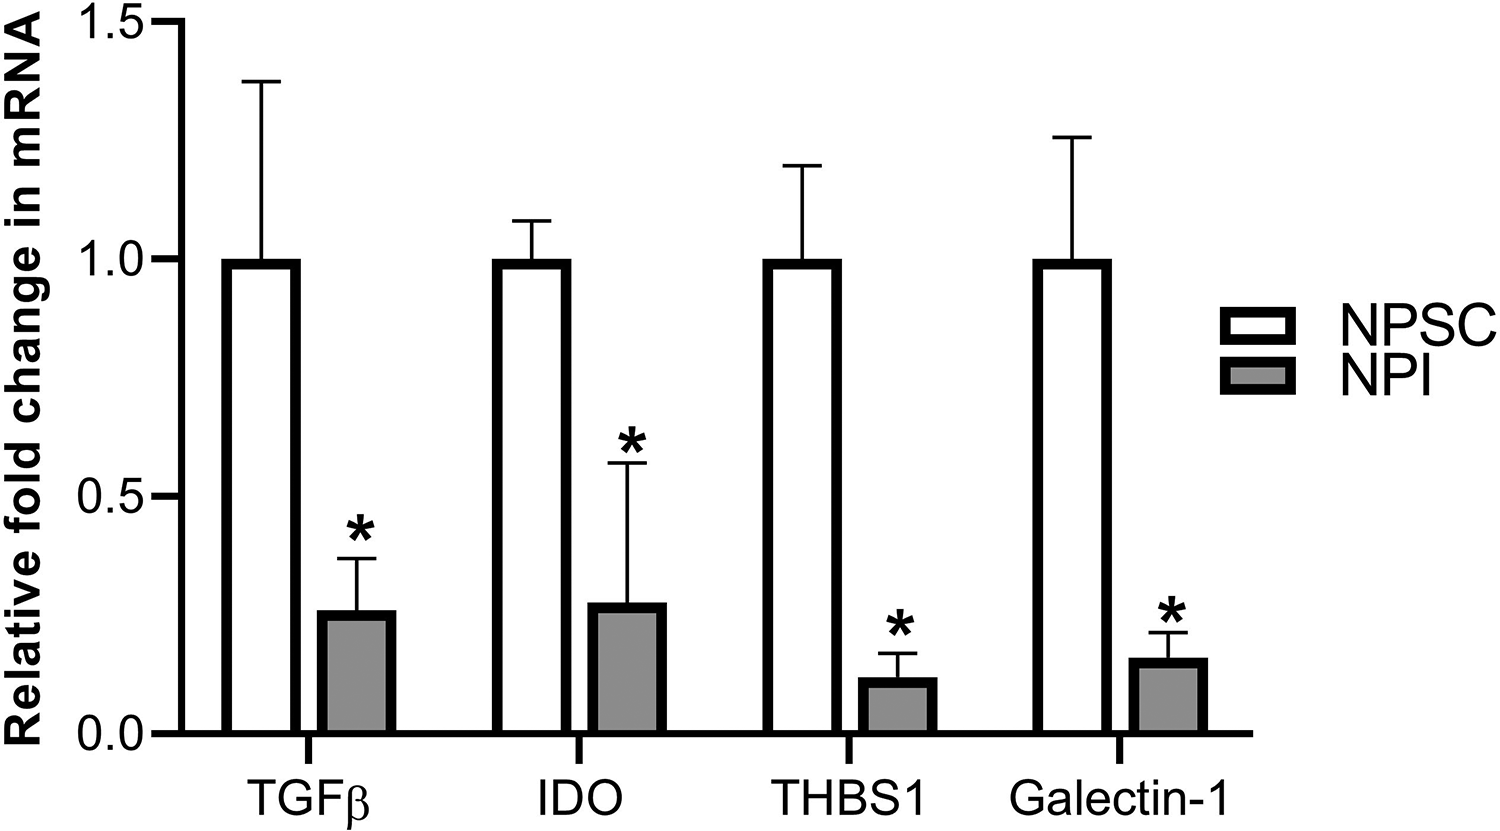
Expression of immunoregulatory molecules. Qualitative reverse transcriptase polymerase chain reaction (qRT-PCR) was performed using mRNA isolated from NPSC (n = 4) and NPI (n = 4) for TGFβ, IDO, THBS1, and galectin-1. Real-time PCR was conducted in triplicate on four biological samples per cell type and all values are expressed as the mean ± SEM. An asterisk represents a significant difference from NPSC values as determined by Student’s unpaired t-test (P ≤ 0.05). IDO: indoleamine-pyrrole 2,3-dioxygenase; NPI: neonatal pig islets; NPSC: neonatal pig Sertoli cells; SEM: standard error of the mean; TGF: transforming growth factor; THBS1: thrombospondin-1.
Discussion
The overall goal of this study was to compare the acute cell-mediated immune response generated against immune-privileged NPSC and rejecting NPI xenografts in order to increase our understanding of how NPSC modify the immune response to create a protective environment, which could be used to improve xenograft survival. Here, we confirm NPSC survive as xenografts in immune-competent rats without the use of immunosuppression or encapsulation, whereas NPI were rejected. Our findings are in agreement with previous reports showing long-term (at least 90 days) survival of NPSC 30,35 and rejection of porcine islets between 1 and 2 weeks post-transplantation 15,16,35 . This demonstrates the unique ability of NPSC to modulate the immune response and further validates that comparison of the rejected NPI grafts and the surviving NPSC grafts can be used to gain insights into the mechanism(s) of NPSC survival.
The analysis of the grafts for the cell-mediated immune response revealed that macrophages and CD3 T cells were the main cells infiltrating both sets of grafts. Significantly higher numbers of macrophages infiltrated the NPI grafts at early time-points as compared to NPSC grafts. This observation is consistent with previous studies where it was demonstrated that macrophages either directly or indirectly (after being activated by CD4 T cells) play an important role in rejecting xenotransplanted NPI 17,18 . T cells can be divided into CD4 T effector cells and CD8 cytotoxic T cells involved in graft rejection and CD4 and CD8 Tregs involved in graft protection. CD4 and CD8 T cells were detected in both sets of grafts. Given the loss of the NPI, it suggests that the infiltrating macrophages and T cells are cytotoxic and involved in rejecting the NPI while the immune cells infiltrating the NPSC grafts could be regulatory. Therefore, we next analyzed the graft environment and phenotype of the CD4 and CD8 T cells in animals transplanted with NPI or NPSC.
The main highlight of this study was the early and continued presence of CD4 and CD8 Tregs within the NPSC grafts. CD4 Tregs have been implicated in prolongation of allograft survival and recently have been demonstrated to improve survival of xenografts 20 –24,40 . Tregs have been shown to mediate immune tolerance and homeostasis by suppressing T effector cells, inhibiting cell–cell contact with APCs, and secreting regulatory cytokines 41,42 . Human CD4 Tregs exposed to pig xenoantigens have been shown to display xenospecific suppressive activity in vitro and in some studies these cells prolonged graft survival once they were transferred to an in vivo model 43 . Furthermore, baboon or human CD4 Tregs exposed to pig xenoantigens prior to adoptive transfer prolonged graft survival and suppressed T-cell responses 44,45 . Moreover, tolerance to nonsequestered meiotic germ cell antigens in the testis is CD4 Treg dependent 46 . In our grafts, CD4 Tregs were detected only in NPSC grafts at day 4 and in both sets of grafts at later time-points suggesting that the early presence of CD4 Tregs is critical for NPSC graft survival. Due to the rat model, we were unable to test the Treg-suppressive function directly. However, in a mouse allotransplantation model we have depleted Tregs and demonstrated they are critical for SC survival (Kaur and Dufour, unpublished). The presence of CD4 Tregs in NPI grafts at later time-points could be involved in resolving the cytotoxic immune response as the islets were completely rejected between days 6 and 9 post-transplantation. The percentage of CD4 Tregs between NPSC- and NPI-transplanted rats was not significantly different at days 4 and 6 systemically (spleen, blood, and LLNs), suggesting that NPSC are most probably modifying the phenotype of the graft-infiltrating CD4 T cells into regulatory type. Interestingly, the CD4 Tregs increased at day 13 in the spleen, blood, and LLNs of NPSC-transplanted rats, signifying this may be important for long-term immune regulation. Worth mentioning, Zhang et al. using an islet allograft model demonstrated the sequential migration of Tregs present in the graft at early time-points after transplantation to the draining lymph nodes later was necessary for their suppressive function 47 .
So far, reports on the importance of Tregs in xenotransplantation have all focused on CD4 Tregs. CD8 Tregs have been implicated in antigen-specific prolongation of allografts 26,27 . In fact, they have been shown to be more potent in suppression of allograft rejection than CD4 Tregs 48 . However, studies analyzing the role of CD8 Tregs in protecting xenogeneic islets are lacking. Here in this study, we made the novel observation that CD8 Tregs are present in the surviving NPSC xenografts. CD8 Tregs were only detected in NPSC grafts at day 4 and their number was significantly higher at day 6 in NPSC grafts compared to NPI grafts thereby suggesting for the first time that CD8 Tregs are important for NPSC xenograft survival and SC immune regulation. Similar to CD4 Tregs, the presence of CD8 Tregs in NPI grafts at later time-points could be attributed to resolving the cytotoxic immune response at the graft site. Contrary to CD4 Tregs, the percentage of CD8 Tregs in rats transplanted with NPI was significantly higher at day 4 systemically (blood and LLNs) as compared to animals transplanted with NPSC. At the moment, the reason behind the higher systemic percentage of CD8 Tregs at day 4 in NPI-transplanted rats is not clear and needs further study. Similar to the CD4 Tregs, CD8 Tregs were also increased at day 13 in the blood of NPSC-transplanted rats. There are several different types of Tregs, for example Qa-1-restricted CD8+ Tregs, that are involved in tolerance and prevention of autoimmunity 49 . Given the presence of both CD4 and CD8 Tregs in the surviving NPSC grafts, it will be interesting in the future to identify the specific subgroups of Tregs present in the grafts.
At early time-points, not only were there significantly more Tregs in the NPSC grafts, but significantly increased levels of IL-10 and more pSMAD2 (indicating activation of the TGFβ-signaling pathway) positive cells. Interestingly, pSMAD2 was observed as early as day 1 in NPSC grafts when very few immune cells were present. Given the constitutive expression of TGFβ by SC 50 and our qPCR results confirming that NPSC express TGFβ at the time of transplantation, this suggests that NPSC are the source of TGFβ leading to SMAD2 activation (phosphorylation and nuclear localization) at this early time-point. From day 3 onwards, TGFβ was detected throughout the NPSC grafts. IL-10 was first observed at day 4 and was then detected throughout the study in both sets of grafts. However, NPSC grafts contained significantly higher IL-10 levels compared to NPI grafts. TGFβ and IL-10 are characteristic of regulatory immune cells 43,51,52 . Regulatory immune cells (macrophages, dendritic cells, and Tregs) secrete TGFβ and IL-10 to suppress a cytotoxic immune response and therefore likely contribute to the prolonged NPSC graft survival. Based on immunostaining, the levels of IL-10 and TGFβ (pSMAD2) appeared to be similar in NPI and NPSC grafts at later time-points. IL-10 and TGFβ present in NPI grafts, along with Tregs at later time-points, could be involved in resolution of the immune response and tissue repair in NPI grafts.
In agreement with the rejection of the NPI, fewer pSMAD2-positive cells and significantly more macrophages were detected in the NPI grafts at early time-points. Moreover, TNFα levels were significantly higher in NPI grafts compared to NPSC grafts, which was associated with increased apoptosis in the NPI grafts. Together this supports the presence of cytotoxic immune cells (macrophages and T effector cells) in the NPI grafts. Macrophages secrete TNFα in response to activation by CD4 T cells and TNFα can induce apoptosis in target cells. Thus, the high levels of TNFα in the NPI grafts could be at least partially responsible for the significant levels of apoptotic cells within these grafts. Significantly fewer macrophages along with low TNFα levels observed in the NPSC grafts suggest there are fewer cytotoxic cells, which is in agreement with the low number of apoptotic cells and NPSC survival. Besides suppression of the cytotoxic immune response, SC could directly inhibit apoptosis as they express Serpina3n and protease inhibitor (PI) 9. PI9 is a cytoplasmic inhibitor of granzymes A and B as well as an inhibitor of the Fas-FasL pathway of apoptosis. Serpina3n is a secreted inhibitor of granzyme B. Serpina3n secreted by mouse SC was found to inhibit granzyme B and decrease apoptosis 53 .
Similar to T cells, macrophage are also highly versatile and can have a wide range of phenotypes and functions 54 . Classically activated or M1 macrophages secrete pro-inflammatory cytokines, such as IL-1, TNFα, and IL-6, and are associated with tissue destruction and graft rejection 15,16,50 . While alternatively activated or M2 macrophages secrete anti-inflammatory cytokines, including TGFβ and IL-10, and are associated with tissue repair and clearance of debris 54,55 . Macrophages isolated from the immune-privileged testes are of a regulatory phenotype 56,57 and suppress the immune response mainly via secretion of IL-10 and TGFβ 57 –59 . Given the importance of SC in testis immune privilege, survival of NPSC along with high expression of TGFβ and IL-10 at the graft site, collectively, suggests the presence of regulatory macrophages in NPSC grafts. However, future studies exploring the phenotype of these macrophages need to be carried out to validate our hypothesis.
The current methods to generate Tregs after xenotransplantation are not clinically relevant 3,7 . Here we demonstrate for the first time that NPSC are capable of increasing CD4 and CD8 Tregs at the graft site without manipulation of the host immune system with harmful drugs. Therefore, further analysis of how NPSC promote these Tregs could lead to novel methods to improve xenograft survival. As a preliminary attempt to explore the mechanism(s) by which SC generate an anti-inflammatory/immune-privileged environment and promote regulatory immune cells, we analyzed the production of immune regulatory factors TGFβ, THBS1, IDO, and galectin-1 by NPSC. All four factors were expressed at significantly higher levels by the NPSC. THBS1 converts latent TGFβ into active TGFβ 60 , suggesting more active TGFβ is available in the NPSC grafts. Exposure to high levels of THBS1 and TGFβ, during early stages of transplantation-mediated injury, can inhibit maturation of APCs and convert them to an immature and tolerogenic state 61,62 . These tolerogenic APCs induce tolerance toward the graft by converting T cells to antigen-specific Tregs rather than activated effector T cells 63,64 . TGFβ and IDO (expressed by mouse and pig SC, respectively) have been implicated in SC protection of transplanted NOD syngeneic islets or reversal of diabetes in autoimmune NOD mice, respectively, and conditioned media from mouse SC have been shown to induce functional CD4 Tregs in vitro via a TGFβ-dependent mechanism 33,34,50 .
Interestingly, galectin-1 is prominently expressed in immune-privileged sites such as testis, eye, and placenta. Galectin-1 promotes the differentiation of macrophages to M2 phenotype, induces tolerogenic dendritic cells (DCs), dampens effector T-cell functions, and induces Tregs 65,66 . Recently, the role of galectin-1 in mouse SC induction of tolerogenic DCs has been reported 67 . In this study, immature DCs were co-cultured with SC or SC-conditioned media which resulted in downregulation of surface expression of major histocompatibility complex (MHC)-II, CD11c, and co-stimulatory molecules (CD80, CD83, and CD86) on DCs. Additionally, these DCs expressed low levels of pro-inflammatory cytokines, inhibited T-cell proliferation, secreted high levels of anti-inflammatory cytokines, and induced CD4 Tregs, which collectively suggest that after exposure to SC the immature DCs differentiated into a tolerogenic phenotype. Additionally, knockdown of galectin-1 expression by SC using small interfering ribonucleic acid (siRNA) abrogated the differentiation of immature DCs into tolerogenic type 67 . Given this interesting finding there is a possibility that NPSC could be inducing tolerogenic DCs in our xenograft model. Future work will focus on the analysis of the grafts for DCs.
Xenografts have the potential to provide an unlimited supply of tissue for clinical transplantation. Here we demonstrate the unique ability of NPSC to survive as xenografts without the use of immune suppression and implicate a regulatory graft environment (increased levels of IL-10 and TGFβ, decreased levels of TNFα and apoptosis) along with early infiltration of CD4 and CD8 Tregs and possibly M2 macrophages into the grafts as important for their survival. NPSC could be modulating this environment by exposing the infiltrating immune cells to high levels of TGFβ, THBS1, galectin-1, and/or IDO, which results in an increase in infiltrating regulatory immune cells, especially Tregs. In contrast, the NPI grafts have a pro-inflammatory environment (increased levels of TNFα and apoptosis, decreased levels of IL-10 and active TGFβ), along with a lack of CD4 and CD8 Tregs at early time-points and increased infiltration of macrophages (possibly M1 macrophages), which likely contribute to their rejection. Future studies aimed at further delving into the mechanism(s) by which SC modulate the immune response and create an immune-privileged environment could result in improved survival of nonimmune-privileged xenogeneic cells or tissues.
Supplemental Material
Supplemental Material, Figure_S1 - Neonatal Pig Sertoli Cells Survive Xenotransplantation by Creating an Immune Modulatory Environment Involving CD4 and CD8 Regulatory T Cells
Supplemental Material, Figure_S1 for Neonatal Pig Sertoli Cells Survive Xenotransplantation by Creating an Immune Modulatory Environment Involving CD4 and CD8 Regulatory T Cells by Gurvinder Kaur, Kandis Wright, Payal Mital, Taylor Hibler, Jonathan M. Miranda, Lea Ann Thompson, Katelyn Halley and Jannette M. Dufour in Cell Transplantation
Supplemental Material
Supplemental Material, Figure_S2 - Neonatal Pig Sertoli Cells Survive Xenotransplantation by Creating an Immune Modulatory Environment Involving CD4 and CD8 Regulatory T Cells
Supplemental Material, Figure_S2 for Neonatal Pig Sertoli Cells Survive Xenotransplantation by Creating an Immune Modulatory Environment Involving CD4 and CD8 Regulatory T Cells by Gurvinder Kaur, Kandis Wright, Payal Mital, Taylor Hibler, Jonathan M. Miranda, Lea Ann Thompson, Katelyn Halley and Jannette M. Dufour in Cell Transplantation
Supplemental Material
Supplemental Material, Figure_S3 - Neonatal Pig Sertoli Cells Survive Xenotransplantation by Creating an Immune Modulatory Environment Involving CD4 and CD8 Regulatory T Cells
Supplemental Material, Figure_S3 for Neonatal Pig Sertoli Cells Survive Xenotransplantation by Creating an Immune Modulatory Environment Involving CD4 and CD8 Regulatory T Cells by Gurvinder Kaur, Kandis Wright, Payal Mital, Taylor Hibler, Jonathan M. Miranda, Lea Ann Thompson, Katelyn Halley and Jannette M. Dufour in Cell Transplantation
Supplemental Material
Supplemental Material, Figure_S4 - Neonatal Pig Sertoli Cells Survive Xenotransplantation by Creating an Immune Modulatory Environment Involving CD4 and CD8 Regulatory T Cells
Supplemental Material, Figure_S4 for Neonatal Pig Sertoli Cells Survive Xenotransplantation by Creating an Immune Modulatory Environment Involving CD4 and CD8 Regulatory T Cells by Gurvinder Kaur, Kandis Wright, Payal Mital, Taylor Hibler, Jonathan M. Miranda, Lea Ann Thompson, Katelyn Halley and Jannette M. Dufour in Cell Transplantation
Supplemental Material
Supplemental Material, Figure_S5 - Neonatal Pig Sertoli Cells Survive Xenotransplantation by Creating an Immune Modulatory Environment Involving CD4 and CD8 Regulatory T Cells
Supplemental Material, Figure_S5 for Neonatal Pig Sertoli Cells Survive Xenotransplantation by Creating an Immune Modulatory Environment Involving CD4 and CD8 Regulatory T Cells by Gurvinder Kaur, Kandis Wright, Payal Mital, Taylor Hibler, Jonathan M. Miranda, Lea Ann Thompson, Katelyn Halley and Jannette M. Dufour in Cell Transplantation
Supplemental Material
Supplemental Material, Supplemental_Digital_Content - Neonatal Pig Sertoli Cells Survive Xenotransplantation by Creating an Immune Modulatory Environment Involving CD4 and CD8 Regulatory T Cells
Supplemental Material, Supplemental_Digital_Content for Neonatal Pig Sertoli Cells Survive Xenotransplantation by Creating an Immune Modulatory Environment Involving CD4 and CD8 Regulatory T Cells by Gurvinder Kaur, Kandis Wright, Payal Mital, Taylor Hibler, Jonathan M. Miranda, Lea Ann Thompson, Katelyn Halley and Jannette M. Dufour in Cell Transplantation
Footnotes
Acknowledgments
We thank Stanley Harris (Texas Tech University Research and Experimental Farm, New Deal) for providing technical assistance.
Ethical Approval
This study was approved by the Institute for Laboratory Animal Research Care and Use of Laboratory Animals and TTUHSC Institutional Animal Care and Use Committee, Texas, USA.
Statement of Human and Animal Rights
All of the experimental procedures involving animals were conducted in accordance with the Institute for Laboratory Animal Research Care and Use of Laboratory Animals and TTUHSC Institutional Animal Care and Use Committee, Texas, USA.
Statement of Informed Consent
There are no human subjects in this article and informed consent is not applicable.
Declaration of Conflicting Interests
The author(s) declared no potential conflicts of interest with respect to the research, authorship, and/or publication of this article.
Funding
The author(s) disclosed receipt of the following financial support for the research, authorship, and/or publication of this article: This work was supported in part by NIAID grant AI109398 (to J.M.D.) and The Jasper L. and Jack Denton Wilson Foundation (to J.M.D. and G.K.). L.A.T is a recipient of an American Heart Association predoctoral fellowship.
Supplemental Material
Supplemental material for this article is available online.
References
Supplementary Material
Please find the following supplemental material available below.
For Open Access articles published under a Creative Commons License, all supplemental material carries the same license as the article it is associated with.
For non-Open Access articles published, all supplemental material carries a non-exclusive license, and permission requests for re-use of supplemental material or any part of supplemental material shall be sent directly to the copyright owner as specified in the copyright notice associated with the article.