
Abstract
Circular RNAs (circRNAs) act crucial roles in the progression of multiple malignancies including osteosarcoma (OS). But, the underlying mechanisms by which hsa_circ_0017311 (circCNST) contributes to the tumorigenesis of OS remain poorly understood. Our present study aimed to explore the role and mechanisms of circCNST in OS tumorigenesis. The differentially expressed circRNAs were identified by the Gene Expression Omnibus database. The association of circCNST with clinicopathological features and prognosis in patients with OS was analyzed by RNA fluorescence in situ hybridization (FISH) and quantitative real-time polymerase chain reaction (PCR) analysis. 3-(4,5-Dimethylthiazol-2-yl)-2,5-diphenyltetrazolium bromide (MTT), colony formation assays, and a xenograft tumor model were conducted to assess the role of circCNST in OS cells in vitro and in vivo. CircCNST-specific binding with miR-421 was confirmed by FISH, luciferase gene report, and RNA immunoprecipitation assays. As a result, we found that the expression levels of circCNST were dramatically increased in OS tissues and cell lines as compared with the adjacent normal tissues, and it was associated with tumor size and poor survival in OS patients. Knockdown of circCNST repressed cell viability, colony formation, and xenograft tumor growth, while restored expression of circCNST reversed these effects. Furthermore, circCNST was colocalized with miR-421 in the cytoplasm and acted as a sponge of miR-421, which attenuated circCNST-induced proliferation-promoting effects in OS cells by targeting SLC25A3. In conclusion, our findings demonstrate that circCNST promotes the tumorigenesis of OS cells by sponging miR-421, and provides a potential biomarker for patients with OS.
Introduction
Osteosarcoma (OS) is one of the most prevalent types of malignant bone sarcomas in young people 1 . In spite of the prodigious progress in the treatment of OS, the patients with OS still have an unfavorable prognosis due to the tumor-aggressive and metastatic behaviors 2 . Accumulating evidence shows that the dysregulation of noncoding RNAs (ncRNAs) is associated with the poor prognosis and malignant behaviors of OS 3 –5 . Thus, identification of the valuable ncRNAs may provide novel insights into the early diagnosis of OS patients.
Circular RNAs (circRNAs) as a novel subgroup of ncRNAs possess covalently closed-loop structures and highly conserved features owing to their resistance to RNase R 6 . Moreover, circRNAs are predominantly localized in the cytoplasm and act as miRNA sponges in OS 5,7 . Dysregulation of circRNAs is associated with the occurrence and pathogenesis of OS 8 . Some studies have indicated that the expression of circ_100876, circ_ORC2, circ_0000502, CDR1as, circ_0001721, and circ_0007534 is upregulated in OS tissue samples 9 –14 , and their high expression is associated with tumor size (TS) and differentiation 9 , Enneking stage, distant metastasis, 12 and poor prognosis 11,13,14 in patients with OS, of which circ_0000502, CDR1as, and circ_0001721 act as the sponges of miR-1238/-7/-569/-599 to facilitate the growth and invasion of OS cells 11 –13 . In contrast, low expression of circ_HIPK3 is associated with Enneking stage and lung metastasis, and circ_HIPK3 acts as a tumor suppressor in OS cells 15 . These circRNAs may represent potential biomarkers for the management of OS.
In the present study, we found that the upregulation of hsa_circ_0017311 (termed as circCNST) was associated with TS and acted as an independent prognostic factor of poor survival in patients with OS. Ectopic expression of circCNST promoted cell viability, colony formation, and xenograft tumor growth by regulating miR-421, and knockdown of circCNST reversed these effects. MiR-421 displayed a negative correlation with circCNST expression and attenuated circCNST-caused tumor proliferation in OS cells. CircCNST might represent a promising biomarker for OS patients.
Materials and Methods
Tissue Samples
A tissue microarray (No. OS802c) including 30 paired OS tissue samples was purchased from Alenabio Biotechnology (Xi’an, China). Another 120 paired OS frozen tissues were from our laboratory. OS patients did not receive any chemotherapy, and the protocols were approved by the Ethics Committee of Zhengzhou University.
Bioinformatic Analysis
The differentially expressed circRNAs were identified between OS and adjacent normal tissues by GSE96964 data (https://www.gcbi.com.cn/gclib/html/index); CircCNST specific binding with miRNAs was identified by Circular RNA Interactome (https://circinteractome.nia.nih.gov/index.html) according to the binding stringency, and the target genes of miR-421 were identified by the TargetScanHuman7.1 prediction tool (http://www.targetscan.org/vert_71/) according to the cumulative weighted context scores.
RNA Fluorescence In Situ Hybridization (FISH) Analysis
Digoxin-labeled probe sequences for hsa_circ_0017311 (circCNST, 5′-TCCTGAAA AAAGTCTCTTGATGTGTTGC-3′) were used to analyze the expression levels and subcellular localization of circCNST in OS tissue samples and cell lines. The detailed description of FISH analysis was conducted as previously reported 4 .
Cell Culture
The normal bone tissues and OS cell lines (MG-63, SW1353, 143B, Saos-2, HOS, and U-2OS) used in this study were stored in our laboratory. MG-63 is an OS cell line obtained from a 14-year-old boy with interferon expression. SW-1353 is an OS cell line from a 72-year-old white woman with primary grade II OS. 143B is an OS cell line from a 13-year-old girl with negative thymidine kinase. Saos-2 is an OS cell line from an 11-year-old girl with epidermal growth factor expression. HOS is an OS cell line from a 13-year-old girl and U-2 OS is a moderately differentiated OS cell line from a 15-year-old girl with insulin-like growth factor expression. These OS cell lines were cultured in Dulbecco’s modified Eagle medium supplemented with 10% heat-inactivated fetal bovine serum in a humidified atmosphere containing 5% CO2 at 37°C.
Quantitative Real-Time PCR (qRT-PCR) Analysis
RNA was isolated from the OS cells using Trizol reagent (Invitrogen, Carlsbad, CA, USA) according to the manufacturer’s instructions. To assess the expression levels of circCNST, CNST, miR-421, and SLC25A3 in OS tissue samples and cell lines, we performed a qRT-PCR analysis. Glyceraldehyde 3-phosphate dehydrogenase (GAPDH) or U6 was used as an endogenous control. The primers of circCNST, CNST, miR-421, and SLC25A3 were designed and synthesized by Sangon Biotech (Shanghai, China). circCNST: forward, 5′-TGTGCAACCACATACAGTTACG-3′ and reverse, 5′-CAGCATATGTGACTGC GCTTA-3′; CNST: forward, 5′-ATACGAGG TGAAGTTGAGCAGT-3′ and reverse, 5′-GAATGGCAGAAAGATTTGCGAG-3′; miR-421: forward, 5′-CTCACTCACATC AACAG ACATTAATT-3′ and reverse, 5′-TATGGTTGTTCTGCTCTCTGTGTC-3′; SLC25A3: forward, 5′-TGATTTAACCAA GACACGGCTC-3′ and reverse, 5′-TGCC TATCCTCACTAATGCGT-3′; U6: forward, 5′-CAAATTCGTGAAGCGTTCCATA-3′ and reverse, 5′-AGTGCAGGGTCCGA GGTATTC-3′; GAPDH primer: forward, 5′-CCT GTACGCCAACACAGTGC-3′ and reverse, 5′-ATACTCCTGCTTGCTG ATCC-3′. The detailed description of qRT-PCR analysis was conducted as previously reported 3 .
Western Blot Analysis
OS cell lines were harvested and extracted using lysis buffer. The primary antibody against SLC25A3 (ab89117, mouse polyclonal antibody, Abcam, Cambridge, MA, USA) was diluted at a ratio of 1:1,000 according to the instructions and incubated overnight at 4°C. The specific details for Western blot analysis were conducted as previously described 3 .
Actinomycin D and RNase R Treatment
Transcription was prevented by the addition of 2 mg/ml actinomycin D and dimethyl sulfoxide (Sigma-Aldrich, St Louis, MO, USA) was used as the control group. Total RNA was incubated for 30 min at 37°C with 3 U/µg of RNase R (Epicentre Technologies, Madison, WI, USA).
Luciferase Reporter Assay
OS cell lines were seeded into 24-well plates. After 24-h incubation, 6 ng of pmirGLO report vector containing wild type (WT) or mutant (Mut) circCNST and SLC25A3 3′ untranslated region (UTR) was co-transfected with miR-421 mimic or inhibitor into OS cell lines. After the transfection for 48 h, luciferase activities were examined with a Dual-Luciferase Reporter System.
Plasmid, shRNA, miR-421 Mimic, and Inhibitor
Lentivirus-mediated sh-circCNST (target sequence: GTGCAACACATCAAGAGACT T), plasmid-mediated circCNST, miR-421 mimic, inhibitor, and miR-NC were purchased from Genepharma (Shanghai, China). OS cells were planted in six-well plates 24 h prior to sh-circCNST, circCNST, and miR-421 inhibitor or mimic transfection with 50% to 70% confluence in OS cells according to the manufacturer’s instructions.
MTT and Colony Formation Assays
MTT and colony formation assays were performed as previously reported 3 .
RNA Immunoprecipitation (RIP) Assay
RIP assay was conducted by using a Magna RIP RNA-Binding Protein Immunoprecipitation Kit (Millipore) according to the manufacturer’s instructions. The antibodies against Ago2 and immunoglobulin G were purchased from Abcam (ab5072, Rabbit polyclonal antibody).
Animal Experiments
Six-week-old female immune-deficient nude mice (BALB/c-nu) were bred at the laboratory animal facility. All experimental procedures were performed according to the biosafety and bioethics guidelines of Zhengzhou University. Mice were injected subcutaneously with 5 × 10⁷ HOS cells transfected with sh-NC or sh-circCNST (n = 5). Mice were monitored daily and developed a subcutaneous tumor. The tumor volume was measured every 3 d using a formula: volume = length × width2/2.
Immunohistochemistry (IHC) Analysis
The protein expression of Ki-67 was examined by using IHC analysis in xenograft tumor tissues. These tissues were stained by using anti-Ki-67 (ab15580, Abcam). The detailed description of the IHC process as well as the quantification of Ki-67 protein expression was conducted as previously described 3 .
Statistical Analysis
Statistical analyses were conducted by SPSS 20.0 (IBM, SPSS, Chicago, IL, USA) and GraphPad Prism. Student’s t-test or chi-square test was used to assess the statistical significance for comparisons of two groups. Pearson’s correlation analysis was used to analyze the correlations. Overall survival curves were analyzed with the Kaplan–Meier method and log-rank test. Univariate and multivariate analyses were conducted by a Cox proportional hazard regression model. P < 0.05 was considered statistically significant.
Results
Identification of a Novel circCNST in OS Cells
Based on the GEO database, a microarray GSE96964 was used to identify the differentially expressed circRNAs between OS and adjacent normal tissues (n = 3). With the criteria of fold change (FC) > 2 and P < 0.01, 12 downregulated circRNAs and 7 upregulated circRNAs were identified, of which hsa_circ_0017311 expression was significantly increased in OS tissues (FC = 3.27, P = 0.0074; Fig. 1A). We found that hsa_circ_0017311 (chr1: 246784730-246797889) is originated from exon 3, 6 regions within consortin (CNST) locus, and is named as circCNST (Fig. 1B). As compared with the linear CNST, circCNST displayed a significant resistance to RNase R in OS cell lines (MG-63 and U-2OS), suggesting that circCNST possessed a loop structure in OS cells (Fig. 1C). We next observed the stability and localization of circCNST. After MG-63 and U-2OS cell lines were exposed to a transcription inhibitor actinomycin D, the qRT-PCR analysis indicated that the half-life of circCNST reached 24 h, but that of linear CNST was less than 6 h in these two cells (Fig. 1D). qRT-PCR and FISH analysis showed that circCNST was mainly localized in the cytoplasm in OS cell lines and tissue cells (Fig. 1E, F).

Identification of a novel circCNST in OS samples. (A) GSE96964 analysis of the differentially expressed circRNAs between OS and adjacent normal tissues. (B) The genomic loci of the CNST gene and circCNST. Arrows represent divergent primers that bind to the genomic region of circCNST. (C) qRT-PCR analysis of circCNST and CNST expression levels after treatment with RNase R in MG-63 and U-2OS cells. (D) qRT-PCR analysis of the half-life of circCNST and CNST after treatment with actinomycin D in MG-63 and U-2OS cells. (E, F) qRT-PCR analysis of the localization of circCNST in OS cells and tissue cells. CNST: consortin; OS: osteosarcoma; qRT-PCR: quantitative real-time polymerase chain reaction.
Upregulation of circCNST Was Associated with Poor Survival in OS Patients
The expression levels of circCNST were examined in 30 paired OS tissues by FISH analysis, which indicated that circCNST expression levels were dramatically increased in OS tissues as compared with pair-matched normal tissues (P = 0.0019; Fig. 2A). This result was validated by qRT-PCR analysis in 126 paired OS tissue samples (P < 0.0001; Fig. 2B). The expression levels of circCNST were also increased in OS patients with TS ≥ 5 cm as compared with those with TS < 5 cm (P = 0.0266; Fig. 2C).

Upregulation of circCNST was associated with poor survival in OS patients. (A) Fluorescence in situ hybridization analysis of the expression levels of circCNST in 30 paired OS tissues. (B) qRT-PCR analysis of the expressed levels of circCNST in 126 paired OS tissues. (C) qRT-PCR analysis of the expressed levels of circCNST in OS patients with TS ≥ 5 cm or those with TS < 5 cm. (D) receiver operating characteristic curve analysis of the cutoff value, sensitivity, and specificity of circCNST in OS patients. (E) Kaplan–Meier analysis of the association of high or low circCNST expression with overall survival in patients with OS.CNST: consortin; OS: osteosarcoma; qRT-PCR: quantitative real-time polymerase chain reaction; TS: tumor size.
In terms of patients’ survival time, survival status, and circCNST expression levels, a cutoff value of circCNST was obtained in OS patients (Fig. 2D), and divided the patients into high circCNST expression and low circCNST expression groups. The sensitivity, specificity, and area under curve (AUC) value of circCNST were 36.0%, 87.1%, and 0.63, indicating that circCNST might be a potential marker for OS patients.
Then, high expression of circCNST was associated with TS (P = 0.018), but had no association with other factors (P > 0.05, Table 1). Kaplan–Meier analysis demonstrated that the patients with high circCNST expression had a shorter survival as compared with those with low circCNST expression (P = 0.0147, Fig. 1E). Univariate and multivariate analyses uncovered that high expression of circCNST acted as an independent prognostic factor of poor survival in OS patients (Table 2).
The Association of circCNST Expression with Clinicopathologic Characteristics in OS Patients.

Cox Regression Analysis of circCNST Expression as a Survival Predictor of OS Patients.

NA: not analyzed.
CircCNST Promoted the Proliferation and Colony Formation of OS Cells
Given the positive correlation of circCNST expression with TS in OS tissues (Fig. 1C and Table 1), we assessed the functional role of circCNST in OS cells, and constructed its interference sequences against the back-splicing site of circCNST (Fig. 3A). The expression of circCNST was detected in different OS cell lines by qRT-PCR analysis, indicating that circCNST harbored a higher expression level in HOS and U-2OS cell lines but a lower expression level in SW-1353 and MG-63 cell lines (Fig. 3B). Then, the overexpression efficiency of circCNST plasmid in SW-1353 and MG-63 cell lines or the knockdown efficiency of sh-circCNST in HOS and U-2OS cell lines was determined by qRT-PCR analysis (Fig. 3C). We found that the cell viability and colony formation number were increased by the transfection with circCNST plasmid in SW-1353 and MG-63 cell lines (Fig. 3D, F), but reversed by the transfection with sh-circCNST in HOS and U-2OS cell lines as compared with the control group (Fig. 3E, G).

CircCNST facilitated the proliferation and colony formation of OS cells. (A) Schematic representation of target sequences of the shRNA specific to the back-splicing junction of circCNST. (B) qRT-PCR analysis of the expression levels of circCNST in different OS cell lines. (C) qRT-PCR analysis of the transfection efficiency of circCNST plasmid in SW-1353 and MG-63 cell lines or sh-circCNST in HOS and U-2OS cell lines. (D, E) 3-(4,5-Dimethylthiazol-2-yl)-2,5-diphenyltetrazolium bromide analysis of the cell viability after the transfection with circCNST plasmid in SW-1353 and MG-63 cell lines or sh-circCNST in HOS and U-2OS cell lines. (F, G) Colony formation analysis of the cell colony number after the transfection with circCNST plasmid in SW-1353 and MG-63 cell lines or sh-circCNST in HOS and U-2OS cell lines. Data are the means ± standard error of the mean of three experiments. *P < 0.05, **P < 0.01. CNST: consortin; OS: osteosarcoma; qRT-PCR: quantitative real-time polymerase chain reaction.
CircCNST Acted as a Sponge of miR-421 in OS Cells
We identified that circCNST displayed a specific binding with miR-421 by using the starBasev2.0, and FISH analysis showed that circCNST was colocalized with miR-421 in the cytoplasm of MG-63 cells (Fig. 4A). Pearson’s correlation analysis showed that circCNST had a negative correlation with miR-421 expression in OS tissues (r = −0.324, P = 0.016; Fig. 4B). To validate whether circCNST can bind with miR-421, we co-transfected miR-421 mimic and WT or Mut circCNST into SW-1353 and MG-63 cells and found that miR-421 reduced the luciferase activity of WT circCNST in these two cell lines, but had no effects on that of Mut circCNST, as compared with the miR-NC group (Fig. 4C). The qRT-PCR analysis showed that the overexpression of circCNST reduced the expression levels of miR-421 in SW-1353 and MG-63 cells, but knockdown of circCNST increased its expression in HOS and U-2OS cells (Fig. 4D). RIP assay was performed for Ago2 protein in SW-1353 and MG-63 cells, and the endogenous expression of circCNST and miR-421 pulled down from Ago2 protein was enriched in the Ago2 pellet as compared with the input control, indicated by qRT-PCR analysis (Fig. 4E). We also co-transfected miR-421 mimic and circCNST plasmid into SW-1353 and MG-63 cells, and found that miR-421 reduced cell viability and attenuated circCNST-induced cell proliferation in these two cell lines (Fig. 4F).
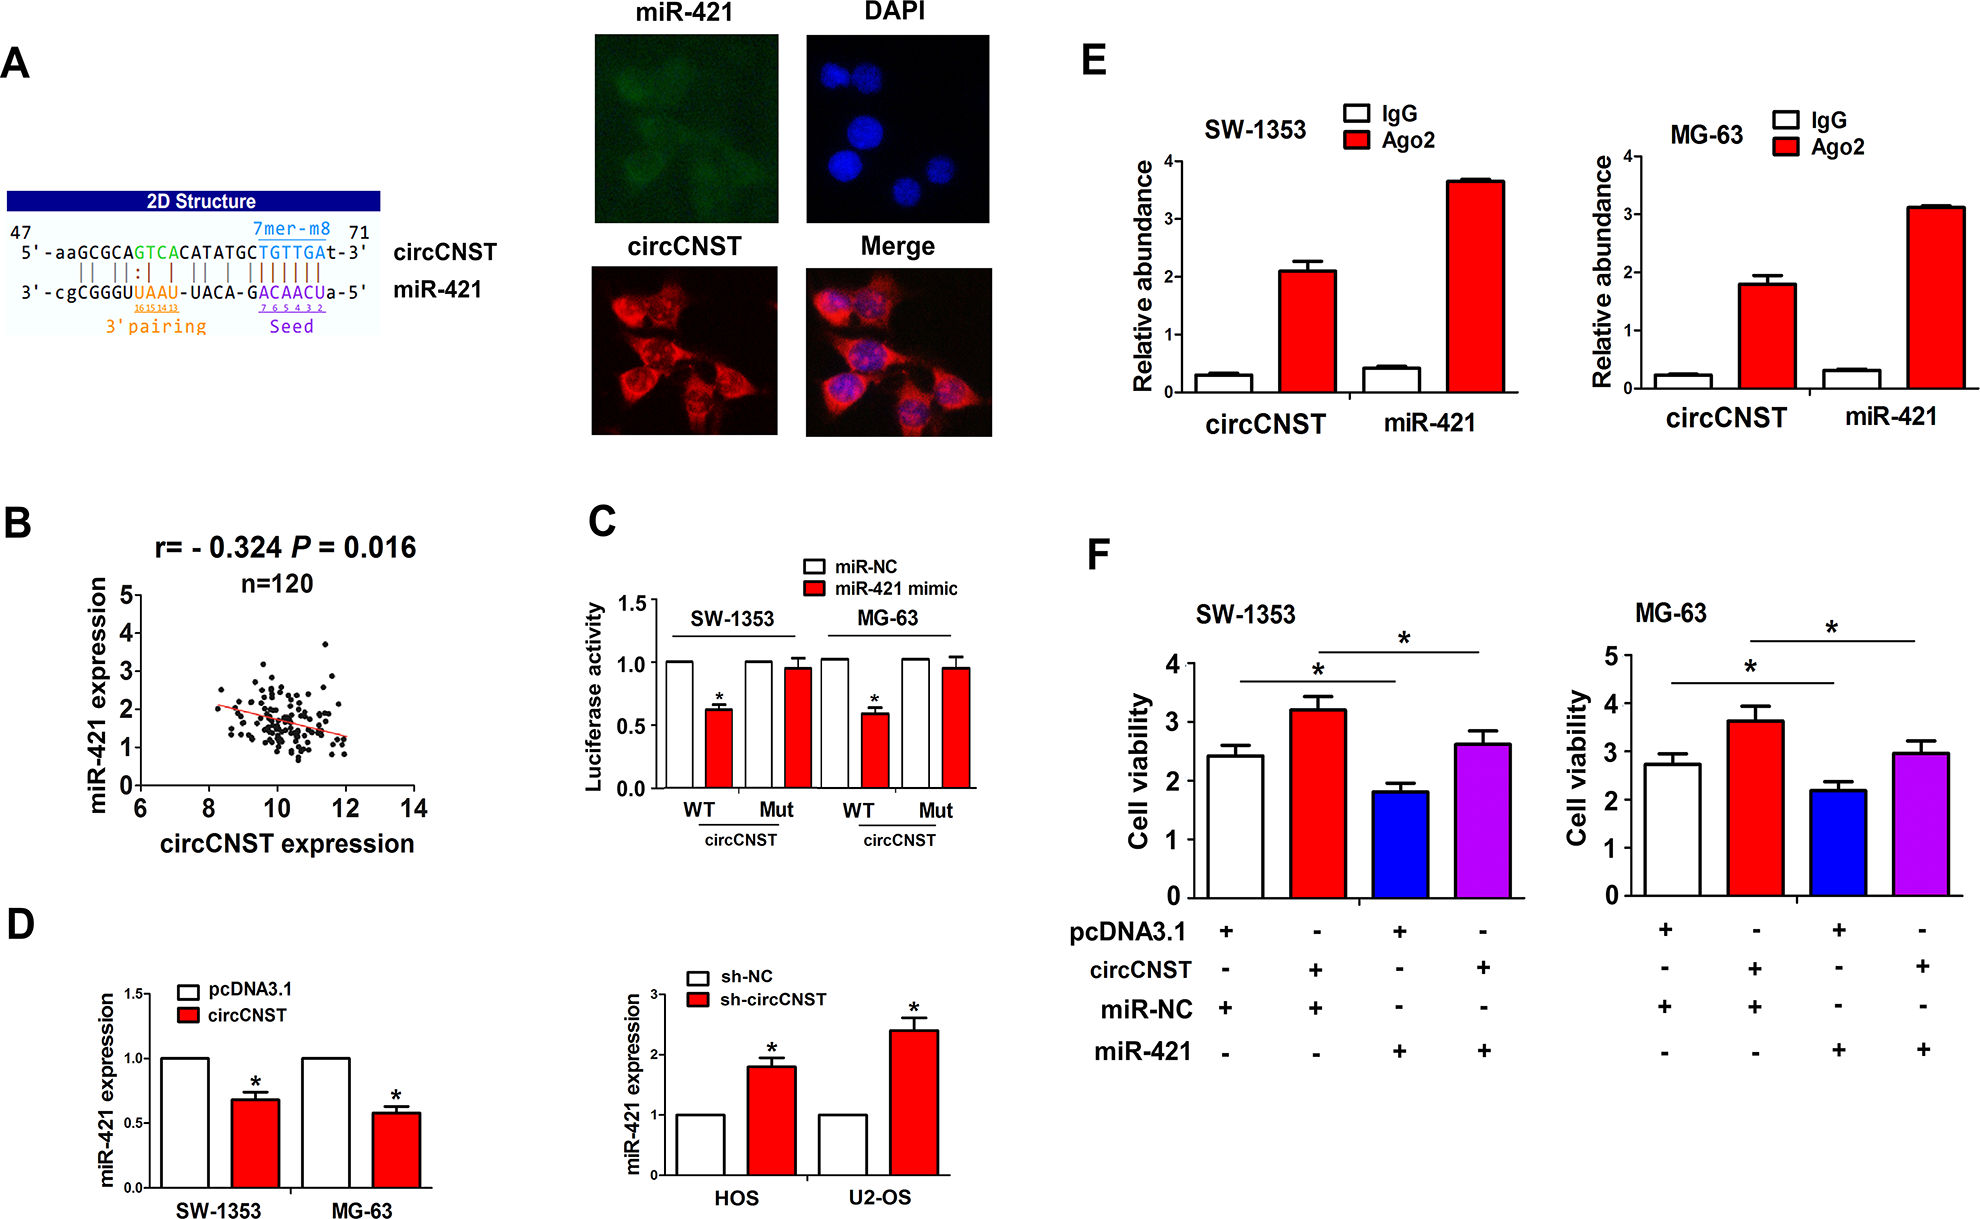
CircCNST acted as a sponge of miR-421 in OS cells. (A) Schematic representation of the binding sites of miR-421 with circCNST, and fluorescence in situ hybridization analysis of the colocalization of circCNST with miR-421 in MG-63 cells. (B) Pearson’s correlation analysis of the correlation of circCNST expression with miR-421 in OS tissues. (C) Luciferase activity of WT or Mut circCNST after the transfection with miR-421 mimic or miR-NC in SW-1353 and MG-63 cell lines. (D) qRT-PCR analysis of the expression levels of miR-421 after the transfection with circCNST plasmid in SW-1353 and MG-63 cell lines or sh-circCNST in HOS and U-2OS cell lines. (E) RNA immunoprecipitation and qRT-PCR analysis of the enrichment of circCNST and miR-421 pulled down from the Ago2 protein in SW-1353 and MG-63 cell lines. (F) 3-(4,5-Dimethylthiazol-2-yl)-2,5-diphenyltetrazolium bromide analysis of the cell viability after the co-transfection with circCNST plasmid and (or) miR-421 mimic in SW-1353 and MG-63 cell lines. Data are the means ± standard error of the mean of three experiments. *P < 0.05. CNST: consortin; OS: osteosarcoma; qRT-PCR: quantitative real-time polymerase chain reaction.
MiR-421 Reversed circCNST-Caused SLC25A3 Expression in OS Cells
We identified the targets of miR-421 and found that miR-421 had the greatest binding potential with SLC25A3 (Fig. 5A). To confirm whether miR-421 can bind with SLC25A3, we co-transfected miR-421 mimic and WT or Mut SLC25A3 3′UTR into SW-1353 and MG-63 cells, and found that miR-421 reduced the luciferase activity of WT SLC25A3 3′UTR in these two cell lines, but had no effects on that of Mut SLC25A3 3′UTR, as compared with the miR-NC group (Fig. 5B). TCGA cohort showed that SLC25A3 expression was increased in paired and unpaired OS tissues (P < 0.0001, Fig. 5C). Pearson’s correlation analysis showed that miR-421 had a negative correlation with SLC25A3 expression in OS tissues (r = −0.215, P = 0.043), and the patients with high SLC25A3 expression had a poorer survival as compared with those with low SLC25A3 expression (P = 0.001, Fig. 5D). We co-transfected miR-421 mimic and circCNST plasmid into SW-1353 and MG-63 cells, and found that miR-421 downregulated SLC25A3 expression and reversed circCNST-induced SLC25A3 expression in these two cell lines (Fig. 5E, F).
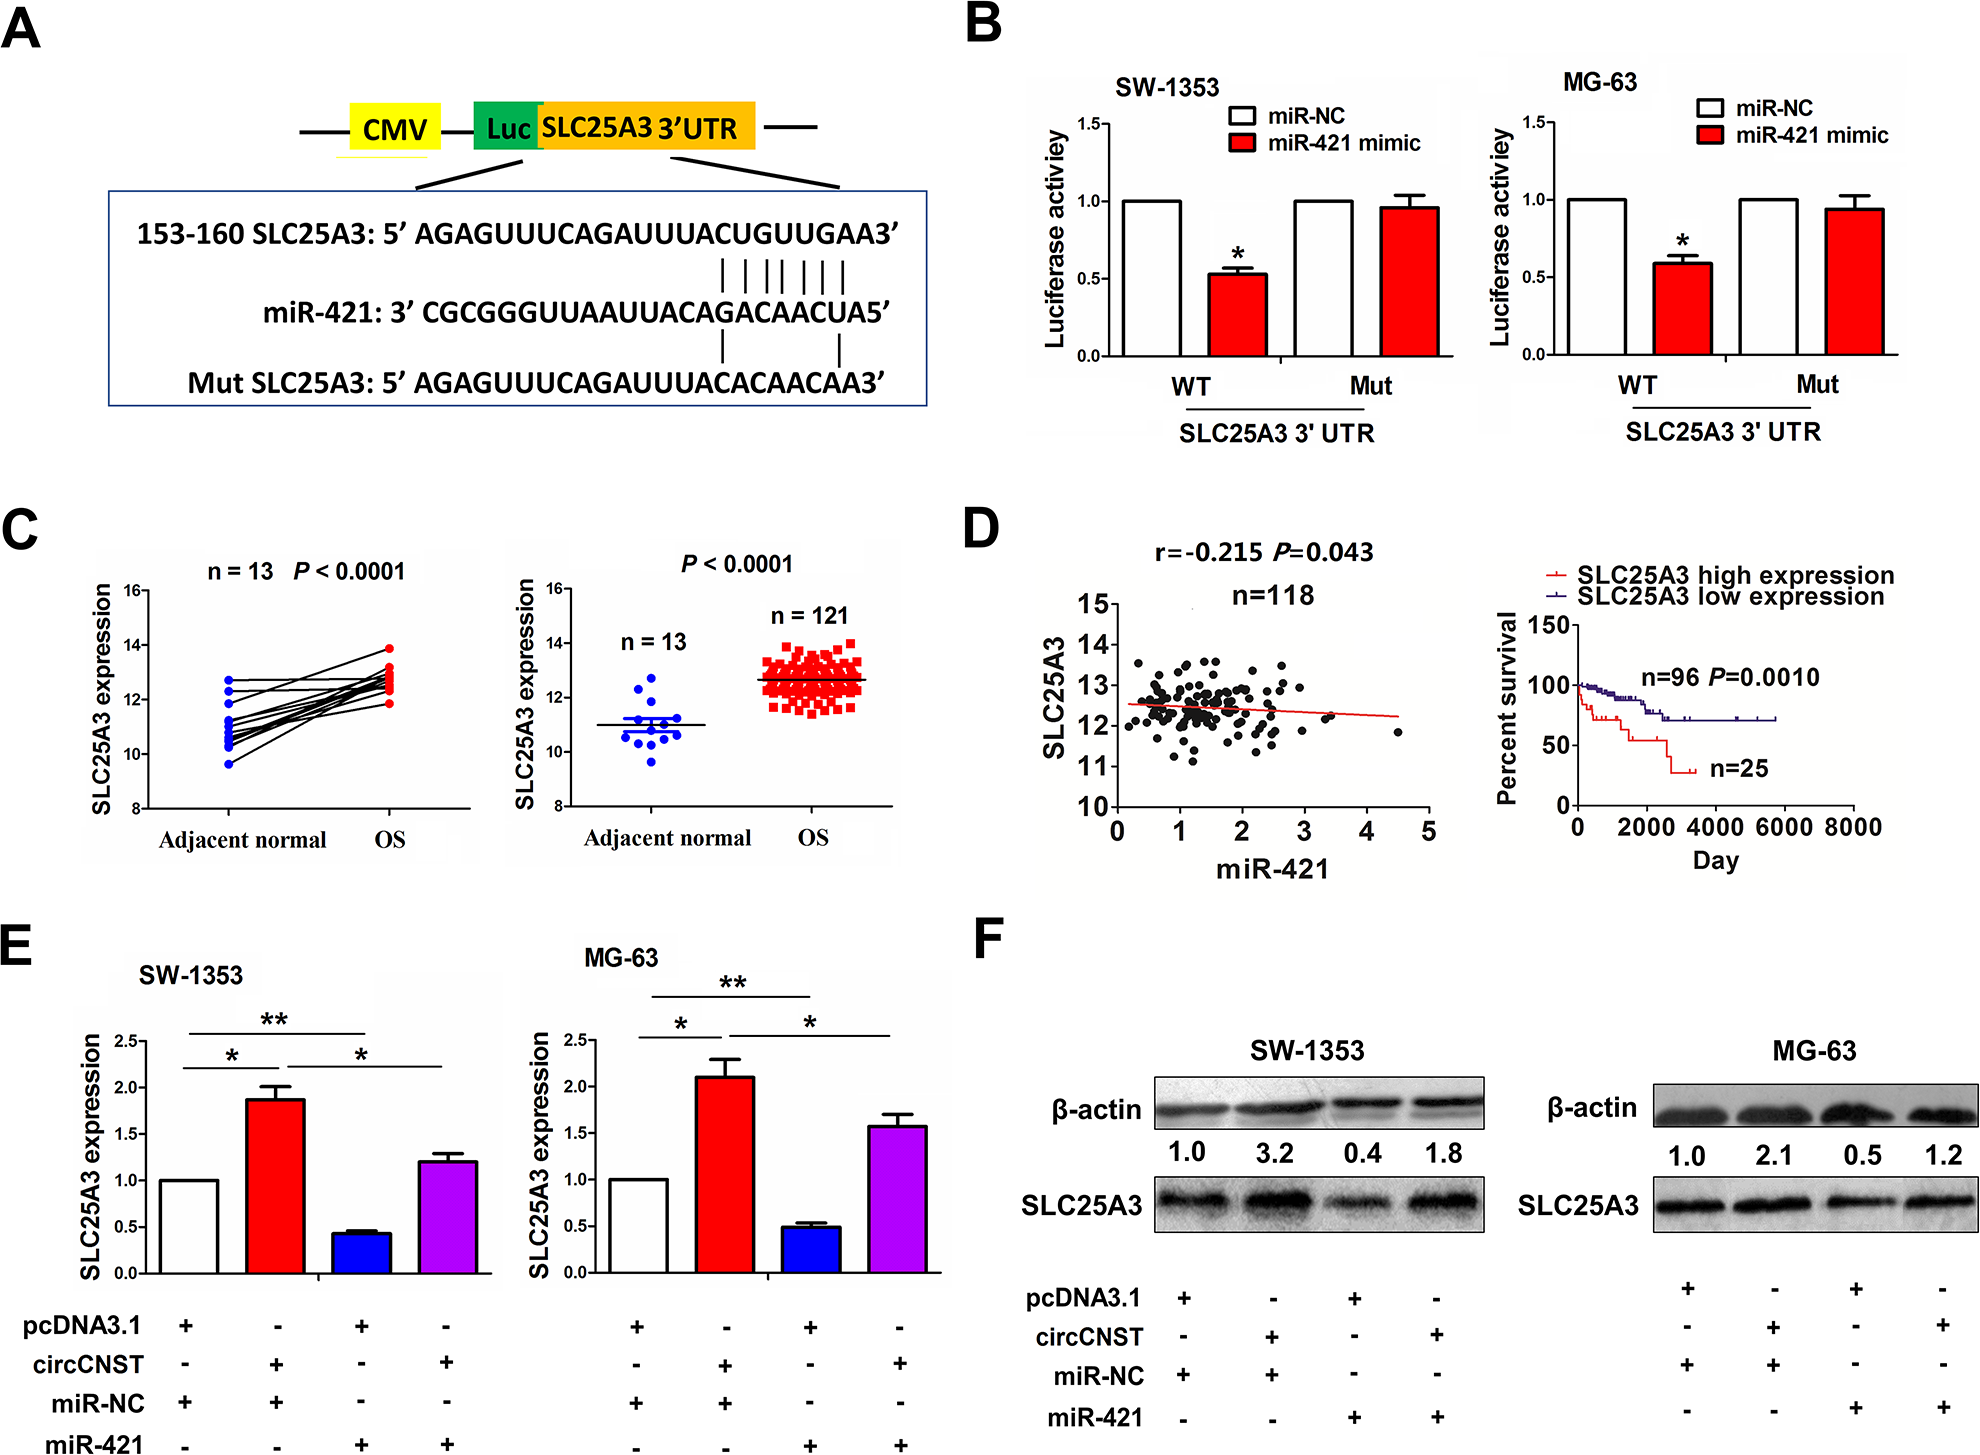
MiR-421 reversed circCNST-induced SLC25A3 expression in OS cells. (A) Schematic representation of the binding sites of miR-421 with WT or Mut SLC25A 3′UTR. (B) The luciferase activity of WT or Mut 3′UTR of SLC25A3 after the transfection with miR-421 mimic in SW-1353 and MG-63 cell lines. (C) TCGA dataset analysis of the expression levels of SLC25A3 in paired and unpaired OS tissues. (D) Pearson’s correlation analysis of the correlation of SLC25A3 expression with miR-421 in OS tissues, and Kaplan–Meier analysis of the association of high or low SLC25A3 expression with overall survival in OS patients. (E, F) qRT-PCR and western blot analysis of the expression levels of SLC25A3 after the co-transfection with circCNST plasmid and (or) miR-421 mimic in SW-1353 and MG-63 cell lines. Data are the means ± standard error of the mean of three experiments. *P < 0.05, **P < 0.01. CNST: consortin; OS: osteosarcoma; qRT-PCR: quantitative real-time polymerase chain reaction; UTR: untranslated region; WT: wild type.
Knockdown of circCNST Inhibited Xenograft Tumor Growth
Having confirmed the tumor-promoting effects of circCNST in vitro, we further estimated its effects on in vivo tumor growth. A subcutaneous xenograft model was constructed by the inoculation with lentivirus-mediated sh-circCNST or sh-NC stably transfected HOS cells. During the tumor growth period, the proliferative activity of xenograft tumors was reduced in the sh-circCNST group as compared with the sh-NC group (Fig. 6A, B). The average volumes and weight in the sh-circCNST group were also lowered as compared with the sh-NC group (Fig. 6C, D). According to the previous reports 16 –18 , Ki-67 is regarded as a proliferating factor in OS patients 16 and OS cells 17 . Especially, Ki-67 is also used for assessing cell proliferation in OS xenograft tumor models 18 . IHC analysis herein showed that the protein expression of Ki-67 was markedly lowered by knockdown of circCNST in tumor tissues as compared with the sh-NC group (Fig. 6E).

Knockdown of circCNST inhibited HOS xenograft tumor growth. (A, B) Representative photographs of xenograft tumor growth after stable transfection with sh-NC or sh-circCNST in HOS cells. (C, D) The average volumes and weight of xenograft tumors in sh-circCNST and sh-NC groups. (E) IHC analysis of the protein expression levels of Ki-67 in xenograft tumors in sh-circCNST and sh-NC groups. Data are the means ± standard error of the mean of three experiments. CNST: consortin; NC: noncoding.
Discussion
Mounting data showed that circRNAs can act as promising biomarkers for patients with OS. Elevated expression of circ_0000502, circ_0001721, and circ_0007534 is considered as an independent prognostic factor of poor prognosis in patients with OS 11,13,14 . Herein, we identified a novel circRNA, named as circCNST, which exhibited a common characteristic of circRNA, such as its resistance to RNase R and localization in the cytoplasm in OS cells and tissues. The expression levels of circCNST were increased in OS tissues as compared with the adjacent normal tissues, and its high expression was positively associated with TS in patients with OS. Multivariate analysis uncovered high circCNST expression as an independent prognostic factor of poor survival in OS patients. In coinciding with the previous studies about circRNA for predicting tumor prognosis 11,13,14 , our study also indicated that circCNST might be a potential biomarker for OS patients.
Functionally, circRNAs can act as oncogenic factors or tumor-suppressive genes in OS. circ_100876, circ_ORC2, and circ_0000502 can promote the growth and invasion and induce cycle progression and apoptosis escape in OS cells 9 –11 . On the other hand, circ_HIPK3 suppresses tumor growth and invasive potential in OS cells 15 . Herein, we further explored the function of circCNST in OS cells and found that knockdown of circCNST repressed cell proliferation and colony formation in vitro and in vivo, but overexpression of circCNST reversed these effects. In consistence with the previous reports about the function of circRNA in cancer 11,13,14 , our study indicated that circCNST might be also a tumor-promoting factor in OS cells.
It is known that one of the regulatory mechanisms for circRNAs is executed by acting as miRNA sponges in cancer 4,5 . Circ_0000502, CDR1as, and circ_0001721 can sponge miR-1238/-7/-599 to accelerate OS cell growth and invasion 11 –13 . Herein, we found that circDLST was colocalized with miR-421 in the cytoplasm and acted as a sponge of miR-421 in OS cells. Some studies showed that the increased expression of miR-421 is related to poor prognosis in non-small-cell lung cancer and esophageal adenocarcinoma 19,20 , and enhances the growth of breast cancer 21 . But miR-421 is downregulated in gliomas, inhibits glucose metabolism, cell invasion, and angiogenesis, and favors the radiosensitivity in glioma and OS cells 22,23 . Herein, we found that miR-421 had a negative correlation with circCNST and its target SLC25A3 in OS tissue samples, and attenuated circCNST-induced proliferation-promoting effects and SLC25A3 expression in OS cells. High expression of SLC25A3 was associated with poor survival in OS patients. Intriguingly, miR-421 can be also ponged by multiple circRNAs such as CircSETD3, circSCAF11, and circ_0001546 to participate in the cancer progression 24 –26 . Our study indicated that circCNST might act by sponging the miR-421/SLC25A3 axis in OS cells.
Taken together, our findings demonstrated that circCNST acted as an independent prognostic factor of poor survival in OS patients, and promoted the tumorigenesis of OS cells by sponging miR-421/SLC25A3 axis (Fig. 7).
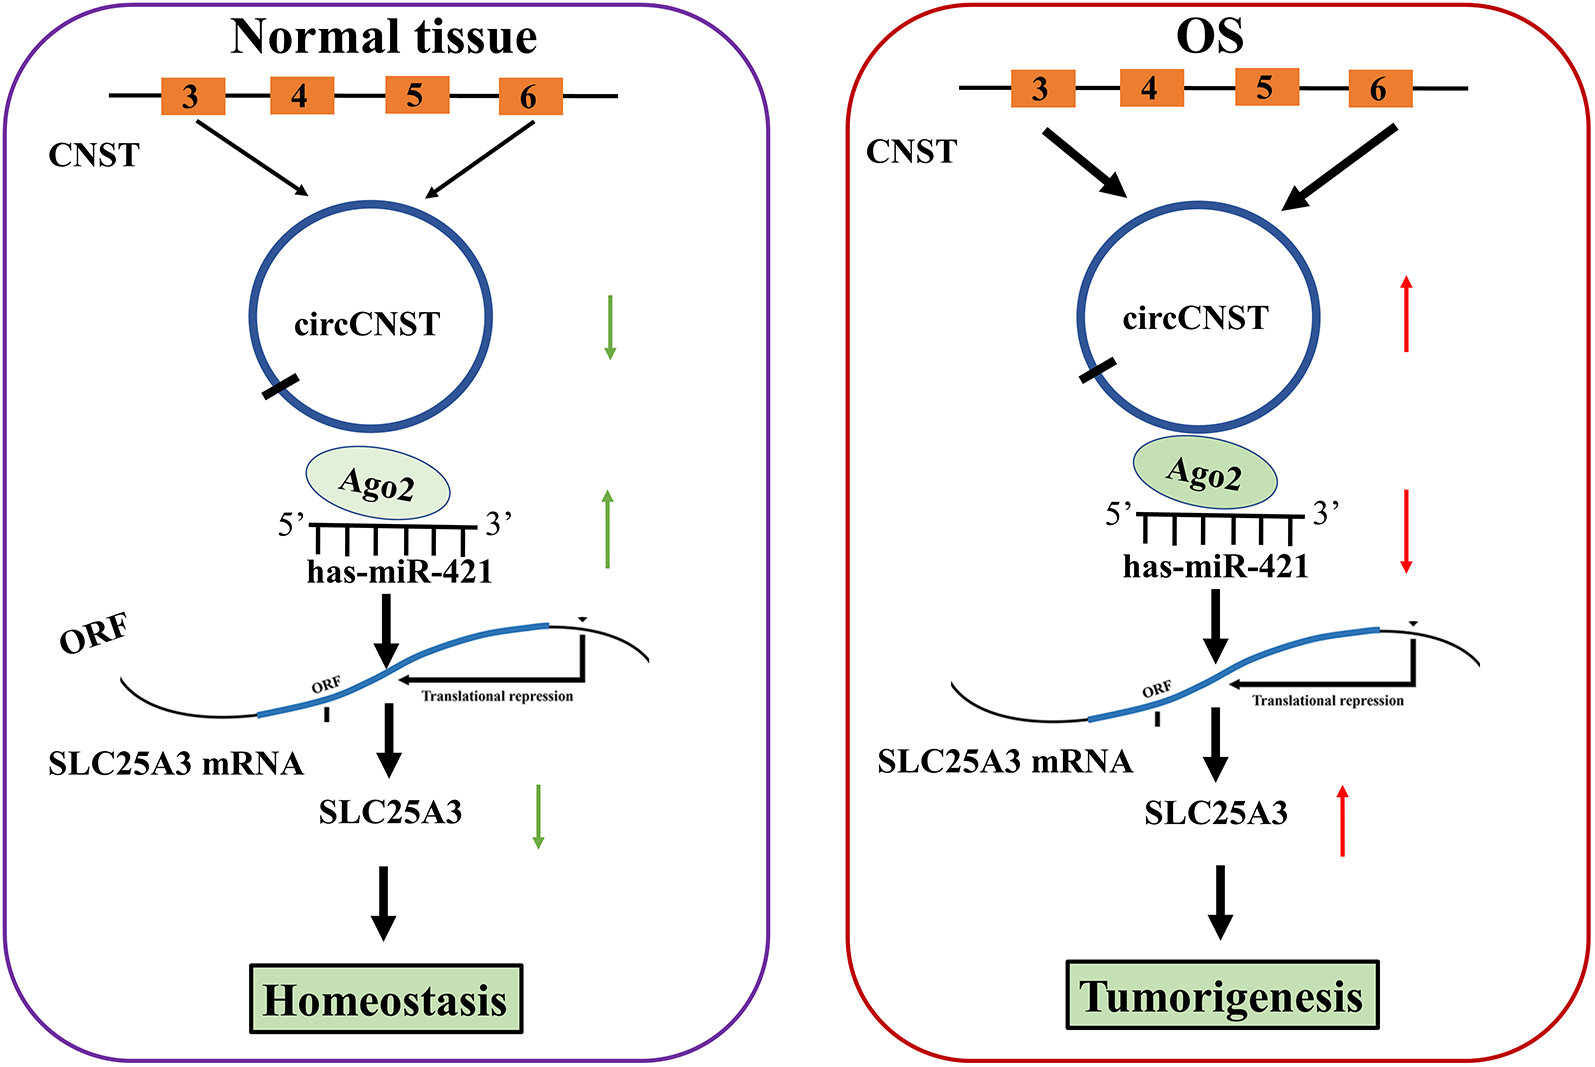
Schematic representation of the proposed mechanism of circCNST in OS cells. CircCNST acted as an miR-421 sponge to upregulate SLC25A3 expression, thereby contributing to the tumorigenesis of OS.CNST: consortin; OS: osteosarcoma.
Footnotes
Authors’ Contributions
FL conceived this study. JW designed and wrote the manuscript. XW and YD collected the samples and performed the experiments. FL analyzed the data and checked the manuscript.
Ethics Approval
Ethical approval was obtained for all experimental procedures from the Ethics Committee of Zhengzhou University, Zhengzhou, Henan, China.
Statement of Human and Animal Rights
All procedures with human subjects or animals in this study were conducted in accordance with the Ethics Committee of Zhengzhou University, Zhengzhou, Henan, China.
Statement of Informed Consent
Verbal informed consent was obtained from the patients for their anonymized information to be published in this article.
Declaration of Conflicting Interests
The author(s) declared no potential conflicts of interest with respect to the research, authorship, and/or publication of this article.
Funding
The author(s) received no financial support for the research, authorship, and/or publication of this article.