
Abstract
Multilineage-differentiating stress-enduring (Muse) cells are a population of pluripotent stage-specific embryonic antigen 3 (SSEA3)+ mesenchymal stem cells first described by Mari Dezawa in 2010. Although some investigators have reported SSEA3+ mesenchymal cells in umbilical cord tissues, none have quantitatively compared SSEA3+ cells isolated from Wharton’s jelly (WJ) and the cord lining (CL) of human umbilical cords (HUCs). We separated WJ and the CL from HUCs, cultured mesenchymal stromal cells (MSCs) isolated from these two tissues with collagenase, and quantified the percentage of SSEA3+ cells over three passages. The first passage had 5.0% ± 4.3% and 5.3% ± 5.1% SSEA3+ cells from WJ and the CL, respectively, but the percentage of SSEA3+ cells decreased significantly (P < 0.05) between P0 and P2 in the CL group and between P0 and P1 in the WJ group. Magnetic-activated cell sorting (MACS) markedly enriched SSEA3+ cells to 91.4% ± 3.2%. Upon culture of the sorted population, we found that the SSEA3+ percentage ranged from 62.5% to 76.0% in P2–P5 and then declined to 42.0%–54.7% between P6 and P9. At P10, the cultures contained 37.4% SSEA3+ cells. After P10, we resorted the cells and achieved 89.4% SSEA3+ cells in culture. The procedure for MACS-based enrichment of SSEA3+ cells, followed by expansion in culture and a re-enrichment step, allows the isolation of many millions of SSEA3+ cells in relatively pure culture. When cultured, the sorted SSEA3+ cells differentiated into embryoid spheres and survived 4 weeks after transplant into a contused Sprague-Dawley rat spinal cord. The transplanted SSEA3+ cells migrated into the injury area from four injection points around the contusion site and did not produce any tumors. The umbilical cord is an excellent source of fetal Muse cells, and our method allows the practical and efficient isolation and expansion of relatively pure populations of SSEA3+ Muse cells that can be matched by human leukocyte antigen for transplantation in human trials.
Keywords
Introduction
Multilineage-differentiating stress-enduring (Muse) cells are a subtype of mesenchymal stromal cells (MSCs) that express stage-specific embryonic antigen 3 (SSEA3). Muse cells can spontaneously differentiate into cells of the endodermal, ectodermal, and mesodermal lineages in vitro, and can be induced to produce cell types from all three lineages and self-renew in vivo without forming teratomas 1 –3 . Muse cells migrate to tissues that express sphingosine-1 4 , integrate into damaged tissues in vivo when administered intravenously 5,6 , differentiate into specific cells needed to repair tissues, and survive over 6 months in animals 7,8 . Muse cells stimulate tissue regeneration and restore functions in many animal models of diseases, e.g., liver diseases 1,3,8 –11 , stroke 7,12 –14 , muscle regeneration 1,15,16 , skin regeneration 1,3,8,13,17 , malignant glioma 18 , and myocardial infarction 4,11,19 . No tumors have been reported after in vivo transplantation of Muse cells into animals 5,8,20 . Muse cells also have low telomerase activity and low expression of cell cycle-related genes compared with embryonic stem (ES) and induced pluripotent stem (iPS) cells 1,2,5,10,13,17,19,21,22 .
Muse cells have several advantages over other stem cells for regenerative medicine. First, they are pluripotent adult stem cells that can self-renew and differentiate into many other cell types to repair a wide variety of tissues. Second, Muse cells have been isolated from many tissues and are available from autologous and allogeneic sources, including fat, bone marrow, adult blood, umbilical cord blood, and umbilical cord. Third, Muse cells can be readily identified by the combined expression of SSEA3 and a mesenchymal marker, such as CD105, CD29, and CD90 1,5 . Because mesenchymal stromal cells attach to and grow well on plastic, nearly 100% of cells cultured on plastic from Wharton’s jelly (WJ) or the cord lining (CL) express mesenchymal markers. Cell culture on plastic effectively purifies a mesenchymal population. Kuroda et al. 21 reported that Muse cells can be sorted and counted from cell cultures grown on plastic based on SSEA3 expression alone. Finally, unlike other pluripotent cells, such as ES or iPS cells, Muse cells do not form teratomas or other tumors. When grown in culture, the self-renewal rate of Muse cells is slower than the production rate of non-Muse differentiated cells, and, therefore, the percentage of Muse cells invariably declines over time in culture.
Many groups have isolated MSCs from the umbilical cord 23 –49 and cord blood 23,50 –55 . SSEA3+ cells comprise 0.03% to several percent of MSCs cultured from goat skin, human dermal fibroblasts, adipose tissue, and bone marrow 3,20 . Fluorescence-activated cell sorting (FACS) is the most popular method to isolate Muse cells but is inefficient and expensive 3 . Other methods include the use of enzymes and other methods to stress the cells, thereby relying on the stress-resistance of Muse cells to enable cell survival while other cell types die. In mesenchymal cell populations purified by these methods, only 11.6% of cells formed Muse cell clusters 1,3,6 .
We describe below a method to efficiently and inexpensively purify and grow large numbers of healthy Muse cells from MSCs isolated from the human umbilical cord (HUC) using magnetic-activated cell sorting (MACS) to isolate SSEA3+ cells 56 , expansion in culture, and a second MACS procedure to purify the cell population to >90%. Our method has several advantages. First, the method is gentle and does not damage the cells. We attached the SSEA3 antibody to magnetic beads purchased from Miltenyi Biotec (Bergisch Gladbach, Germany), and these antibody-coated beads bind to SSEA3 on the cell surface and move the cells towards magnets applied to the container walls, allowing SSEA3-negative cells to pass through. Second, the method is very efficient, allowing billions of cells to be sorted in a matter of minutes. Third, the method preserves non-Muse cells, allowing them to flow through for analysis or re-sorting or for use as control cells for comparison with Muse cells. Fourth, CD34+ cells sorted by MACS have been used in clinical trials for some time 57 . Finally, the method yields a relatively high purity (>90%) of SSEA3+ cells. Two previously published studies used MACS to isolate 77.1% and 71.3% Muse cells 14,58 .
Materials and Methods
From 6 to 31 January 2017, StemCyte Inc. (Covina, CA, USA) shipped eight HUCs to the W.M. Keck Center for Collaborative Neuroscience, Rutgers, the State University of New Jersey (Piscataway, NJ, USA). Every cord was packed in a bottle filled with the transport medium, which included KH2PO4 (0.20 g/L, Sigma-Aldrich P5655, St. Louis, MO, USA), Na2HPO4 (anhydrous, 1.15 g/L, Sigma-Aldrich 71640), KCl (0.20 g/L, Sigma-Aldrich 746436), and NaCl (8.00 g/L, Sigma-Aldrich 793566). The bottle was surrounded by ice to maintain it at 4°C. All the cords were collected with patient consent in accordance with the requirements of the Rutgers University Ethics Committee. The shipment from the patient to the laboratory took one day.
Antibodies Used in This Study.

HUC MSCs were isolated according to a protocol developed by Yu-Show Fu, as illustrated in Fig 1. Briefly, after removal of blood vessels, the mesenchymal tissue was scraped off from WJ with a scalpel and centrifuged at 250 x g for 5 min at room temperature (RT), and the pellet was washed with serum-free Dulbecco’s modified Eagle’s medium (DMEM, Gibco, 11330-032, Waltham, MA, USA). Next, the cells were treated with 2 mg/ml collagenase type I solution (Sigma-Aldrich SCR103) for 16 h at 37°C, washed, and treated with 2.5% trypsin (10x) (Thermo Fisher Scientific, 15090046, Waltham, MA, USA) for 30 min at 37°C with agitation. Finally, the cells were washed and cultured in cell culture medium supplemented with 10% fetal bovine serum (FBS, Gibco 10437-028) in a 37°C incubator with 5% CO2, and the dishes were labeled with the cell passage, name, and date.

Human umbilical cord (HUC) processing procedure. (A) Bottle for delivering the HUC. (B) Place the HUC in a 10-cm dish. (C) Cut the HUC into smaller 1-cm pieces. (D) Incise the HUC pieces longitudinally. (E) Remove the HUC artery and vein and clean the HUC tissues. (F) Separate Wharton’s jelly (WJ, left dish) and cord lining (CL, right dish) tissues. (G) Treat the tissues with collagenase, and seed the cells into cell culture flasks.
Cell Culture and Passage
The first seeding of cells from WJ or CL tissue was named passage 0 (P0), and the next two passages were named P1 and P2. We analyzed the percentage of SSEA3-positive cells in the first three passages. The culture medium contained 10% FBS (Gibco, 10437-028), 2 mM GlutaMAX (Gibco, 35050-061), 1% penicillin-streptomycin (Gibco, 15140-122), 1 ng/mL human basic fibroblast growth factor (bFGF, PeproTech, 100-18B, Rocky Hill, NJ, USA) and DMEM/F12 (Gibco, 11330-032) to 250 mL. We passaged the cells when they reached 90% confluency using TrypLE™ Express (Gibco, 12604-013) to release adherent cells from the cell culture dish.
Immunocytochemistry
The cells were plated at 2 × 10⁴ cells/well in a 24-well plate with a round cover slip (Thermo Fisher Scientific, 1254580) in each well. After plating, the cells were fixed with 4% paraformaldehyde (0.5 mL/well), incubated at RT for 10 min, washed three times with PBS, incubated for 30 min with 5% normal goat serum in PBS without (for surface markers) or with 0.3% Triton X-100 (for Ki-67; Sigma-Aldrich 234729) to block nonspecific antibody binding and incubated with primary antibody overnight at 4°C. The cells were washed three times with PBS and incubated with secondary antibodies for 30 min at RT, and then with Hoechst 33342 nuclear stain (Thermo Fisher Scientific 62249) for 10 min.
Flow Cytometry
The cells (∼0.3 × 10⁶) were incubated in a 1.5 mL microcentrifuge tube with primary antibodies. For SSEA3, the incubation times were 1 h at 4°C for the primary antibody, and 30 min at 4°C for the secondary antibody. For the other antibodies from Miltenyi Biotec (Bergisch Gladbach, Germany), the incubation time was 10 min. Before loading, we added 2.5 µL of 100 μg/mL propidium iodide solution (Miltenyi Biotec 130093233) to 500 μL of cell suspension to label nonviable cells. An isotype control was used in the control group. We used the MACSQuant Analyzer 10 Flow Cytometer (Miltenyi Biotec) equipped with ten fluorescent channels to perform cell sorting and counting and to generate the graphs.
Magnetic-Activated Cell Sorting
Almost all human mesenchymal cells grown on plastic plates express CD105. MACS can be used to positively select for SSEA3+ cells. We loaded ∼6 × 10⁶ cells suspended in 2 mL into a magnetic sorter (MS) column (Miltenyi Biotec 130042201). We added first the SSEA3 antibody and then the anti-rat kappa microbeads (Miltenyi Biotec 130047401) and collected the eluted fraction for analysis on the MACSQuant 10 flow cytometer. The MS column should not be loaded with more than 6 × 10⁶ stained cells suspended in 2 mL. The MS column was washed with 3 × 1 mL degassed buffer. In the elution step, we pipetted 2 mL of buffer into the MS column, waited 3 min, and then firmly pushed the plunger to expel the magnetically labeled cells. The antibodies used in this study are listed in Table 1.
Doubling Time
To determine the cell doubling time (TD), we plated the cells at a density of 5 × 10³ cells/cm2 and calculated the TD using the following equation (http://www.doubling-time.com):

where N0 is the number of cells inoculated, Nt is the number of cells harvested, and t is the culture time in hours. We calculated the TD of each sample of Muse cells and non-Muse cells.
Statistical Analysis
We used SPSS (IBM, R23.0.0.0, Armonk, NY, USA) to assess differences among groups using one-way analysis of variance (ANOVA). Post hoc analysis of comparisons among groups was performed using the least significant difference (LSD). The results are expressed as the mean ± standard deviation (SD), unless otherwise noted. A probability (P-value) of <0.05 was considered significant. We used AxioVision Rel. 4.8.0 SP2 and ZEISS LSM Image Browser (Version 4.2.0.121, Zeiss, Wetzlar, Germany) to obtain pictures.
Results
Both WJ and the CL of HUCs yielded large numbers of MSCs. Table 2 shows the number of MSCs and SSEA3+ cells at P0. The average concentrations of MSCs and SSEA3+ cells per gram of tissue were (3.70 ± 0.55)×104 WJ-MSCs, (1.89 ± 1.67)×103 WJ-SSEA3+ cells, (3.00 ± 0.80) × 104 CL-MSCs, and (2.24 ± 2.00)×103 CL-SSEA3+ cells. Heavier cords had more WJ-MSCs (R2 = 0.64, P = 0.01 < 0.05, Fig 2). The 99WJ group had an unusually high percentage of SSEA3+ cells at P0 (42.37%). However, cord weight did not correlate with the percentage of CL-MSCs, WJ-SSEA3+ cells, or CL-SSEA3+ cells. The number of WJ-MSCs did not correlate with that of CL-MSCs or WJ-SSEA3+ cells, nor was there a correlation between the number of CL-MSCs and that of CL-SSEA3+ cells.
The Records of the Eight HUCs Showed the Numbers of MSCs and SSEA3+ Cells at Passage 0.

aThe MSCs were not successfully derived from CL tissues of No. 19 and 08.
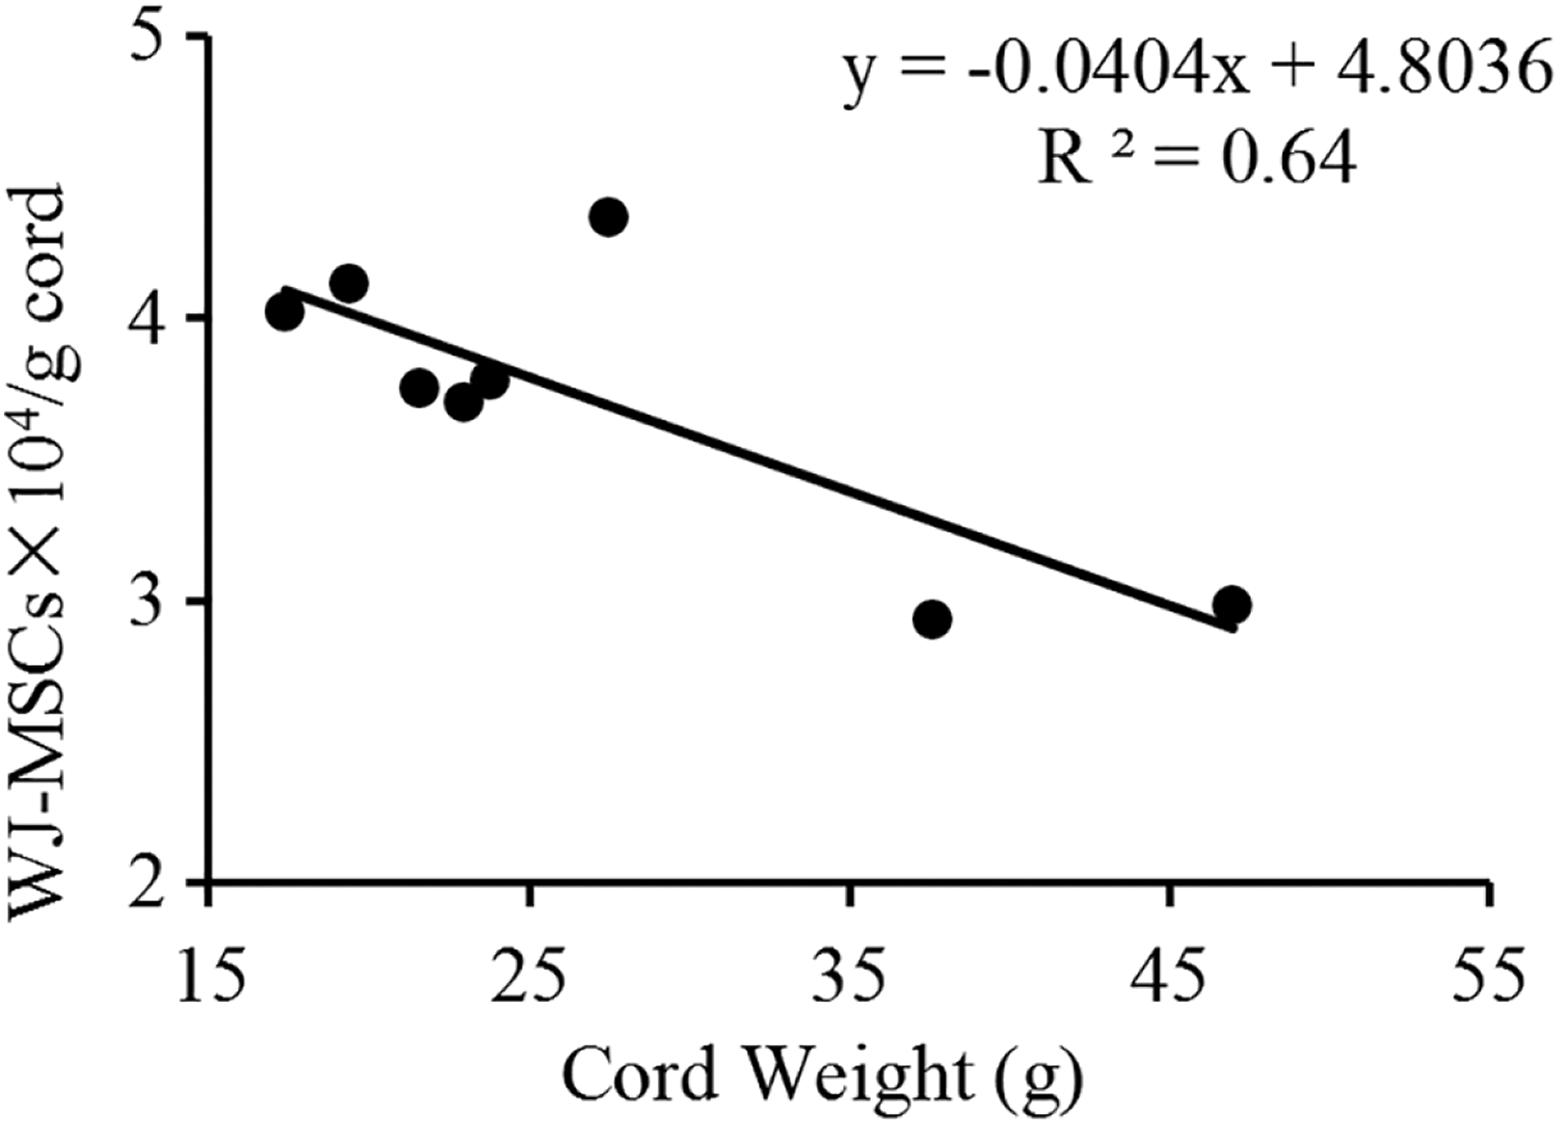
Linear relationship between the number of WJ-MSC cells and cord weight (grams).
We cultured WJ and CL cells separately and compared the SSEA3+ percentage over multiple passages (Fig 3). In the P0 group, more than 98% of all cells from both WJ and the CL were CD105 positive, and this percentage was even higher in the P1 and P2 groups. At P0, the percentages of SSEA3+ cells were 4.97% ± 4.30% and 5.26% ± 5.14% in WJ and the CL, respectively. However, the SSEA3+ percentage dropped sharply between P0 and P2 in the CL group and between P0 and P1 in the WJ group.

(A) Cord lining (CL) cells. (B) Wharton’s jelly (WJ) cells. Gray bars indicate the percent of cells expressing CD105+. Black bars indicate the percent of cells expressing both CD105 and SSEA3. The numbers refer to different samples. P0, P1, and P2 indicate passages 1, 2, and 3, respectively. One-way ANOVA showed that the SSEA3+ percentage dropped sharply between P0 and P1 in the CL group and between P0 and P2 in the WJ group (P<0.05).
The WJ-MSCs and CL-MSCs had similar morphology (Fig 4); they were spindle-shaped or triangular with a large oval nucleus in the center of the cell body and one or several nucleoli. As shown in Fig 4B, the tissue was seeded in the red circle, from which the MSCs grew. Fig 5A1 shows that all cells were CD105 positive, and Fig 5A2 shows that the SSEA3+ cells often had long, thin processes and tried to make connections with surrounding cells. The flat cell bodies had an irregular shape but could be as large as 30 × 100 µm. Fig 5A3 shows large oval nuclei of up to 20 µm in diameter. Fig 5B shows that dividing cells had smaller and rounder cell bodies but maintained their typical membrane SSEA3+ staining. Both WJ- and CL-derived MSCs were CD105+, CD90+, CD73+, CD44+, CD166+, CD29+, CD45– and CD14– (Fig 6).

(A) Phase contrast image of Wharton’s jelly cells. (B) Phase contrast image of cord lining cells. The tissue was seeded in the dashed and red circles, from which the MSCs grew. Scale bar, 100 µm.

Immunofluorescence images of CD105 (red), SSEA3 (green), and Hoechst 33342 (blue) staining of cultured cells from 96WJP2. (A1) CD105-labeled cells; (A2 )some giant SSEA3+ cells with long and very thin processes contacting each other; (A3) nuclei stained with Hoechst 33342.; (A4) merged images. (B) CD105+ and SSEA3+ cells that appear to have just completed dividing. A Zeiss confocal 510 microscope was used to take these pictures at 40X. Scale bar, 20 μm (A) or 5 μm (B).
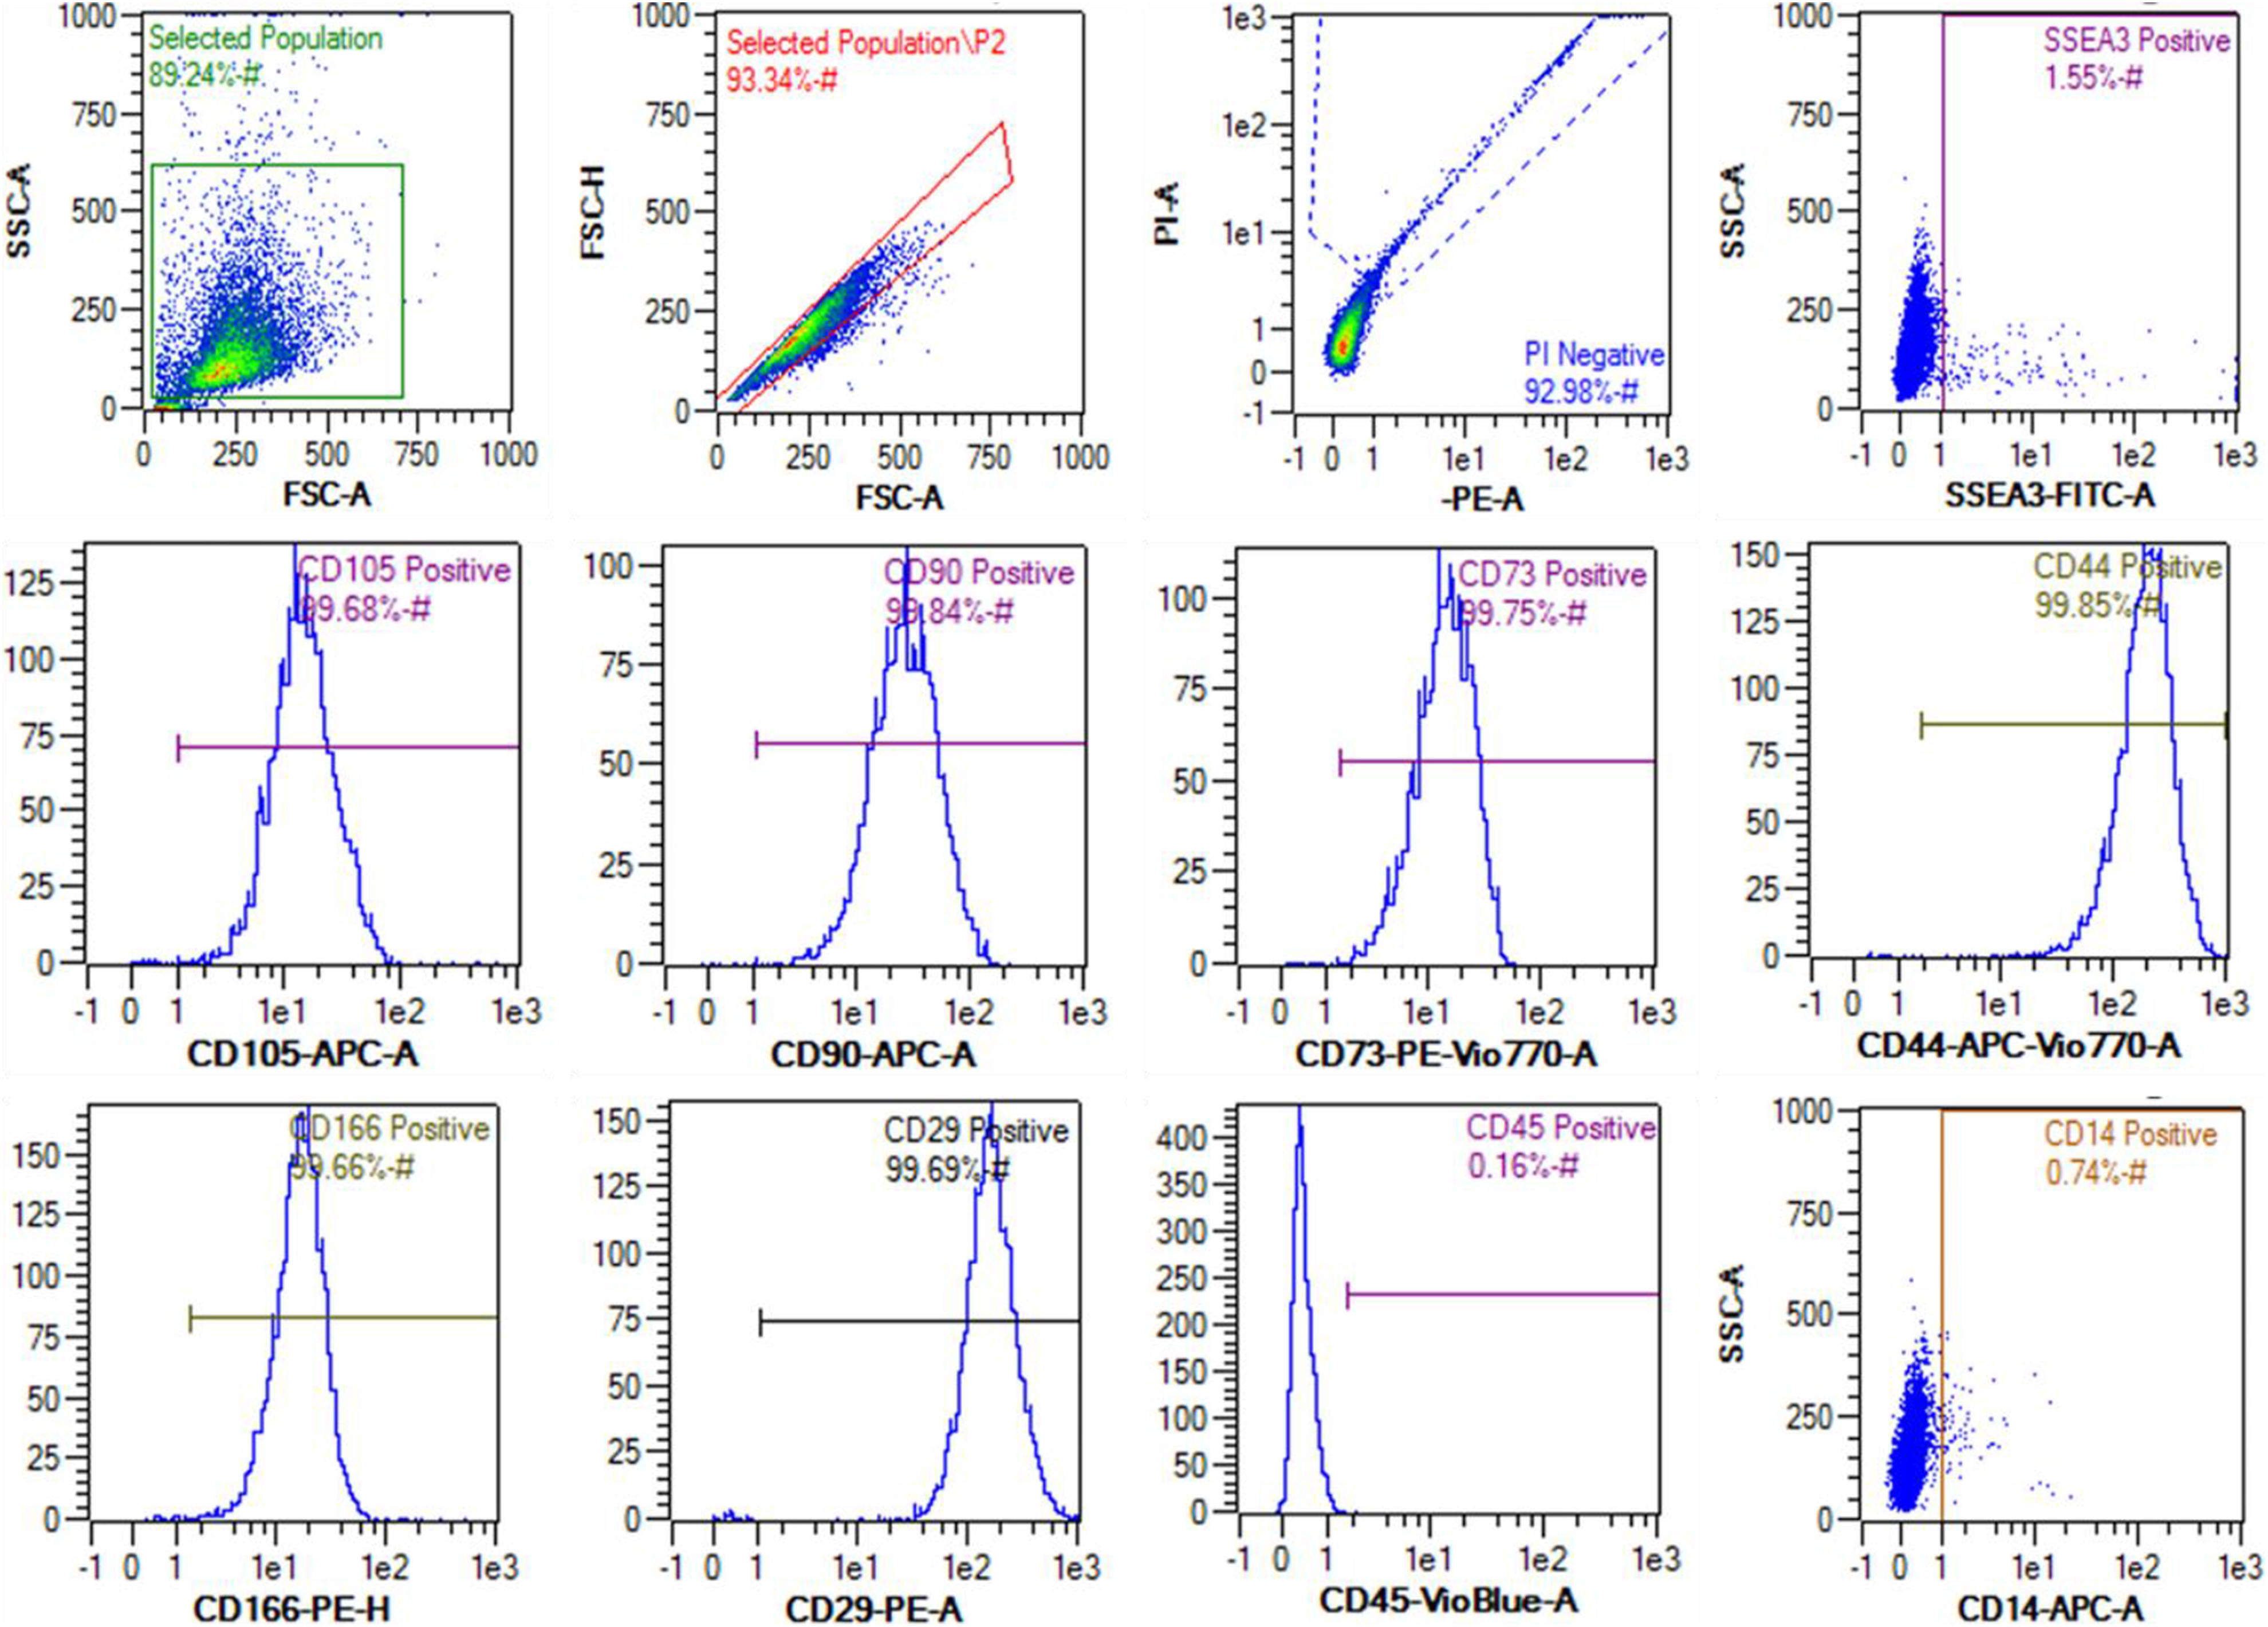
Flow cytometry analysis of HUC-derived MSCs from 96WJP2. We used SSC-A and FSC-A to gate cells from debris and FSC-H and FSC-A to gate single cells from cell clusters. Then, PI staining was used to exclude dead cells. The results showed that 92.98% of the total cell population was alive and in a single-cell suspension, 1.55% was SSEA3+, and over 99% was CD105+, CD90+, CD73+, CD44+, CD166+, CD29+, CD14– and CD45–.
We cultured frozen 96WJP2 cells, which showed an increase in SSEA3+ cell percentage from 3.91% to 28.27%. Another culture of frozen 96WJP2 cells had 20.62% SSEA3+ cells, confirming this phenomenon of an increased percentage after freezing. Thus, the freezing process (severe environment) may induce higher Muse cell percentages. Cells in each passage from 96WJP2 to 96WJP10 were subjected to MACS.
We used MACS to sort (1.23 ± 0.38) × 105 cells from 1 million MSCs (Table 3). Of the sorted population, 91.44%±3.22% were SSEA3+ cells, demonstrating the efficiency of this method. For 96WJP3, the sorting rates were 94.19% and 95.24%, and the average rate for the other groups was 28.31% ± 6.11%, indicating that approximately 28.31% of all SSEA3+ cells were sorted from the MSC population. Further analysis by flow cytometry showed that the sorted population expressed SSEA3 more strongly than the nonsorted population. In 96WJP8, the percentage of SSEA3+ cells in the MSC population dropped to 28.10%, suggesting that previous passages should be used. Further analysis showed that the sorted cells were SSEA3+, CD105+, CD90+, CD29+, CD44+, CD73+, CD166+, CD14–, and CD45– (Fig 7).

Flow cytometry results of SSEA3+ cells from 96WJP2 subjected to MACS. The sample was analyzed immediately after sorting. In total, 89.84% of all cells were alive and in a single-cell suspension. Of the sorted population, 92.31% were SSEA3+, while the other 7.27% appeared to be debris according to the diameter. Over 99.5% of the population was CD105+, CD29+, CD90+, CD73+, CD44+, CD166+, CD14– and CD45–.
MACS Performances from 96WJP2 to 96WJP10.

aSorting rate (%) =Number of sorted Muse cells/Number of Muse cells before MACS ×100%
We also monitored the SSEA3+ cell percentage in MACS-sorted 96WJP2 cells over 10 passages (Fig 8). Immediately after MACS, 93.8% of the cells were SSEA3+. In the first passage after MACS, the percentage of SSEA3+ cells decreased to 14.8%, but the SSEA3+ cell population rebounded, and the cultures maintained 62.48%–75.96% SSEA3+ cells from P2 to P5. The percentage decreased to 42.03%–54.73% from P6 to P9, and the P10 culture had 37.35% SSEA3+ cells. After P10, we resorted the cells and achieved 89.40% SSEA3+ cells. The MACS-culture-MACS process can yield many millions of Muse cells.

Change in percentage of SSEA3+ cells after MACS in the following ten passages. 96WJ-P2-MACS-P0 indicates the cell population immediately after magnetic sorting, and 93.77% of the total population was SSEA3+ but CD14–. The other 6.19% appeared to be debris according to the diameter. Then, the sorted cells were cultured, and cells of the next passage were collected every 4 days. The SSEA3+ percentage decreased to 14.8% in the first passage but ranged from 62.5% to 75.9% between P2 and P5 before declining to 42.0%–54.7% between P6 and P9. At P10, the cultures still contained 37.3% SSEA3+ cells. After P10, we resorted the cells and achieved 89.4% SSEA3+ cells. In all passages, the CD105+ percentage remained over 99.0%.
Finally, we transplanted HUC-derived SSEA3+ and CD105+ cells into the spinal cord of two adult Sprague-Dawley rats at 2 weeks after spinal cord injury (SCI) with a 12.5-mm T11 weight drop contusion. Muse cells (4 × 10⁵) were injected into the dorsal root entry zone of the spinal cord at four points an equal distance above and below the injury site. As shown in Fig 9, the cells survived for 4 weeks after transplantation in rats that were not immunosuppressed. The transplanted cells were stained with an antibody for the human nucleus (STEM101+) but were otherwise negative for Nestin, GFAP, NeuN, NF155, and Iba1. The immune tolerance of the rat for these cells and the long-term survival of the cells transplanted into the spinal cord are characteristics of Muse cells transplanted into brain 13,14 .

(A) The diagram on top left indicates the injection sites from the dorsal surface and the side view. (B) A horizontal section of the spinal cord at 4 weeks after transplantation of SSEA3+ HUC cells into dorsal entry zones of the spinal cord above and below the injury site. The sections were stained with STEM101 (anti-human nuclear protein, red) and Hoechst 33342 (blue). Scale bar, 500 µm. The dashed circle indicates the injury site. (C) An image obtained under a Zeiss confocal 510 microscope at 40X showing the HUC cells. Scale bar, 10 µm.
Discussion
Our results showed the presence of numerous SSEA3+ and CD105+ double-positive cells in both WJ and CL tissues. SSEA3 is a pluripotent cell surface marker. According to Dezawa 3 , SSEA3+ and CD105+ cells are likely to be Muse cells. However, the percentage of SSEA3+ cells quickly decreased after 2–3 passages, suggesting that non-Muse (i.e., SSEA3-) cells divide faster than SSEA3+ cells. Approximately 65% of the MSCs (CD105+) were positive for Ki-67 (see Fig 10).

Ki-67 staining of 96CLP1 cells. (A) Hoechst, (B) Ki-67, (C) Merge. Ki-67 is a nuclear protein and marker of proliferating cells. Approximately 65% of all cells were Ki-67+, indicating that population was actively proliferating. Scale bar, 50 μm.
The TD is shown in Table 4 for some cell populations in the first three passages. The TD of non-Muse cells was stable, and statistical analysis showed no significant difference between CLP1 and CLP2 (P = 0.18) or between WJP1 and WJP2 (P = 0.12). Most SSEA3+ cells remained in G0 in the absence of stimulatory factors. The negative numbers in Table 4 indicate that the cells did not divide at all. In the MACS-sorted SSEA3+ cell populations (Fig 11), the TD averaged 30.9 ± 9.2 h, nearly the same as that of human fibroblasts. The TD increased with more passages, while the percentage of SSEA3+ cells decreased. Fig 11 shows that after the first round of MACS, cells in P2–P7 appear to be the best for re-sorting for transplant experiments.
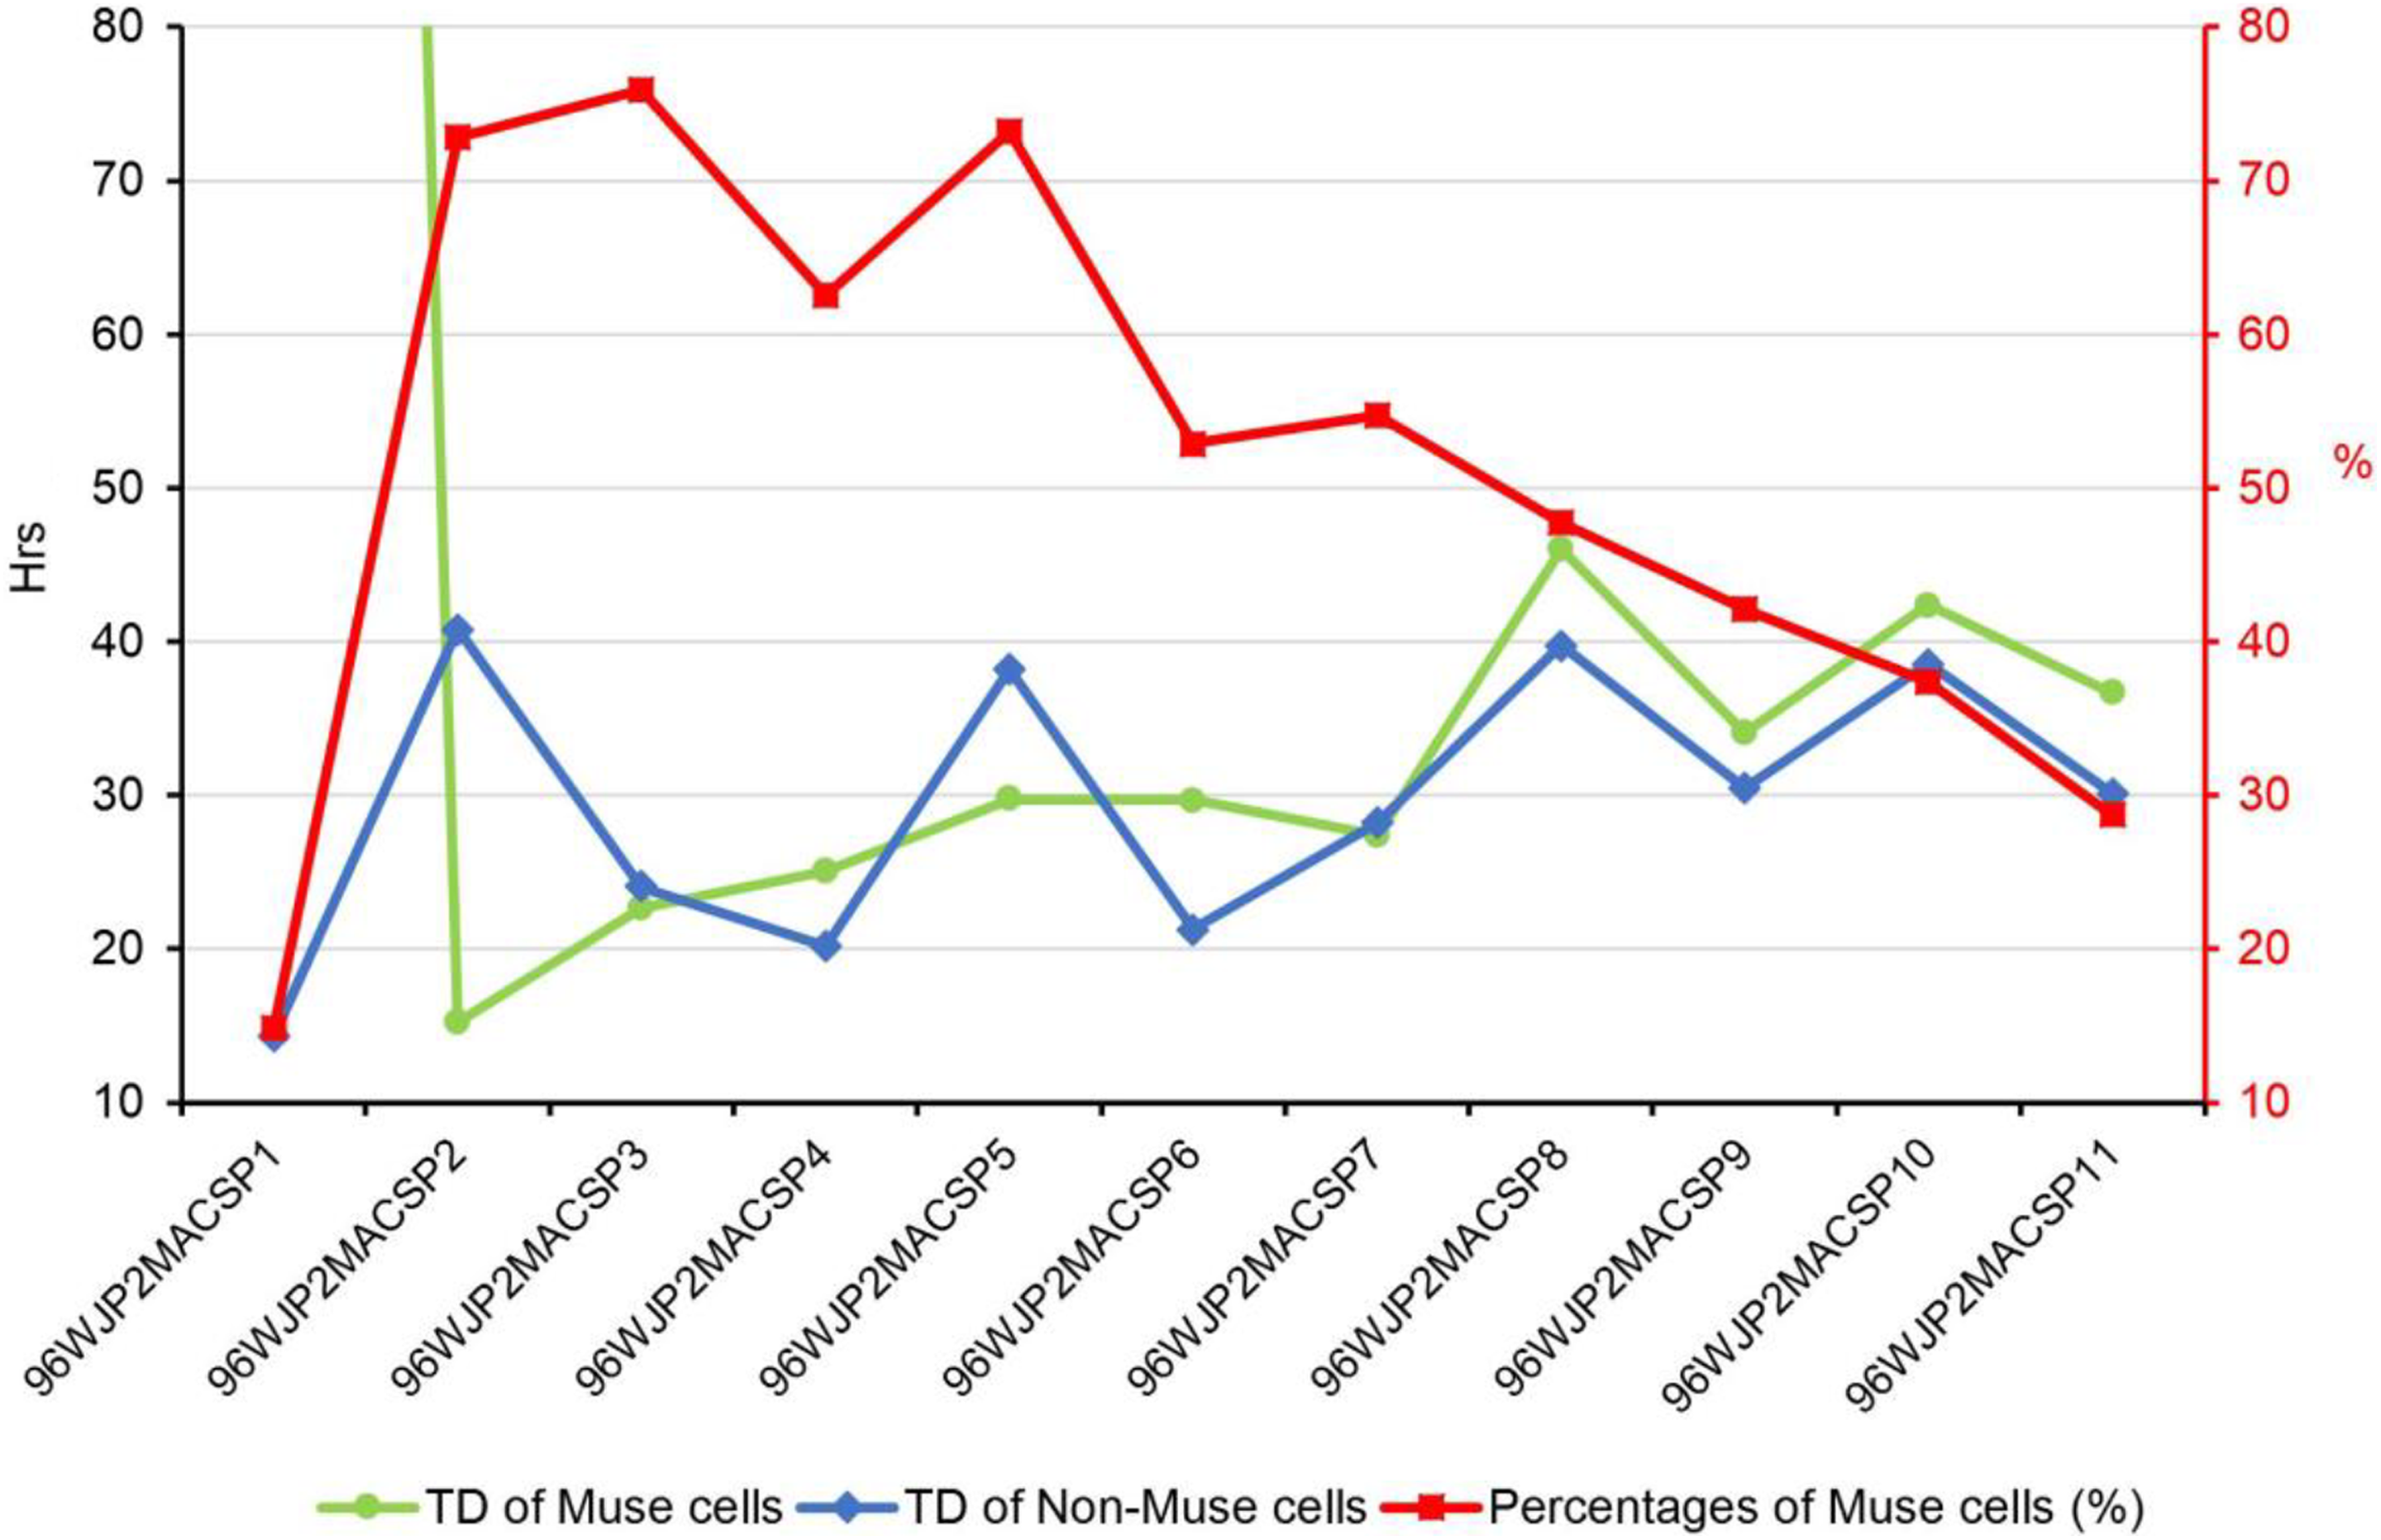
Doubling time (TD) of Muse and non-Muse cells at P1 to P10 after MACS. The left axis indicates hours for the doubling of Muse cells (green) and non-Muse cells (blue). The right axis (red) indicates the percent of Muse cells (red). The TD in P1 was 403 h for Muse cells, indicating that they were barely proliferating, and 14.4 h for non-Muse cells. The TD of Muse cells was 24.9 ± 5.4 h from P2 to P7, indicating that the number of Muse cells doubled approximately every day, and increased to 39.8 ± 5.4 h from P8 to P11. For non-Muse cells, the TD was rather stable at 31.2 ± 7.8 h from P2 to P11. Considering the percentage of Muse cells in the total population, P2 to P7 were the best passages to be resorted to acquire millions of Muse cells.
Doubling Times for the First Three Passages of WJ and CL Cells (Hours).
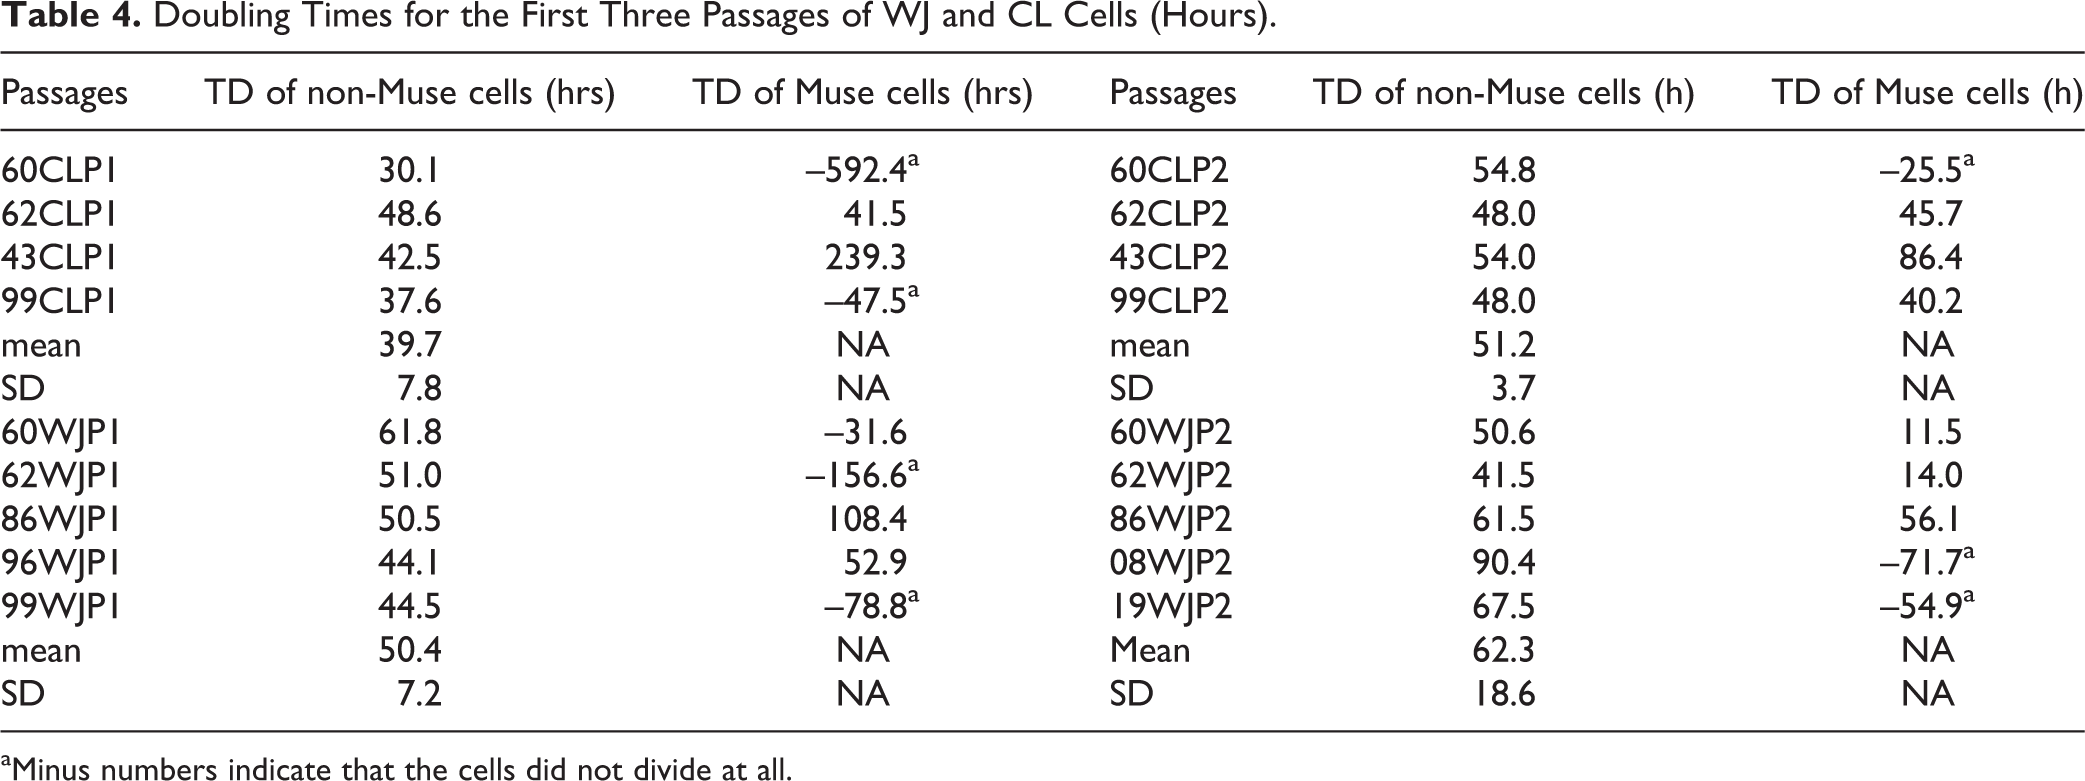
aMinus numbers indicate that the cells did not divide at all.
In this study, MACS using MS columns efficiently isolated SSEA3+ cells from WJ and CL tissues. Before sorting, <5% of the cells were SSEA3+, but after MACS, 91.44% ± 3.22% of the cells were SSEA3+. Only Muse cells with strong SSEA3 expression (∼28.31%) were isolated. Our experience suggests two guidelines for the sorting procedure: (1) Do not load the column with more than 6 million cells, and load the cell suspension in a 2 mL volume rather than the suggested 0.5 mL to avoid the cells sticking to the column. (2) In the elution step, pipette 2 mL rather than 1 mL of the buffer onto the column, and wait 3 min before applying the plunger.
As shown in Fig 5, individual SSEA3+ cells showed typical membrane staining, while previous studies showed only cell clusters with SSEA3 staining. While the average size range of most human cells is 2–120 μm, SSEA3+ cell bodies are 25–90 μm, similar to the size of macrophages (20–80 μm), and the nucleus is approximately 20 μm. Some Muse cells had very large cell bodies, up to 110 μm in length. In contrast to non-Muse cells, Muse cells have many long processes that extend towards surrounding cells. Dividing SSEA3+ cells have round and much smaller cell bodies of 10 μm, while the nucleus is ∼7 μm.
MACS-sorted SSEA3+ cells cultured on polyHEMA-coated dishes formed small SSEA3+ cell clusters on day 2 after plating (Fig 12) and many large clusters 7 days later. We isolated these clusters and cultured them in non-polyHEMA-coated wells for 8 h; the cell clusters attached to the plate and stained SSEA3+ (Fig 12). One study 59 suggested adding Triton X-100 to the blocking solution for immunohistological staining of Muse cells, but our samples showed no SSEA3 signal after treatment with 0.3% Triton X-100. Triton X-100 is a detergent that permeabilizes lipid membranes, so the results confirm that SSEA3 is expressed on the cell surface.

Muse cell clusters on polyHEMA-coated dishes. (A) On day 2 after seeding the cells, clusters had formed but were no more than 50 μm in diameter. (B) On day 7, many clusters had formed with a diameter of approximately 100 μm. (C) Immunocytochemistry of the clusters that were transferred onto coverslips and cultured for 8 h. (C1) CD105 (red), (C2) SSEA3 (green), (C3) Hoechst 33342 (blue), (C4) Merge. Almost all the cells were CD105+, and approximately half were SSEA3+. (D, E) Two images obtained under a Zeiss confocal 510 microscope at 40X showing the sorted Muse cells after culture for 2 days. Scale bars: 50 µm (A, C), 100 µm (B), 10 µm (D), and 20 µm (E).
We also cultured the sorted Muse cells in a neural precursor cell culture medium: 2% B-27 supplement (Thermo Fisher Scientific 17504-044), 2 mM GlutaMAX (Thermo Fisher Scientific 35050-061), 30 ng/mL bFGF (PeproTech 100-18B, Rocky Hill, NJ, USA), 30 ng/mL EGF (PeproTech AF-100-15), 1% penicillin-streptomycin (Thermo Fisher Scientific 15140122) and Neurobasal medium (Gibco 21103049). It took 7 days to induce differentiation into neural precursor cells that formed specific spheres positive for Nestin, NeuN, GFAP and NF-155 (see Fig 13), indicating that the induction was successful and that the neural precursor cells were multipotent.

Expression of neural and glial markers in embryoid bodies cultured on polyHEMA-coated dishes for 7 days in induction medium. The sample was from 96WJ-P2-MACS-P0, and the cells formed neural spheres with a diameter of 60–100 μm after 7 days of induction. The left four images show NeuN (A1), Nestin (A2), Hoechst 33342 (A3), and merge (A4). The right four images show GFAP (B1), NF-155 (B2), Hoechst 33342 (B3), and merge (B4). Scale bar, 20 µm.
SSEA3 expression on the transplanted cells could not be determined because rats are the host species of the SSEA3 antibody. This pilot experiment, however, clearly showed that Muse cells were not immune rejected in the first 4 weeks. Other studies have shown that human Muse cells survive transplantation and are not immune rejected in FSGS-BALB/c mice at 5 weeks 22 . Once the Muse cells differentiate into other cell types, they apparently do not survive without immunosuppression 21 . Muse cells have immunomodulatory effects 60 . A similar phenomenon was reported in a study of MSCs in a rat myocardial infarction model, in which the MHC profile changed, and the immunomodulatory function of allogeneic MSCs was lost upon differentiation into myocardial cells 61 . Immunosuppressants may be required for longer survival of Muse cell progeny. Migration appears to be guided by S1P–S1PR2 18 , which mediates the homing of Muse cells into the damaged heart for long-term tissue repair and functional recovery after acute myocardial infarction.
Our finding that HUC-derived SSEA3+ and CD105+ cells survive and migrate after transplantation into an injured rat spinal cord without immune suppression reaffirms the findings of Uchida et al. 13,14 , who found that Muse cells survived long term when transplanted into the rat brain after stroke. We identified HUC SSEA3/CD105 cells by the antibody STEM101® (Takara, Shiga, Japan) against a human nuclear protein. This antibody does not recognize mouse, rat, or nonhuman primate cells. SSEA3+/CD105+ cell survival in an injured rat spinal cord without immunosuppression is consistent with the immune tolerance of human Muse cells, which express HLA-G 22,62 . Although HUC-derived SSEA3+ and CD105+ cells form neural spheres (ectodermal), we did not observe induction into endodermal or mesodermal cells. However, past studies have shown that HUC-derived SSEA3+ and CD105+ cells can differentiate into the three lineages 63 –67 .
Conclusion
We believe that we have developed an efficient method of isolating, growing, and purifying SSEA3+ and CD105+ cells from HUCs using MACS.
Footnotes
Acknowledgments
The authors would like to express their appreciation to Sean P O’Leary for animal care, tissue fixation and other technical support.
Author Contributions
Conceptualization, Zikuan Leng; investigation, Dongming Sun; methodology, Zikuan Leng, Zihao Huang, Ning Chiang, Nikhit Kethidi, Ahmed Sabra and Yoshihiro Kushida; resources, Iman Tadmori; writing of original draft, Zikuan Leng; manuscript review and editing, Dongming Sun and Wise Young; supervision, Xijing He and Wise Young; funders, Xijing He and Wise Young; co-corresponding authors, Xijing He and Wise Young.
Ethics Approval
This study was approved by Rutgers University Ethics Committee.
Statement of Human and Animal Rights
All of the experimental procedures of this study were conducted in accordance with protocols approved by Rutgers University Institutional Animal Care and Use Committee.
Statement of Informed Consent
There were no human subjects in this research, and informed consent was not applicable.
Declaration of Conflicting Interests
The author(s) declared no potential conflicts of interest with respect to the research, authorship, and/or publication of this article.
Funding
The author(s) disclosed receipt of the following financial support for the research and/or authorship of this article: This work was supported by the China Scholarship Council (CSC, No. 201506280109) and the Natural Science Foundation of China (No. 81571209).