
Abstract
Hepatocyte transplantation is effective for treating liver failure, but healthy donors as a source of hepatocytes are quite limited. The livers of patients with hepatic fibrosis could be an alternative source; however, few reports have examined the nature of hepatocytes from fibrotic livers (f-hepatocytes). In this study, we compared the growth of f-hepatocytes and hepatocytes from normal livers (n-hepatocytes). Hepatocytes were isolated from normal and CCl4-treated wild-type Fischer rats that express dipeptidyl dipeptidase IV (DPPIV) gene (DPPIV+). The n- and f-hepatocytes proliferated in culture at similar rates. Both types of hepatocytes were transplanted into DPPIV- mutant Fischer rats that had been treated with retrorsine to injure the liver and were partially hepatectomized (PHx) before transplantation. Both n- and f-DPPIV+-hepatocytes proliferated and formed colonies. The colony sizes of f-hepatocytes 21 days posttransplantation were approximately three times those of n-hepatocytes. The hepatocytes were analyzed using a fluorescence activated cell sorter (FACS). The FACS profile differed between f- and n-hepatocytes: f-hepatocytes were less granular, less autofluorescent, and smaller than n-hepatocytes. These characteristics of f-hepatocytes resembled those reported for small-sized n-hepatocytes (SHs), which are highly proliferative and preferentially express a unique set of 10 SH genes. However, f-hepatocytes preferentially expressed only five of the SH genes. The expression profile of f-hepatocytes was rather similar to that of proliferating n-hepatocytes in the regenerating liver after PHx. The f-hepatocytes were morphologically normal and did not show any preneoplastic phenotype. These normal and proliferative natures of f-hepatocytes in vivo suggest the fibrotic liver as a source of hepatocytes for transplantation.
Keywords
Introduction
The liver cell transplantation therapy for a damaged liver was first reported in 1993, in which hepatocytes (1–60 × 107 cells) were autotransplanted into the spleen of cirrhosis or chronic hepatitis patients (11). The donor cells lived for up to 11 months. Strom et al. transplanted less than 1.2 × 10⁹ allogeneic hepatocytes into the spleen as a bridge to the ensuing liver transplantation (14). The patients who received hepatocyte transplantation before liver transplantation had an average survival of 3.8 ± 3.3 days versus 2.8 ± 2.5 days for those without hepatocyte transplantation. Although the survival period did not differ statistically, hepatocyte transplantation improved serum ammonia, cerebral blood flow, and intracranial pressure. Two of 30 patients were able to recover with hepatocyte transplantation alone without usual liver transplantation (14).
Patients with metabolic diseases have been also subjected to hepatocyte transplantation in some cases. For example, an ornithine transcarbamoylase (OTC)-deficient 5-year-old patient was transplanted with 1.7 × 10⁹ normal hepatocytes. The patient improved symptomatically but died from pneumonia 43 days posttransplantation (15). When a 10-year-old patient with Crigler-Najjar syndrome was transplanted with 7.5 × 10⁹ hepatocytes, an amount approximately equal to 5% of the entire liver, the patient was able to decrease the serum bilirubin to a half the level before liver transplantation (4). Recently, a patient with glycogen storage disease type Ib caused by a deficiency of glucose-6-phosphate transporter was treated with hepatocyte transplantation, which resulted in normalization of glucose-6-phosphatase activity in the liver, and substantial improvement in quality of life (9).
These previous studies show that the transplantation of hepatocytes equivalent to 1–5% of the total hepatocytes in the liver is therapeutically effective. Cell transplantation is easier, safer, and less expensive than liver transplantation, and can be performed repeatedly. The major challenge to hepatocyte transplantation is the shortage of transplantable cells owing to the limited availability of healthy donors (16). Hepatocytes from fibrotic livers (f-hepatocytes) are a potential source of hepatocytes for transplantation because of their greater availability over hepatocytes from normal livers (n-hepatocytes). Mito et al. isolated n- and f-hepatocytes from rats and transplanted each of them into the syngenic rat spleen (10). Although the yield and viability of the f-hepatocytes were lower than the n-hepatocytes, and their features were different from the normal counterpart in some aspects, they were able to continue to proliferate for 6 months after transplantation. However, the proliferative ability of f-hepatocytes has not been characterized in the liver, which is of prime importance when they are utilized as the cells for transplantation.
This study aimed to characterize the growth of f-hepatocytes using rats as a model animal. The adult rat liver contains a minor population of hepatocytes called small hepatocytes (SHs) (6,17,19). These cells are smaller and have greater replicative potential than typical parenchymal hepatocytes (PHs). SHs have been characterized using an “SH fraction” that contaminated PHs. Previously, we isolated a PH-free SH fraction and SH-free PH fraction from the adult rat liver using a fluorescence-activated cell sorter (FACS) combined with centrifugal elutriation and characterized the hepatocytes in the fraction. These hepatocytes were designated as pure SHs or R3Hs and pure large hepatocytes (LH) or R2Hs in our previous study, respectively (2). For the sake of simplicity, we call pure SHs ‘SHs” and pure LHs “LHs” in this study and assume that “hepatocytes” consist of LHs and SHs. SHs were mononuclear and of lower ploidy. Previously, we identified 10 genes that are preferentially expressed in SHs: p55cdc, hydroxysteroid sulfotransferase (Sta), cytochrome P450 17 (CYP17), prostaglandin E2 receptor EP3 subtype (Pge2r), pancreatic secretory trypsin inhibitor (Psti), Cdc2, connexin 26 (Cx26), mitotic centromere-associated kinesin (Mcak), rat EST 207254, and an unknown gene (ab088476) (2). These genes are referred to as the SH-associated genes.
We isolated n- and f-hepatocytes from rats. The f-hepatocytes were characterized in terms of size, FACS profile, in vitro and in vivo proliferation ability, and gene expression, and were compared with n-hepatocytes and hepatocytes in the regenerating liver (r-hepatocytes). As a result, we clearly demonstrated that f-hepatocytes are different from LHs, are similar to SHs in proliferation ability, and are similar to r-hepatocytes in their gene expression profile.
Materials and Methods
Treatment of Animals
Dipeptidyl dipeptidase IV-deficient (DPPIV-) mutant male Fischer rats aged 9–10 weeks were purchased from Charles River Japan, Inc. (Yokohama, Japan) and their wild-type (DPPIV+) counterparts from Japan SLC, Inc. (Shizuoka, Japan). Liver fibrosis was induced by intramuscular injection of DPPIV+ rats with CCl4 at 1 ml/kg body weight, twice a week, for 6 weeks. Hepatocytes were isolated from the rats 6 weeks postinjection. DPPIV+ male Fischer rats aged 15–16 weeks were subjected to two thirds partial hepatectomy (PHx). Then, r-hepatocytes were isolated from the rats 36 h after PHx.
Hepatocyte Isolation
DPPIV+ male Fischer rats aged 15–16 weeks were divided into three groups, one used for normal controls, second for CCl4 treatment, and the last for PHx experiment. The n-, f-, and r-hepatocytes were isolated from these rats using the two-step collagenase perfusion method (6), and were collected by centrifugation at 50 × g for 2 min. The pellets were centrifuged through 45% Percoll at 50 × g for 24 min (6). These pellets were centrifuged again at 50 × g for 2 min, and the final pellets were used as hepatocytes, which consisted of LHs and SHs. In our previous study, PHs and SHs were obtained as the pellet and supernatant, respectively, after centrifugation of the original hepatocyte preparations at 50 × g for 1 min (17). The hepatocyte preparation used in the present study corresponds to this previous preparation consisting of PHs and SHs. The viability of the hepatocytes was determined by Trypan blue exclusion. The n-, f-, and r-hepatocytes were subjected to FACS analysis, and to determining the cell diameter (17) and the gene expression levels. In addition, the proliferation ability of n- and f-hepatocytes was assayed in vitro and in vivo.
FACS Analysis
Hepatocytes were analyzed using a cell sorter (FACS Vantage; Becton Dickinson, Mountain View, CA) with a 100-μm nozzle, as reported previously (17). Fluorescence excited at 488 nm was measured through 530-nm (FL1) and 575-nm (FL2) filters with 4-decade logarithmic amplification. To measure the physical characteristics of the cells, linear amplification was used for the forward scatter, which is a measure of cell size, and 4-decade logarithmic amplification was used for the side scatter (SCC), which is a measure of cytoplasmic complexity. The optical bench was calibrated at a fixed amplitude and photomultiplier voltage using fluorescent polystyrene beads (Fluorosbrite Calibration Grade 6-μm YG microspheres; Polysciences, Warrington, PA), and the instrument was used in the conditions under which these beads fell in the same peak channels. Propidium iodide was added to the cell suspensions to be analyzed, at a concentration of 1 μg/ml. The cells that excluded the dye were analyzed as viable cells. Data obtained from the FACS experiments were analyzed using Cell Quest software (Becton Dickinson).
Determination of the Growth Potential of Hepatocytes In Vitro
The n- and f-hepatocytes were cocultured with mitomycin C-treated Swiss 3T3 cells on Celldesks in HCGM culture medium (i.e., Dulbecco's modified Eagle's medium supplemented with 10% fetal bovine serum, 20 mM N-2-hydroxyethylpiperazine-N′-2-ethane sulfonic acid, 30 μg/ml L-proline, 0.5 μg/ml insulin, 10−7 M dexamethasone, 44 mM NaHCO3, 10 mM nicotinamide, 10 ng/ml EGF, 0.2 mM L-ascorbic acid 2-phosphate, 100 IU/ml penicillin G, and 100 μg/ml streptomycin) (1,13,17–19). They were incubated in a 5% CO2/95% air atmosphere at 37°C. Swiss 3T3 cells were seeded on the hepatocytes 24 h after the hepatocytes were plated. The growth potential of the hepatocytes was determined at 10 days, as previously shown (17).
Hepatocyte Transplantation
DPPIV rats weighing 130–140 g were given two intraperitoneal injections of retrorsine at 30 mg/kg body weight, 2 weeks apart. Four weeks after the last injection, a two thirds PHx was performed (6,8). The n- and f-hepatocytes (1.5 × 10⁵) isolated from the DPPIV- rats were transplanted into the retrorsine-treated partial hepatectomized (retrorsine/PHx) DPPIV- rats via the portal vein. Some rats were killed 48 h after transplantation to measure the engraftment rate of the transplanted hepatocytes, the ratio of transplanted cells to cells integrated to the liver plate. Other rats were killed 21 days after transplantation. Tissues from each lobe of the liver were frozen until use for enzyme-histochemical or immunohistochemical analyses.
Enzyme-Histochemical and Immunohistochemical Staining
DPPIV enzyme histochemistry was performed on 10-μm-thick cryosections that had been prepared from the liver, fixed in ice-cold acetone for 5 min, air-dried, and washed for 5 min in ice-cold 95% ethanol. The sections were air-dried and incubated for 40–60 min in a substrate reagent consisting of 0.5 mg/ml Gly-Pro-methoxy-β-naphthylamide (Sigma Chemical, St. Louis, MO), 1 mg/ml Fast Blue BB (Sigma Chemical), 100 mmol/L Tris-maleate (pH 6.5), and 100 mmol/L NaCl. Then, the sections were washed with PBS and fixed in 10% formaldehyde. All tissue sections were counterstained with hematoxylin.
Cryosections were fixed in −20°C acetone for 5 min and subjected to immunohistochemistry to detect liver-related proteins. The primary antibodies (Abs) used were as follows: anti-rat DPPIV mouse monoclonal antibody (gift from Dr. D. C. Hixson, Rhode Island Hospital), anti-rat albumin rabbit antiserum (a hepatocyte marker; Cappel, Durham, NC), anti-human α-smooth muscle actin (SMA) mouse monoclonal antibody (an activated stellate cell marker; MBL, Nagoya, Japan), anti-rat glutathione-S-transferase (a preneoplastic hepatocyte marker, GST-P) rabbit antiserum (MBL), OV6 mouse monoclonal antibody (an oval cell marker; gift from Dr. D.C. Hixson) (5), and anti-human cytokeratin 19 monoclonal antibody (CK19; a bile duct cell and oval cell marker; Amersham). The primary Abs were visualized with Alexa 488-labeled goat anti-mouse-IgG or Alexa 594-labeled goat anti-rabbit IgG (Molecular Probes, Eugene, OR).
Morphometric Analysis
Livers were isolated from rats 48 h after transplantation, weighed, and processed for cryosectioning and DPPIV staining. The approximate numbers of hepatocytes per gram of liver were calculated from the liver weight using the value 115 × 106 ± 15 × 106 hepatocytes/g liver (12). DPPIV+ and DPPIV- hepatocytes were counted in arbitrary areas visualized on tissue sections, and the numerical ratio of the former to the latter was calculated as the occupancy rate of engrafted hepatocytes in the liver. The number of engrafted hepatocytes per liver was calculated by multiplying the occupancy rate of the engrafted hepatocytes by the total number of host hepatocytes per liver. The engraftment index (the numerical ratio of engrafted hepatocytes to injected hepatocytes on transplantation) was calculated by dividing the number of engrafted hepatocytes per liver by the number of injected hepatocytes.
A transplanted hepatocyte homes to the liver, starts to replicate there, and forms a colony soon after transplantation. The area of colonies formed by the transplanted hepatocytes was measured using NIH image var. 1.62, and the data were analyzed using StatView ver. 5.0 (SAS Institute, Cary, NC). The colony size increases as engrafted hepatocytes proliferate. The volume of a colony was estimated using a reported method (6). Briefly, we made 10-μm-thick semiserial sections from liver specimens, at 100-μm intervals. Different parts of a DPPIV+ colony were seen in several different serial sections when the diameter of the colony exceeded 100 μm, which is a colony area corresponding to >7,850 μm2. We selected the section in which the longest diameter of a particular DPPIV+ colony was seen and calculated the colony area using this diameter. For a colony with a diameter < 100 μm, we assumed that the diameter measured in a section was the longest diameter and calculated the colony area using this diameter. We only measured the colonies consisting of more than eight DPPIV+ transplanted hepatocytes. The colonies were oval or round. To quantify the area of these colonies, 40 portal areas were examined in each animal at 21 days posttransplantation. The volume of a colony was calculated from the area of the colony, assuming that the colony was spherical and that the cross section was made along the maximum diameter of the sphere. To calculate the mean diameter of cells in colonies formed by the transplanted hepatocytes, the area and cell number therein were measured for 10 colonies. The mean cell number in a colony was calculated using the area or volume of the colony and the mean cell diameter of hepatocytes.
Quantification of mRNA
Total RNA was purified from n-, f-, and r-hepatocytes using an RNeasy minikit (QIAGEN K.K., Tokyo, Japan) and was treated with an RNase-free DNase set (QIAGEN). cDNA was synthesized using PowerScript reverse transcriptase (Clontech, Palo Alto, CA) and was amplified with a set of gene-specific primers (2) and SYBR Green PCR mix in a PRISM 7700 Sequence Detector (Applied Biosystems, Tokyo, Japan). A series of diluted plasmid cDNAs containing each gene was used to plot the standard amplification curves. The mRNA copy numbers in cDNA samples were calculated using the standard amplification curves (2).
Statistical Analysis
The area of colonies formed by the transplanted hepatocytes was measured using NIH image ver. 1.62, and the data were analyzed using StatView ver. 5.0 (SAS Institute, Cary, NC). The significance of differences was analyzed using the Mann-Whitney rank sum test. A value of p < 0.05 was considered significant.
Results
Size and FACS Characterization of Hepatocytes
We prepared n- and f-hepatocytes from normal and CCl4-treated rats, respectively. The yield of the n- and f-hepatocytes was 35.0 ± 19.0 × 10⁶ and 2.6 ± 1.5 × 10⁶ cells per animal (n = 3), respectively, and their viability was 95.5 ± 0.6% and 69.6 ± 2.2% (n = 3), respectively. Similarly, r-hepatocytes were isolated from rats 36 h after PHx. These cells were placed on nonadhesive dishes to determine their diameters as a measure of cell size. The n-, f-, and r-hepatocytes had diameters of 22.1 ± 0.2, 20.1 ± 0.2, and 21.5±1.0 μm, respectively. Previously, we had found diameters of 23.2 ± 0.5 and 17.4 ± 0.0 μm for LHs and SHs, respectively (2).
The shape of contour lines in FACS analysis were variable from experiment to experiment, depending on the axis adjustment of the cell souter that is usually made and fixed in each series of experiment. We always compared the level of FL1 (autoflorescence) and SSC (granularity) of experimental cells (f- and r-hepatocytes in this study) with control cells (n-hepatocytes). It was confirmed that the similar differences of f-hepatocytes over n-hepatocytes and that of r-hepatocytes over n-hepatocytes were reproducibly observed in three independent analyses. The FACS analysis showed that f-hepatocytes were totally different from n-hepatocytes (Fig. 1A). Most of the f-hepatocytes were less granular and less autofluorescent. The FACS profile of r-hepatocytes was similar to that of n-hepatocytes, although the former contained more populations with low granularity and low autofluorescence than the latter (Fig. 1B).

FACS profiles of hepatocytes. Two series (A, B) of experiments were performed in which hepatocytes were analyzed by FACS in terms of the side scatter (SSC) and fluorescence through 530-nm filter (FL1). (A) One series compared the FACS profiles of n- and f-hepatocytes, and (B) the other compared the profiles of n- and r-hepatocytes.
Growth Ability of n- and f-Hepatocytes
The n- and f-hepatocytes were isolated from three normal rats and four CCl4-treated rats, respectively, and then cultured with Swiss 3T3 cells in HCGM for 10 days. The ratios of the cell number at day 10 to that at day 1 were 3.5 ± 1.0 and 3.3 ± 0.1 for f- and n-hepatocytes (n = 3), respectively, clearly indicating similar growth ability between the two types of hepatocytes in vitro.
The growth ability in vivo was compared between n-and f-hepatocytes. DPPIV+ n- and f-hepatocytes were transplanted into DPPIV retrorsine/PHx rats via the portal vein. The livers were harvested 48 h after transplantation. The DPPIV+ n- and f-hepatocytes were counted on the host liver sections. The engraftment index of f-hepatocytes obtained by two transplantation experiments was 12.3% and 7.4% (average 9.9%), which was similar to that of n-hepatocytes, 13.0% and 5.6% (9.3%). A previous study revealed that oval cells were not seen in the livers of CCl4-treated rats (3). In the present study, serial liver sections were immunostained for DPPIV and an oval cell marker, OV6. There were no DPPIV and OV6 double-positive cells (data not shown), showing the absence of oval cells in the hepatocyte preparations used in this study.
Retrorsine/PHx DPPIV- rats were transplanted with n- and f-hepatocytes that had been isolated from four DPPIV+ rats each as described above, killed 21 days after transplantation, and their livers were processed for DPPIV+ enzyme histochemistry (Fig. 2). The f-hepatocyte colonies were more heterogeneous in size and appeared larger than the n-hepatocyte colonies, suggesting higher growth potential of the former than the latter. To quantitatively evaluate the growth ability, we measured two parameters on histological sections, the colony area and volume. Area size distribution of the hepatocyte colonies was determined and is shown in Figure 3, which confirmed the above suggestions of higher size heterogeneity and larger colony area of f-hepatocytes than those of n-hepatocytes. The mean colony area was calculated from these graphs and is shown in Table 1. f-Hepatocytes formed colonies whose areas were approximately 2.4-fold larger (significant at p < 0.05) than those of n-hepatocytes. The diameter of the hypothetical sphere formed by the transplanted hepatocytes was measured and also is shown in Table 1. As expected, the colony volume of f-hepatocytes was approximately 3.7-fold larger (significant at p < 0.05) than that of n-hepatocytes. From the mean area and volume of colonies formed by the transplanted hepatocytes, we estimated the replication potential of a transplanted cell. To simplify the calculation, we assumed that transplanted hepatocytes were spherical, and we calculated the number of transplanted cells per area and volume of a colony as described in the Materials and Methods. As shown in Table 2, the number of transplanted cells per area and volume of a colony was about 1.9- and 2.6-fold larger than that of n-hepatocytes, respectively. The average numbers of cell divisions for transplanted f- and n-hepatocytes over 21 days were calculated to be 11–13 and 9–11, respectively (Table 2). From these measurements, we concluded that f-hepatocytes have higher growth potential than n-hepatocytes in vivo.
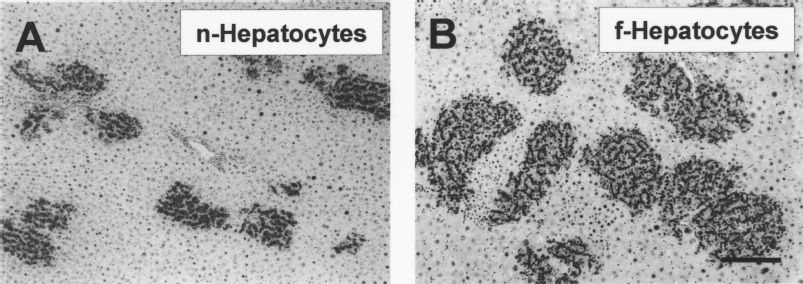
Colonies formed by transplanted hepatocytes. (A) DPPIV+ n-hepatocytes and (B) DPPIV+ f-hepatocytes were transplanted into the livers of retrorsine/PH DPPIV- rats. Liver sections were prepared from the rats 21 days after transplantation. Cryosections of the livers were subjected to DPPIV histochemical staining. The transplanted hepatocytes were stained black. Scale bar: 200 μm.

Size distribution of the hepatocyte colonies. Forty regions were selected randomly from DPPIV-stained sections for four individuals as shown in Figure 2 and were photographed. The colony area was measured on the photographs using NIH ver. 1.62. Each line represents the proportion (%) of the area measured for each of the four animals. f-Hepatocytes occupied more area than n-hepatocytes.
The Mean Area and Volume of Colonies Formed by Transplanted Hepatocytes
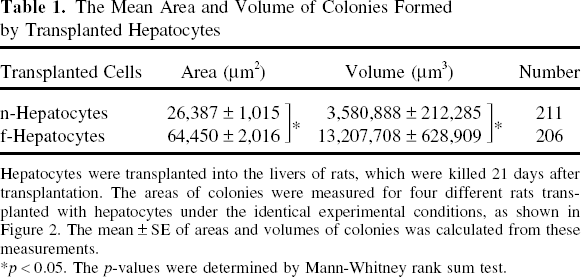
Hepatocytes were transplanted into the livers of rats, which were killed 21 days after transplantation. The areas of colonies were measured for four different rats transplanted with hepatocytes under the identical experimental conditions, as shown in Figure 2. The mean ± SE of areas and volumes of colonies was calculated from these measurements.
p < 0.05. The p-values were determined by Mann-Whitney rank sum test.
Mean Cell Number in a Colony

Data are expressed as the mean ± SE.
Cell Phenotype in Colonies Formed by Transplanted Hepatocytes
The cells in the colonies of n- and f-hepatocytes were characterized in terms of the expression of four lineage-specific markers of liver cells: albumin, α-SMA, CK19, and GST-P. The cells in colonies of both types of hepatocytes expressed albumin at a high level, comparable to that of the surrounding host hepatocytes (Fig. 4A–D). Neither CK19 nor GST-P was expressed in the cells of colonies formed by both types of hepatocytes (data not shown), supporting the notion that f-hepatocytes do not show preneoplastic or bile duct epithelial cell phenotypes. These results strongly suggest that f-hepatocytes retain the phenotype of normal hepatocytes and maintain the normal phenotype throughout replication. In addition, α-SMA+ cells (activated stellate cells) were not observed in the f-hepatocyte-transplanted livers (Fig. 4G, H) as in the n-hepatocyte-transplanted livers (Fig. 4E, F).

Phenotypes of the cells in the colonies formed by transplanted hepatocytes. DPPIV+ n-hepatocytes (A, B, E, and F) and DPPIV+ f-hepatocytes (C, D, G, and H) were transplanted into retrorsine/PH-treated DPPIV- rats. Serial liver cryosections were prepared 21 days after transplantation and were stained for DPPIV (A, C, E, and G), albumin (B and D), and α-SMA (F and H). The colonies formed by the transplanted hepatocytes are localized as DPPIV+ regions (A, C, E, and G). These colonies are each marked by broken lines on the corresponding immunostained serial sections (B, D, F, and H). The DPPIV+ cells were all albumin+. There were no α-SMA+ cells in the livers transplanted with both n- and f-hepatocytes. Scale bar: 100 μm.
Gene Expression in f-Hepatocytes
Previously, we had identified 10 SH-associated genes: p55cdc, Sta, CYP17, Pge2r, Psti, Cdc2, Cx26, Mcak, rat EST 207254, and an unknown gene (ab088476) (2). The mRNA expression levels of all of these genes except rat EST 207254 were determined using real-time RT-PCR in n-, f-, and r-hepatocytes (Fig. 5B, Table 3) and were compared with our previous data, which are shown in Figure 5A. The expression levels of the SH-associated genes were much higher in SHs than in LHs (Fig. 5A). The expression levels of four genes (ab088476, Pge2r, Cx26, and Psti) were similar between n- and f-hepatocytes. By contrast, five genes (CYP17, p55cdc, Cdc2, Mcak, and Sta) were expressed at much higher levels in f-hepatocytes than in n-hepatocytes. It was noteworthy that the overall expression profile of n-hepatocytes was similar to that of r-hepatocytes (Fig. 5B).

Expression of the SH-associated genes in hepatocytes. (A) Gene expression levels in SHs and LHs. This graph is drawn using the mRNA expression data presented in Tables 4 and 5 of Asahina et al. (2). (B) The gene expression levels in n-, f-, and r-hepatocytes were determined by measuring the mRNA copy number using real-time RT-PCR.
Expression Levels of SH-Associated Genes in n-, r-, and f-Hepatocytes
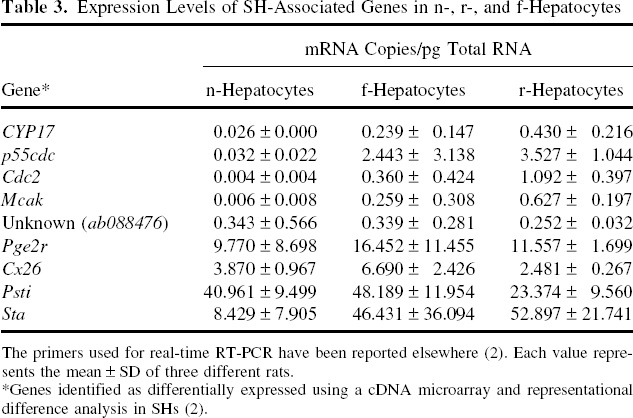
The primers used for real-time RT-PCR have been reported elsewhere (2). Each value represents the mean ± SD of three different rats.
Genes identified as differentially expressed using a cDNA microarray and representational difference analysis in SHs (2).
Discussion
Fibrotic livers have been characterized mainly with respect to activated stellate cells, which are known as extracellular matrix (ECM)-producing cells, and little is known about the nature of hepatocytes in the fibrotic liver. Mito et al. reported that hepatocytes from fibrotic liver exhibited greater proliferation than hepatocytes from normal liver when transplanted into the spleen, despite the injection of approximately 1/200 of the amount of normal cells (10). Histological observations revealed that transplanted hepatocytes from cirrhotic livers differentiated into plates two to several cells thick, whereas plates of one-cell thickness prevailed with the transplantation of normal hepatocytes. One interpretation of this observation is that cirrhotic hepatocytes are still in the regenerating phase. Hepatocytes from cirrhotic livers retained normal functions such as glycogenesis and albumin synthesis (10). On electron micrographs, collagen fibers in the space of Disse were observed 1 year after the transplantation of hepatocytes from cirrhotic livers, but were not present with normal hepatocyte transplantation (10). In the present study, we characterized hepatocytes isolated from the fibrotic liver for the first time in terms of their growth potential in vitro and in vivo (in the retrorsine/PH rat liver), FACS profile, cell size, growth potential, and gene expression.
The growth potential of hepatocytes is heterogeneous: the hepatocyte with the greatest proliferative ability forms a colony consisting of more than 100 cells within 10 days, whereas the hepatocyte with the lowest ability does not divide (19). The adult rat liver contains a minor population of hepatocytes called SHs, which have a smaller size and higher replicative potential than LHs (6,17,19). Previously, we had used FACS and centrifugal elutriation to isolate highly proliferative SHs as cells with low autofluorescence and low granularity (2). In the present study, most of the f-hepatocytes had low autofluorescence and low granularity, similar to SHs. Therefore, we investigated whether f-hepatocytes have characteristics similar to SHs in terms of size, growth potential in vitro and in vivo, and gene expression.
The average diameter of f-hepatocytes (20.1 ± 0.2 μm) was comparable to that of n-hepatocytes (22.1 ± 0.2 μm) but was larger than that of SHs (17.4 ± 0.0 μm). The growth of f-hepatocytes in vitro was compared with that of n-hepatocytes. Previously, we had shown that SH proliferation was about four times that of LHs in vitro (17). The f-hepatocytes showed growth ability similar to that of n-hepatocytes. SHs were also highly proliferative in vivo (about three times compared with LHs), as determined by colony-forming ability after transplantation into the livers of the retrorsine/PH rats (6). Here, we also estimated the growth potential of hepatocytes using this model. The engraftment index obtained in this study at 48 h after transplantation was 9.9% for f-hepatocytes and 9.3% for n-hepatocytes, and did not differ significantly. The colonies formed by transplanted cells at 21 days were examined in all of the residual livers of the recipients and showed that f-hepatocytes were more proliferative (about 2.5 times) than n-hepatocytes.
From the data, we concluded that f-hepatocytes have higher growth ability than n-hepatocytes in vivo but not in vitro. At present, there is no explanation for this apparent discrepancy between the in vivo and in vitro growth abilities of the two types of hepatocytes. However, it seems that the culture conditions used in the present study were not sufficient for f-hepatocytes to exhibit their full proliferation potential.
Ten SH-associated genes had been identified previously (2). We examined whether f-hepatocytes also express the SH-associated genes, and we compared the expression of SH-associated genes between f- and r-hepatocytes. The f-hepatocytes expressed five of the nine SH genes, at similar levels as SHs. Importantly, the overall expression profile of f-hepatocytes resembled that of r-hepatocytes.
The expression of marker proteins specific to hepatocytes, preneoplastic hepatocytes, and bile duct epithelial cells was characterized in f-hepatocytes. When rats were treated with CCl4 for more than 7 weeks, morphologically recognizable GST-P+ preneoplastic nodules were observed in some of the treated rats (7). In the present study, the cells in colonies formed by transplanted f-hepatocytes were albumin+ but CK19- and GST-P-, like n-hepatocytes, showing that the cells in the f-hepatocyte colonies expressed hepatocyte markers but not bile duct or preneoplastic markers. In addition, stellate cells did not express α-SMA in the f-hepatocyte colonies. There seems to be a regulatory mechanism in vivo under which f-hepatocytes stably express hepatocytic phenotypes but do not express biliary phenotypes.
In this study, we demonstrated that hepatocytes surrounded by ECM in the fibrotic liver retained high growth potential. f-Hepatocytes can be used instead of n-hepatocytes for hepatocyte transplantation, although the yield of hepatocytes from a fibrotic liver is fewer than that from a normal liver. However, it remains to be determined whether human f-hepatocytes have similar normal and proliferative phenotypes as rat f-hepatocytes, when isolated from the livers of fibrotic patients and transplanted into normal recipients. If they show these phenotypes, fibrotic livers could be a useful source of hepatocytes for the treatment of liver damage using hepatocyte transplantation.
Footnotes
Acknowledgments
We thank Mss. Y. Yoshizane, H. Kohno, Y. Matsumoto, and S. Nagai for technical assistance, and Drs. M. Mito and K. Asahina for valuable advice. This work was supported by a grant from the Cooperative Link of Unique Science and Technology for Economy Revitalization (CLUSTER), Japan.