
Abstract
This paper delves into the realm of ordinal classification processes for multiple raters. A Probit hierarchical model is proposed linking rater’s ordinal ratings with rater diagnostic skills (bias and magnifier) and patient latent disease severity, where patient latent disease severity is assumed to follow a latent class normal mixture distribution. This model specification provides closed-form expressions for both overall and individual rater receiver operator characteristic (ROC) curves and the area under these ROC curves (AUC). We further extend the model by incorporating covariate information and adding a regression layer for rater diagnostic skill parameters and/or for patient latent disease severity. The extended covariate models also offer closed-form solutions for covariate-specific ROCs and AUCs. These analytical tools greatly facilitate traditional diagnostic accuracy analysis. We demonstrate our methods thoroughly with a practical mammography example.
Introduction
In the context of diagnostic medicine, the assessment of diagnostic accuracy of different diagnostic tests is very important. Many diagnostic procedures involve task-based judgement from radiologists/raters. For example, image analysis is increasingly integral to the screening and diagnostic processes, encompassing rater interpretation of various modalities such as X-ray, mammograms, MRI scans, CT scans, and others. When raters’ task-based judgement involved, multirater multi-case (MRMC) 1 study design is commonly recommended to assess the diagnostic ability of raters. The MRMC structure, where each rater interprets every case (test result) for all patients, ensures a comprehensive and consistent evaluation of the diagnostic test. A systematic review and guide of designing the MRMC structure can be found in Obuchowski and Bullen’s paper. 1
The resulting data of the MRMC structure is evidently correlated and therefore challenging to analyze. In the literature of MRMC receiver operator characteristic (ROC) analysis, four parametric methods stand out for handling the complicated correlated MRMC data. The Dorfman–Berbaum–Metz (DBM)2,3 proposed a mixed-effects ANOVA model to fit jackknife pseudovalues of ROC summary measures. Obuchowski and Rockette 4 proposed a linear ANOVA model to fit ROC summary measures treating patients as random. Beiden–Wagner–Campbell 5 is a development of the original DBM method with the focus on the variance component estimation. Song and Zhou 6 proposed a marginal regression model that only handles area under the curves (AUCs). In addition to these methods, Obuchowski 7 proposed a non-parametric approach to analyze clustered ROC data through AUC. A completed review of these methods can be found in Obuchowski’s 7 and Hillis’s paper 8 . It is noteworthy that all these methods require the presence of the true disease status, also referred to as the gold standard, and that their models are based on some diagnostic summary measures such as AUC rather than the original rating data.
Our motivating data set has the MRMC data structure. Instead of assessing diagnostic accuracy of mammograms when interpreted by many radiologists, our proposed approach focuses on the assessment of the diagnostic abilities of the radiologists in interpreting the mammograms. Beam et al. 9 aimed to investigate the variability in the mammogram interpretation among radiologists in the United States. The study selected 110 radiologists through a stratified random sample from mammography facilities accredited by the U.S. Food and Drug Administration. Original index mammograms of high technical quality were obtained from 148 women, drawn from an age-stratified random sample of a large screening program affiliated with the University of Pennsylvania. Every radiologist interpreted all mammograms in a controlled reading environment for two 3-hour periods. A modified 5-point Breast Imaging Reporting and Data System (BI-RADS) scale 10 was used for the radiologists to record their findings: 1, normal, return to normal screening; 2, benign, return to normal screening; 3, probably benign, 6-month follow-up; 4, possibly malignant, biopsy recommended; 5, probably malignant, biopsy strongly recommended. The true disease status of the women screened was determined by a biopsy examination or a minimum follow-up period of 2 years.
We chose a subset of the Beam data comprising 146 patients and 107 raters from the initial pool of data selected through evaluation of data completeness. In our chosen mammogram data,
Beam’s data involve a larger number of raters than common MRMC data. For such a large set of MRMC data, Lin et al. 11 employed Bayesian hierarchical modeling to account for the between rater variability and the clustered patient variability. Lin et al. 11 dichotomized the ordinal rating into binary rating and linked the rater binary decisions with patient true binary disease statuses to form an agreement web. To our knowledge, it is the first paper to assess rater diagnostic ability through directly modeling diagnostic skill set (rater bias and rater magnifier) instead of using the traditional paired sensitivity and specificity. The rater bias refers to a rater’s inherent inclination to consistently rate a patient as “diseased.” The rater magnifier interactively affects on the patient latent disease severity and magnifies the patient’s latent disease severity in the correct direction, leading to an increased likelihood of making a correct decision. Lin et al. 11 laid the groundwork for a fundamental analysis of investigating rater’s diagnostic skills. Later, Kim et al. 12 built on Lin’s approach and generalized such methods to ordinal rating scales.
This paper continues the journey of Lin et al., 11 Kim et al., 12 employing Bayesian probit modeling to connect the ordinal rating with rater bias, rater magnifier, and patient latent disease severity. Our proposed approach has three key strengths over the existing approaches as follows. One drawback in Kim et al. 12 is that they can not predict the true binary disease status for patients, instead their rating agreement web prefers to having gold standards included in the model. In this paper, we adopt the latent class modeling idea and treat the unknown binary disease statuses as latent classes for modeling the distribution of the patient disease severity. In this way, the Markov chain Monte Carlo (MCMC) sampling allows for the prediction of the true disease status for patients. Another major difference between Kim’s approach and ours is that we developed a novel approach to evaluate rater ROCs and AUCs which dramatically reduces the work of formulating ROCs and AUCs in Kim et al. 12 . Our approach utilizes the binormal distribution of the latent diagnostic score and derives a closed form of smooth ROCs and AUCs. It provides enhanced flexibility for studying both individual and overall rater skills. Thirdly, this paper also makes significant extensions of the primary model by incorporating patient and rater covariates into the diagnostic analysis. Through adding a regression layer on the rater parameters and/or the patient disease severity, the rater covariate effects on the diagnostic skills and/or the patient covariate effects on the disease progress are examined. More importantly, the rater and/or patient covariate-specific ROCs and AUCs are derived. These extended models open avenues for refining models through systematic modifications and covariate adjustments. It is worth mentioning that some of the ROC analyses have already incorporated covariate information but in a very different way. For example, Pepe et al. 13 represented the ROC curve as the distribution of standardized marker measurements in cases and based on it proposed three different ways to directly incorporate covariates into the ROC analysis.
The remainder of this paper is organized as follow. Section 2 presents the primary model and the hierarchical distributions, the closed form of overall and individual rater ROC curves and their corresponding AUCs. Section 3 extends the primary model by incorporating rater and patient covariates, and derives the related ROC analyses. Section 4 applies our proposed methods to analyze the mammogram data and compare the results using different models. Section 5 concludes with a discussion. The computational algorithms and the results of simulation studies are presented in a supplementary file.
Primary model and ROC analysis
Primary model
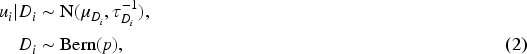
We consider a study setting where

The second layer of our model specifies the distributions for the latent patient disease severity
Rater’s bias and magnifier
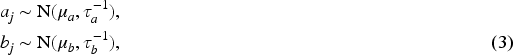
For the Bayesian estimation, the third layer of our model is to specify priors for all parameters. We assign conventional non-informative/diffuse priors to all the parameters. For the parameters
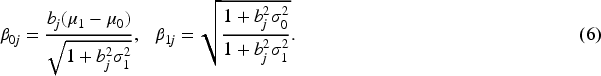
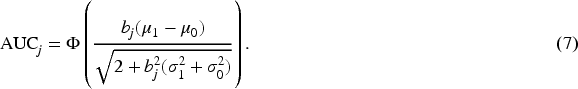
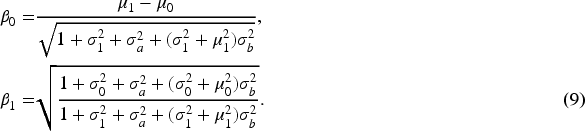
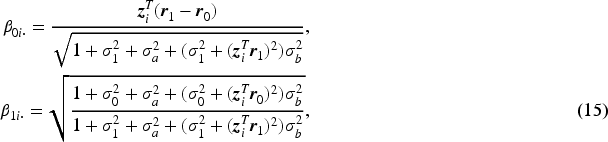
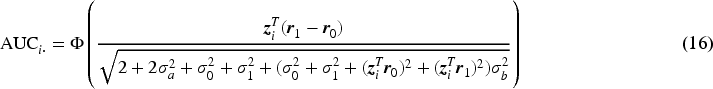
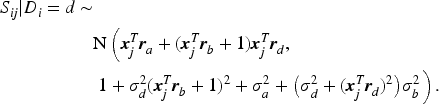
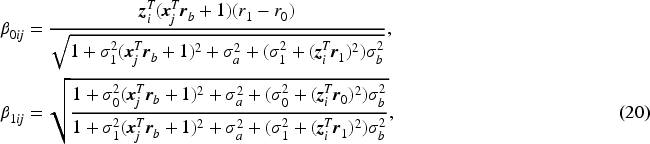
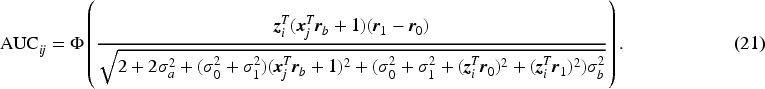
To better understand model (1) and to develop an ROC analysis, we introduce a latent diagnostic process scheme for each rating. That is, each rater


ROC curve is a typical method to measure the diagnostic accuracy by plotting sensitivity (
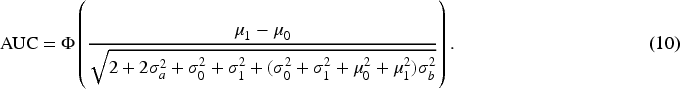
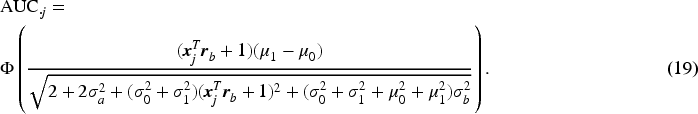
Beyond individual diagnostic performance, our interest extends to monitor the overall diagnostic accuracy of the entire group of raters. Pepe
15
mentioned pooling all ratings from raters and formulating the overall ROC curve and AUC. Metz
16
suggested averaging over parameters of the individual rater ROC curves to obtain the overall ROC curve. However, this type of average ROC curve in general does not have the AUC equal to the mean of individual AUCs. Therefore, Chen and Samuelson
17
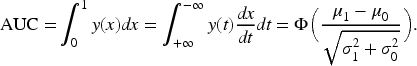
proposed both a non-parametric method and a parametric method for generating area- preserving average ROC curve from the ROC curves of individual raters. In this paper, the overall rater ROC and AUC are not simply based on pooling individual rater ratings but are model-based theoretical ones. They are derived based on the average diagnostic scores for diseased and non-diseased groups after integrating over the distributions of

The motivating mammogram dataset provides additional information on both patients and raters, prompting us to incorporate these information as covariates into the model. The inclusion of covariates enhances the model’s flexibility, enabling it to account for different sources of variations in the data and understand how certain factors influence the outcome. Adjusting for covariates improves the model’s predictive accuracy by facilitating a more nuanced understanding of underlying patterns and enhancing prediction accuracy. The incorporation of covariates also elevates the interpretability of the model, empowering researchers to grasp how various factors contribute to observed outcomes and aiding in drawing meaningful conclusions from the analysis.
For many diseases, characteristics of patients pose strong effects on the disease severity. For instance, patient age is a significant variable that influences the disease status. Patients in the motivating mammogram dataset were age-stratified, therefore, including patient age provides insights into age-specific effect on the diagnostic process. Various characteristics can affect a rater’s performance/ability14,18,19 including: experience and expertise (with more experienced raters typically performing better); training and education (adequate training and education can improve a rater’s performance by providing them with the necessary knowledge and skills to perform the task effectively); bias (raters may have personal biases that can affect their performance, such as confirmation bias, where they tend to look for information that supports their preconceptions, and availability bias, where they rely too heavily on information that is readily available to them); and etc. All these characteristics can be viewed as rater covariates.
To explicitly examine covariate effects, we first study patient and rater covariate effects separately. Then, we continue to explore whether incorporating all covariate variables (both patient’s and rater’s) simultaneously will significantly impact rater diagnostic accuracy analysis. Three covariate models are designated as Patient-covariate model, Rater-covariate model, and Combined-covariate model. Each of these models builds upon the original primary model.
Patient-covariate model and Patient-covariate-specific ROC analysis
Suppose that each patient

The introduced latent continuous rating score

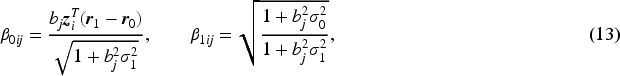
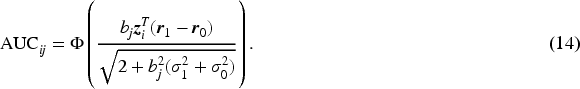
Next, we derive the overall rater ROC and AUC formulas given the patient covariate level. Given the normal distributions of

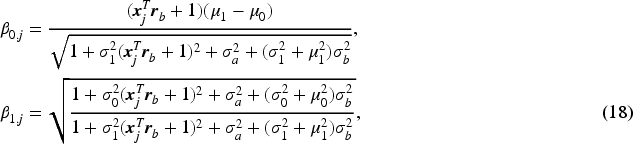
Suppose that each rater
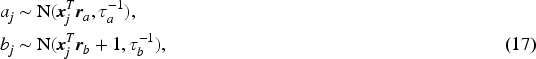
The difference between the original model and Rater-covariate model is that we incorporate rater covariates and assume a regression layer on both
The patient and rater covariate effects on the diagnostic accuracy have been studied separately. Incorporating all covariates from both patient and rater simultaneously into a single model provides a comprehensive understanding of how these factors collectively influence rater diagnostic accuracy. In this subsection, we add both patient covariate regression layer (11) and rater covariate regression layer (17) on the original model and refer the extension as Combined-covariate Model. The nature of the Combined-covariate model determines the impossibility of deriving a binormal normal distribution of
In this section, we apply the proposed methods (the original and extended models) to analyze the mammogram dataset introduced previously. We have developed four MCMC Gibbs samplers (one for each model) to estimate the parameters with details described in the supplementary file. For each model, we run 30,000 MCMC iterations, taking the first 5,000 iterations as a burn-in period. The convergence of the MCMC chains is verified using multiple convergence criteria within an R package
It is established that patient age has a significant impact for breast cancer progression. Therefore, for the covariate models, we select patient age as the patient covariate and the patient-covariate coefficient vectors are denoted as
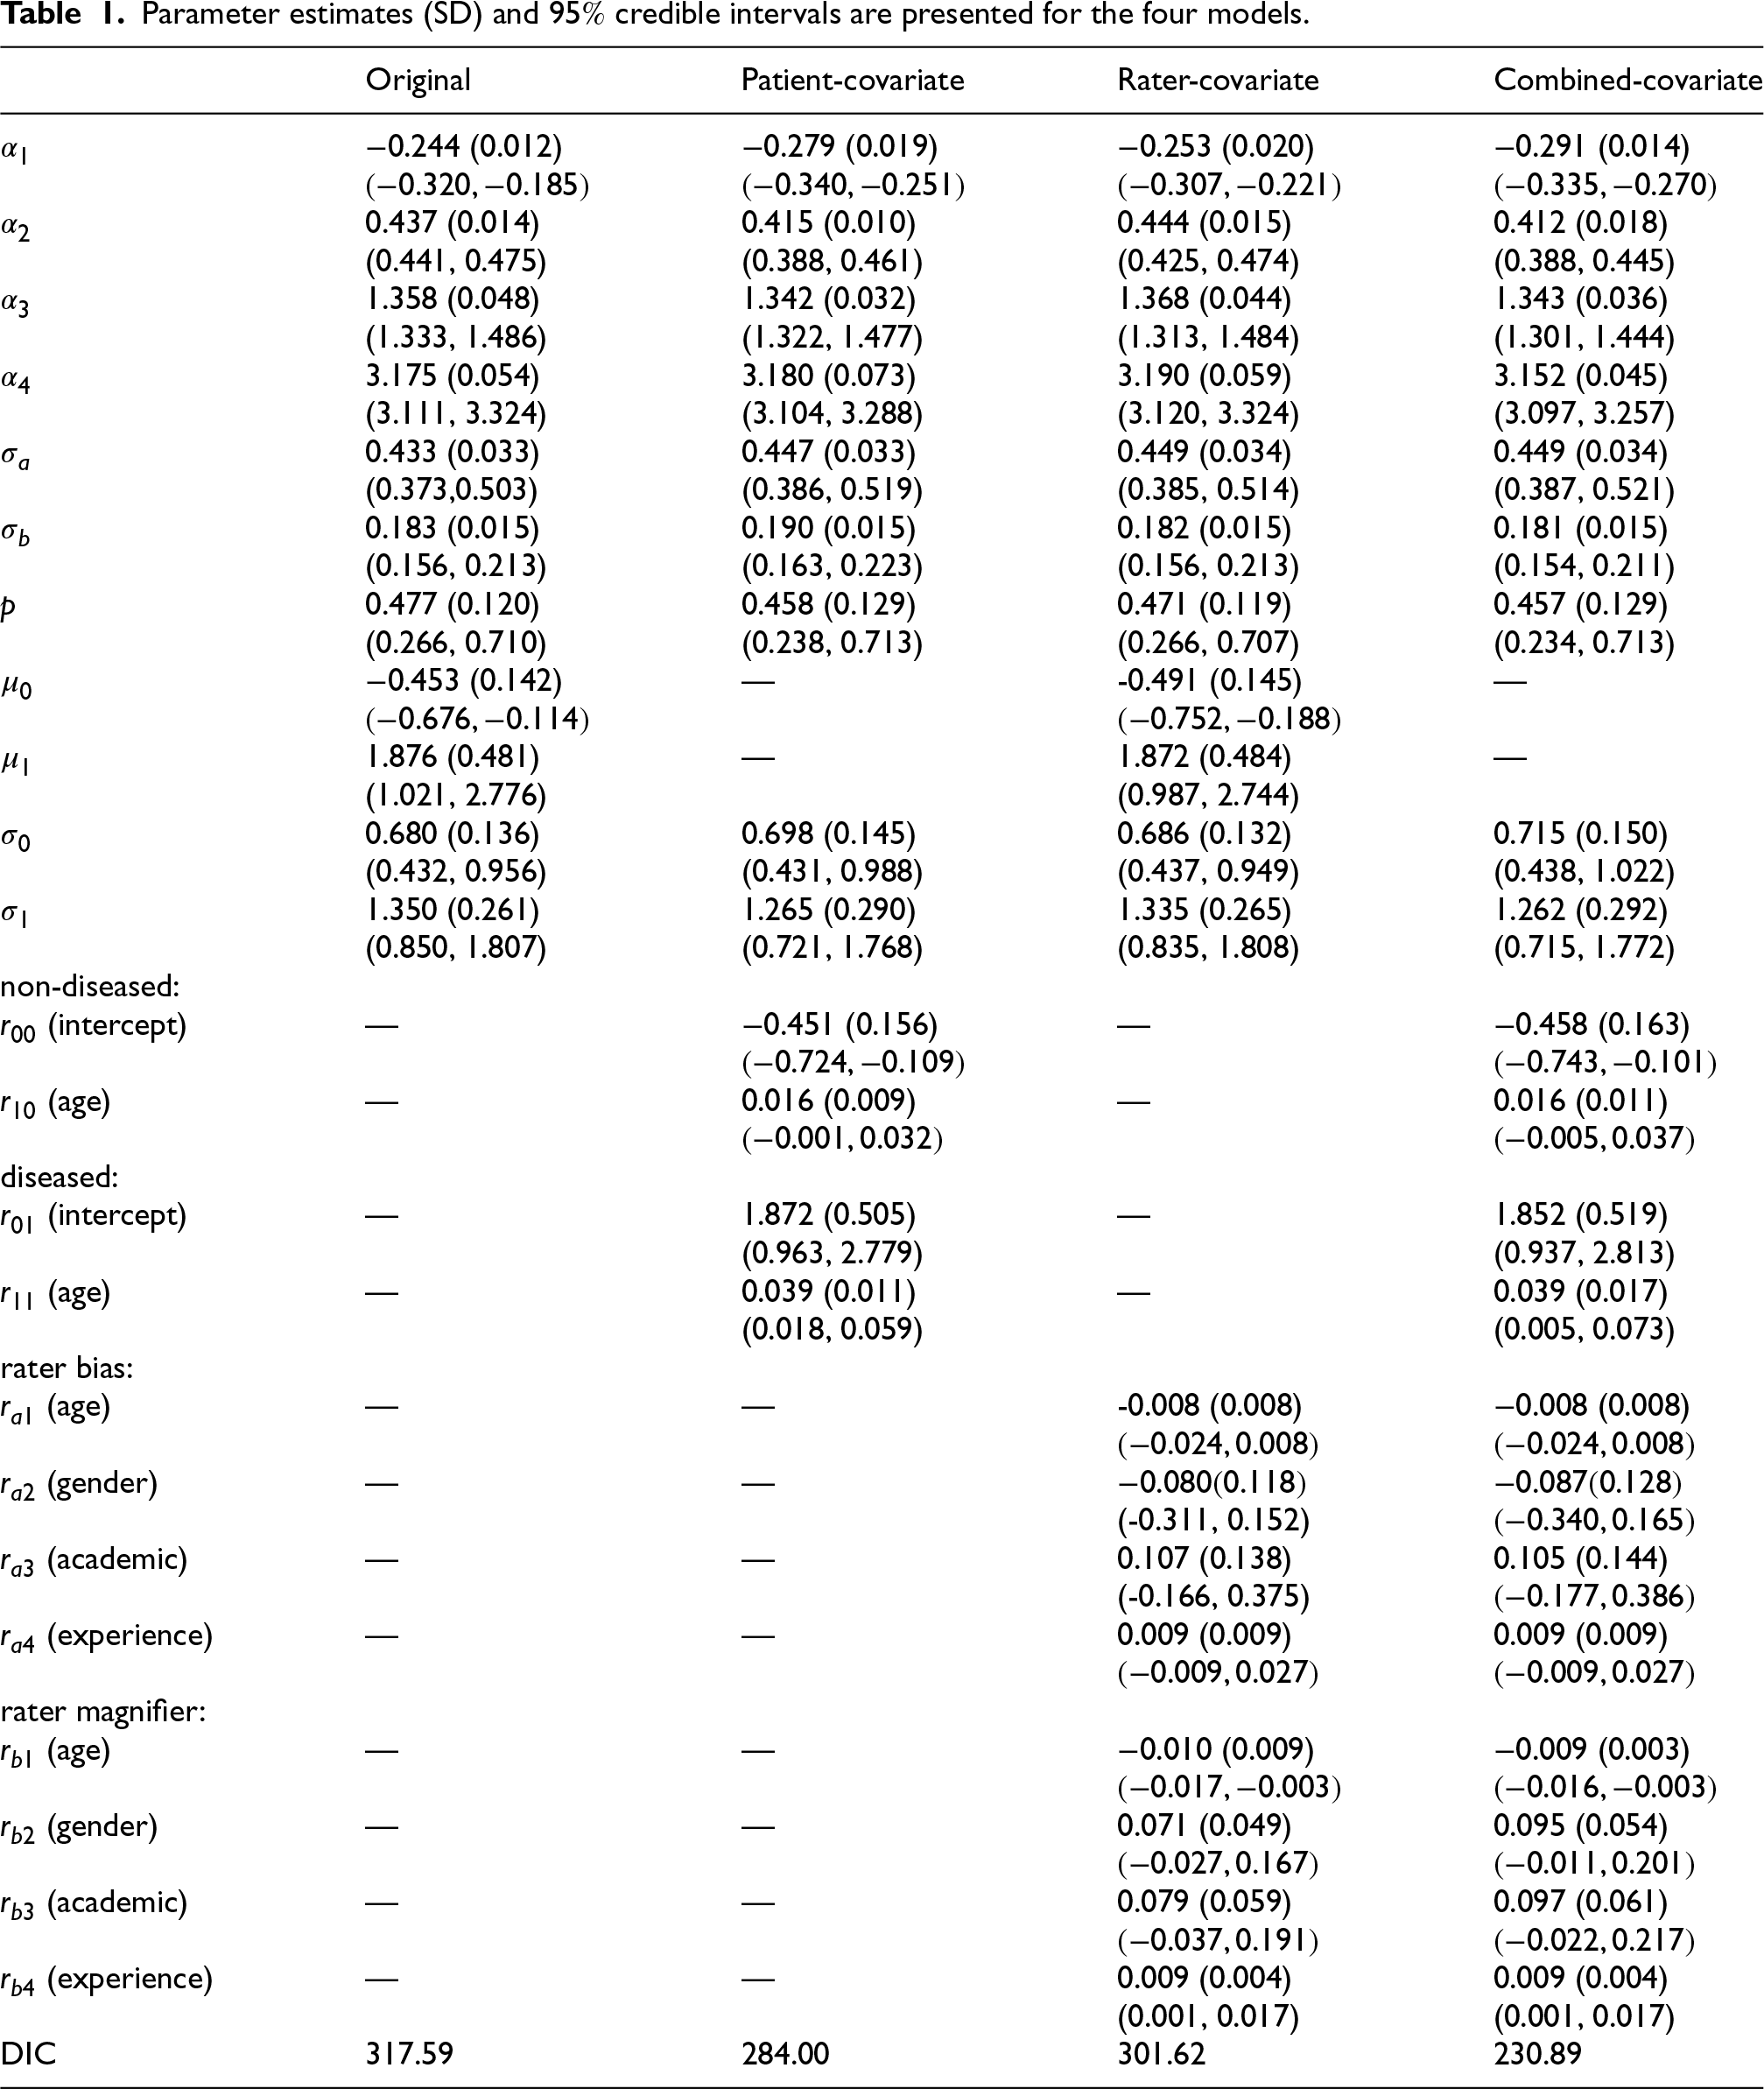
Estimation results of main parameters are summarized in Table 1, listing the estimated posterior means (point estimates), posterior standard deviations, and
Parameter estimates (SD) and
credible intervals are presented for the four models.
Parameter estimates (SD) and
We first discuss several common parameters across the four models. The estimation of thresholds (
To assess the diagnostic variation of the whole group of radiologists, we look at the standard deviation of rater bias and rater magnifier,
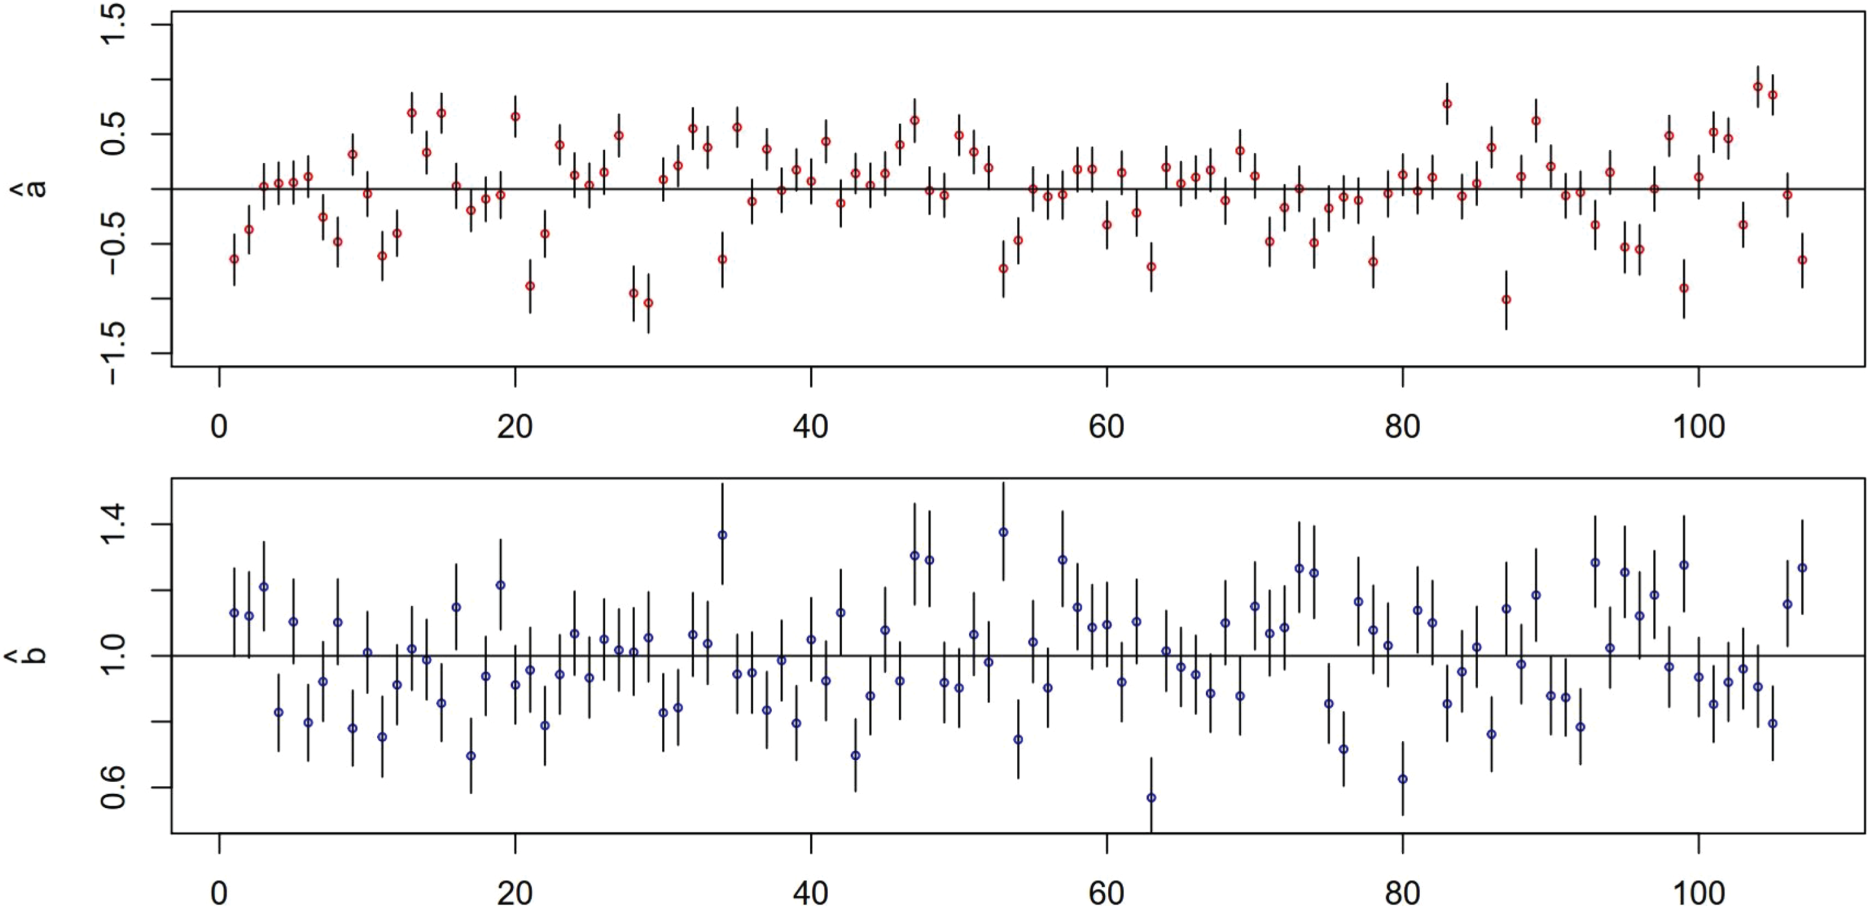
Mammogram data: plots of point estimates and 95 % credible intervals of rater bias
The estimation of the standard deviation parameters
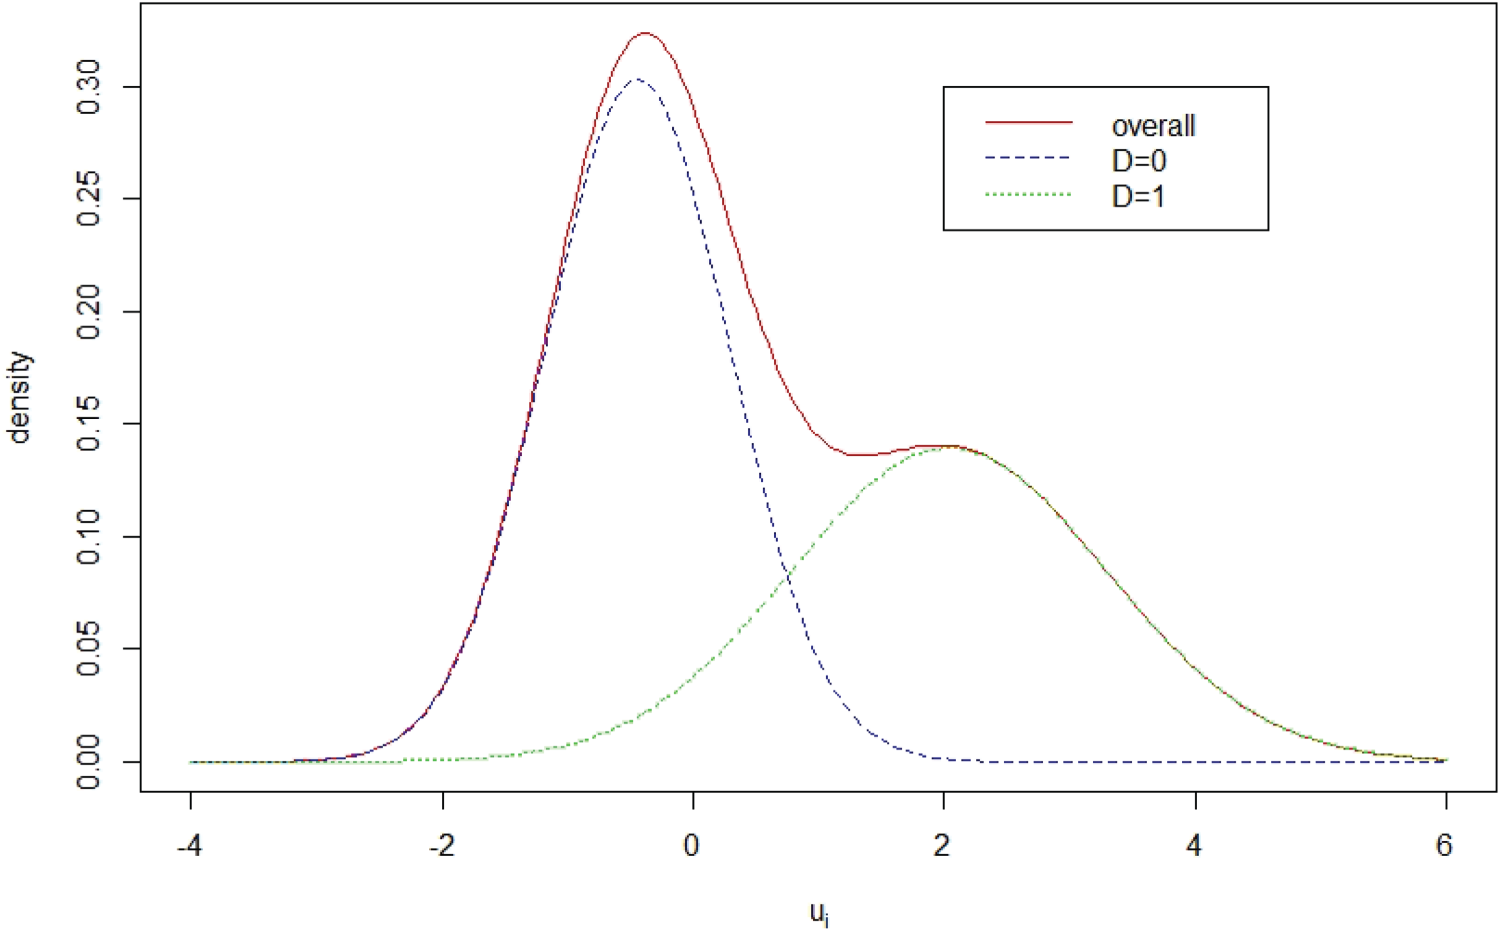
Mammography data: plot of the estimated mixture distribution of patient latent disease severity
In both Patient-covariate and Combined-covariate models, patient age is significant for the patient disease severity of the diseased group but not for the non-diseased group. When a patient age increases one year, the mean disease severity of the disease group is estimated to increase by 0.039 units.
From Table 1, Rater-covariate model and Combined-rater model produce almost identical estimation of rater covariate coefficients. The four covariates have no significant effects on rater bias, but rater age and experience year have significant effects on rater magnifier. Rater age shows a negative effect on the rater magnifier. With one year increase of rater age, the mean of rater magnifier reduces by approximately 0.01 units. The rater experience year shows a positive effect. The rater magnifier mean increases by approximately 0.009 units with a year increase of rater experience year.
One advantage of our proposed disease latent class modeling is to facilitate with the prediction of patient true binary disease statues. To check the prediction adequacy, Figure 3 plots the average prediction of the binary disease status
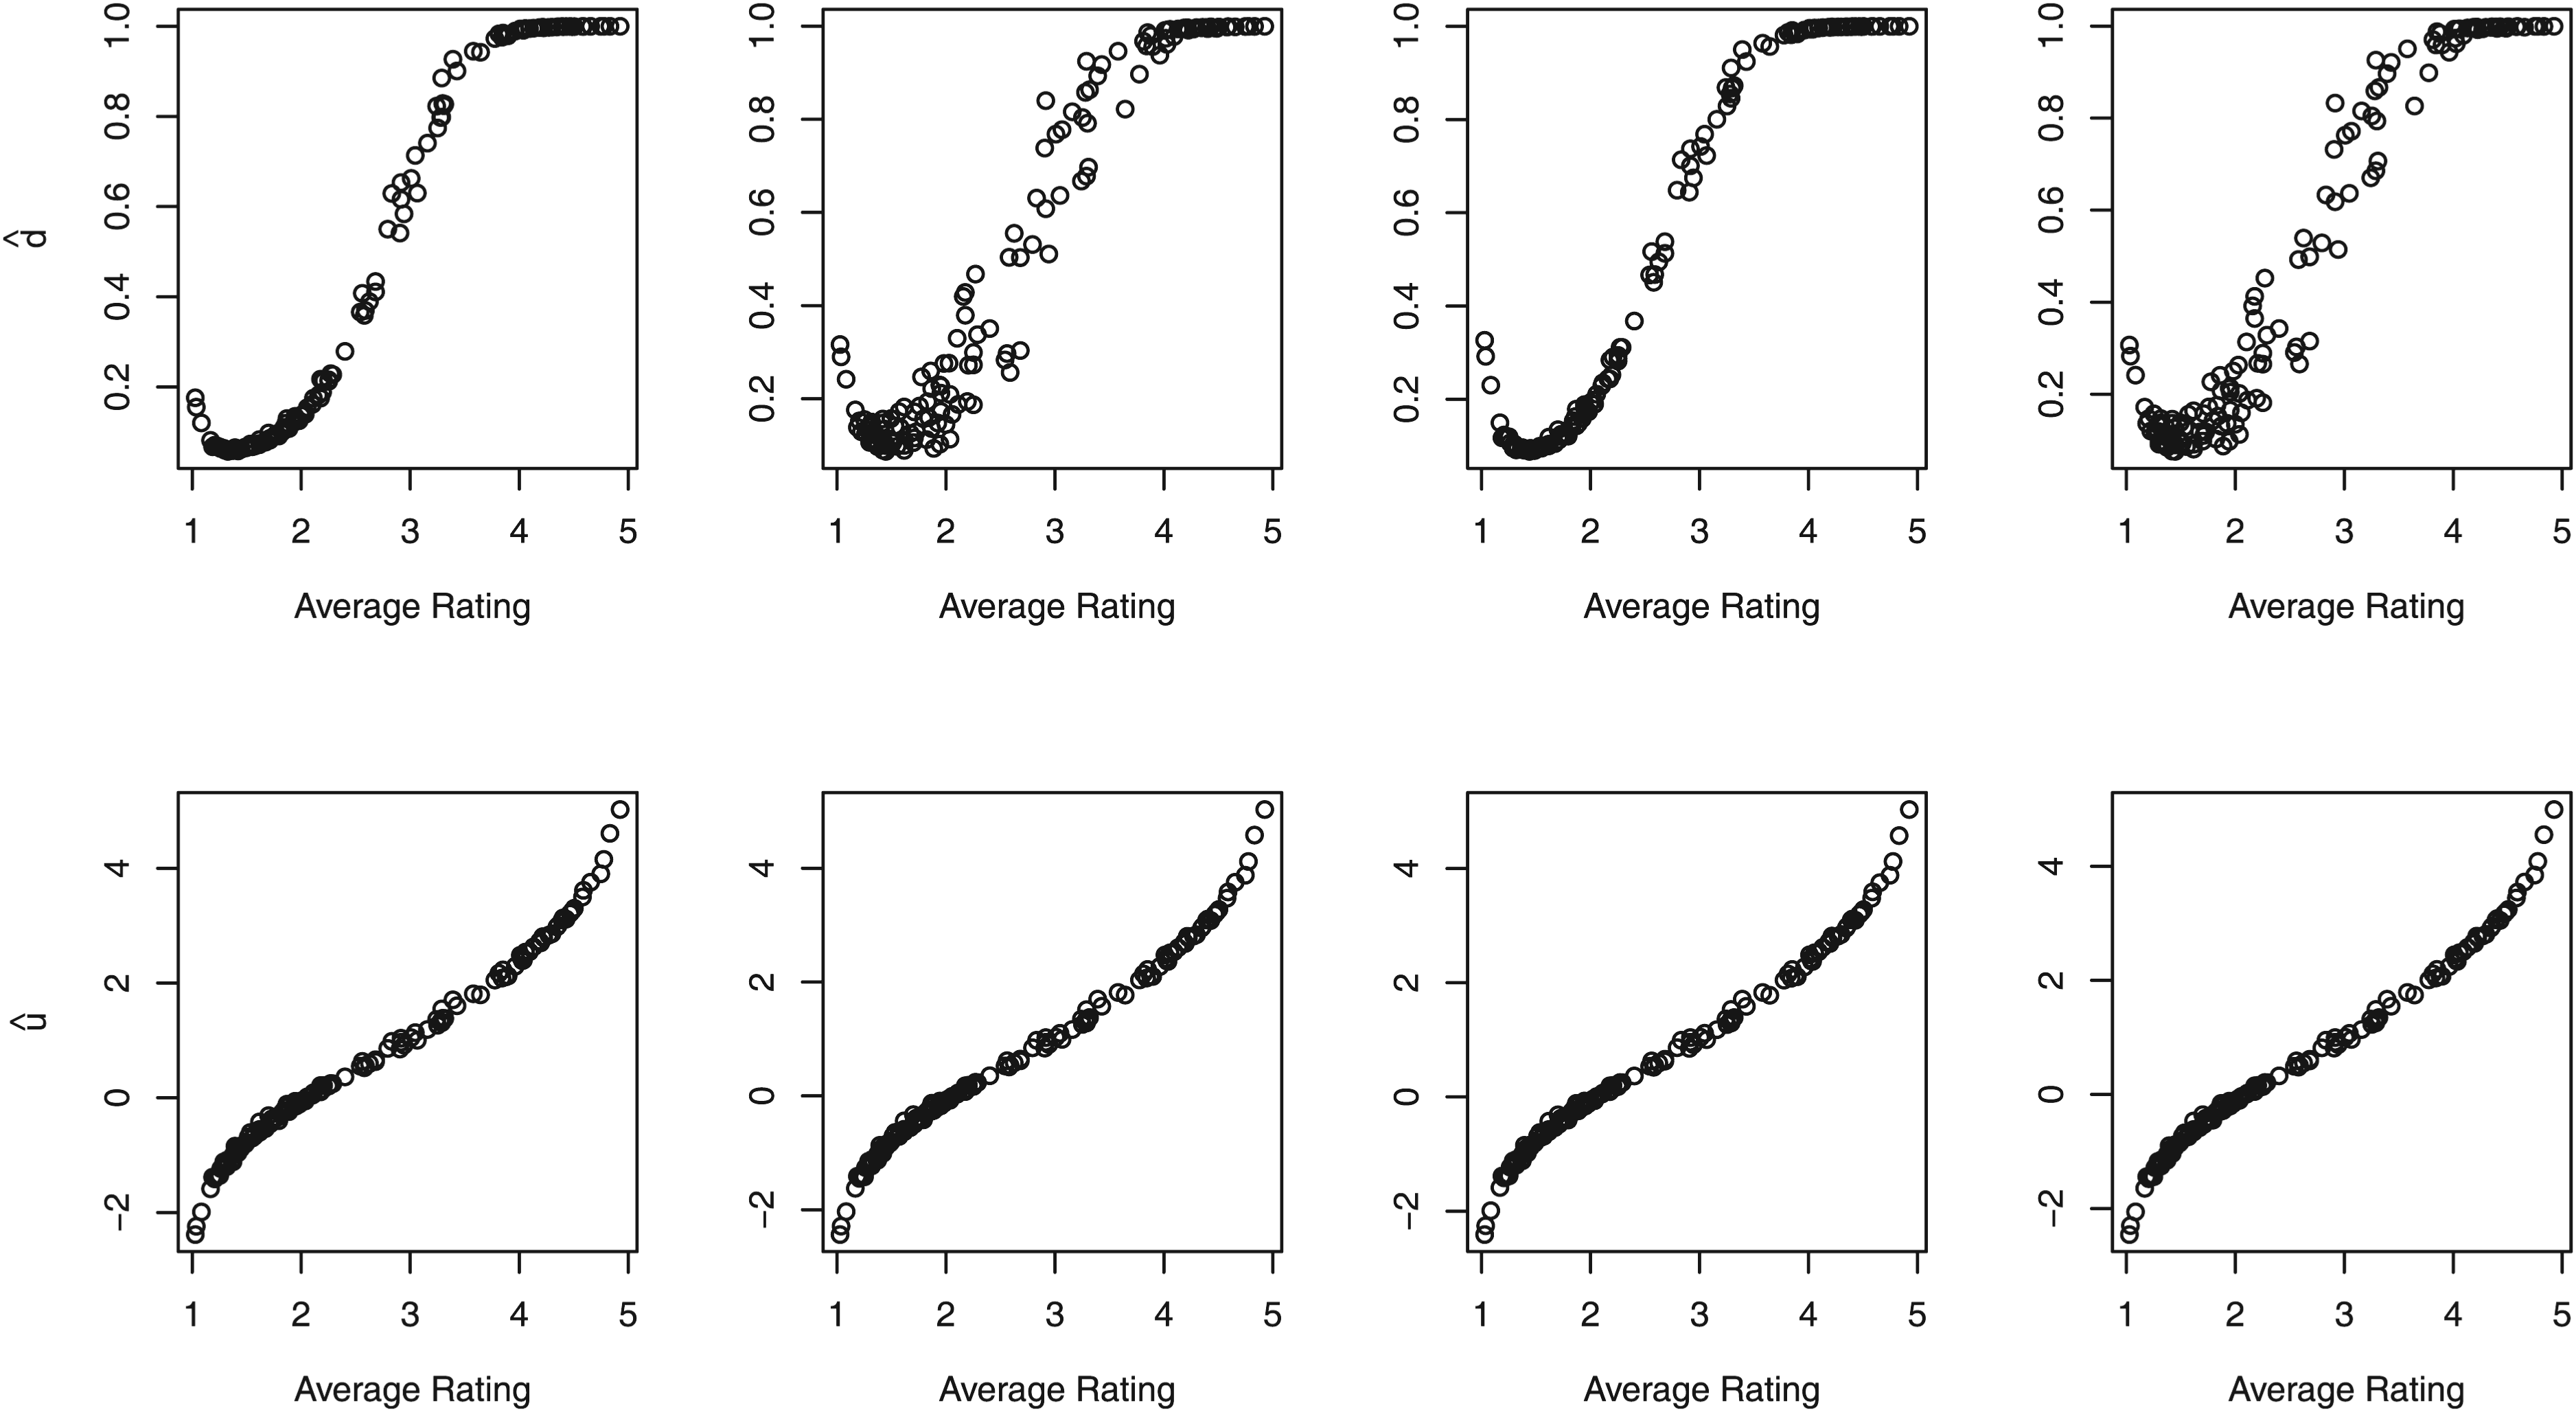
Mammography data: (top panel) plots of the average predicted patient-specific binary disease status
The MCMC sampling allows the estimation of each rater bias
Now we shift our focus to the assessment of rater performance through the utilization of ROC curves and AUCs. The posterior estimates of the ROC curves for individual raters using the original model are presented in Figure 4. Among these curves, the green curve corresponds to the ROC curve of the best-performing rater ( ID: Rater 53) with the highest AUC
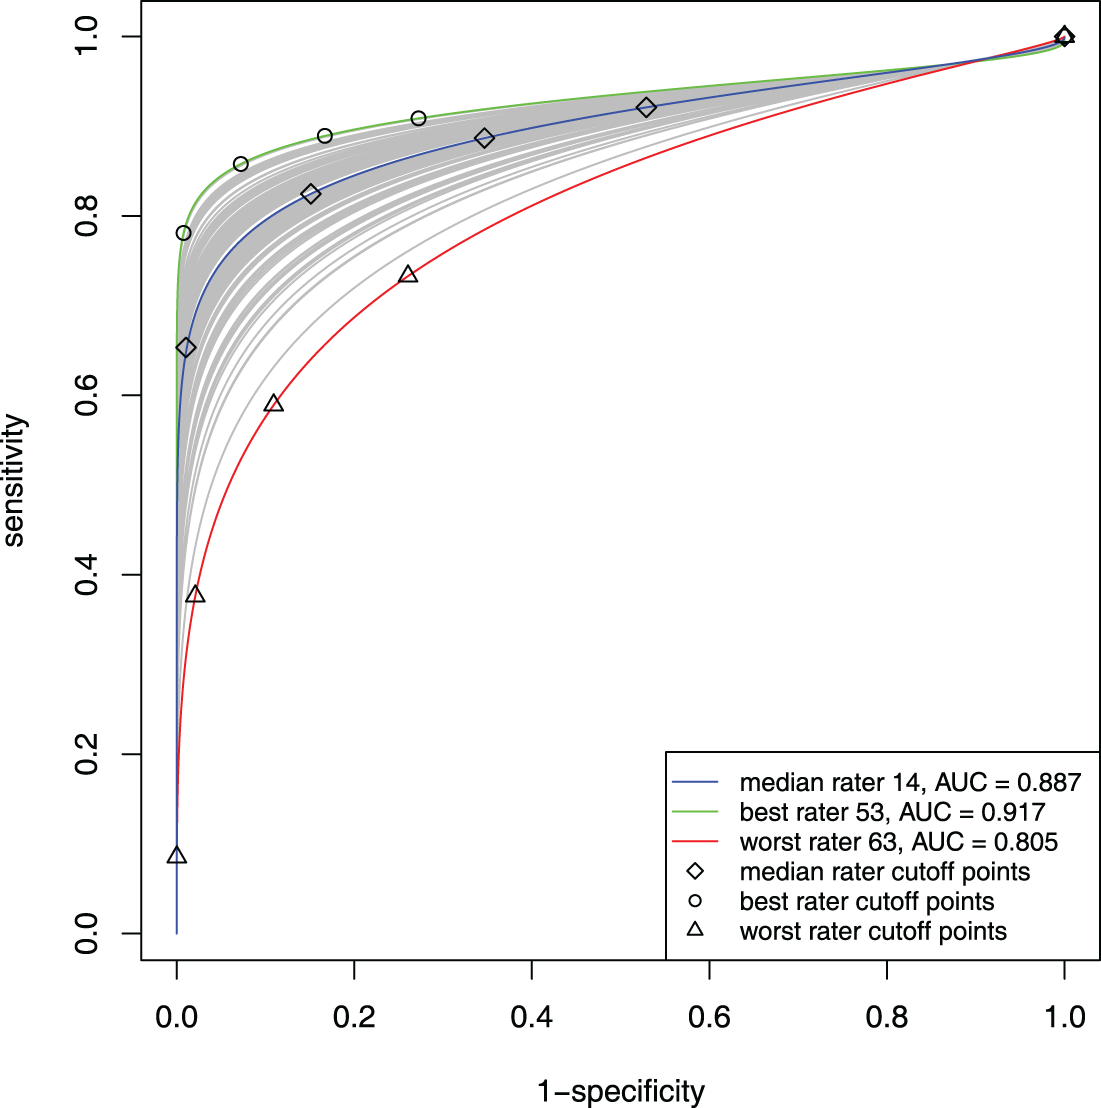
Mammogram data: estimated individual ROC curves, especially ROC curves of the best rater 53, median rater 14, and the worst rater 63, from the original model.
The Patient-covariate model enables drawing patient age-specific ROC curves for each rater, thus visualizing the patient age effect on each rater’s ROC curves. Figure 5 shows ROC curves of the best (ID: 53) and worst rater (ID: 63) for specific 25, 35, 45, 55, and 65 patient age levels. The trend of the ROC curves is the same for both raters: the older a patient is, the higher ROC curve and the lager AUC. The best and worst raters’ AUCs differ tremendously for the same patient age level, especially for younger patients. When patient age is 25, the 53th rater’s AUC is 0.950 and the 63th is 0.843 (difference over 0.1).
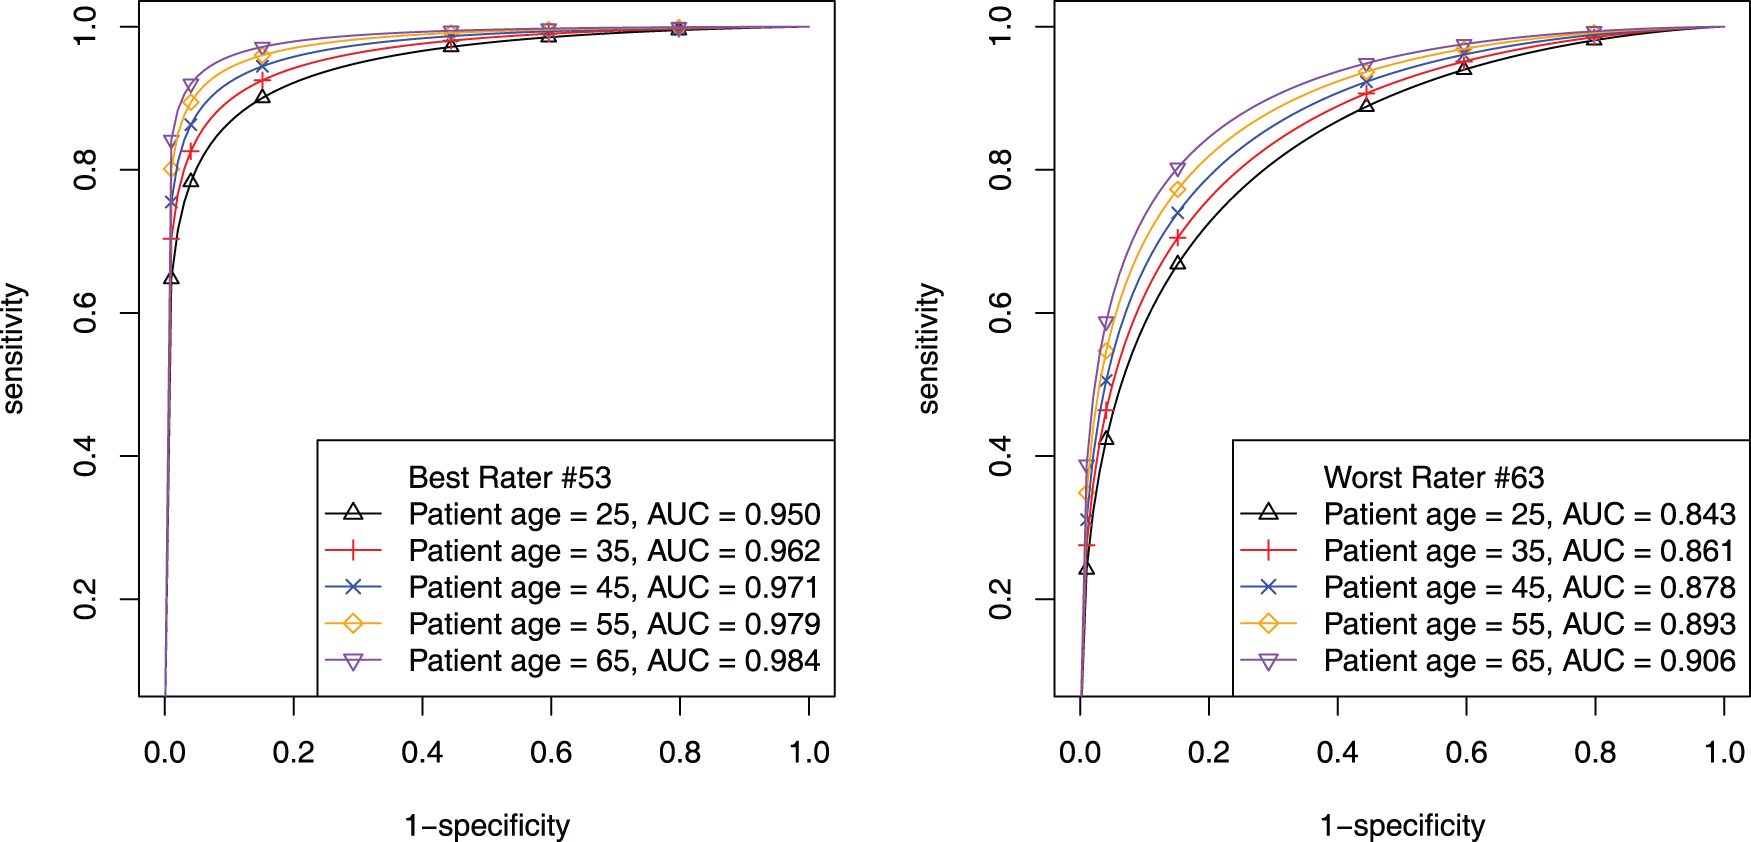
Mammogram data: estimated patient-age-specific ROC curves. The left panel is for the 53th (best) rater; the right panel is for the 63th (worst) rater.
The Rater-covariate model enables drawing rater-covariate-specific ROC curves over the entire patient group. Table 1 has shown that rater age and rater experience year have significant effects on rater magnifier. Figure 6 shows rater experience year’s effect on ROC curves and AUCs across different levels of academic facility linkage and gender while fixing rater age as 50. The upper two graphs are for raters who are not academically linked raters and the lower two graphs are for raters who are academically linked. Within each layer, male is on the left and female is on the right. Rater experience year levels are 5, 10, 15, 20, 30. Figure 6 illustrates an overall pattern of longer experience year dictating higher ROC curves and larger AUCs. According to the AUC estimates, it is also observed that the academic group slightly outperforms the non-academic group and that female raters exhibit slightly larger AUCs than males consistently. Note that the ROC curves for investigating rater age effect are displayed in the supplementary file.
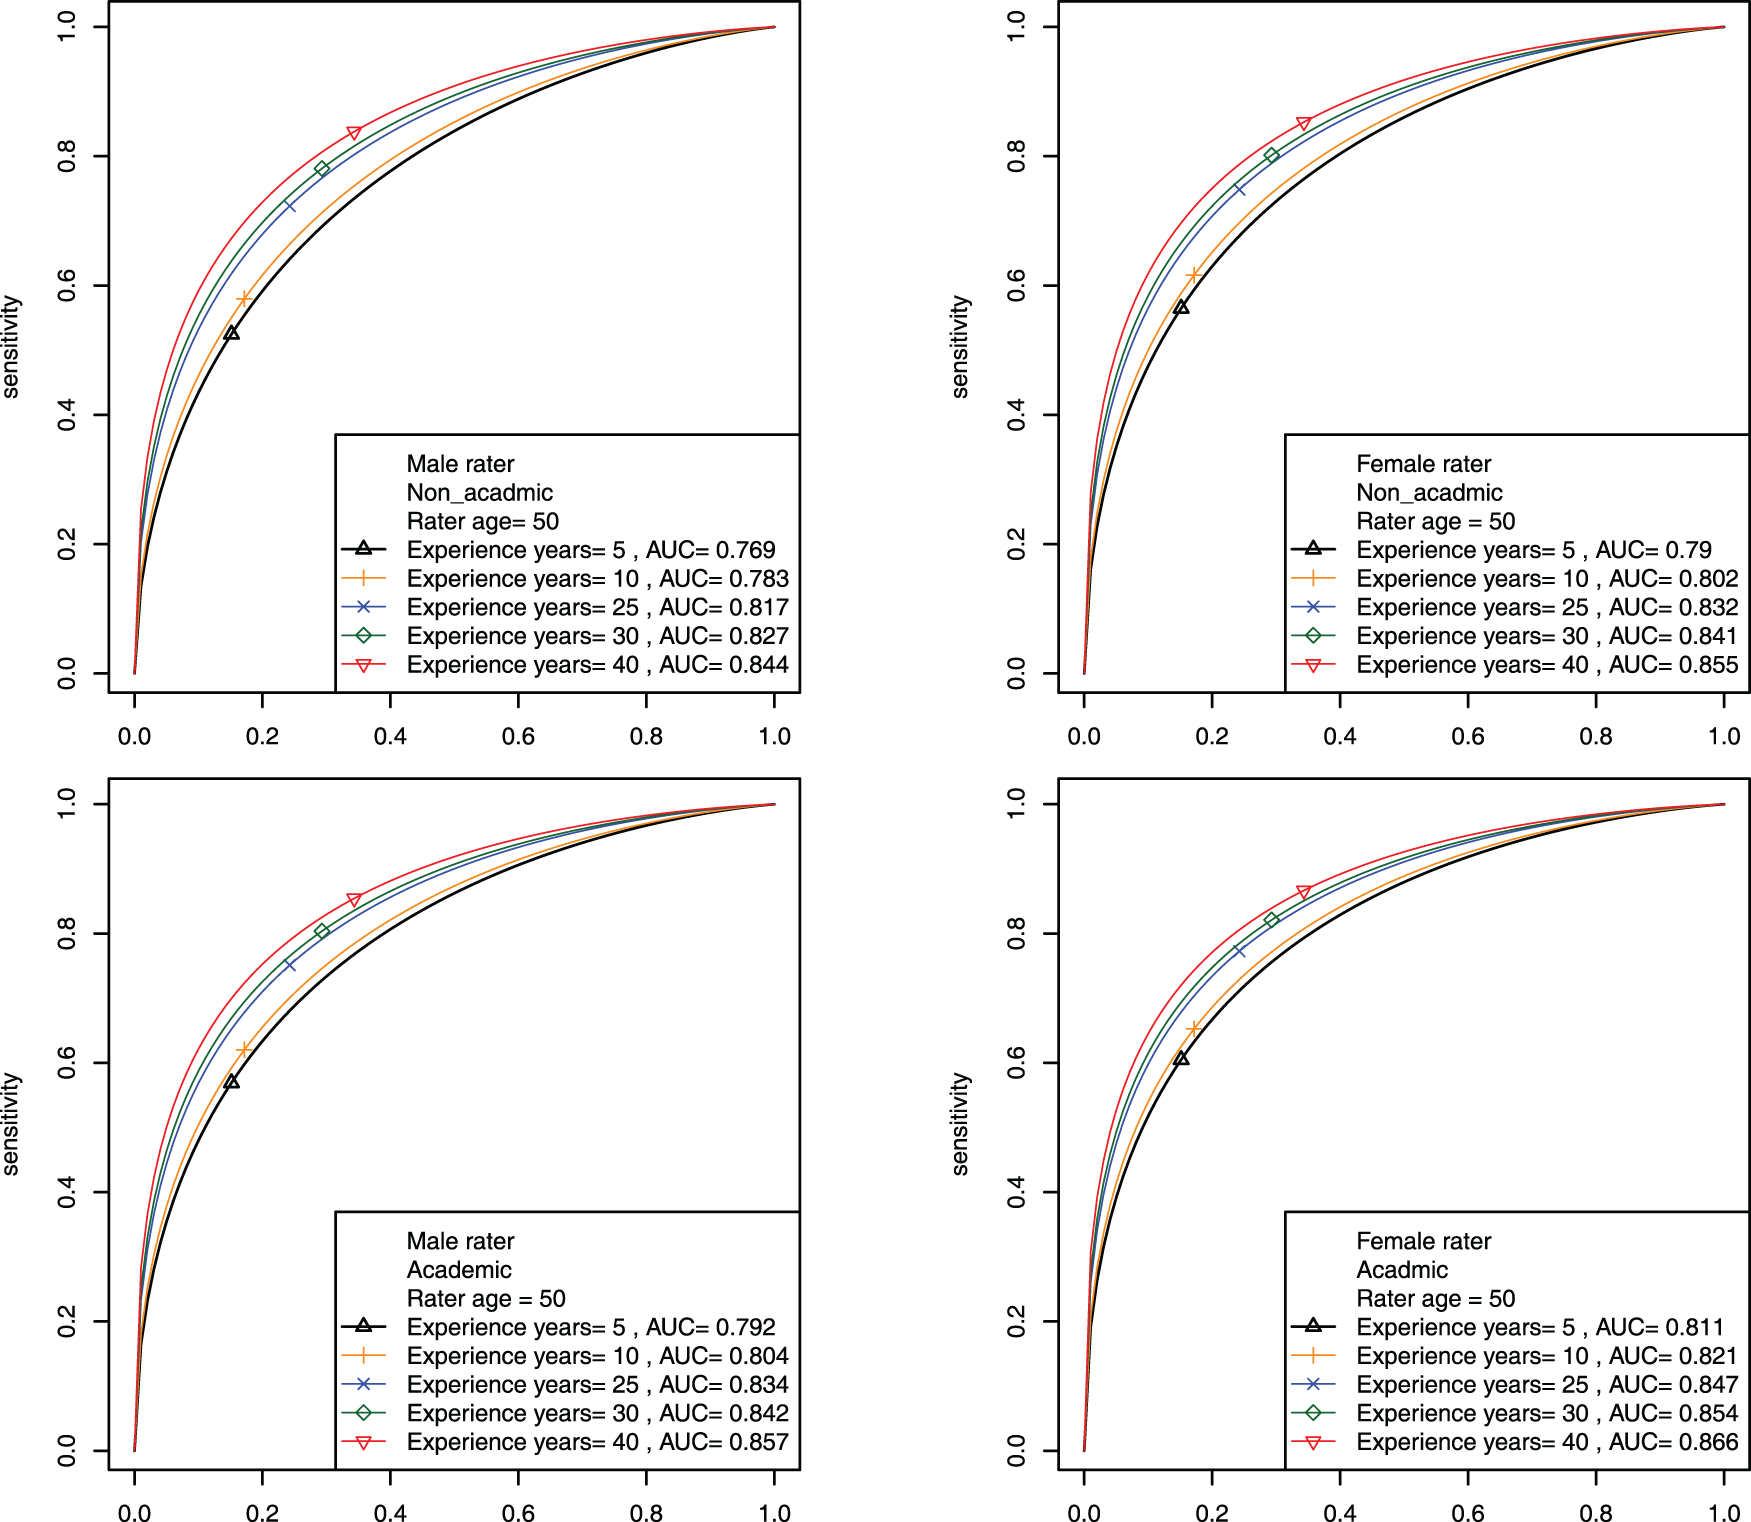
Mammogram data: estimated rater-covariate-specific ROC curves for investigating the effect of rater experience year across different levels of academic facility linkage and gender when fixing rater age at 50.
The Combined-covariate model is particularly intriguing and complicated, as patient and rater covariates synergistically influence ROC curves and AUCs. To illustrate, we consider only academically linked raters with age fixed at 50 and display the results for investigating the effects of rater experience year and patient age across the two levels of gender. The plots investigating the effects of rater age and patient age across the two levels of gender can be found in the supplementary file. Figure 7 shows that regardless of gender, the longer experience year is, the higher ROC climbs. For different patient age levels (35, 55, and 65, looking across columns), we observe that the older patient is, the higher ROC and the larger AUC are. Although the gender effect is not significant for the diagnostic magnifier (seen in Table 1), comparing the two rows in Figure 7 shows that female raters consistently perform better than male raters with slightly larger AUCs.
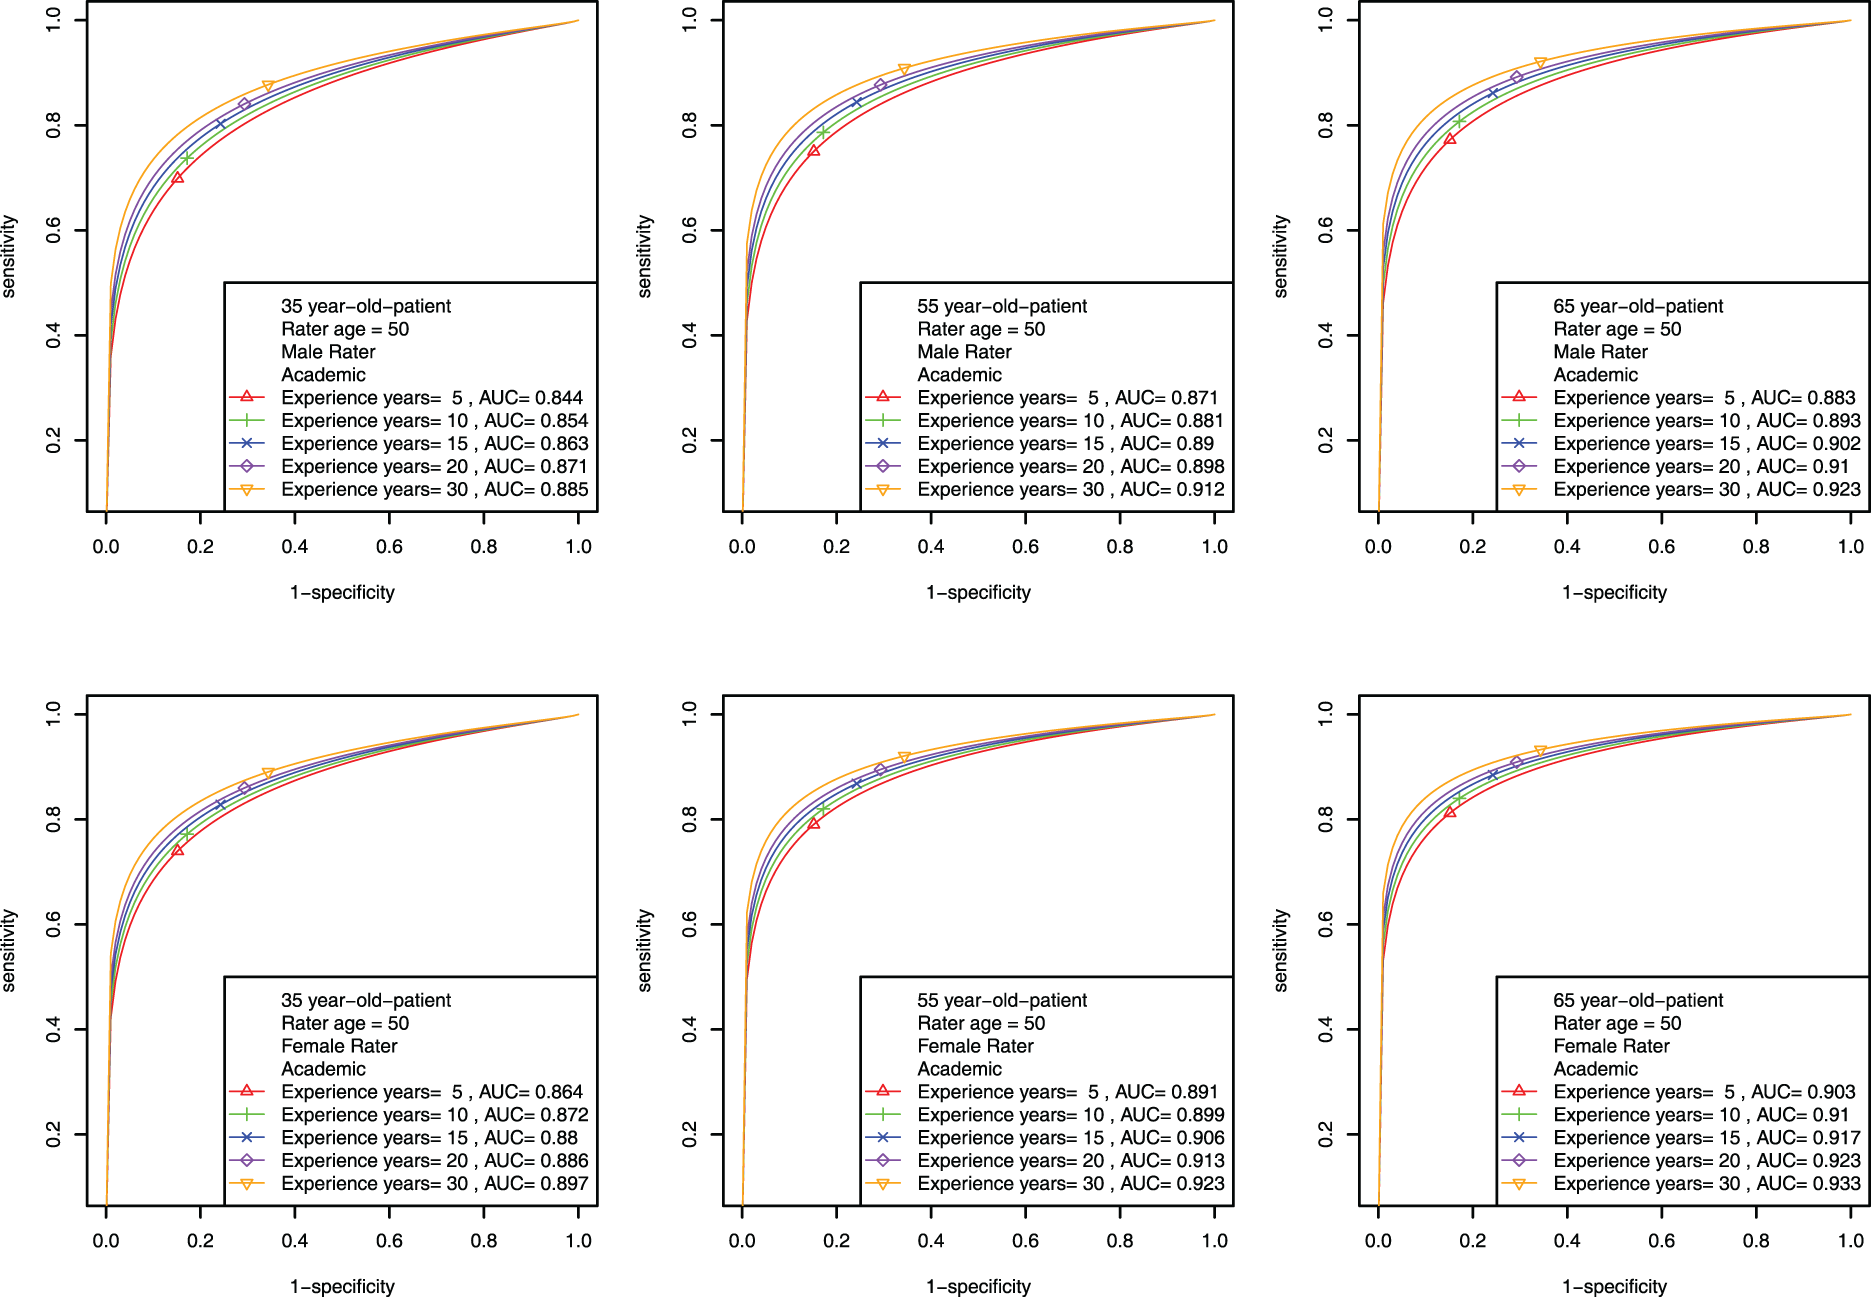
Mammogram data: estimated patient-rater-covariate-specific ROC curves for investigating the effects of rater experience year and patient age for academically linked raters across different levels of gender when fixing rater age at 50.
In this paper, we have proposed a hierarchical probit model with latent disease class modeling to analyze MRMC ordinal data, aiming to assess diagnostic accuracy of raters. Subsequently, we extend the model through incorporating covariate effects into rater diagnostic skill parameters and/or patient latent disease severity. The four models are referred to the original model, Patient-covariate model, Rater-covariate model and Combined-covariate model. For each model, we have developed smoothed ROC curves and corresponding AUC formulas to study rater diagnostic accuracy with or without covariates effects. Gibbs samplers have been developed for parameter estimation for these four models. Simulation studies are conducted and show good estimation performance of the four models. The details of the Gibbs samplers and simulation results are documented in the supplementary file. Applying the proposed models to Beam’s mammogram data demonstrates the practicality and validity of the proposed models.
Every proposed model in this paper possesses speciality. The original model studies rater’s ROC curve individually and globally. Patient-covariate model reveals patient-specific covariate effects on rater diagnostic accuracy. Rater-covariate model captures the effects of rater-specific covariates on diagnostic accuracy. Combined-covariate model allows patient and rater covariates to affect diagnostic accuracy synergistically. Including covariates allows an in-depth analysis of how each covariate contributes to the change of diagnostic accuracy through the analysis of ROC curves and AUCs. Especially in Combined-covariate model, patient and rater’s covariates work synergistically, providing deeper insights into the covariate effects on the diagnostic accuracy. The choice of model depends on research questions and available information in the dataset. The proposed approach also enables researchers to better understand patient and rater covariate effects on the disease status prediction. This insight can empower healthcare providers make better decisions when diagnosing patients.
From the literature, label switching problem usually occurs during the parameter estimation process when latent class models applied.22,23 In this paper, the diseased and non-diseased label switching issue is not present during the parameter estimation process even though the decomposition of
Our proposed models do not require any established gold standard, which represent the true disease status. However, should gold standard be available, our methods have the capability to seamlessly adapt by simply dropping the sampling step of
Imbalanced MRMC data are often encountered in practice. The incompleteness of the data does not pose a significant challenge for Bayesian MCMC estimation methods. To address missing data, one simply treat them as latent variables and sample them during the MCMC iterations. However, the missing data may worsen the label switching/nonidentifiability issue. In the supplemental file, some simulation results are presented to show the effect of the missing data on the estimation. In future work, we will investigate the label switching problem systematically by connecting the missing data percentage and the disease severity parameters for the diseased and non-diseased patient groups.
Appendix
Assume that a rater has a continuous rating score 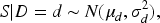


Supplemental Material
sj-pdf-1-smm-10.1177_09622802251404063 - Supplemental material for Diagnostic accuracy analysis for multiple raters using probit hierarchical model for ordinal ratings
Supplemental material, sj-pdf-1-smm-10.1177_09622802251404063 for Diagnostic accuracy analysis for multiple raters using probit hierarchical model for ordinal ratings by Yun Yang, Xiaoyan Lin and Kerrie P Nelson in Statistical Methods in Medical Research
Footnotes
Funding
The authors disclosed receipt of the following financial support for the research, authorship, and/or publication of this article: The authors are grateful for the partial support provided by R01 grant (5R01CA226805-04) from the United States National Institutes of Health.
Declaration of conflicting interests
The authors declared no potential conflicts of interest with respect to the research, authorship, and/or publication of this article.
Supplemental material
Supplemental material for this article is available online.
References
Supplementary Material
Please find the following supplemental material available below.
For Open Access articles published under a Creative Commons License, all supplemental material carries the same license as the article it is associated with.
For non-Open Access articles published, all supplemental material carries a non-exclusive license, and permission requests for re-use of supplemental material or any part of supplemental material shall be sent directly to the copyright owner as specified in the copyright notice associated with the article.