
Abstract
In several clinical areas, traditional clinical trials often use a responder outcome, a composite endpoint that involves dichotomising a continuous measure. An augmented binary method that improves power while retaining the original responder endpoint has previously been proposed. The method leverages information from the undichotomised component to improve power. We extend this method for basket trials, which are gaining popularity in many clinical areas. For clinical areas where response outcomes are used, we propose the new augmented binary method for basket trials that enhances efficiency by borrowing information on the treatment effect between subtrials. The method is developed within a latent variable framework using a Bayesian hierarchical modelling approach. We investigate the properties of the proposed methodology by analysing point estimates and high-density intervals in various simulation scenarios, comparing them to the standard analysis for basket trials that assumes binary outcomes. Our method results in a reduction of 95% high-density interval of the posterior distribution of the log odds ratio and an increase in power when the treatment effect is consistent across subtrials. We illustrate our approach using real data from two clinical trials in rheumatology.
Keywords
Introduction
In many clinical trials for complex diseases, selecting a single primary endpoint has proven challenging, with many endpoints being of clinical interest. 1 Responder endpoints are commonly proposed to combine distinct components into a single measure. These are typically composite endpoints consisting of binary and at least one continuous measure. The continuous components are often dichotomised using a pre-specified threshold. Patients are classified as responders if their continuous component reaches the threshold, in addition to meeting the criteria for the binary component(s). For example, in the context of cancer trials, a patient is defined as a responder if their tumour size shrinks by more than 30% and they do not have new tumour lesions detected. 2 However, it has been shown that using binary responder endpoints leads to larger expected and maximum sample sizes compared to continuous endpoints. 3 To this end, the augmented binary method 4 has been developed to model the joint distribution of the continuous outcome and a binary outcome. The method improves the precision of analysis and increases power by avoiding the loss of information from dichotomising a continuous component. Initially developed for cancer trials, the method has since been adapted for use in clinical trials for rheumatoid arthritis. 5
In the area of rheumatic diseases, the most common outcomes are the disease activity score, which includes different 28-joint counts (DAS28),
6
and the American College of Rheumatology (ACR) improvement criterion
7
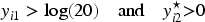
; both are based on dichotomised information such as DAS28 being less than a specific threshold, or ACR achieving a pre-specified percentage threshold. Additionally, a binary indicator
Patients are considered responders based on both binary or dichotomised continuous variables, and the binary indicator
However, the method has so far been restricted to standard single-arm and two-arm clinical trials. Recently, basket trials, which aim to investigate a single therapy across multiple conditions, have become popular. 12 Basket trials consist of subtrials characterised by a specific disease, with each subtrial investigating the same treatment. Originating in the field of oncology and aiming to target shared molecular aberrations, basket trials have been extended to other areas such as immune-mediated inflammatory diseases (IMIDs), where similar symptoms are shared across multiple conditions. 13 The efficiency of basket trials lies in their requirement of fewer patients and a shorter duration compared to traditional trial designs, owing to the borrowing of information between subtrials. It has been demonstrated that sharing information between the subtrials in a basket trial leads to more efficient utilisation of data.14–18
In this work, we extend the sharing of information to composite outcomes in basket trials, while leveraging the augmented binary method via a latent variable framework. This method is motivated by basket trials, which are most commonly used in oncology and typically analyse RECIST response.
19
We propose that responder outcomes in basket trials in IMIDs could be modelled similarly to trials in oncology. The method is based on a latent variable approach and is implemented in a Bayesian framework. It utilises a multivariable normal distribution to model the continuous outcome and a latent variable that is assumed to determine the binary indicator
Methods
Notation
Suppose a randomised, placebo-controlled trial is conducted, in which patients
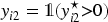
We assume that we are working with a 20% improvement in the American College of Rheumatology criteria (ACR20) response criteria, where a response is defined if the ACR-N is dichotomised at 20%. We work on the log scale, as this was shown to be closer to normally distributed in previous work.
5
According to this criterion, a patient is defined as a responder if

Stratified augmented binary method
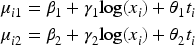
We introduce an augmented binary method for a non-basket framework based on a latent variable approach (hereafter referred to as stratified analysis). The outcomes are modelled using a multivariate probit regression model as follows:
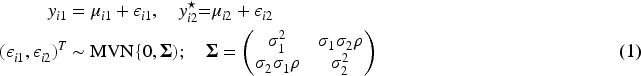
The means of the outcomes are modelled as follows:
Based on previous research on borrowing information in basket trials,
17
the parameters for the intercept and baseline effect,
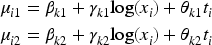
We now extend the method to cover a randomised, placebo-controlled basket trial with
The means of the outcomes are modelled as follows:
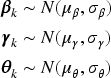
Prior level 1
The vectors
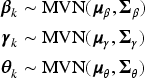
Prior level 2
The standard deviations
Binary method for basket trials (BIN)
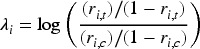
We compare the ABBA method with the BIN method, where we fit a logistic regression model to the dichotomised responder data, modelling the probability of response with the logistic regression

The parameters

Prior level 2
The prior means
Inferring success probability
For the ABBA method, the probability of success for participant

For the BIN method, the probability of success for participant

The log odds ratio for the

Implementation
The Bayesian analysis models are implemented in Stan,
22
using the “rstan” package.
23
For the multivariate probit regression, the latent continuous variable is divided into two parts based on whether the corresponding observed binary variable is 0 or 1. This division results in positive-constrained and negative-constrained components, where the sizes correspond to the counts of true (1) and false (0) observations in the binary variable. The positive-constrained and negative-constrained components are sampled separately from the uniform distribution, and the latent variable is constructed to account for the indices of 0s and 1s in the observed binary variable. To obtain the posterior distribution of the parameters, we employ two parallel chains, each running the Hamiltonian Monte Carlo sampler for 10,000 iterations after a burn-in period of 5,000 iterations. We examined the Markov Chain Monte Carlo (MCMC) output to ensure that no warnings indicated convergence issues or other sampling problems.
Simulation study
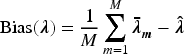
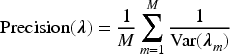
To understand the properties of the ABBA model and compare it with the BIN model, we conducted a series of simulation studies. We investigated basket trials with three or six subtrials, assuming that participants were equally randomised. In most scenarios, we used a relatively small sample size (50 participants per subtrial) to reflect the typical sample sizes observed in real-world phase II clinical trials. To evaluate the method’s performance with larger samples, we also considered a sample size of 100 participants per arm for one of the scenarios, as well as a scenario with unequal sample sizes across the subtrials. Working with the posterior distribution of the log odds ratios Bias of the posterior means of Posterior precision of one-sided power defined as the proportion of simulations where the lower limit of 95% HDI for Width of 95% HDI for Coverage, defined as the proportion of simulation replicates in which the 95% HDI for
True values of the parameters for simulation studies, as estimated for a sample size of 3,000,000.
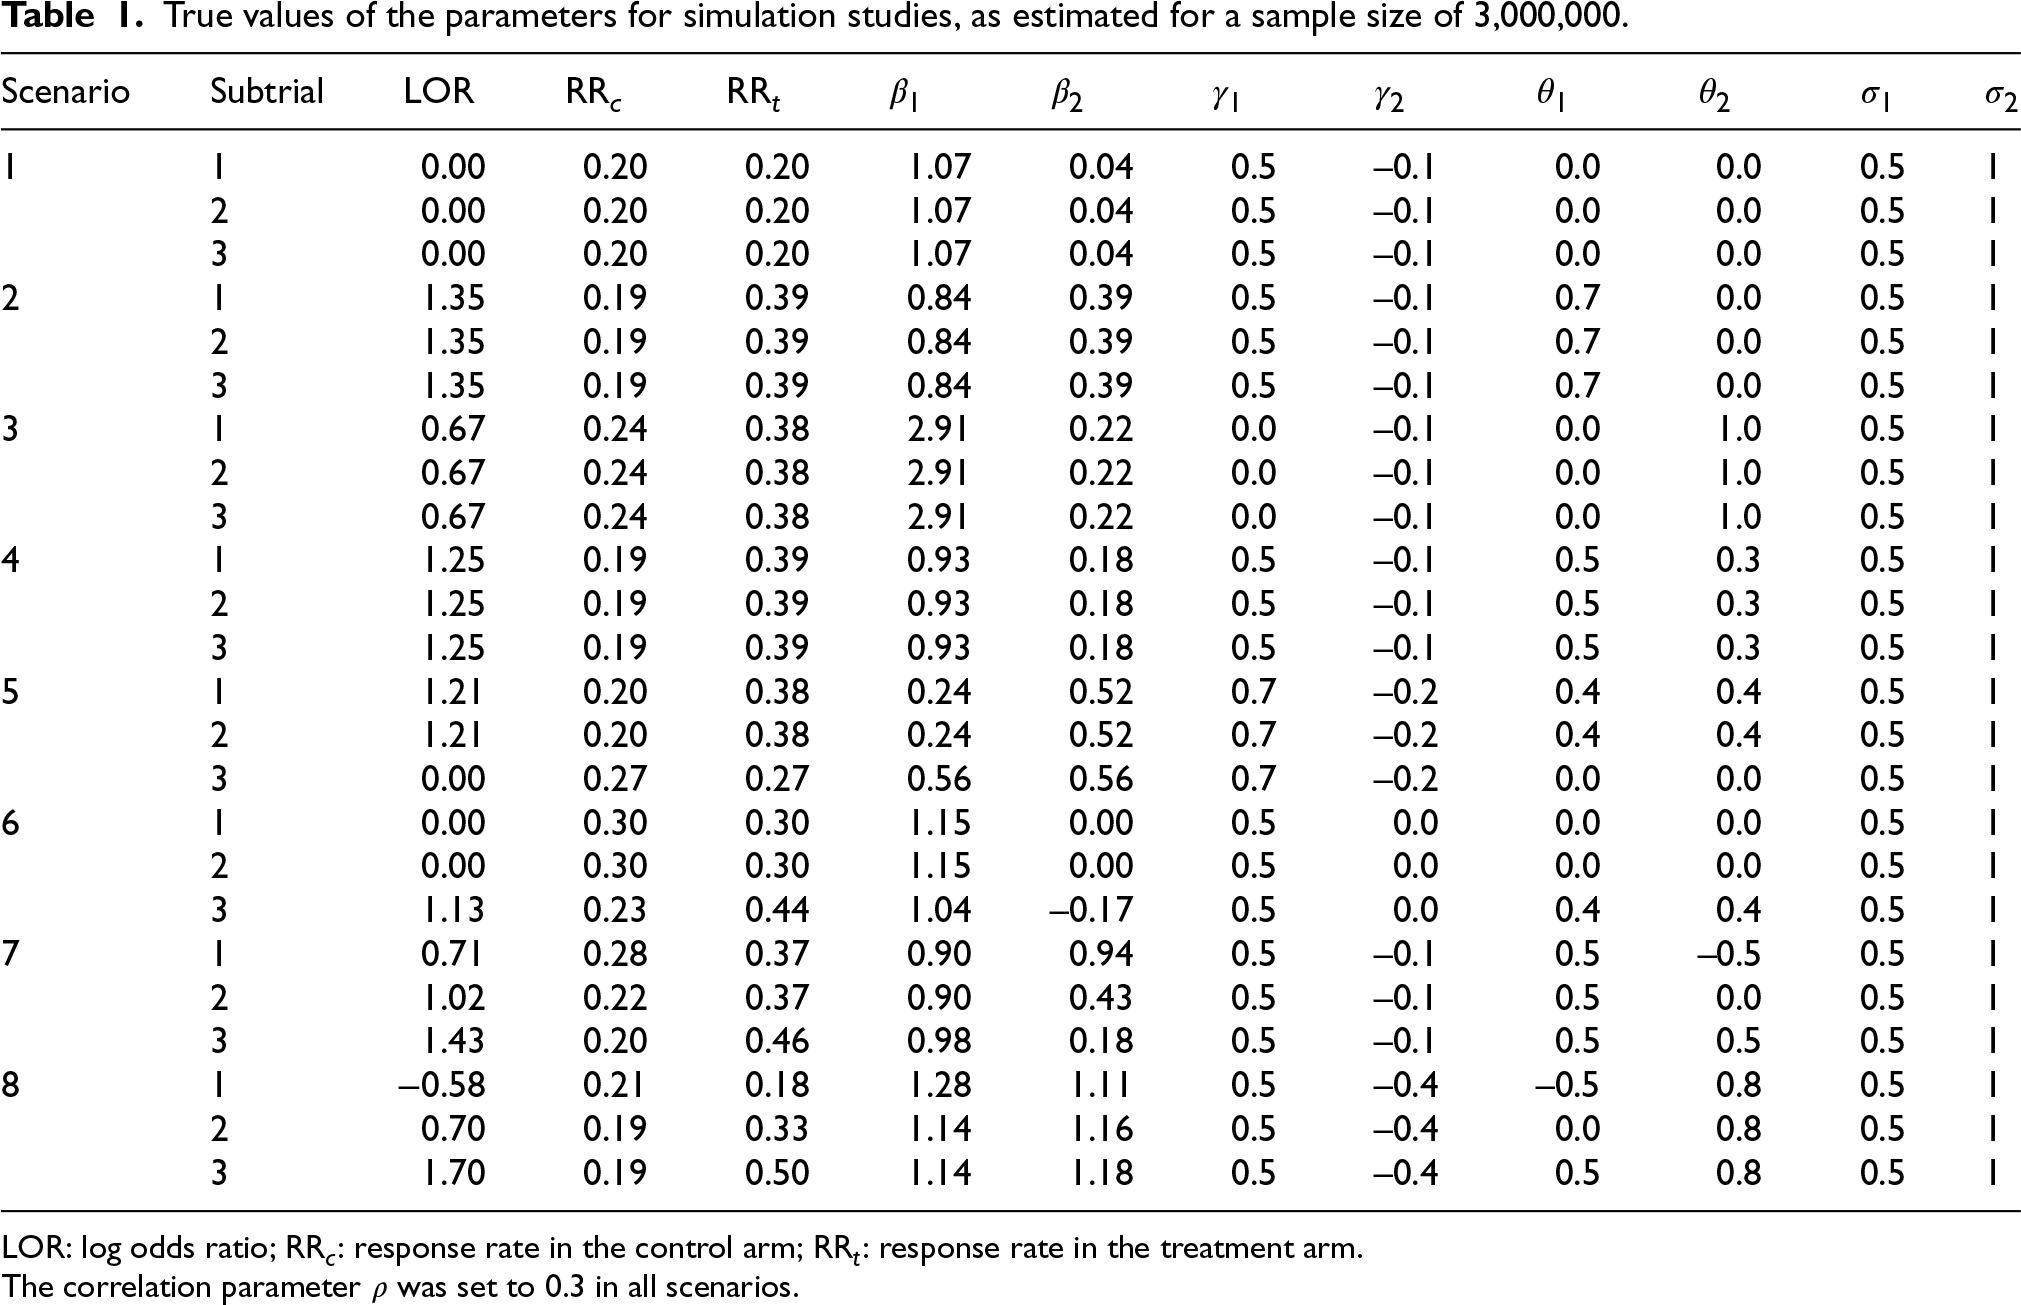
LOR: log odds ratio; RR
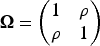
The correlation parameter
We investigated two settings: one with a global effect, in which there is either the presence or absence of an effect, and another with non-global effects, in which there is a mixture of presence and absence of effects. The global effect setting comprised scenarios 1–4:
Scenario 1: The null scenario (no treatment effect in all subtrials).
Scenario 2: Treatment effect on the continuous component only, consistent across subtrials.
Scenario 3: Treatment effect on the latent component only, consistent across subtrials.
Scenario 4: Treatment effect on both components, consistent across subtrials.
The non-global effect setting was explored through scenarios 5–8:
Scenario 5: Treatment effect on both components consistent in two subtrials, no treatment effect in the other subtrial. Hereafter, subtrials with no treatment effect will be referred to as null subtrials.
Scenario 6: Treatment effect on both components in one subtrial, no treatment effect in the other two subtrials.
Scenario 7: Treatment effect consistent on the continuous component, inconsistent on the latent component.
Scenario 8: Treatment effect consistent on the latent component, inconsistent on the continuous component.
Additional simulations presented in the Supplemental material included scenarios with larger values for the standard deviation and scenarios with a greater number of subtrials. We also conducted a sensitivity analysis by considering a scenario in which the data-generating mechanism differed from the model. In this case, we used a multivariate skew-normal distribution.
25
For each scenario, we simulated 1,000 replicates. (For the null scenario, we simulated 5,000 replicates. For a true type I error rate of 0.05, this would produce a Monte Carlo standard error for the estimated type I error rate of 0.003.) To simulate the data, the parameter vectors for the baseline effect
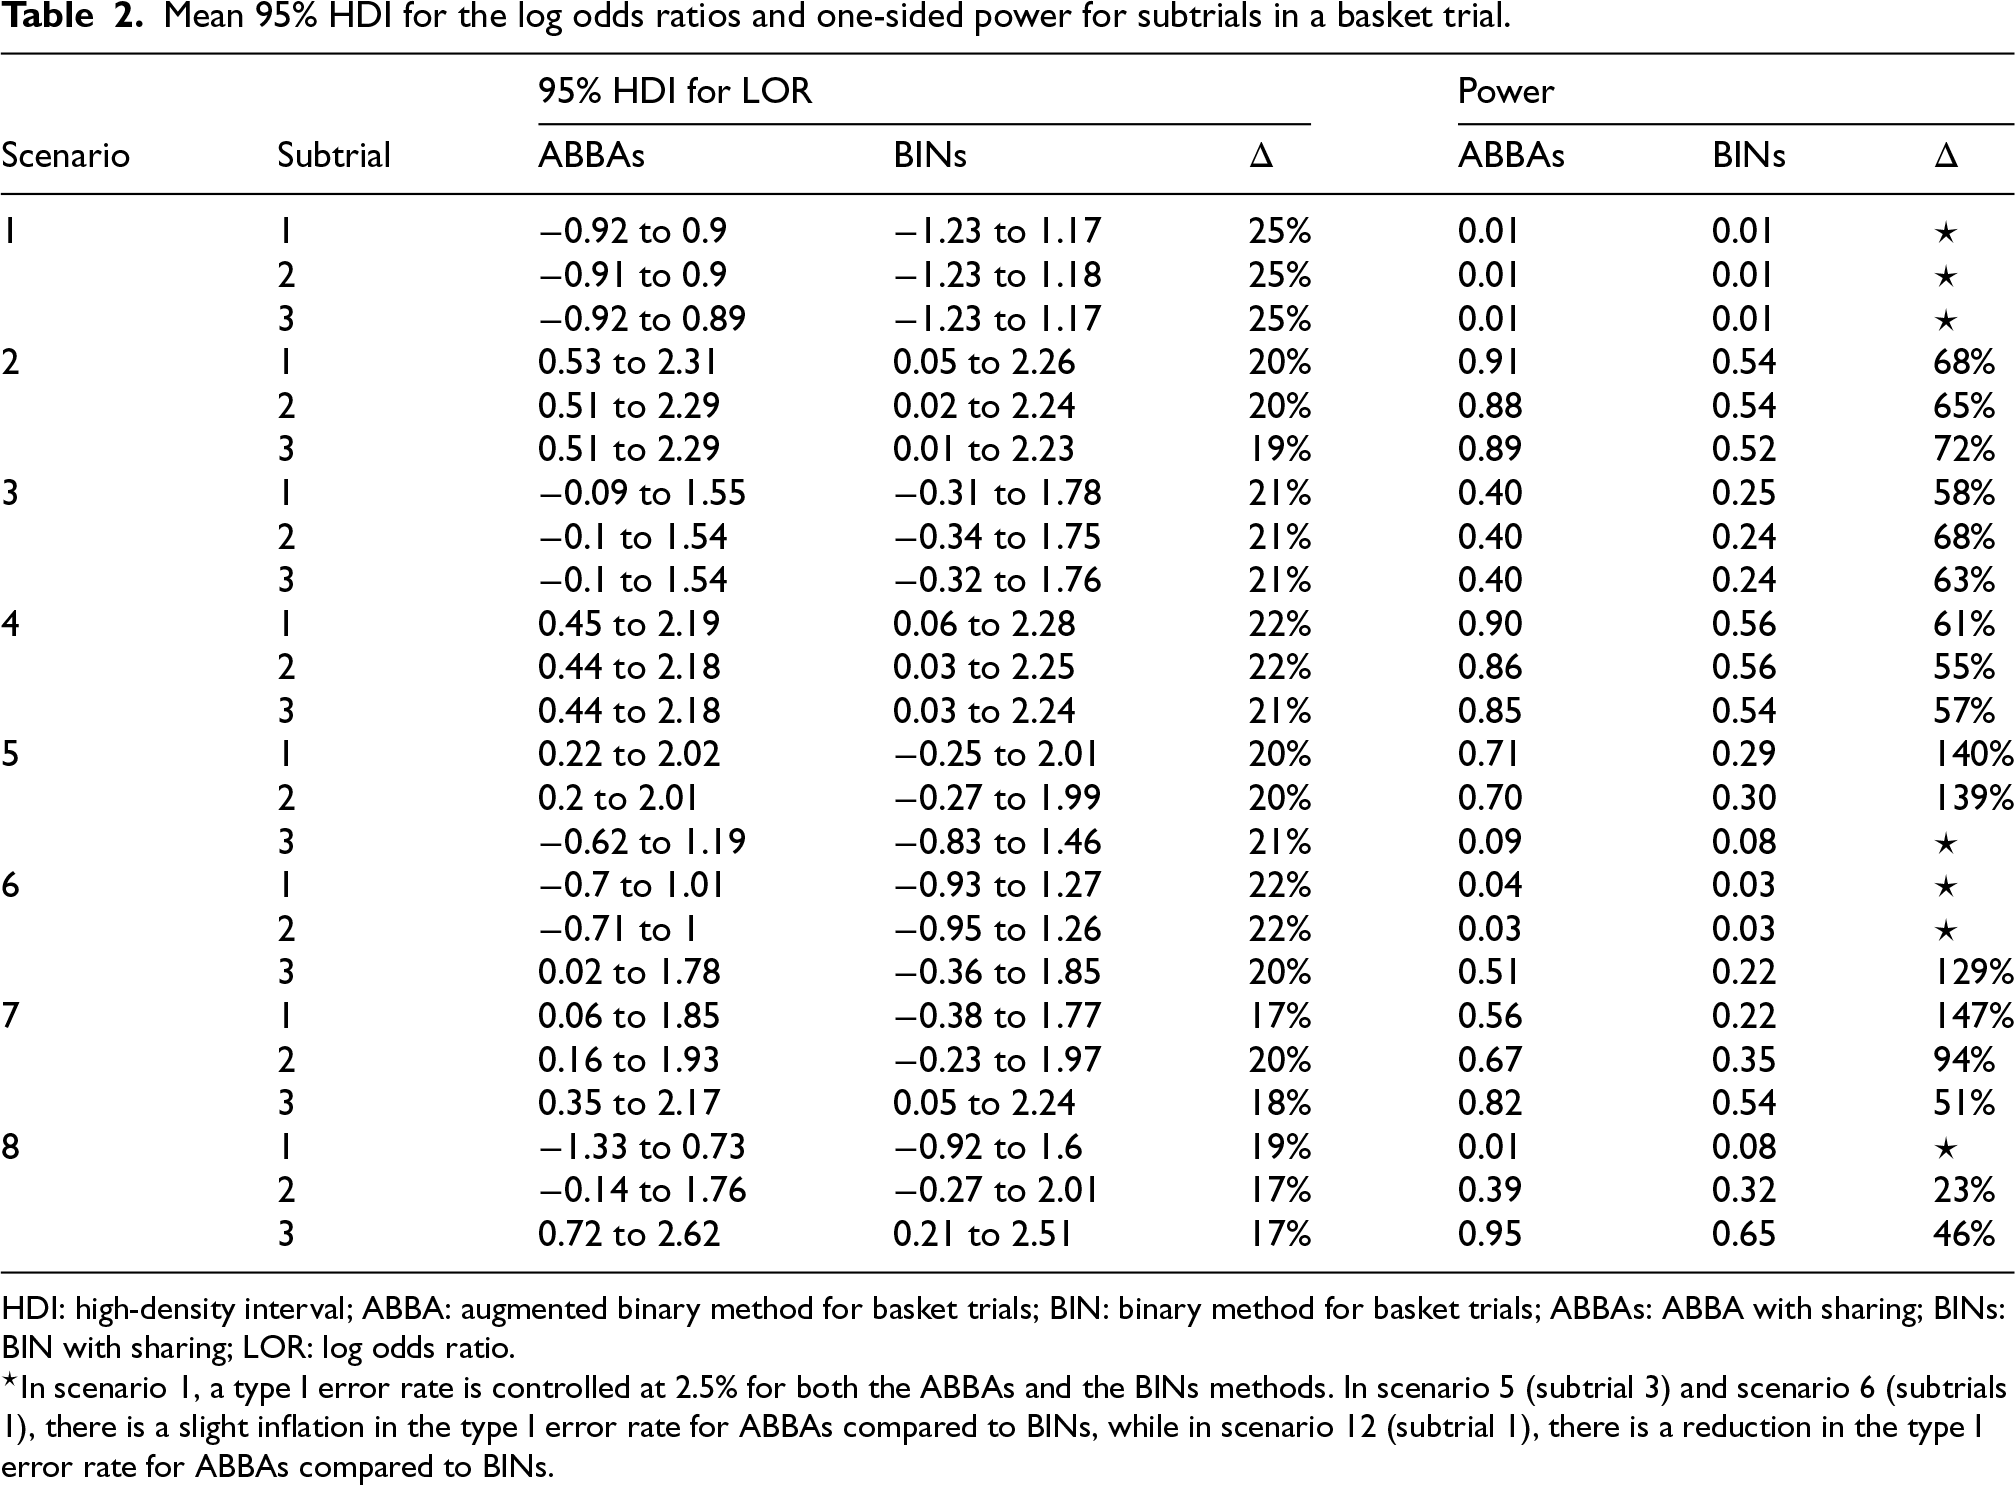
Table 2 summarises the width of the 95% HDI for the log odds ratio and the power for scenarios presented in Table 1, for the ABBA method with sharing of information (ABBAs, where the addition of the letter ‘s’ indicates sharing) compared to the BIN method with sharing of information (BINs). The ABBAs method demonstrates a reduction of 12% to 25% in the width of the 95% HDI for the log odds ratio, and an increase in power of up to 146%. The type I error rate, as assessed in Scenario 1 (the global null scenario), is well controlled at 2.5%. For Scenario 4, where the treatment effect is consistent across the subtrials, we simulated additional data with 100 participants per arm and achieved powers of 0.65, 0.66, and 0.64 for the BINs model – approximately 25% lower than the powers achieved with the ABBAs model using 50 participants per arm (0.9, 0.86, and 0.85). Thus, the increase in power with the ABBA model is equivalent to more than a 50% reduction in sample size. In heterogeneous scenarios (Scenarios 5 and 6), some inflation in the type I error rate is observed in the null subtrials for both ABBA and BIN methods, as expected when information borrowing occurs. Although the inflation is greater with the ABBAs method compared to the BINs method, the ABBAs method also yields a more substantial increase in power for the non-null subtrials in these scenarios. In Scenario 8, where the continuous component is inconsistent across subtrials, ABBA maintains control of the nominal type I error rate for the null subtrial, whereas the BIN method shows notable type I error inflation and reduced coverage.
Mean 95% HDI for the log odds ratios and one-sided power for subtrials in a basket trial.
Mean 95% HDI for the log odds ratios and one-sided power for subtrials in a basket trial.
HDI: high-density interval; ABBA: augmented binary method for basket trials; BIN: binary method for basket trials; ABBAs: ABBA with sharing; BINs: BIN with sharing; LOR: log odds ratio.
To evaluate the properties of the ABBA and BIN models without borrowing information between subtrials (ABBAns vs. BINns, where “ns” indicates non-sharing), we conducted separate analyses for each subtrial (stratified analysis) for scenarios presented in Table 1. Table 3 presents the 95% HDI for the log odds ratio and the power. The ABBAns method results in a reduction of 21% to 31% in the width of the 95% HDI across all scenarios, and an increase in power of 33% to 192% in non-null scenarios. Scenario 1 (the global null) shows that though the type 1 error rate is controlled at 2.5% for the BINns method, there is some inflation of the type I error for the ABBAns (3.0%). In scenarios with heterogeneous subtrials (Scenarios 6 and 5), some inflation of the type 1 error rate occurs in the null subtrials; however, a substantial increase in power is observed in the non-null subtrials in these scenarios.
Mean 95% HDI for the log odds ratios and one-sided power for the stratified analysis (ABBAns and BINns: no information sharing).
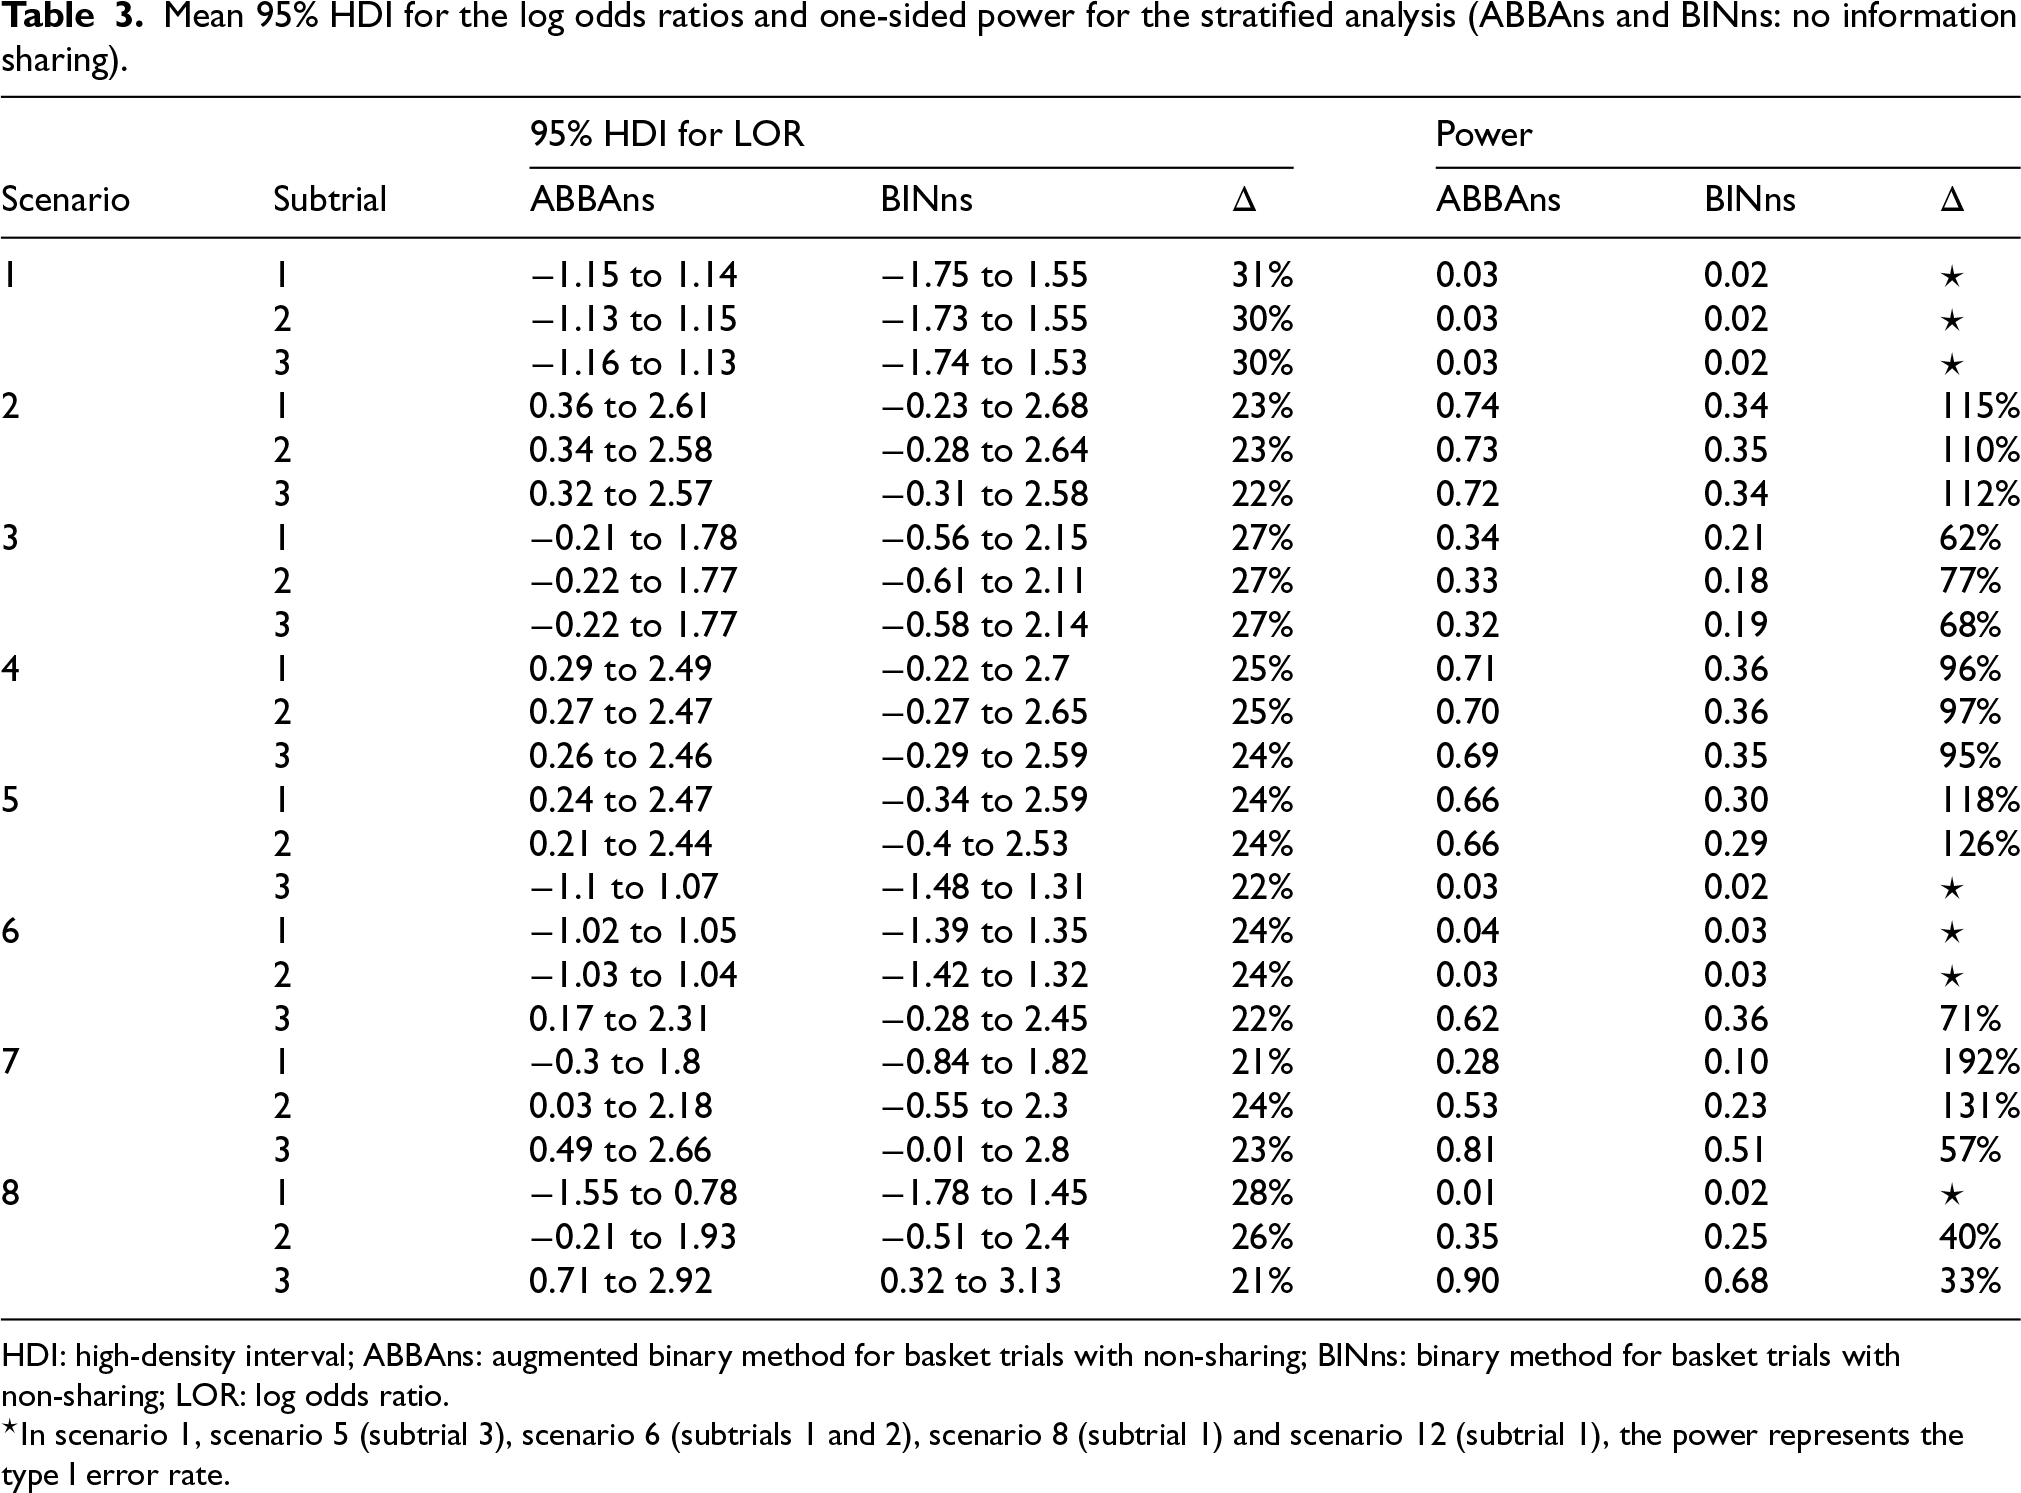
HDI: high-density interval; ABBAns: augmented binary method for basket trials with non-sharing; BINns: binary method for basket trials with non-sharing; LOR: log odds ratio.
Table 4 compares the ABBA method with and without sharing of information (ABBAs vs. ABBAns), as well as the BIN method with and without sharing of information (BINs vs. BINns). Sharing information between subtrials results in a reduction of 12% to 21%/18% to 27% in the width of the 95% HDI for the log odds ratio. There is a notable decrease in the type I error rate for Scenario 1 and an increase in power for most scenarios. In subtrial 3 in Scenario 6 sharing of information shows a decrease in power for both methods, though the latent variable method achieves a smaller decrease. In Scenario 7, where the treatment effect for the latent component is inconsistent between the subtrials, information sharing in the latent variable model results in a slight reduction in power for subtrial 3.
Reduction in 95% HDI for the log odds ratios and increase in power for the ABBAs method with information sharing versus the stratified ABBA method (ABBAns), and for the BINs method with information sharing versus the stratified BIN method (BINns).
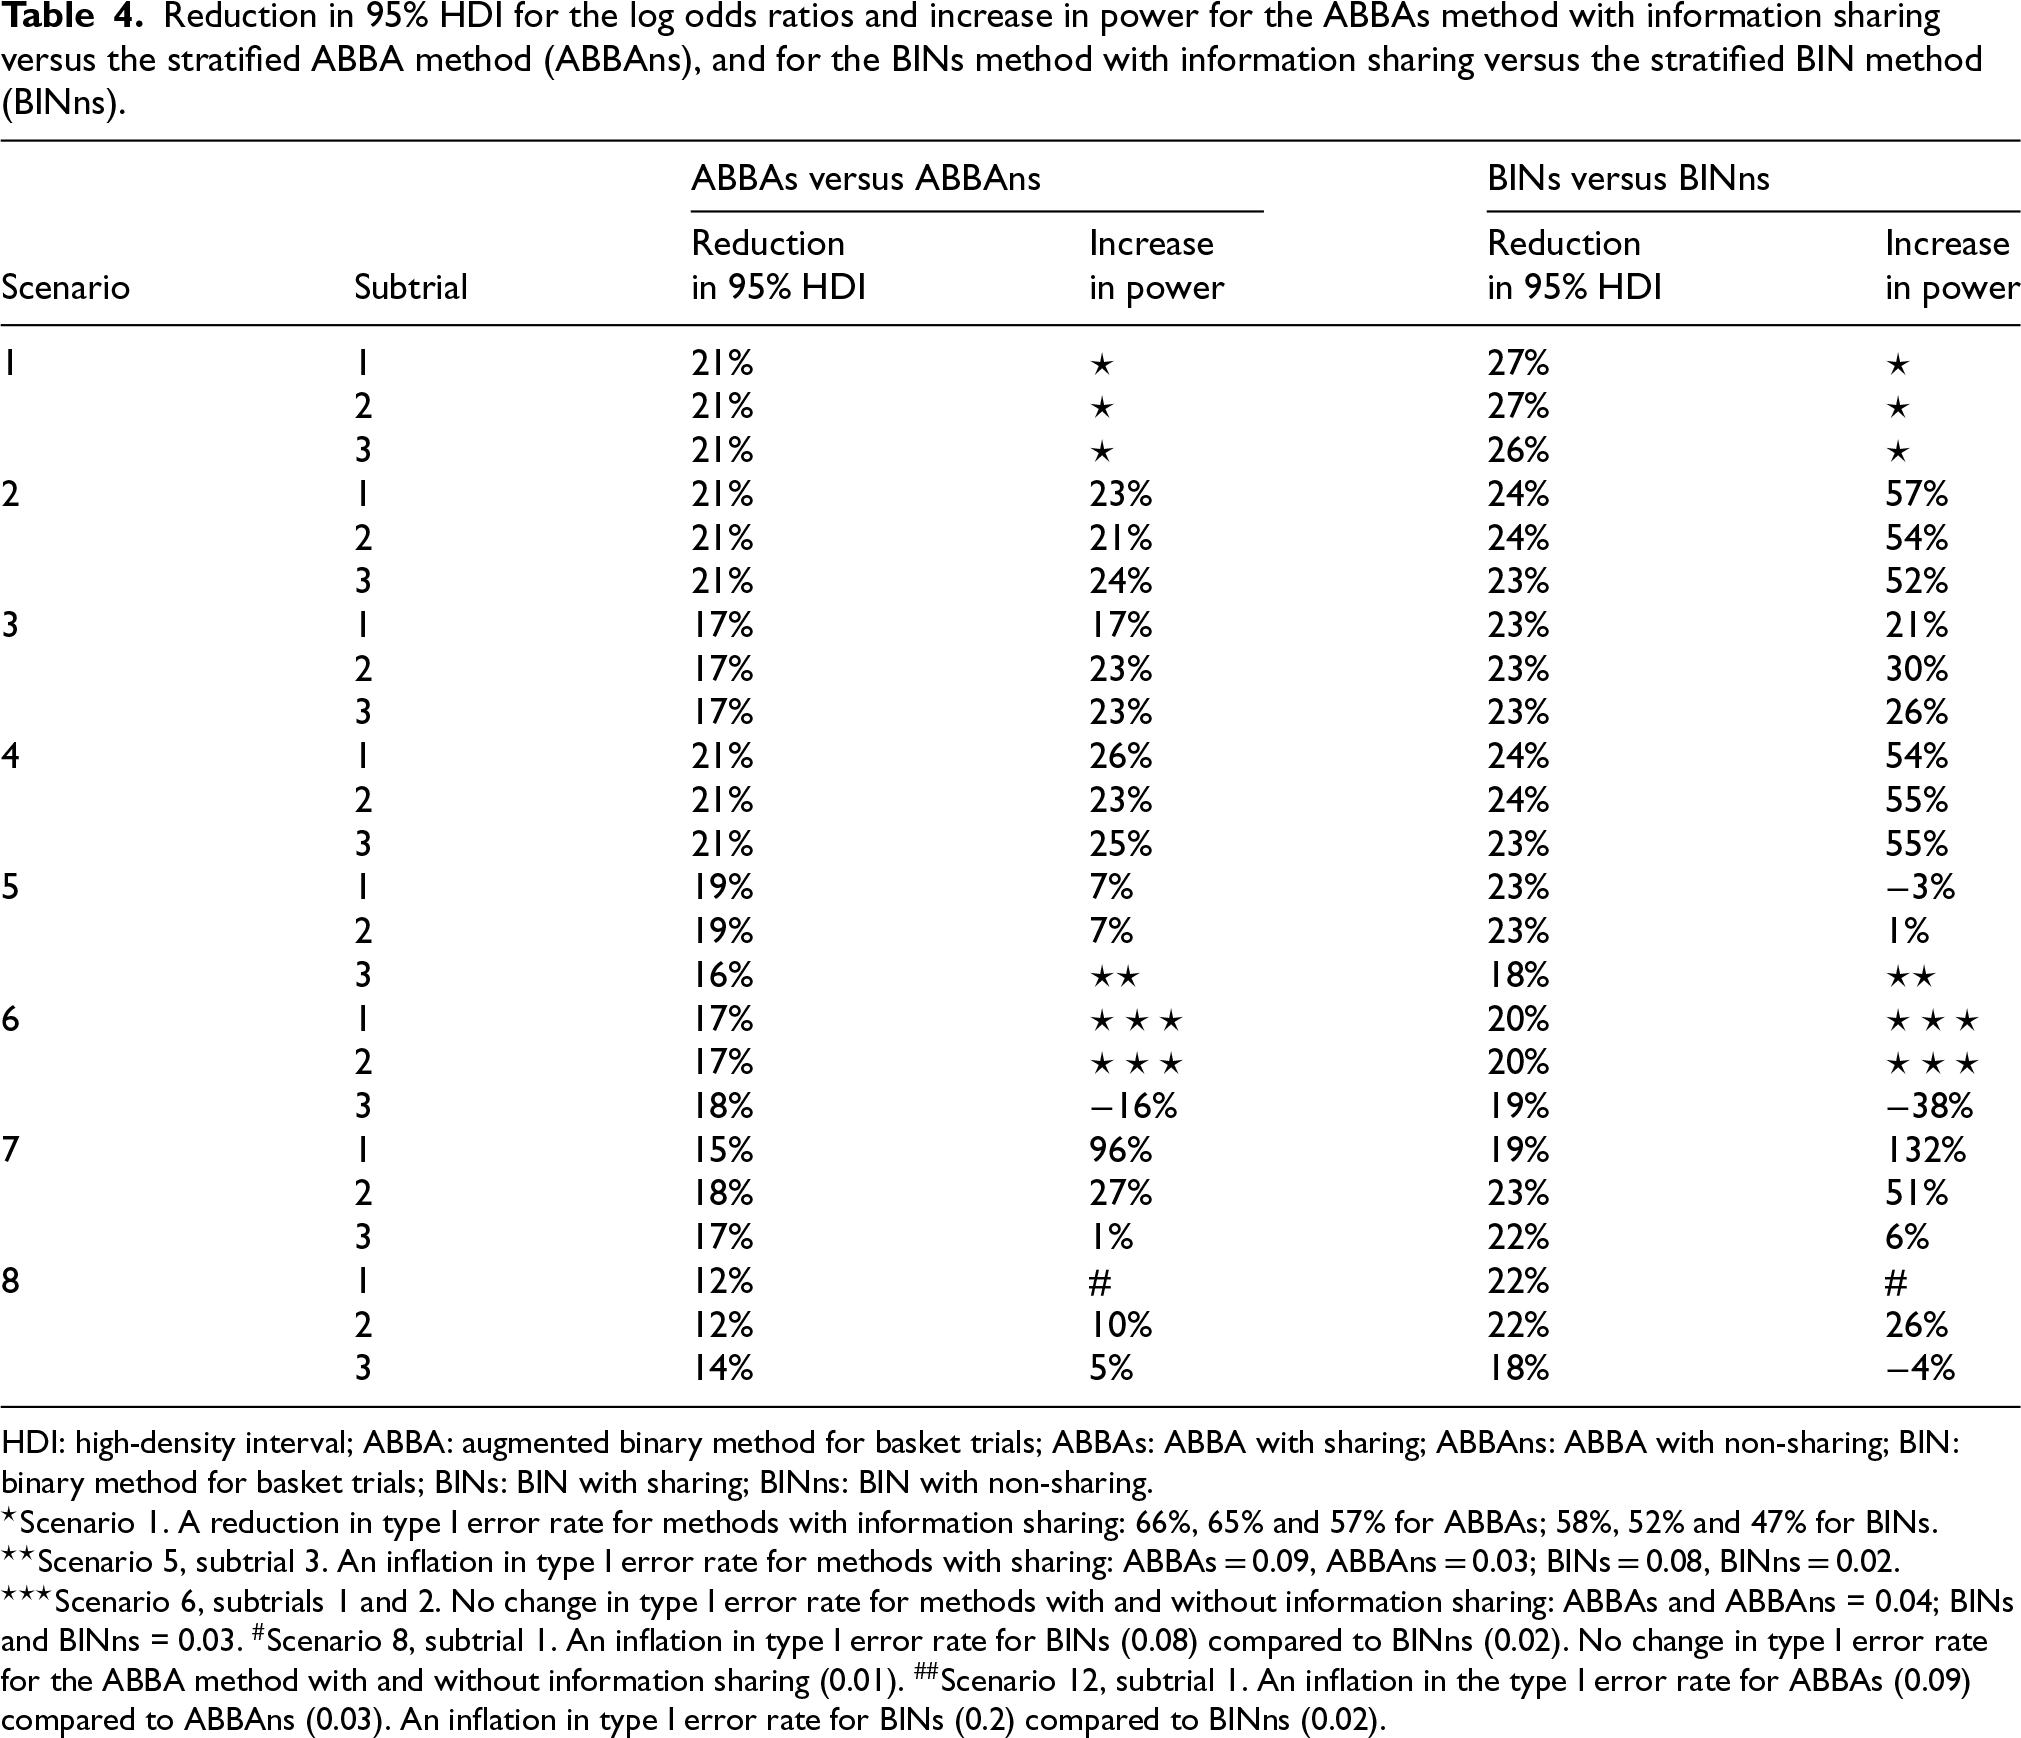
HDI: high-density interval; ABBA: augmented binary method for basket trials; ABBAs: ABBA with sharing; ABBAns: ABBA with non-sharing; BIN: binary method for basket trials; BINs: BIN with sharing; BINns: BIN with non-sharing.
Figure 1 compares the bias (panel A), precision (panel B), mean squared error (panel C) and coverage (panel D) of the posterior mean for the log odds ratio, for the ABBA and BIN models with and without information sharing. It demonstrates that the ABBA model with information sharing (ABBAs) produces equivalent or smaller bias across nearly all scenarios (panel A), and substantially higher precision (panel B) and lower mean squared error (panel C) in all scenarios. The coverage for the ABBAs method (panel D) is approximately nominal for Scenarios 1–4, where the treatment effect is consistent across subtrials. However, for Scenarios 5–8, the coverage is below nominal for some subtrials. For Scenario 5, the lowest coverage (91.2%) occurs in subtrial 3, where there is no treatment effect, while the treatment effect is consistent across both components in the other two subtrials. A consistent treatment effect on the latent component only (Scenario 8) results in a slight drop in coverage for the ABBAs method, but a substantial drop for the BINs method in the null subtrial, where the components of the treatment effect act in opposite directions. A similar pattern was observed in the only non-null subtrial in Scenario 6.
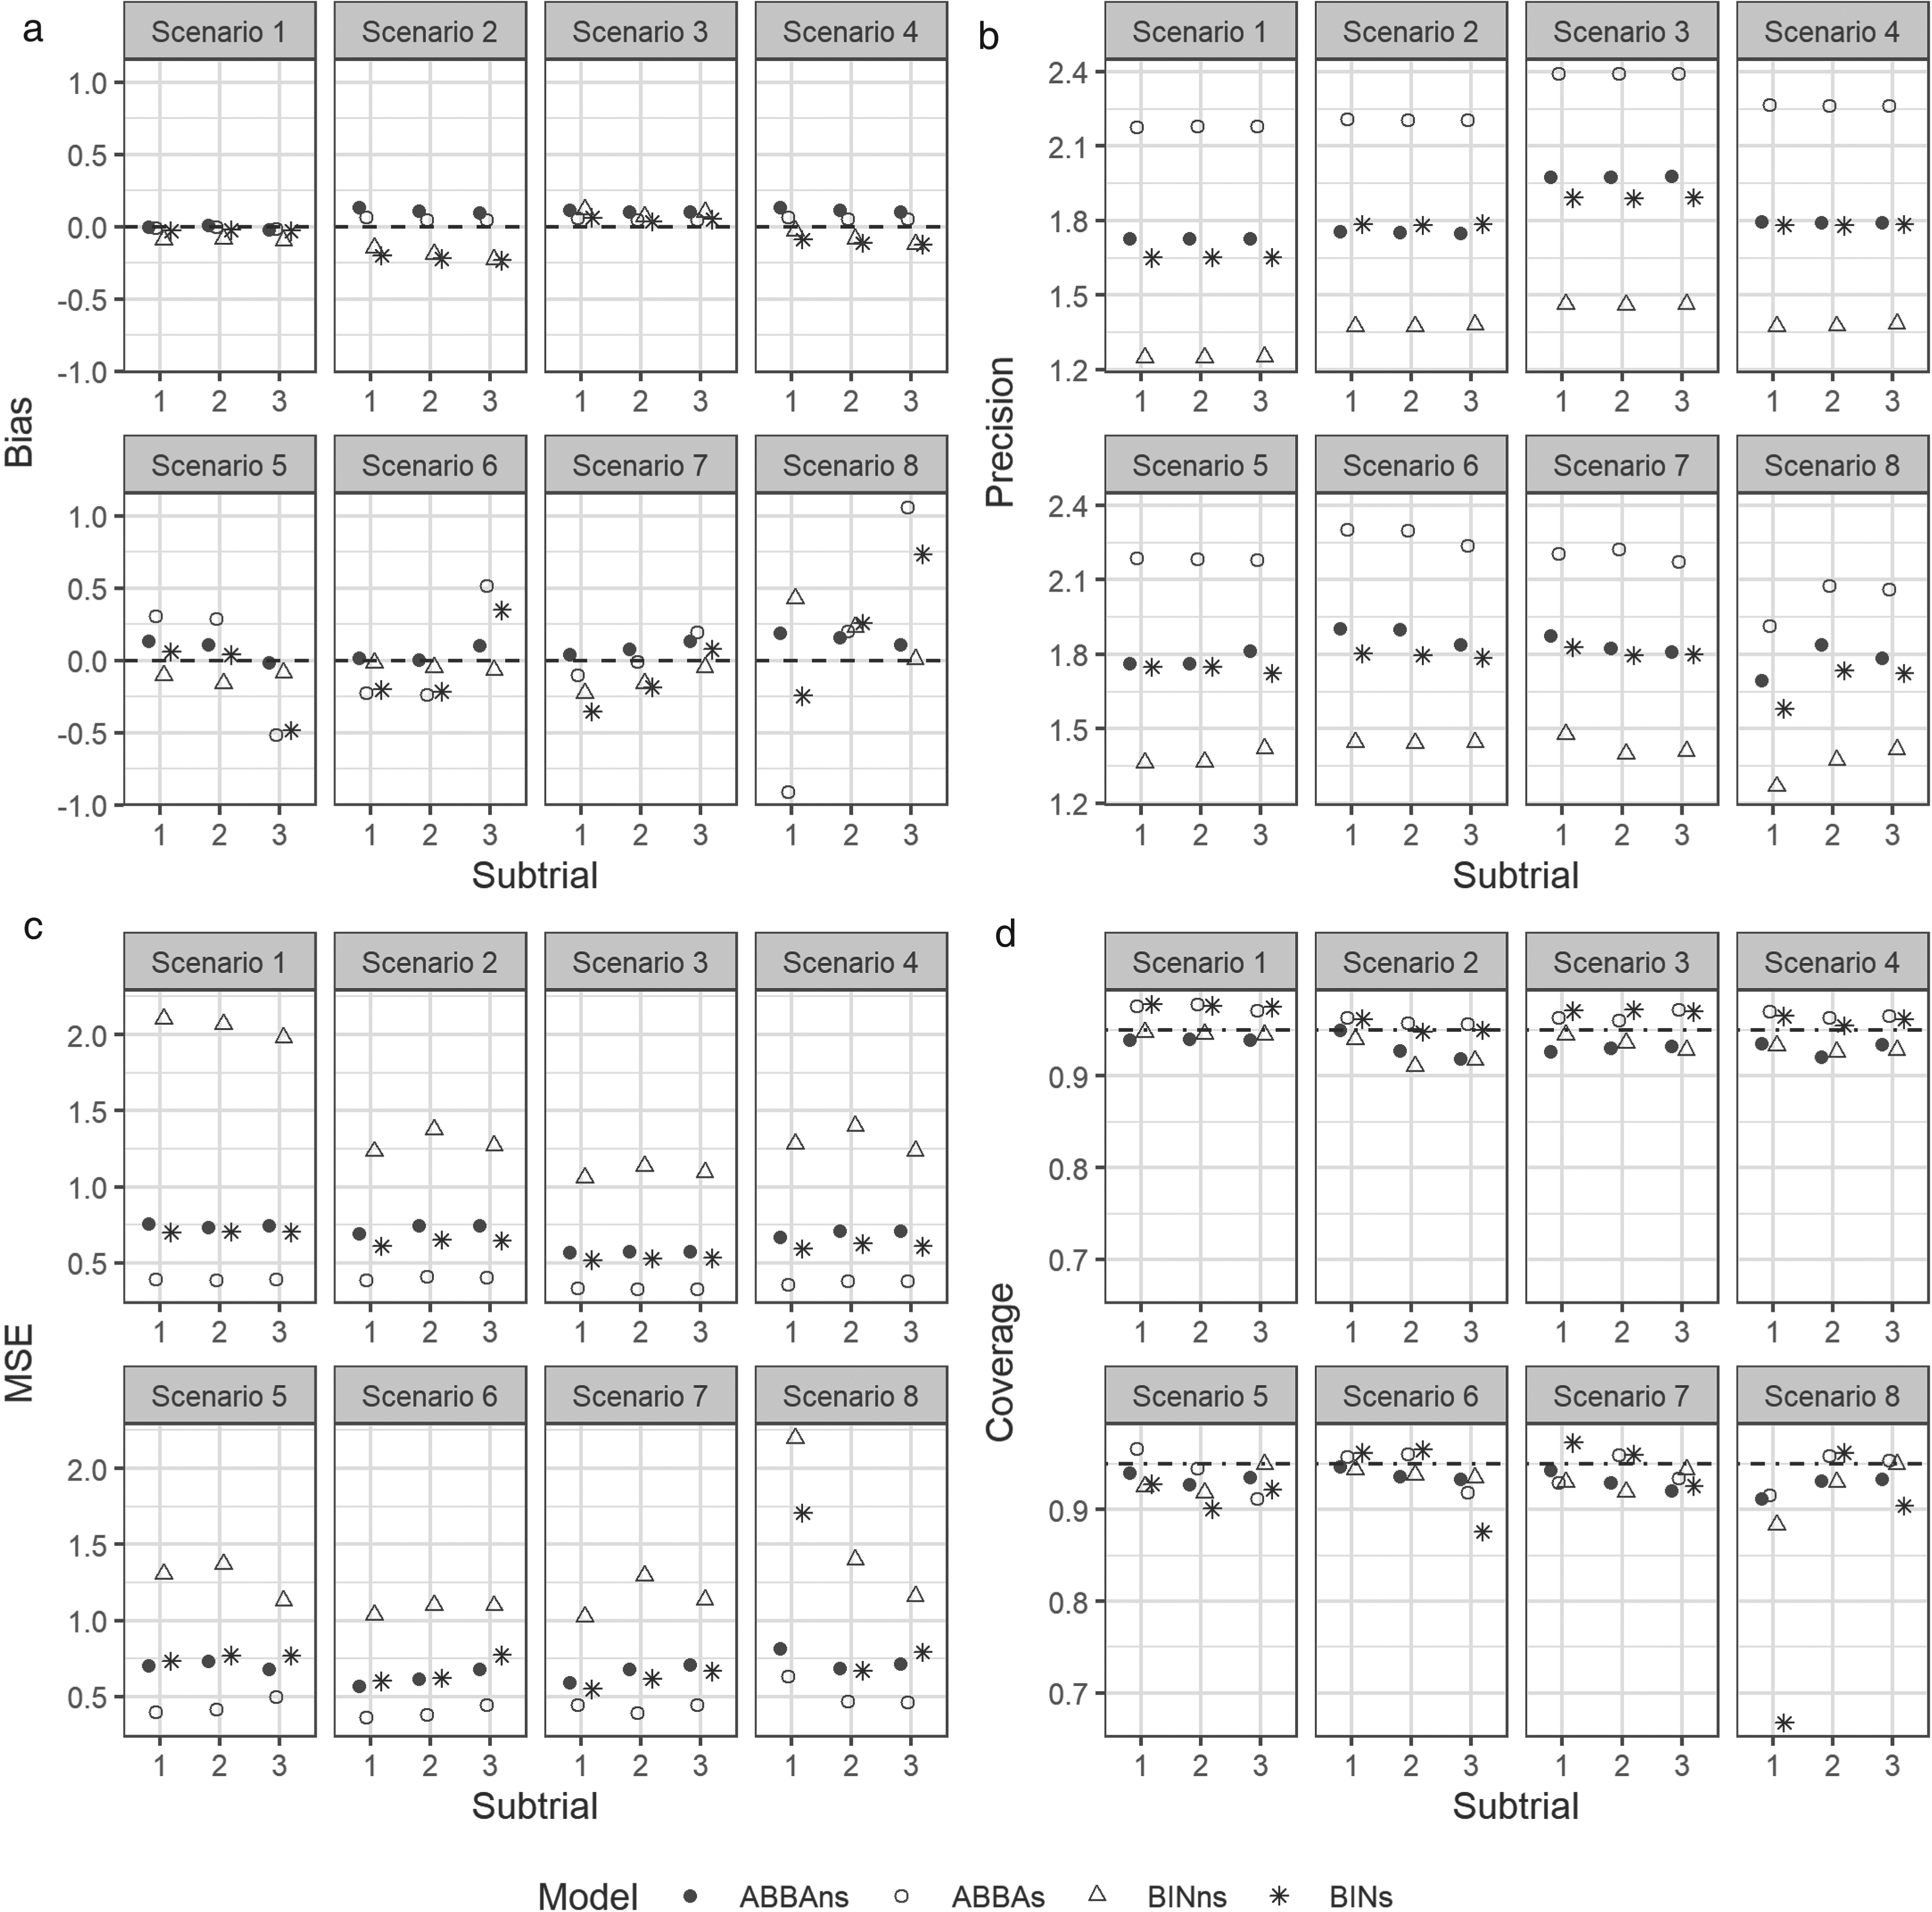
(a) Bias, (b) precision, (c) mean squared error, (d) coverage, of the posterior estimators for the log odds ratios. ABBAs/BINs – the methods with information sharing; ABBAns/BINns – the methods without information sharing (stratified analysis).
To illustrate the performance of the models on real data, we conducted a re-analysis of data from two clinical trials. This study, carried out under YODA Project 2023-5145, used data obtained from the Yale University Open Data Access Project, which has an agreement with Janssen Research & Development, L.L.C. The interpretation and reporting of research using this data are solely the responsibility of the authors and do not necessarily represent the official views of the Yale University Open Data Access Project or Janssen Research & Development, L.L.C. In both clinical trials, we examined outcomes related to DAS28 and ACR-N.
In NCT01645280 (EudraCT NUMBER: 2011-001122-18, Protocol CNTO1275ARA2001),
26
patients were randomised into five groups: placebo (
We compared the disease activity score-28 using CRP (DAS28-CRP) at 28 weeks between usetkinumab (combining two dose groups) and placebo arms in the primary analysis population. If patients had data for at least one DAS28-CRP component at week 28, missing components were imputed using the last observation carried forward method. In the latent variable model, DAS28-CRP at week 28 represented a continuous component of the outcome, while an indicator of drug withdrawal or administration of prohibited medications represented a binary component. In the binary model, patients were classified as responders if the drug was not withdrawn during the study, no prohibited medications were administered, and DAS28-CRP at week 28 was below the threshold of 2.6. We adjusted for DAS28-CRP at baseline in the analyses. For the ACR-N outcome, we computed the ACR-N score at 28 weeks and adjusted the analysis for the baseline value of the DAS28-CRP measure. In the binary model for ACR-N, patients were classified as responders if their ACR-N score exceeded 20%.
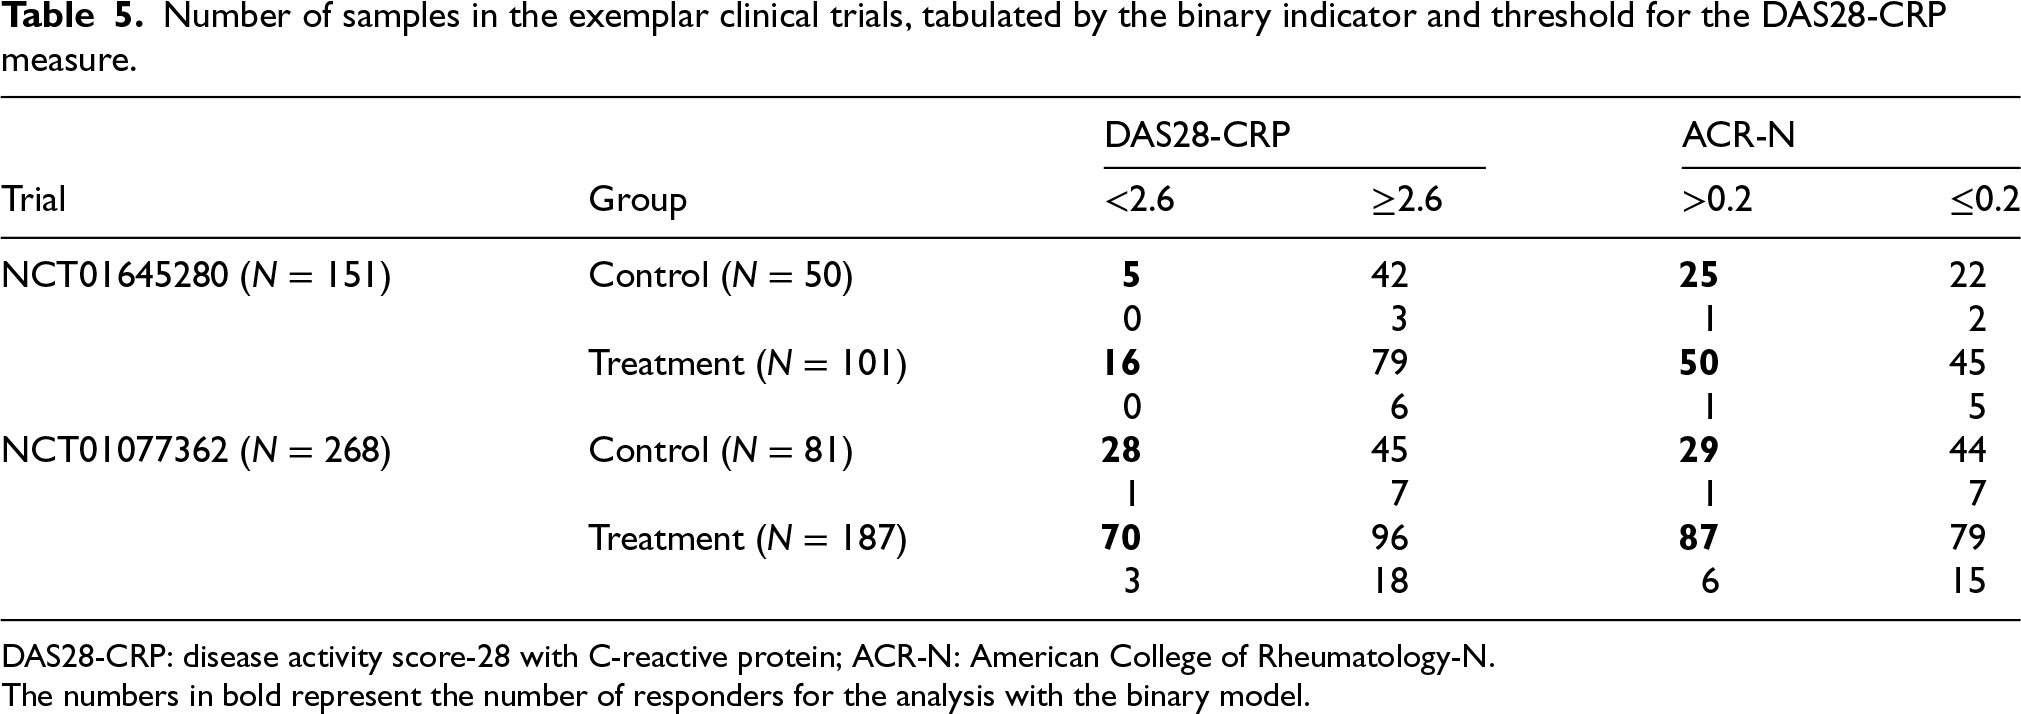
In NCT01077362 (EudraCT NUMBER: 2009-012265-60, Protocol CNTO1275PSA3002), 312 adults with active psoriatic arthritis were randomised to different doses of ustekinumab or placebo with crossover to ustekinumab. 27 We compared DAS28-CRP at week 24 between the ustekinumab and placebo arms in the primary analysis population. The outcomes were specified similarly to those for the NCT01645280 trial (see Table 5).
Number of samples in the exemplar clinical trials, tabulated by the binary indicator and threshold for the DAS28-CRP measure.
Number of samples in the exemplar clinical trials, tabulated by the binary indicator and threshold for the DAS28-CRP measure.
DAS28-CRP: disease activity score-28 with C-reactive protein; ACR-N: American College of Rheumatology-N.
The numbers in bold represent the number of responders for the analysis with the binary model.
The resulting 95% HDI for the log odds ratios are presented in Table 6 for a hypothetical basket trial that combines the two trials (combined analysis), and for each trial analysed separately (stratified analysis). For NCT01645280 and NCT01077362, sharing of information in the ABBA model resulted in a 5% and 7% decrease in the width on the 95% HDI for the DAS28 outcome, and 4% and 3% for the ACR-N outcome, respectively. The ABBAs model offers a substantial advantage in reducing the width of the 95% HDI (19% to 39%), compared to the BINs model.
95% HDI for the log odds ratios for the real data analysis.
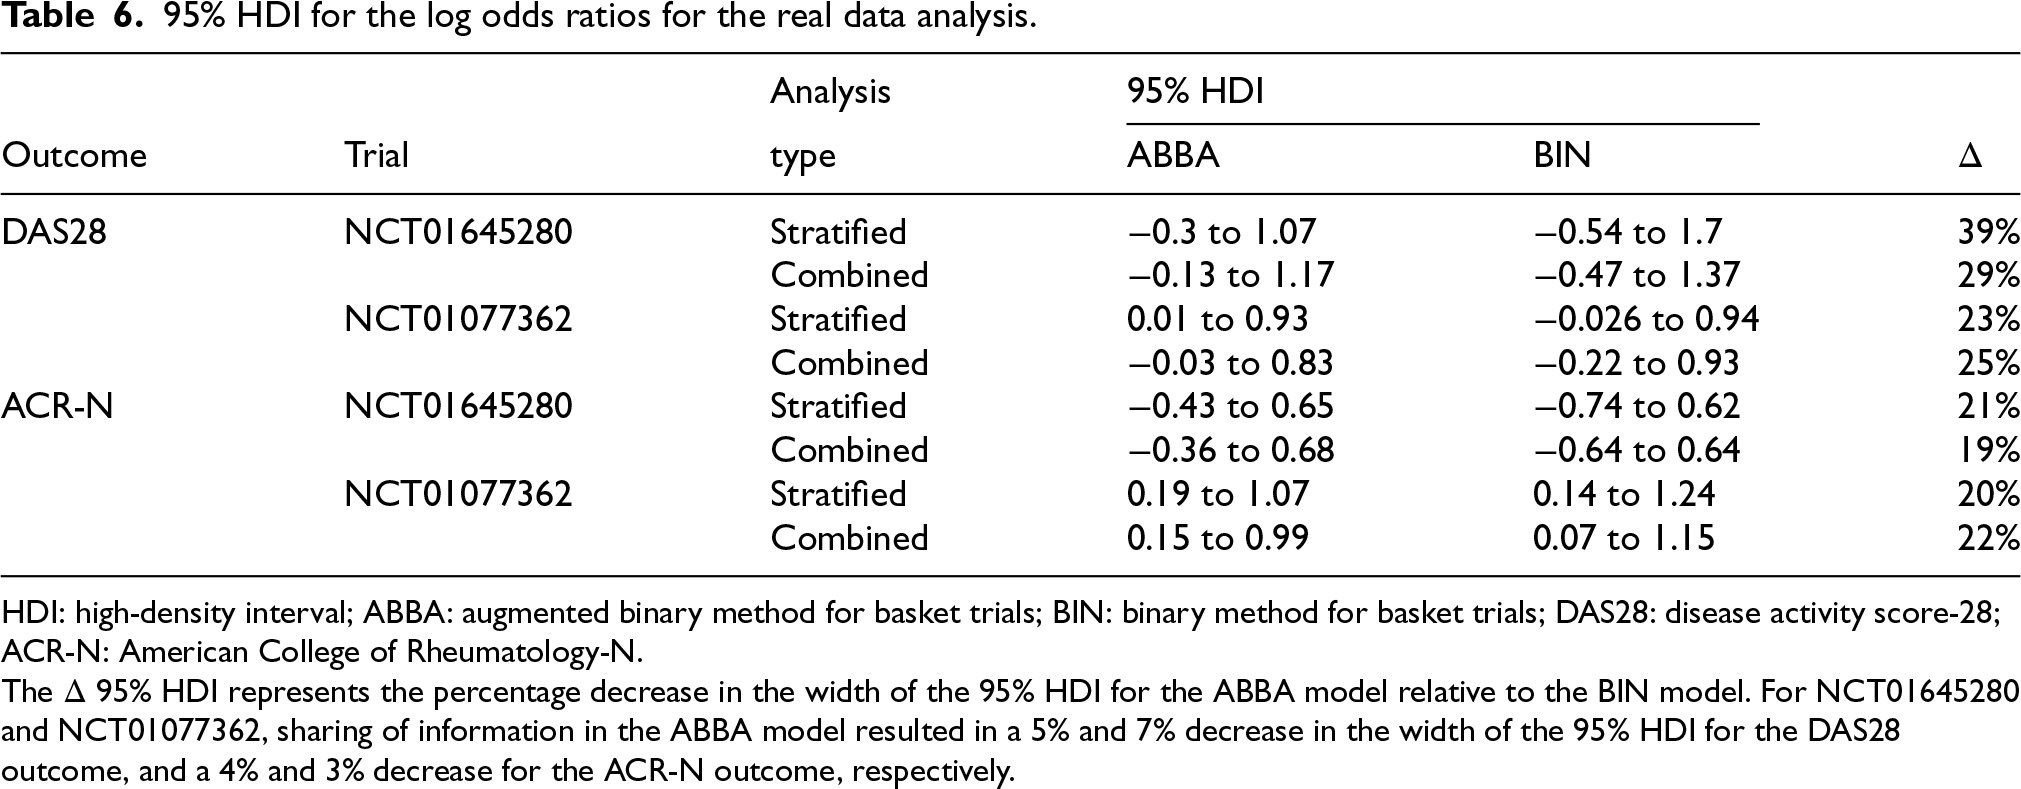
HDI: high-density interval; ABBA: augmented binary method for basket trials; BIN: binary method for basket trials; DAS28: disease activity score-28; ACR-N: American College of Rheumatology-N.
The
In this paper, we propose and assess an extension of the augmented binary method to basket trials (ABBA). The method shares information for composite outcomes by leveraging the augmented binary approach via a latent variable framework. The underlying assumption is that a continuous latent variable determines the observed binary component, which we jointly model with the observed continuous component. This method draws motivation from the augmented binary method, which previously demonstrated superior performance in non-basket rheumatology trials compared to standard analyses of binary outcomes. We conducted various comparisons of our ABBA method against standard methods and demonstrated its substantial advantages: it achieves a notable reduction in the width of the 95% HDI for the log odds ratio, along with increased power and precision compared to standard logistic regression methods that do not utilise the continuous nature of outcomes.
When comparing the ABBA method with information borrowing between subtrials to the method without borrowing, we observed a substantial reduction in the width of the 95% HDI across various simulation scenarios. Our simulation study further highlighted that the ABBA method exhibited the highest precision for the posterior mean of the log odds ratio compared to other methods, even when the data-generating mechanism differed from that of the model (Supplemental material). In some scenarios where the treatment effect varied inconsistently across subtrials, the ABBA method performed comparably to the BIN method in controlling the type I error rate and achieving coverage close to the nominal level. While careful consideration is necessary regarding the expected consistency of effects across subtrials, ABBA proved advantageous when the treatment effect was consistent for the latent component but inconsistent for the continuous component. We note that our method requires simulations to determine the sample size rather than analytical calculations. Our simulations considered relatively small sample sizes because they reflect the realistic sample sizes of phase II trials. The sample size chosen resulted in a well-controlled type I error. Additionally, there was an increase in power observed in comparison with the standard binary power calculation, which was 0.47, as computed with the pwr.2p2n.test function in the pwr R package for a single subtrial (
We illustrated the application of our method to real data from rheumatology trials. Although the trials were conducted separately, we hypothesised a scenario resembling a basket trial comprising two subtrials due to the investigation of the same treatment and common clinical outcomes. We investigated how combining the two trials into a basket trial might have affected the results. The ABBA model achieved a substantial reduction in the width of the 95% HDI compared to the analysis of binary outcomes with sharing information between subtrials. However, the reduction achieved by ABBAs was minor compared to that by ABBAns. This can be attributed to our hypothesised basket trial comprising only two subtrials, thereby limiting the amount of expected information sharing.
Our method has a few limitations, such as longer computational time and occasional convergence issues of the MCMC algorithm. Another issue is a prior specification, especially for the variation between subtrials. With a small number of subtrials, the data contribute minimally to the posterior distribution, which is primarily influenced by the prior (Figure 2). Thus, the choice of the prior for this parameter can significantly impact the degree of information borrowing across subtrials.14,21,29
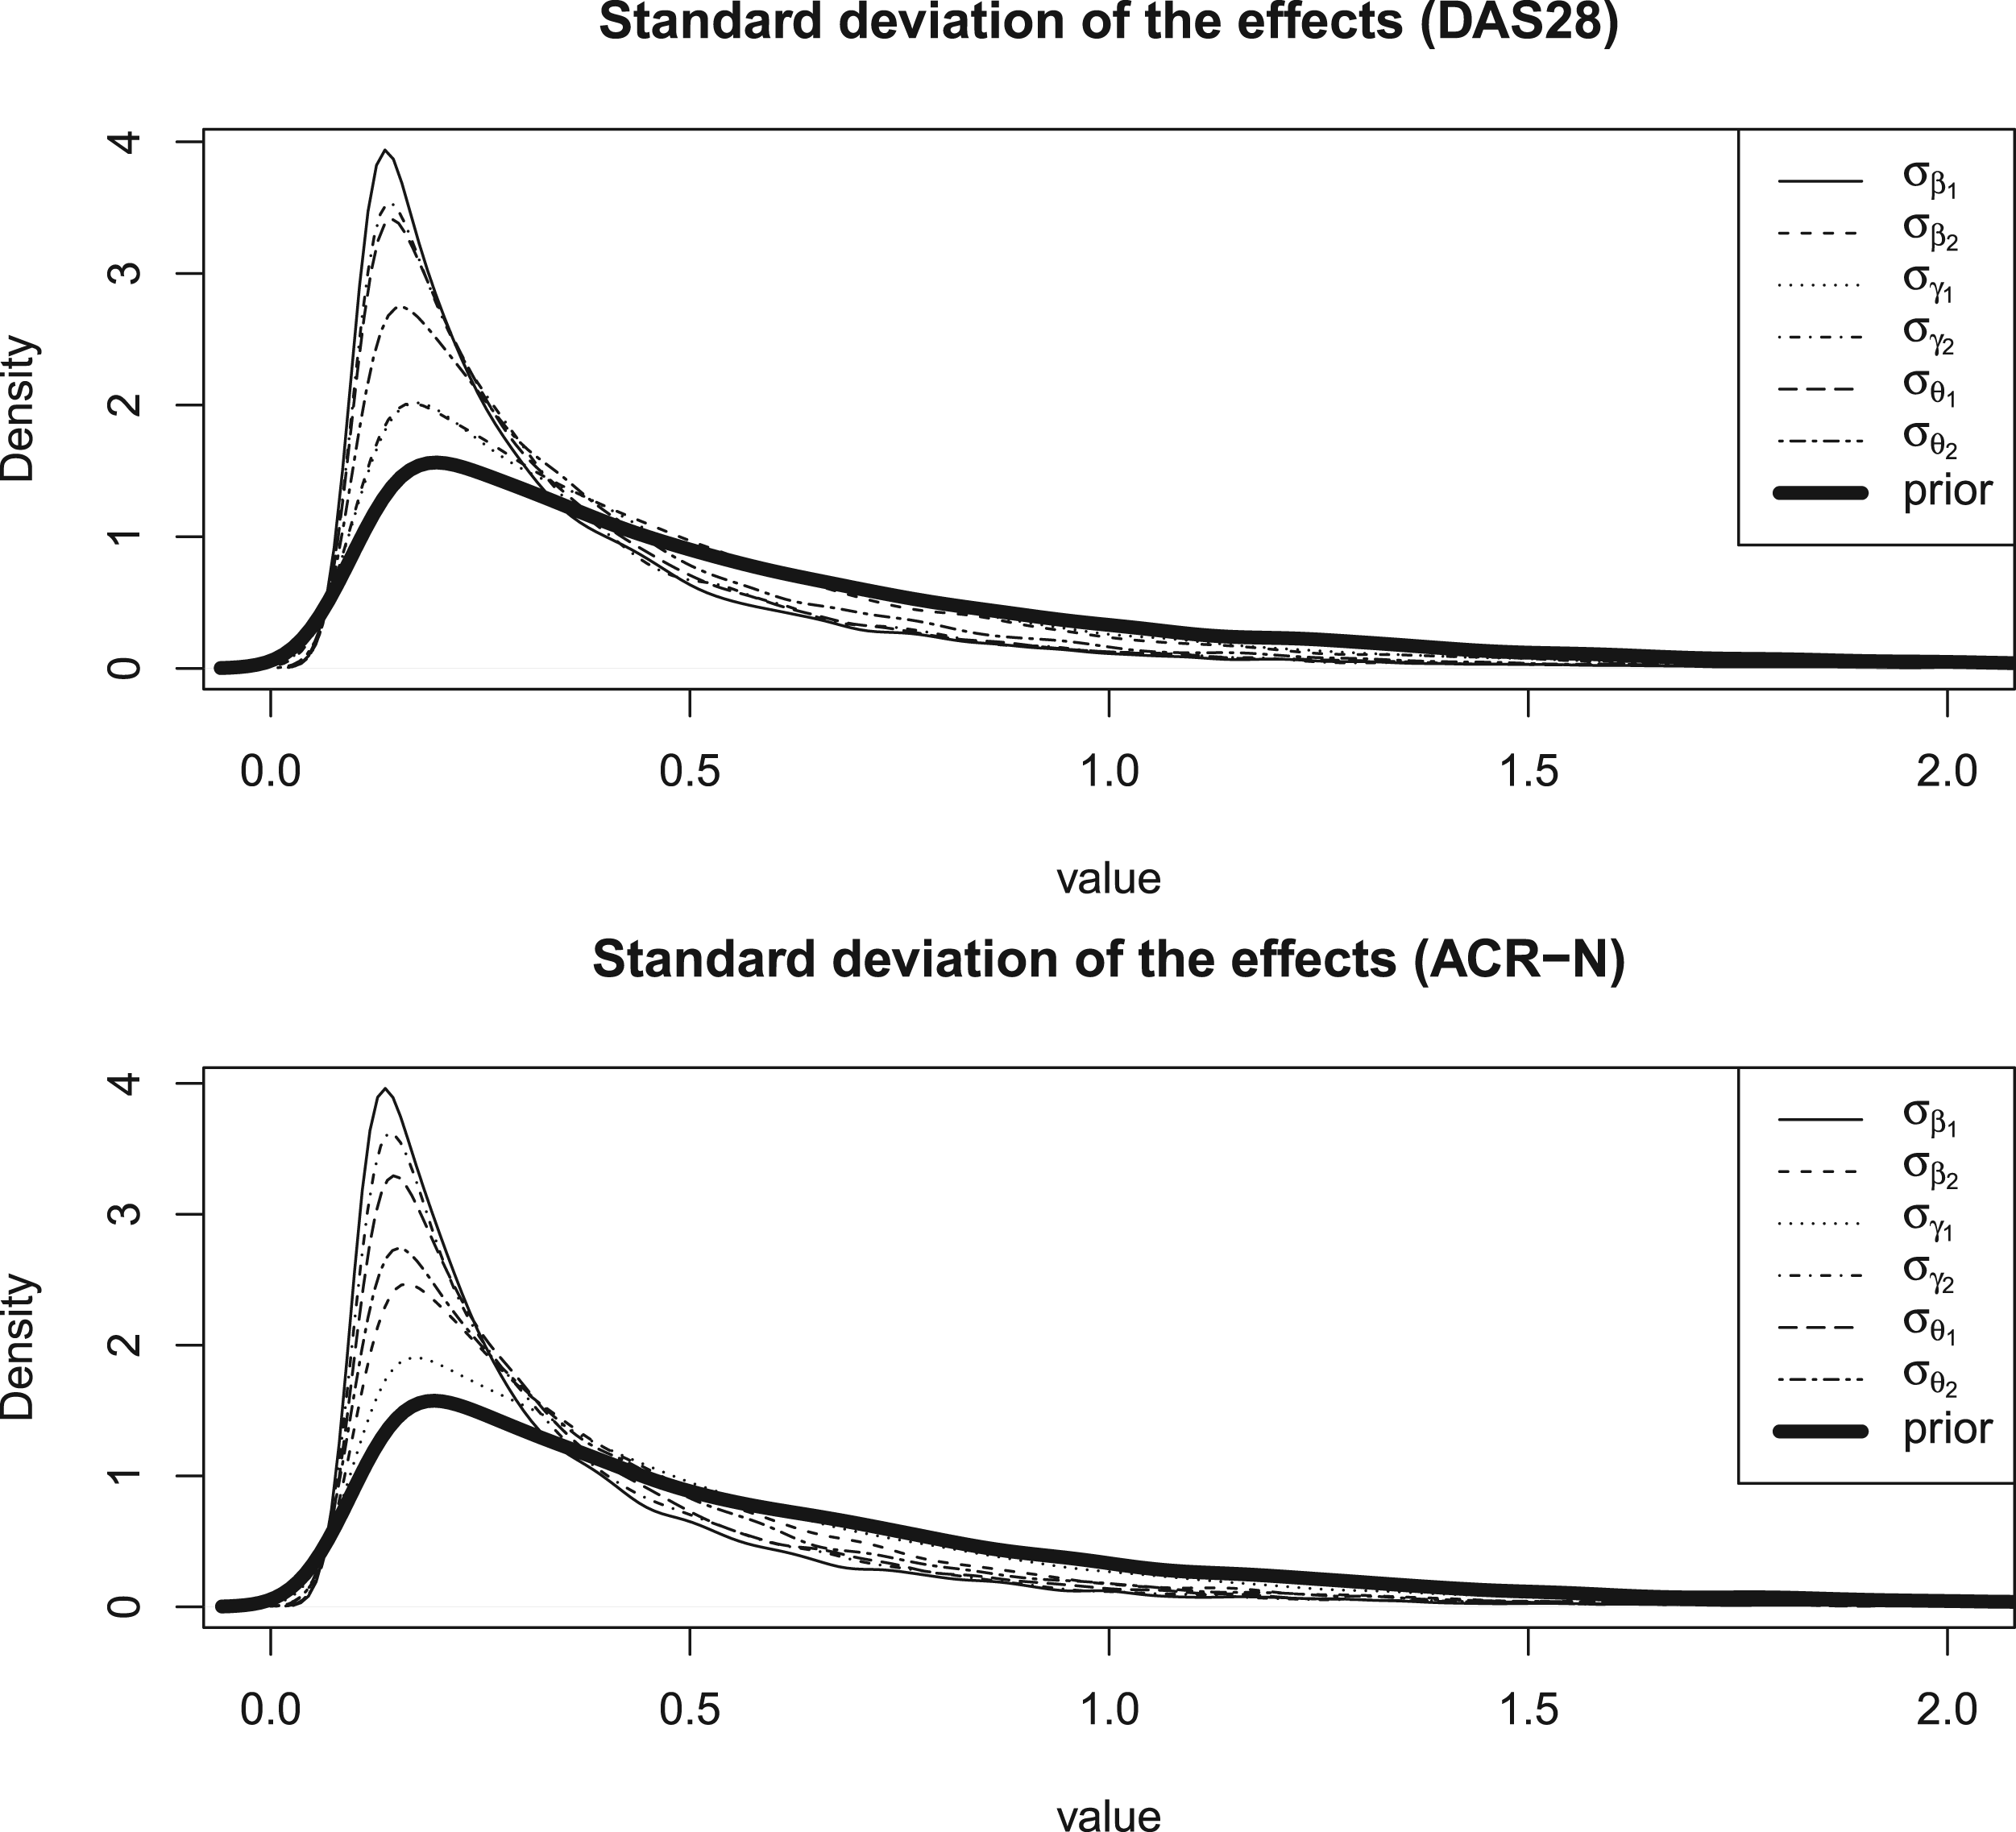
Posterior and prior distributions of the standard deviation of the effects.
In this study, we utilised an exponential prior that assigns a higher probability to smaller values of the parameter. Future research will explore alternative priors such as commensurate prior, which relies on distributional discrepancy to measure commensurability between subtrials and borrows information from those with the most similar treatment effect. 17 Our model assumes exchangeability, which, while reasonable in some clinical areas, might be too restrictive. Further work to revise the model by relaxing the exchangeability assumption, thus allowing more flexible sharing of information, would be valuable. Investigating the ABBA method for different models that account for heterogeneity between the subtrials, such as the EXNEX model, 30 could lead to a more efficient analysis of the data. Our method assumes that the clinical outcome is the same in each disease. This is not always the case, as different conditions in a basket trial often have different clinical outcomes. However, in this case, there might be a common secondary outcome (e.g. a mechanistic biomarker) that is the same for each condition. This setting is particularly relevant, but not limited to, clinical trials in rheumatology. We therefore aim to investigate basket trials involving distinct outcomes where information may be shared via a common secondary outcome. In conclusion, the ABBA makes more efficient use of data by borrowing information across subtrials, presenting a promising avenue for further research.
Supplemental Material
sj-pdf-1-smm-10.1177_09622802251403365 - Supplemental material for Augmented binary method for basket trials (ABBA)
Supplemental material, sj-pdf-1-smm-10.1177_09622802251403365 for Augmented binary method for basket trials (ABBA) by Svetlana Cherlin and James M S Wason in Statistical Methods in Medical Research
Footnotes
Funding
The authors disclosed receipt of the following financial support for the research, authorship, and/or publication of this article: This research was funded by the National Institute for Health and Care Research (NIHR301614).
Declaration of conflicting interest
The authors declared no potential conflicts of interest with respect to the research, authorship, and/or publication of this article.
Supplemental material
Supplemental material for this article is available online.
References
Supplementary Material
Please find the following supplemental material available below.
For Open Access articles published under a Creative Commons License, all supplemental material carries the same license as the article it is associated with.
For non-Open Access articles published, all supplemental material carries a non-exclusive license, and permission requests for re-use of supplemental material or any part of supplemental material shall be sent directly to the copyright owner as specified in the copyright notice associated with the article.