
Abstract
In disease mapping, the relative risk of a disease is commonly estimated across different areas within a region of interest. The number of cases in an area is often assumed to follow a Poisson distribution whose mean is decomposed as the product between an offset and the logarithm of the disease’s relative risk. The log risk may be written as the sum of fixed effects and latent random effects. A modified Besag-York-Mollié (BYM2) model decomposes each latent effect into a weighted sum of independent and spatial effects. We build on the BYM2 model to allow for heavy-tailed latent effects and accommodate potentially outlying risks, after accounting for the fixed effects. We assume a scale mixture structure wherein the variance of the latent process changes across areas and allows for outlier identification. We propose two prior specifications for this scale mixture parameter. These are compared through various simulation studies and in the analysis of Zika cases from the first (2015-2016) epidemic in Rio de Janeiro city, Brazil. The simulation studies show that the proposed model always performs at least as well as an alternative available in the literature, and often better, both in terms of widely applicable information criterion, mean squared error and of outlier identification. In particular, the proposed parametrisations are more efficient, in terms of outlier detection, when outliers are neighbours. Our analysis of Zika cases finds 23 out of 160 districts of Rio as potential outliers, after accounting for the socio-development index. Our proposed model may help prioritise interventions and identify potential issues in the recording of cases.
Motivation
The first Zika cases in the Americas were identified in 2015, when it was considered a benign disease. However, in October 2015 an unprecedented increase in the number of microcephaly cases in neonates was reported in the Northeast of Brazil and was later associated with the Zika virus infection during pregnancy. 1 The Zika virus is transmitted to humans by the bite of infected Aedes mosquitoes, the same vectors that transmit dengue, chikungunya and yellow fever. Dengue is the most prevalent Aedes-borne disease in the world and around 3.9 billion people in 129 countries are at risk of acquiring the disease. 2 Because of climate change, the global distribution of Aedes mosquitoes is expanding, increasing the number of people exposed to Aedes-borne diseases.
In the city of Rio de Janeiro, Brazil, the first Zika epidemic occurred between 2015 and 2016, with more than 35,000 confirmed cases.
3
The city is the second-largest in Brazil, with
Motivating the proposed model, we have available the Zika counts aggregated by neighbourhood for the period of the first Zika epidemic in the city of Rio de Janeiro. The data come from the Brazilian Notifiable Diseases Information System (SINAN – Sistema de Informação de Agravos de Notificação). In Brazil, cases attending healthcare facilities with a suspected diagnosis of Zika are reported to this system, usually by the physician. The standardised morbidity ratios (SMRs) for the Zika counts by neighbourhood during the study period are presented in Figure 1. Although the epidemic affected most of the city, some neighbourhoods seem to have been hit harder than others and some, not at all. The diversity of the territory of Rio de Janeiro is possibly an important factor influencing this. Regarding the city’s geography, for instance, there are mountains that separate different areas, which may act as a natural barrier for the spread of the disease. Additionally, Rio’s territory is heterogeneous in terms of demographic, socio-economic, and environmental characteristics that are involved in the distribution of Aedes-borne diseases. 7
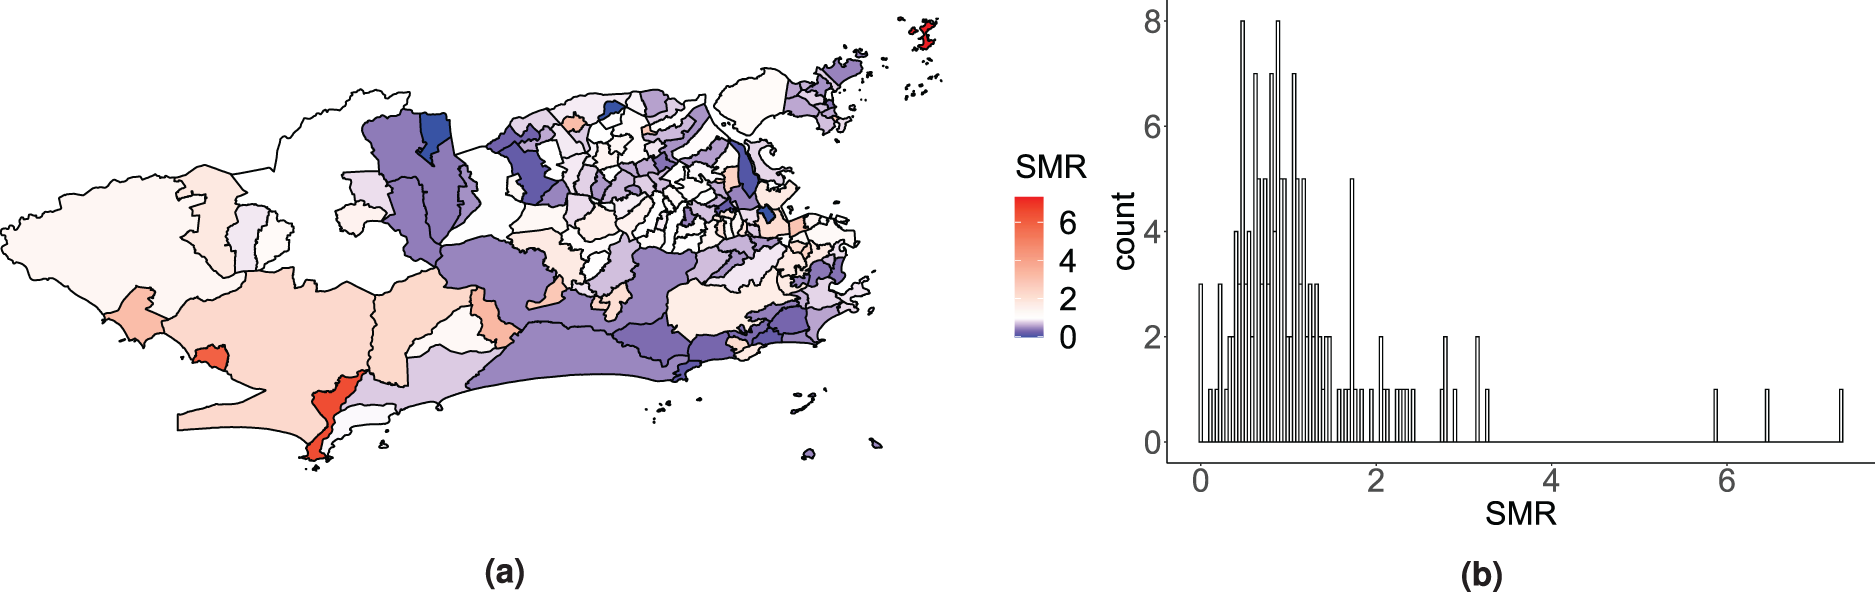
Map (a) and histogram (b) of the standardised morbidity ratio (SMR) distribution for the Zika counts across the 160 neighbourhoods of Rio de Janeiro, between 2015 and 2016.
For this analysis, we have available the socio-development index, an index that includes indicators related to sanitation, education and income, and for which higher values represent better socio-economic conditions. In places with inadequate sanitary conditions, the female Ae. aegypti can more easily find any type of container filled with water to deposit her eggs. In Rio de Janeiro, a city with great social disparities, the socio-development index ranges from 0.282 (in Grumari, a neighbourhood in the West region) to 0.819 (in Lagoa, South region). 8
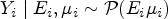
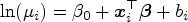
In the last 30 years, the field of disease mapping has experienced an enormous growth. This is because it is an important tool for decision makers to obtain reliable areal estimates of disease rates over a region of interest. Disease mapping methods, or ecological regression, further help understanding the underlying associations between covariates and the disease risk. Commonly, Bayesian hierarchical models are used to model the disease cases observed across the different areas that form a region of interest. The number of cases in an area is assumed to follow a Poisson distribution whose mean is decomposed as the product of an offset and the relative risk of the disease. Further, in the log scale, the relative risk is decomposed as the sum of covariates and latent (unobserved) areal effects. The latent components accommodate overdispersion as this decomposition of the log-relative risk can be seen as a Poisson-lognormal mixture model, if the latent effects follow a normal prior distribution.
Usually, these latent effects follow a spatial structure, a priori, such that neighbouring locations will adjust similarly after accounting for the available covariates. Indeed, it seems natural to expect that areas that are close to each other are more correlated than areas that are further apart. Let
To accommodate the presence of independent latent effects, Besag et al.
12
proposed the so-called Besag-York-Mollié (BYM) model, where each areal latent effect is decomposed as the sum of an unstructured component and a spatially structured component. As pointed out by MacNab,
13
this model presents an identifiability issue as the two variance components cannot be distinguished. To avoid the introduction of two random effects for each area, like in the BYM model, Leroux et al.
14
proposed an alternative distribution for the latent spatial effects that includes a spatial dependence parameter,

Spatial heteroscedasticity is not explicitly considered in the previous models. However, it is reasonable to imagine that some areas may have abnormally high or low disease risks. Richardson et al. 17 emphasised the importance for disease mapping models to be able to differentiate and adapt between smoothing the risk surface and capture abrupt changes in relative risks. This issue of spatial heteroscedasticity has been increasingly considered over the recent years. For instance, regarding geostatistical data, Palacios and Steel 18 proposed a log-normal scale mixture of a Gaussian process to accommodate heavy tails.
To allow for disparities, Congdon
19
proposes a modification of the Leroux prior by including scale mixture parameters. More specifically, Congdon
19
assumes

Different from Congdon,
19
Dean et al.
21
addressed local discrepancies by changing the neighbouring structure according to the observed data. This approach differs from Congdon’s as it is a two-step procedure that implies changing the neighbourhood structure. Other models have been proposed to allow the strength of the spatial autocorrelation to vary over a region of interest. Corpas-Burgos and Martinez-Beneito
22
proposed the so-called adaptive ICAR and adaptive Leroux models, which are modifications of the ICAR and Leroux models, by estimating the weights in the matrix
The main aim of this article is to propose a method to accommodate and identify outlying areas, following a single-step inference procedure. We propose a modification of the BYM2 prior (1) that can identify outlying areas, after accounting for the effect of covariates. A scale mixture is introduced in the BYM2 model. The proposed model keeps the appealing property of parameter interpretation while capturing potentially outlying areas and allowing the neighbouring outlying areas to borrow strength from each other. Areas may be outliers with respect to the whole region of interest, namely areas with extreme disease risks; or with respect to their neighbours, termed spatial outliers. Throughout, the term ‘outlier’ refers to both types of outliers: extremes and spatial outliers. This article is organised as follows: Section 2 describes the proposed model, then a simulation study showcases the performance of the proposed model in Section 3. Additionally, the application of the proposed model to the data presented in Section 1 from the 2015-2016 Zika epidemic in the 160 neighbourhoods of Rio de Janeiro is shown in Section 3. Section 4 concludes with a discussion.
Let a region of interest be partitioned into

In a nutshell, the proposed model uses interpretable parameters to accommodate outlying areas while identifying them. The proposed model points at neighbourhoods that need heavy-tailed latent effects, through the introduction of the scale mixture components,
We now compare the interpretation and roles of the scale mixture components

In the next subsection, different prior distributions are discussed for the scale mixture components.
A natural choice, and used by Congdon,
19
is to assume

Another possible prior specification for the

Following the specifications discussed in the previous section, the resultant posterior distributions, regardless of the prior specification for
One way to approximate a proper posterior distribution when assigning an ICAR prior is to add a sum-to-zero constraint on the parameters to distinguish them from any added constant. This is necessary due to the invariance of the ICAR distribution to the addition of a constant.
20
The sum-to-zero constraint is applied to the spatial components of the proposed model,
The scaling factor,
Data analyses
In this section, we present the results of a simulation study that was conducted to assess the performance of the proposed model. The results from fitting the proposed model to data obtained from the first Zika epidemic that took place between 2015 and 2016 in Rio de Janeiro are also shown. In both cases, we consider the two parametrisations of the proposed model, which correspond to the two prior specifications of the scaling mixture components described in Section 2.1. In the simulation study and in the data application, the proposed model is compared to the Congdon’s model.
19
Out of completeness, we also consider the two prior specifications for the
In the simulation study, we generate data for the 96 French departments and contaminate some areas. The goal is to check whether our proposed model is able to identify the generated outliers. Then, in the Zika data analysis in Rio de Janeiro, we compare the results of our proposed model to Congdon’s as well as the BYM2 11 and Leroux 14 models. We identify some potentially outlying districts which might be of interest to decision makers.
Simulation study: Neighbouring outliers in France
In this section, we present the results from a simulation study wherein some arbitrary neighbouring areas in France are contaminated into outlying areas, to assess the performance of the proposed model in comparison to the one proposed by Congdon. The design of the simulation study is inspired by Richardson et al., 17 where the goal is to assess the ability of the proposed model to both smooth over non-contaminated areas while capturing and identifying the contaminated ones. Richardson et al. 17 emphasised the importance for disease mapping models to adapt to these abrupt changes in the risk surface.
In this simulation study, 20 departments are contaminated such that two groups of 10 neighbouring outliers are created. Out of simplicity, there are no covariates included in the generating process nor when fitting the models. First, all
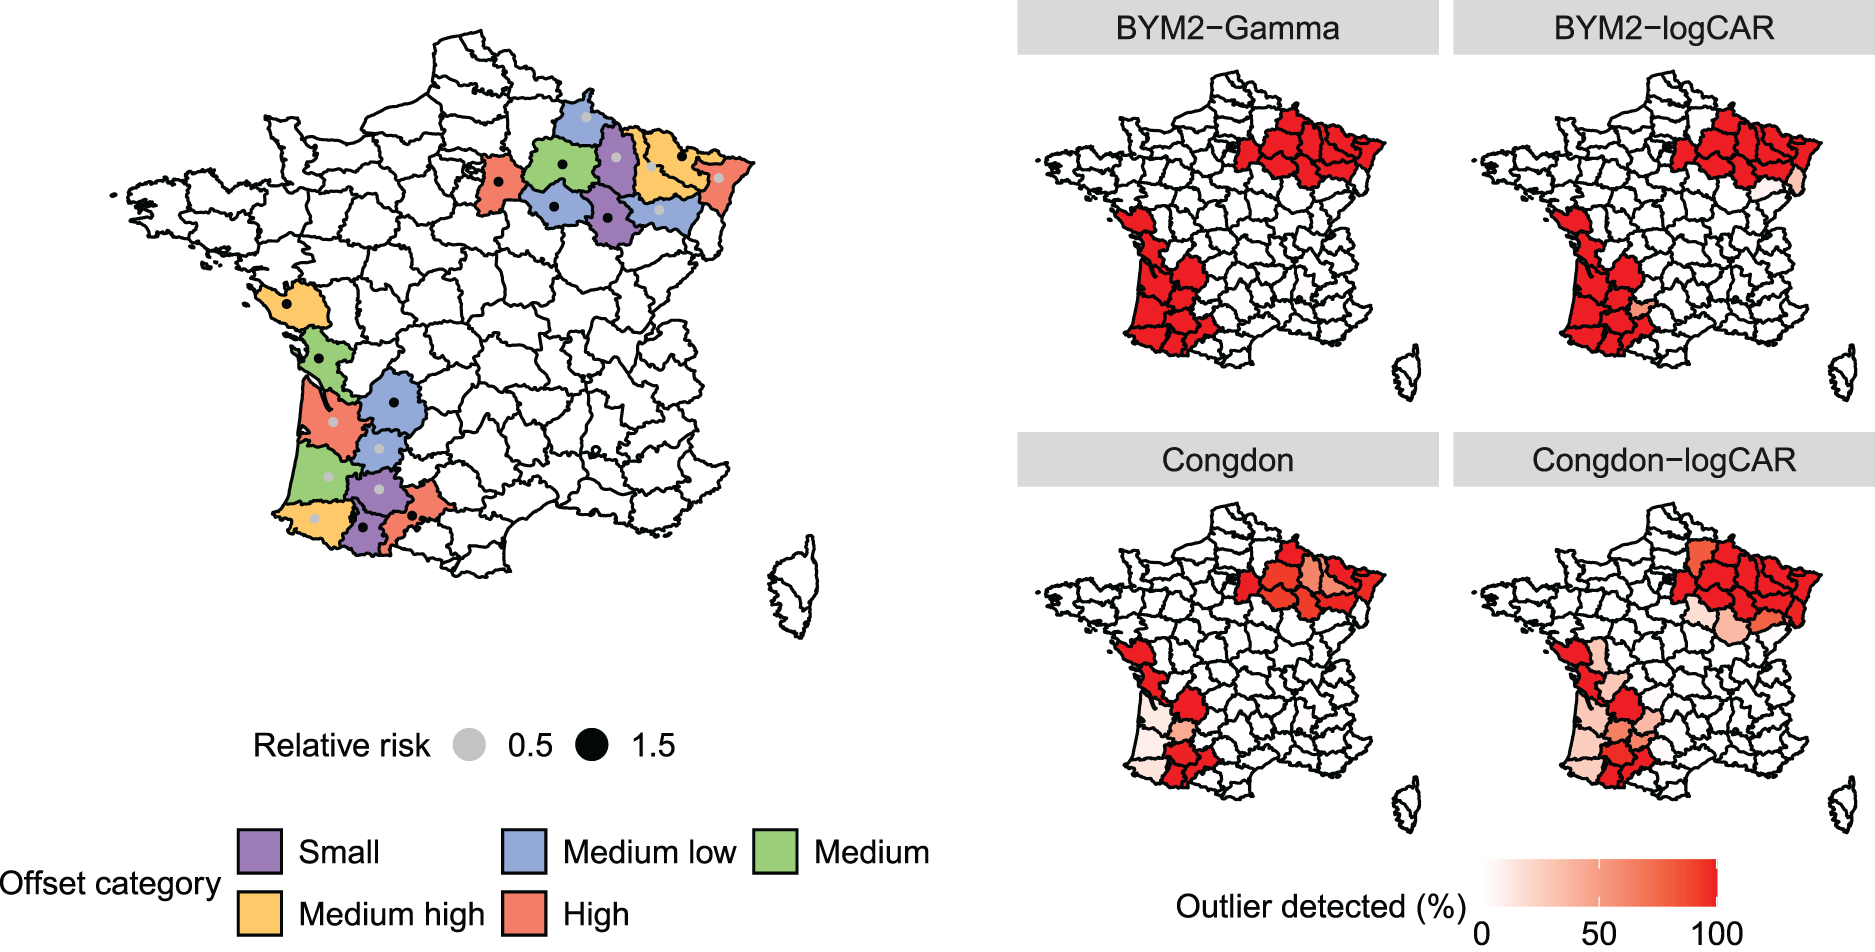
Left panel: French departments arbitrarily chosen to be outliers in the simulation study. Colours depict the offset category based on the empirical offset quantiles. The points represent the relative risk set to each outlying district. Right panel: Percentage of times, among the 100 replicates, that the outliers were identified by each model. The outliers are pointed out when
Using the two-scale mixtures described in Section 2.1, the Congdon model is compared to the proposed model. The first version of the proposed model is denoted BYM2-Gamma (equation (5)) and the second, BYM2-logCAR (see equation (6)). The original Congdon model is termed Congdon, whereas the one with spatially structured scale mixture components is denoted Congdon-logCAR. For the four models, the intercept is given a quite vague prior:
The models are fitted through the R package rstan (Stan Development Team
25
). For each dataset, the MCMC procedure consists of two chains of 20,000 iterations with a 10,000 burn-in period and a thinning factor of 10. Convergence of the chains is assessed through trace plots, effective sample sizes and the
In terms of WAIC, 30 for which smaller values are preferred, the proposed BYM2-Gamma model yields the smallest value among the four models, as shown in the two panels at the top of Figure 3, with an average WAIC of 962 versus 967, 972 and 975 for Congdon, BYM2-logCAR and Congdon-logCAR, respectively. In terms of MSE, Figure 3 shows that all models perform similarly: on average over the 100 replicates and all areas, the BYM2-Gamma’s MSE is 0.0003, versus 0.0004 for Congdon and 0.0005 for both models with the logCAR parametrisation.
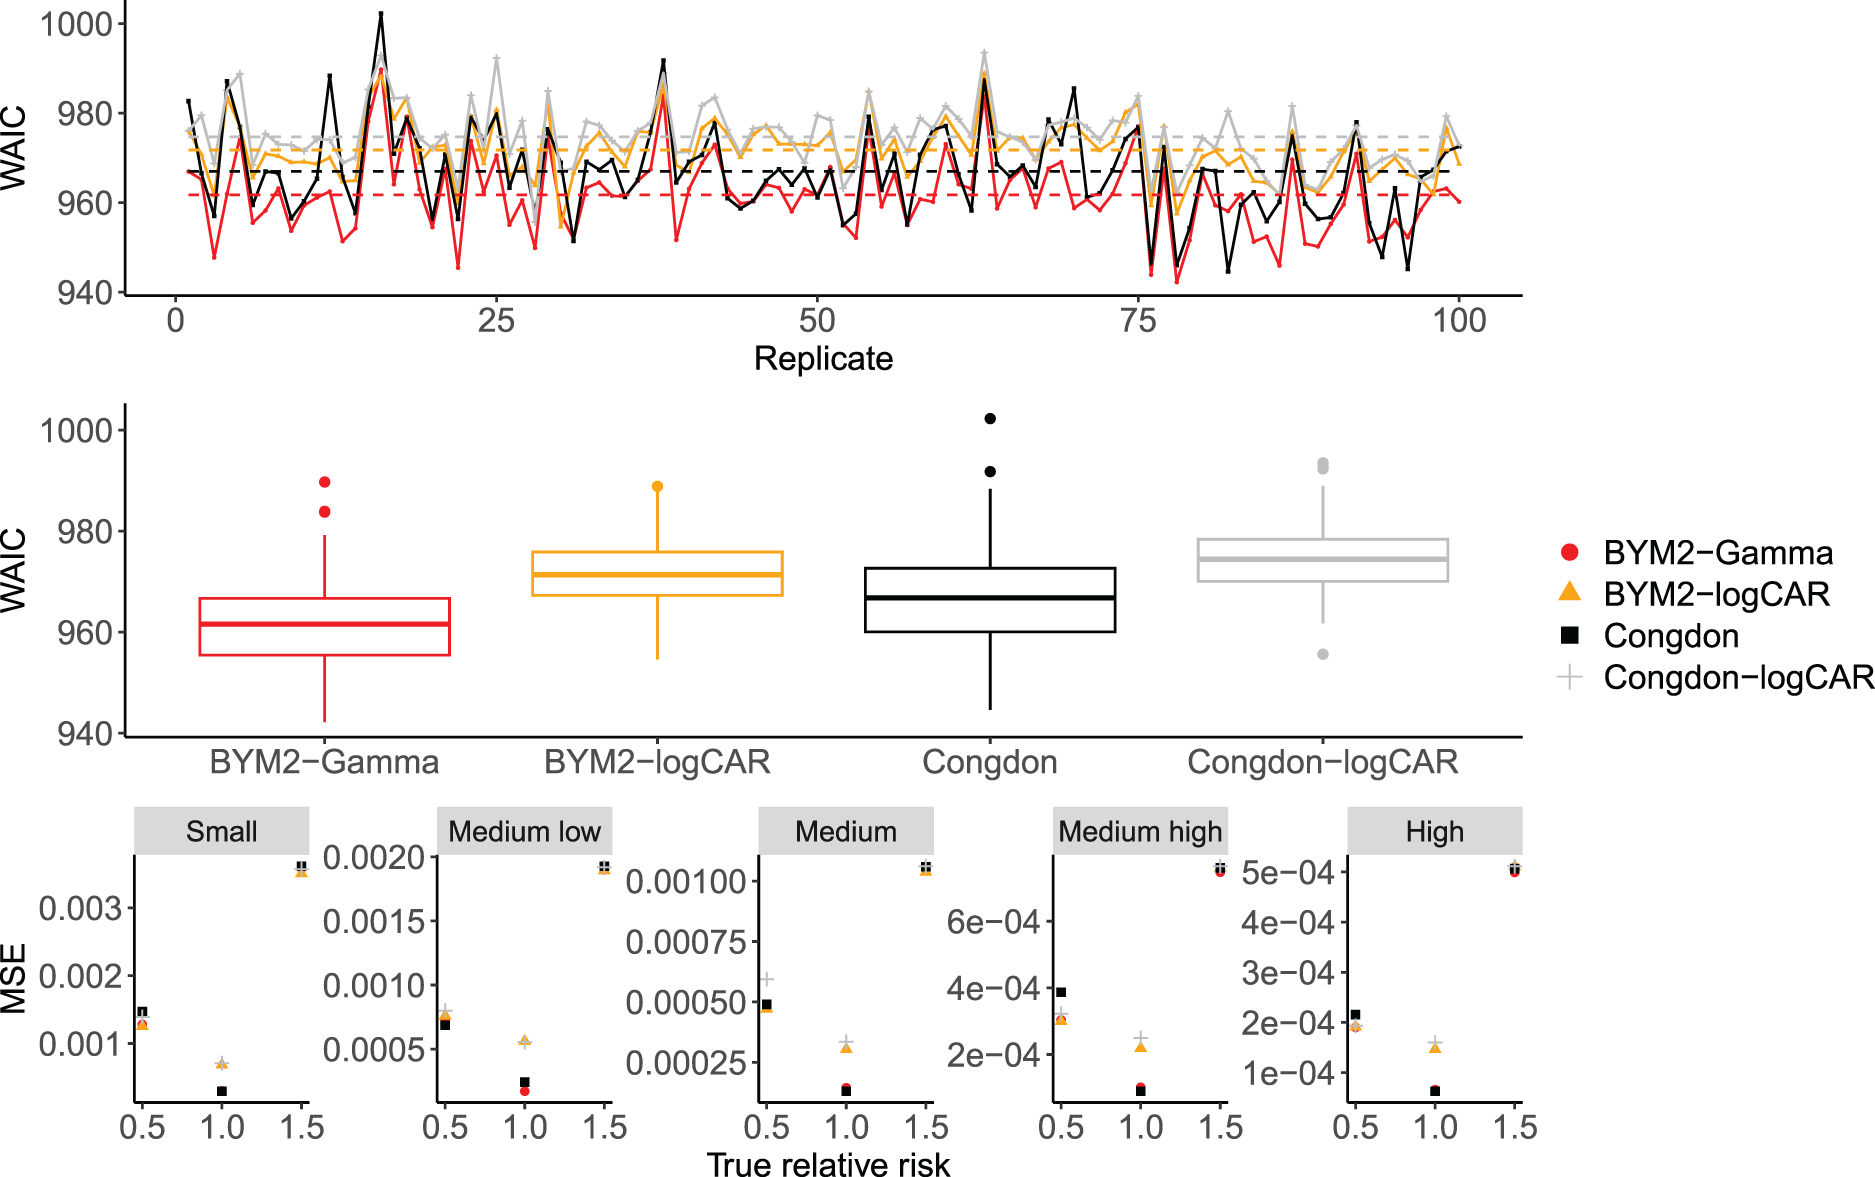
Top panel: WAIC across the 100 replicates for the proposed models and Congdon’s, in the simulation study. Dashed lines: mean WAIC for each model. Middle panel: box-plots of the WAIC values across the 100 simulation replicates for each model. Bottom panel: MSE over the 100 replicates for the proposed models and Congdon’s according to the true relative risk and the offset size. WAIC: widely applicable information criterion; MSE: mean squared error.
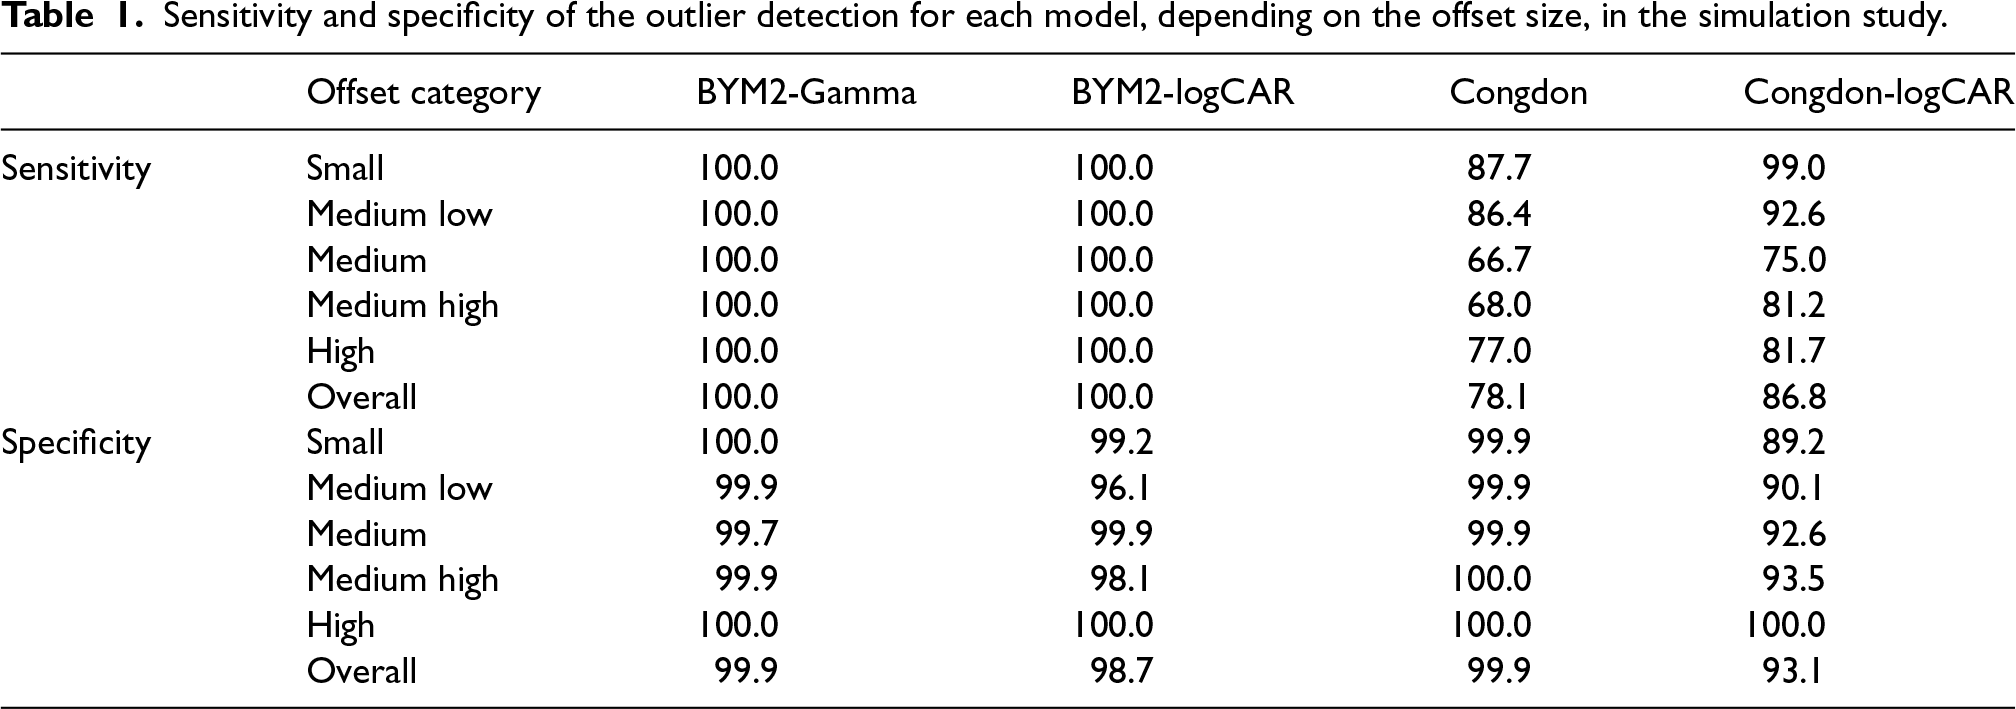
Regarding the detection of outliers, Table 1 and the right panel of Figure 2 show how often each model accurately detects departments as outliers (sensitivity) and non-outliers (specificity), depending on the offset category. That is, the sensitivity is equal to the percentage of outliers detected among the contaminated departments over the 100 replicates. The specificity is the percentage of departments not identified as outliers among the ones whose true relative risk is equal to 1, over the 100 replicates. The definition of sensitivity and specificity are taken from Richardson et al.
17
Area
Sensitivity and specificity of the outlier detection for each model, depending on the offset size, in the simulation study.
To further assess the performance of the proposed model, other simulation studies were conducted. In Appendices C and D in the Supplemental Material, two simulation studies show the ability of the two versions of the proposed model to recover the true parameters when data are generated from the model itself. This suggests that the proposed model does not suffer from identifiability issues. In particular, the proposed model is able to identify and distinguish, for each district, the outlier indicators, the spatial components and the unstructured components, individually. Appendix E in the Supplemental Material presents a simulation study without contaminating any areas into outliers, which results in the proposed model performing well compared to the prior by Congdon, 19 in terms of WAIC and in terms of outlier detection, where Congdon’s model wrongly identifies non-outlying areas as outliers. Appendix F in the Supplemental Material presents the results from a simulation study where arbitrary distant areas in France are contaminated into outliers. Again, the goal is to assess the ability of the proposed model to identify these outliers. As discussed in Section 2, in that scenario where outliers are far from each other, the proposed model performs similarly to the Congdon’s model. To show that the performance of the proposed model is independent of the neighbourhood structure under study, we present in Appendix G in the Supplemental Material the results from two simulation studies that use the map of Rio de Janeiro, where some districts are contaminated into outliers. A third simulation study shown in Appendix G.3 in the Supplemental Material aims to resemble the data analysis presented in Section 3.2, wherein a covariate is included, and relative risks vary more over the region of interest. We found that the proposed model performed better in identifying the outliers, compared to the Congdon’s model.
Cases of Zika during the 2015-2016 epidemic in Rio de Janeiro
The total numbers of cases of Zika were recorded across the 160 neighbourhoods of Rio de Janeiro during the first epidemic, which took place between 2015 and 2016. Let
All models are fitted in rstan (Stan Development Team, 2020) with two chains of 20,000 iterations thinned by 10 and of which 10,000 are burnt. As assessed by the trace plots, the effective sample sizes and the
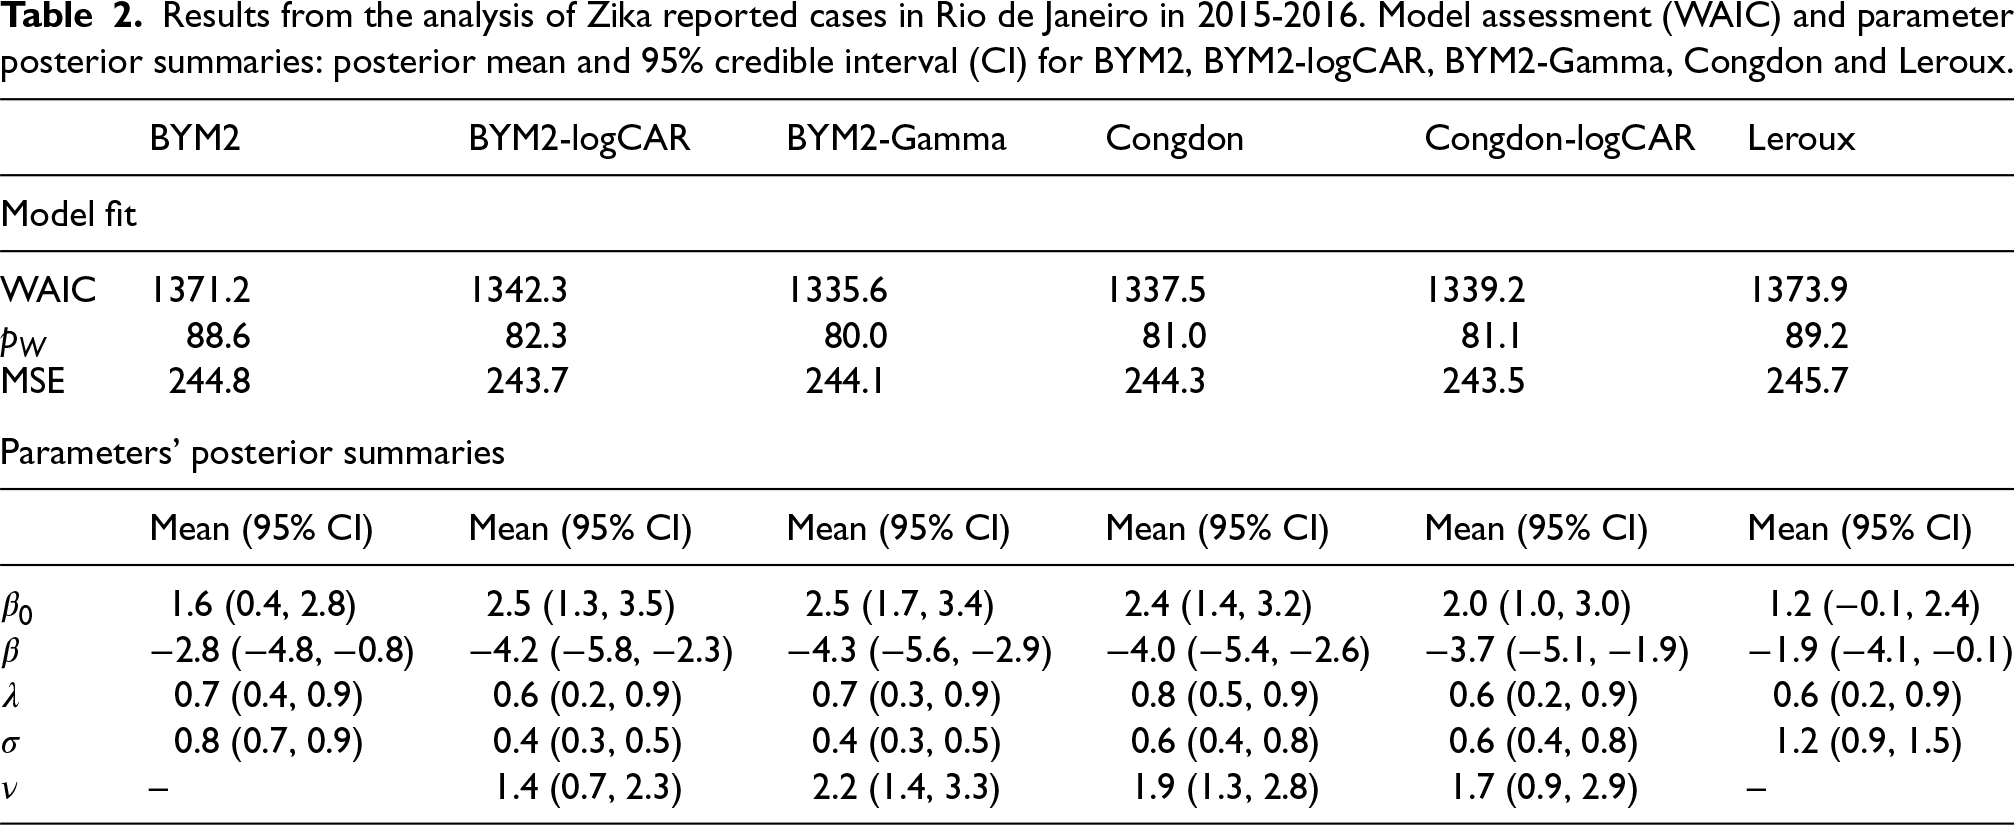
The results from the fitted models are presented in Table 2 and Figure 4. In terms of WAIC, the proposed BYM2-Gamma model performs best among the six considered. There is an important performance gain when accommodating outliers (BYM2-Gamma, BYM2-logCAR, Congdon and Congdon-logCAR: 1335, 1342, 1337 and 1339, respectively, vs. BYM2 and Leroux: 1371 and 1374, respectively). Congdon’s prior does not seem to perform significantly worse than the BYM2-Gamma model. Interestingly, even though the proposed model has 160 more parameters than Congdon’s, its effective number of parameters is similar (80 vs. 81). The models are further compared in terms of MSE, where
Results from the analysis of Zika reported cases in Rio de Janeiro in 2015-2016. Model assessment (WAIC) and parameter posterior summaries: posterior mean and 95% credible interval (CI) for BYM2, BYM2-logCAR, BYM2-Gamma, Congdon and Leroux.
Results from the analysis of Zika reported cases in Rio de Janeiro in 2015-2016. Model assessment (WAIC) and parameter posterior summaries: posterior mean and 95% credible interval (CI) for BYM2, BYM2-logCAR, BYM2-Gamma, Congdon and Leroux.
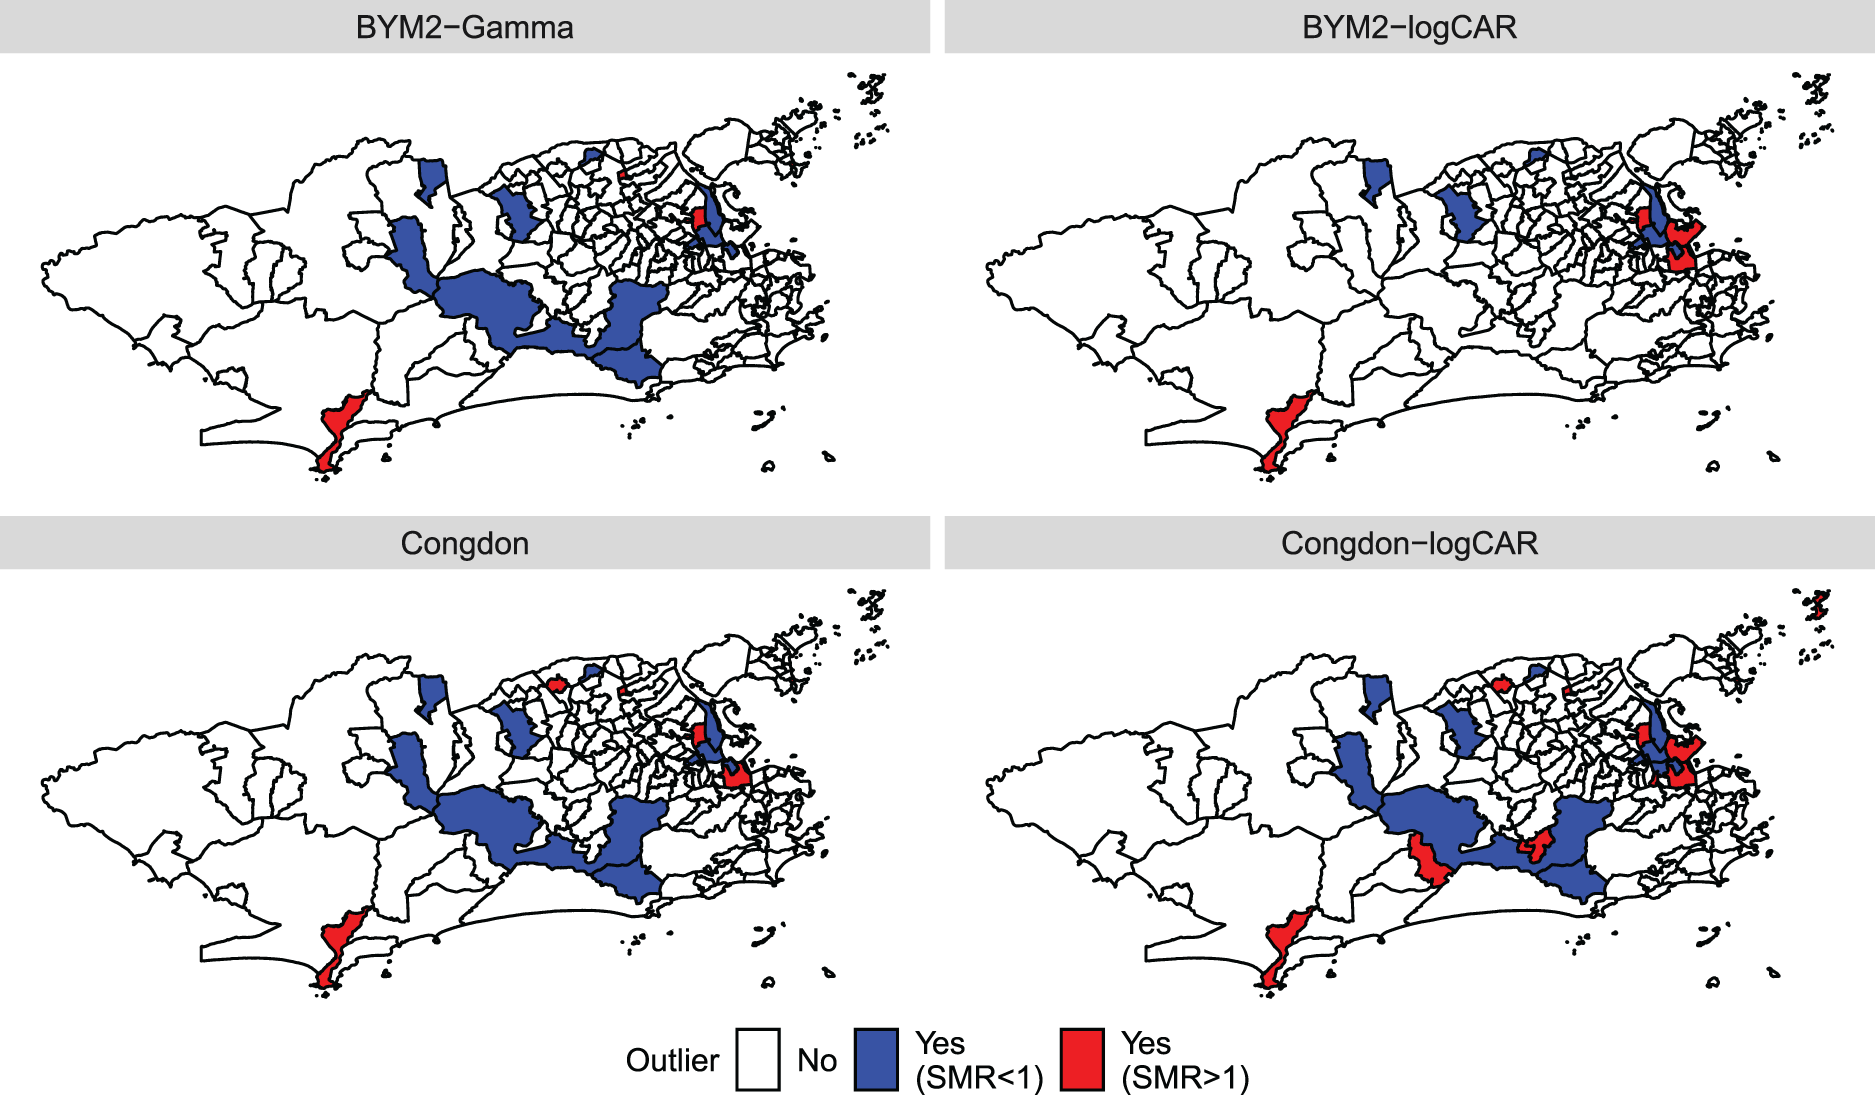
Maps of the outliers indicated by each model when analysing the Zika counts. The outliers are pointed out when
Regarding the intercept,
We now focus on the outliers detected by the proposed models and Congdon’s, as shown in Figure 4. District
In this article, we propose a disease mapping model that is able to identify areas with potentially outlying disease risks, after accounting for the effects of covariates. Outliers refer to areas with extreme risks – on the tail of the risk distribution – as well as spatial outliers, after accounting for covariates. Spatial outliers correspond to areas whose risk differs from their neighbours, after accounting for covariates. The proposed model is a scale mixture of the BYM2 model. 11 Two different prior specifications are proposed for the scale mixture components in order to compare independent components and spatially structured components. Our model allows for a straightforward interpretation of the parameters, that is common to every data application, while accommodating outliers. The parameters’ interpretation is eased by the scaling process of the latent spatially structured components. 15
A simulation study presents the performance of the two versions of the proposed model compared to the one by Congdon, 19 as well as a version of Congdon’s model that uses our proposed spatially structured mixture components. The neighbourhood structure of France is used and the latent effects of some neighbouring departments are contaminated to control the presence of outliers. The BYM2-Gamma version of the proposed model always performs best in terms of WAIC and in terms of MSE. Regarding the detection of outliers, the two versions of the proposed model always identify the contaminated departments, compared to the two parametrisations of Congdon’s model that miss up to 33% of the outliers. Additionally, the BYM2-Gamma version of the proposed model does not detect non-contaminated districts. Finally, in all of our simulation studies, the proposed model always performs at least as well as Congdon’s, and often better, both in terms of WAIC, MSE and of outlier identification (see e.g. Appendices F and G in the Supplemental Material).
The cases of Zika that were recorded in Rio de Janeiro during the first 2015-2016 epidemic are analysed using the two parametrisations of the proposed model as well as the model by Congdon 19 and its version with spatially structured mixture components, the BYM2 11 and the Leroux prior. 14 All six models find that there is a fairly strong negative association between the socio-development index and the number of cases, meaning that richer districts have lower disease risks. This finding is consistent with previous studies conducted in Rio de Janeiro, one investigating the first chikungunya epidemic in the city 7 and another also investigating Zika, but using a different methodological approach. 31 These studies, including ours, indicate that improving sanitary conditions and reducing socio-economic disparities are of paramount importance to fight Aedes-borne diseases.
After accounting for the effect of the socio-development index, some neighbourhoods are detected as potential outliers by the proposed models and Congdon’s, both in the lower and upper tails of the number of cases’ distribution across the districts. Out of the 23 neighbourhoods identified as outliers, irrespective of the model, the proposed models BYM2-logCAR and BYM2-Gamma identified 11 (47.8%) and 14 (60.9%), respectively. The four models do not always point out the same districts as potential outliers. One possible explanation for that is the small offset sizes of some districts. The simulation study with neighbouring outliers showed that, when the offset is small, the models that impose a spatially structured prior on the scaling mixture components tend to accurately identify outlying areas more often than the models with a priori independent mixture components. Regarding the analysis of Zika cases, Figure 5 shows in red and purple the districts identified as outliers by at least one of the four models and whose offsets are among the smaller 5%. For example, based on the results from the second simulation study, it is possible that, when analysing the Zika counts, Camorim (purple) and the island Paquetá (red) are missed by the BYM2-Gamma and Congdon models while they are pointed out by the Congdon-logCAR model (Figure 4) because of their smaller offset sizes (Figure 5).
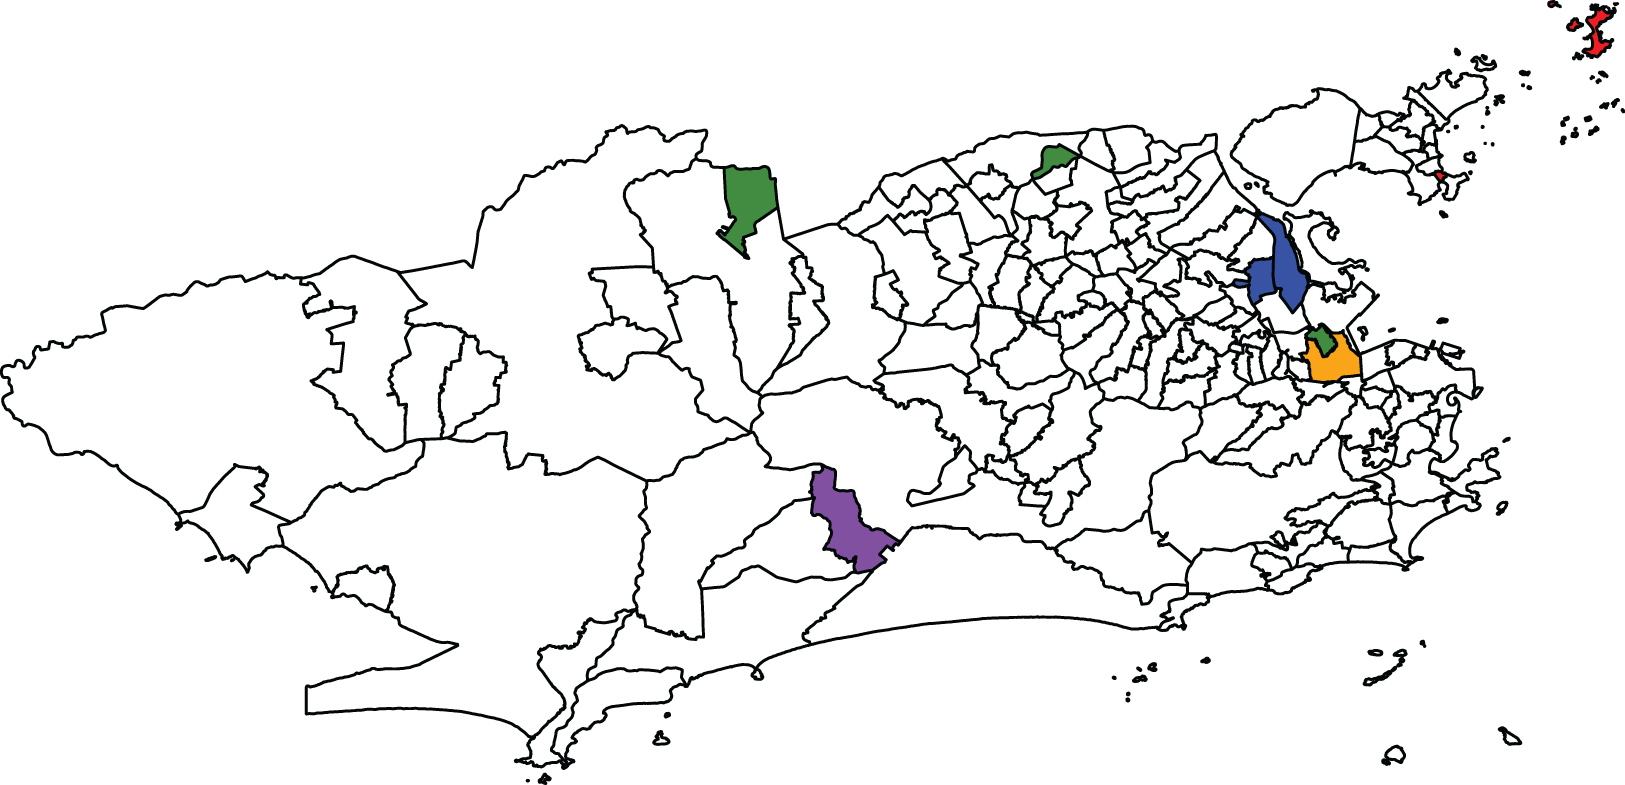
Map highlighting some districts identified as outliers by at least one model when analysing the Zika counts. Orange: São Cristóvão; red: districts with small offsets; blue: districts whose population sizes increased significantly after the 2010 census; purple: districts combining both characteristics; and green: districts with zero cases recorded.
Figure 5 highlights in green the districts with zero Zika cases recorded between 2015 and 2016: Parque Colúmbia, Gericinó and Vasco da Gama. These three districts are pointed out as outliers by the four models, as shown in Figure 4. One potential explanation for these zero recorded cases is that when the disease appeared for the first time in 2015, it was not immediately identified as Zika. Further, there is evidence that epidemics in Rio de Janeiro tend to spread starting from the north-east of the city. 3 It is then possible that when the authorities began registering the Zika cases, there were no cases to record in the two northern districts highlighted in blue, Parque Colúmbia and Gericinó. Another potential reason is that it is not uncommon in Rio de Janeiro for a person to report as their neighbourhood of residence a neighbourhood that actually shares a border with the one where they actually live. For instance, Parque Colúmbia and Gericinó are relatively new districts and the population might not yet be used to naming them as their districts of residence. Similarly, a person living in Vasco da Gama (southern green district) may report São Cristóvão (orange) as their district. This would artificially cause Vasco da Gama to record zero cases and be detected as a potential outlier. Further, if a given district is accounting for a proportion of the cases that are in fact from the neighbouring areas (e.g. São Cristóvão), this would artificially increase the risk of this district. In fact, Figure 4 shows that São Cristóvão is pointed out as a potential outlier by all models but the BYM2-Gamma. Therefore, the inaccurate information on the district of residency may artificially create outliers.
Finally, artificial outliers may be caused by inaccurate information on the areal population sizes used to compute the offsets. While the disease counts were recorded during 2015-2016, the population sizes were extracted from the previous census, dating from 2010. Between 2010 and 2015-2016, the population sizes may have increased in some districts, without being reflected in the offsets in this analysis, causing the artificial detection of increased disease risks. Figure 5 highlights in blue and purple the districts identified as potential outliers and whose sizes have largely increased since 2010, according to more recent aerophotogrammetry flights by the Health Secretariat of the city. The eastern blue districts are pointed out as outliers by all four models in Figure 4. Further investigating these districts would help determine whether they do present outlying disease risks or if they are artificial outliers. An interesting side effect of the proposed model seems to be that by identifying outliers and further investigating the results, the authorities might better understand the population dynamics in the region of interest, in between censuses, and identifying potential issues in the accurate recording of cases.
We suggest exploring both prior specifications for the scaling mixture components, using the proposed and Congdon’s models, and further investigation on the detected districts should be conducted by decision makers and experts to fully comprehend the detected outlying behaviours. Additionally, besides looking at the posterior summary of
Also, it is important to emphasise that some socio-environmental factors that influence the burden and distribution of Aedes-borne diseases may be heterogeneous within the districts, our spatial unit of analysis. For example, the same district may have areas with favelas (slums) and areas with middle and upper class condominiums. The socio-development index will not capture this intra-district social inequality, and a recent study showed evidence about the presence of socio-economic inequalities in the distribution of dengue, Zika and chikungunya in two Latin American cities. 32 Another possibility is the presence of large potential breeding sites, such as dumps and vacant lots. It is also worth mentioning that spatial confounding, which is beyond the scope of this work, is a potential issue that may affect the estimated latent effects33,34 and identified potential outliers. Hence, interpretation of the results should be done with care.
To conclude, we believe our proposed model to be useful to decision makers. First, the parameters’ interpretation eases the use of our model regardless of the data spatial structure. This may help decision makers to create a systematic procedure to analyse data with our proposed model, in which non-informative priors for the parameters could be defined for any spatial structure. Then, the introduction of scaling mixture components improves the recovering of the observed and potentially outlying disease risks, as assessed by the model performance criteria (WAIC and MSE). Finally, these mixture components together with high estimated risk ratios help identify all the potential outlying areas in which interventions may need to be prioritised.
Supplemental Material
sj-pdf-1-smm-10.1177_09622802241293776 - Supplemental material for A Bayesian hierarchical model for disease mapping that accounts for scaling and heavy-tailed latent effects
Supplemental material, sj-pdf-1-smm-10.1177_09622802241293776 for A Bayesian hierarchical model for disease mapping that accounts for scaling and heavy-tailed latent effects by Victoire Michal, Alexandra M Schmidt, Laís Picinini Freitas and Oswaldo Gonçalves Cruz in Statistical Methods in Medical Research
Footnotes
Declaration of conflicting interests
The author(s) declared no potential conflicts of interest with respect to the research, authorship, and/or publication of this article.
Funding
The author(s) disclosed receipt of the following financial support for the research, authorship, and/or publication of this article: Michal was partially supported from an award from the Fonds de Recherche Nature et Technologies (B2X-314857). Schmidt and Cruz are grateful to IVADO (Fundamental Research Project, PRF-2019-6839748021).
Data availability
The Zika and the population data analysed in this study come from the Brazilian Notifiable Diseases Information System (SINAN – Sistema de Informação de Agravos de Notificação) and the Brazilian Institute of Geography and Statistics (IBGE – Instituto Brasileiro de Geografia e Estatística), respectively, and are publicly available at the Rio de Janeiro Secretariat of Health website (http://www.rio.rj.gov.br/dlstatic/10112/7079759/4197436/ZIKASE2015.pdf and http://www.rio.rj.gov.br/dlstatic/10112/10617973/4260330/ZIKASE2016.pdf, for 2015 and 2016, respectively). Note that SINAN reflects data from the public health system (SUS – Sistema Único de Saúde) only, which does not include data from private hospitals and health plans. The sociodevelopment index data come from the Instituto Pereira Passos and can be found at ![]() .
.
Supplemental material
Supplemental materials for this article are available online.
References
Supplementary Material
Please find the following supplemental material available below.
For Open Access articles published under a Creative Commons License, all supplemental material carries the same license as the article it is associated with.
For non-Open Access articles published, all supplemental material carries a non-exclusive license, and permission requests for re-use of supplemental material or any part of supplemental material shall be sent directly to the copyright owner as specified in the copyright notice associated with the article.