
Abstract
Researchers often use outcome-dependent sampling to study the exposure-outcome association. The case-control study is a widely used example of outcome-dependent sampling when the outcome is binary. When the outcome is ordinal, standard ordinal regression models generally produce biased coefficients when the sampling fractions depend on the values of the outcome variable. To address this problem, we studied the performance of survey-weighted ordinal regression models with weights inversely proportional to the sampling fractions. Through an extensive simulation study, we compared the performance of four ordinal regression models (SM: stereotype model; AC: adjacent-category logit model; CR: continuation-ratio logit model; and CM: cumulative logit model), with and without sampling weights under outcome-dependent sampling. We observed that when using weights, all four models produced estimates with negligible bias of all regression coefficients. Without weights, only stereotype model and adjacent-category logit model produced estimates with negligible to low bias for all coefficients except for the intercepts in all scenarios. In one scenario, the unweighted continuation-ratio logit model also produced estimates with low bias. The weighted stereotype model and adjacent-category logit model also produced estimates with lower relative root mean square errors compared to the unweighted models in most scenarios. In some of the scenarios with unevenly distributed categories, the weighted continuation-ratio logit model and cumulative logit model produced estimates with lower relative root mean square errors compared to the respective unweighted models. We used a study of knee osteoarthritis as an example.
Keywords
Introduction
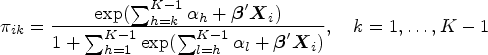
Outcome-dependent sampling (ODS) or disease-based sampling is commonly implemented in observational studies when the outcome prevalence is low or when study resources are limited.1–3 Under ODS, a subset of participants from an existing cohort is retrospectively sampled with a sampling probability that depends on their observed value of the outcome variable. Then, the expensive exposure variable is ascertained only for the new subsample of participants. It is well established that ODS can be more efficient than simple random sampling (SRS). 4 When the outcome of interest is a binary variable, then the ODS design is equivalent to a case-control study, and logistic regression is the standard form of analysis. Despite the oversampling of cases that occurs in case-control studies, the logistic regression coefficient estimates obtained from the sampled data are consistent for the population, except for the intercept.5,6
Ordinal data are categorical data where the categories possess a meaningful order, distinguishing them from nominal data with no inherent ordering. These variables commonly arise in pain or disease severity scales in health assessments. Despite their prevalence, most existing methods for analyzing ordinal data treat them as nominal or continuous, neglecting the unique characteristics of ordinal outcomes. 7 Nevertheless, adopting ordinal-specific statistical models can be more advantageous. 8 In this article, we are interested in exploring statistical methods to model ordinal categorical outcomes under ODS. To the best of our knowledge, our work represents the first comprehensive exploration of regression models specifically tailored to model ordinal categorical outcomes under ODS. Examples of ordinal outcomes in this framework are the Global Clinical Impression Scale to assess the symptoms and functional ability of participants with mental disorders, the Glasgow outcome scale to assess the functional outcomes of participants with brain injury, and the BI-RADS density scale to classify breast density.9,10 If the exposure of interest, such as a new genetic marker from stored sample specimens or new readings from stored computed tomography (CT) scan images, needs to be ascertained retrospectively, and if the ascertainment is costly, then ODS will generally result in more statistically efficient estimates with smaller standard errors than SRS.11,12 Our illustrative example comes from a knee osteoarthritis (OA) study, where the severity of the disease is expressed using the Kellgren-Lawrence (KL) radiographic grade that ranges from 0 (absence of OA) to 4 (most severe form of OA). To study the association between KL grade and a genetic marker among knee OA patients in a resource-limited setting, an ODS framework may be advantageous for researchers.
The ordinal regression model with various logits (AC: adjacent-category logit; CR: continuation-ratio logit; CM: cumulative logit) assuming proportional odds is a well-known and commonly used extension of logistic regression to ordinal outcomes. However, the regression coefficient estimates obtained from CM and CR under ODS are biased.13,14 Greenland 13 further showed that the regression coefficients (except for the intercept) obtained from the stereotype model (SM) under ODS are consistent estimators of the original cohort. However, if a pre-specified number of participants are randomly sampled from each outcome category, then an ordinal ODS design is equivalent to stratified random sampling where the strata are defined by the categories of the outcome of interest. Design-consistent inference about the population from a stratified sample can be obtained by weighing each observation with the inverse of its inclusion (or sampling) probability. Therefore, if the sampling probability is known by design, then any ordinal regression model weighted by the inverse of the sampling probability should produce consistent coefficient estimates including the intercepts. Although the accuracy of the intercept is often overlooked under ODS, it might be important if the interest lies in estimating the absolute risks or risk differences.
The objective of this study is to compare the bias and efficiency of the estimated regression coefficients from weighted and unweighted ordinal regression models (SM, AC, CR, and CM) in ordinal ODS under various distributions of outcome categories. For weighted models, we obtain design-based standard error estimates using linearization
15
and provide code to apply linearization to SM estimated from the
Review of ordinal regression models
Let
Stereotype model
The stereotype model (SM) for ordinal outcomes was proposed by Anderson
18
and is considered a more general form of the proportional odds model.
7
SM uses a baseline-category logit and additional score parameters,
The model is described as follows:


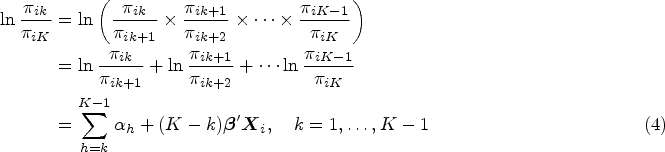
The adjacent-category (AC) models the log odds of two consecutive categories and has the form

AC can be re-expressed as SM with fixed and equally spaced score parameters:
7
The continuation-ratio (CR) model is


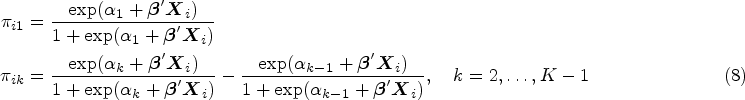
The cumulative logit (CM) model, often referred to as “the proportional odds logistic regression,” is the most widely used model when the outcome variable has more than two categories, and is useful when the interest is in modelling whether patients improved in disease category based on a treatment. CM is given by the following:

Suppose now that the original cohort consists of
When
Let


For AC, we obtain

Equation (10) implies that, in SM, the
The log-likelihood contribution from the
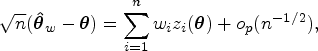
Under ODS, we obtain design-consistent estimates of the parameters in the ordinal regression models by maximizing the log of the pseudo-likelihood

To construct design-based standard error estimates of
We used the
Design
We conducted an extensive simulation study to compare the bias and efficiency of unweighted (
Proportions in each of the ordinal outcome categories to generate the full cohort in each simulation scenario (same for A1 and A2) and mean CV of the inverse probability weights from ODS (A1).
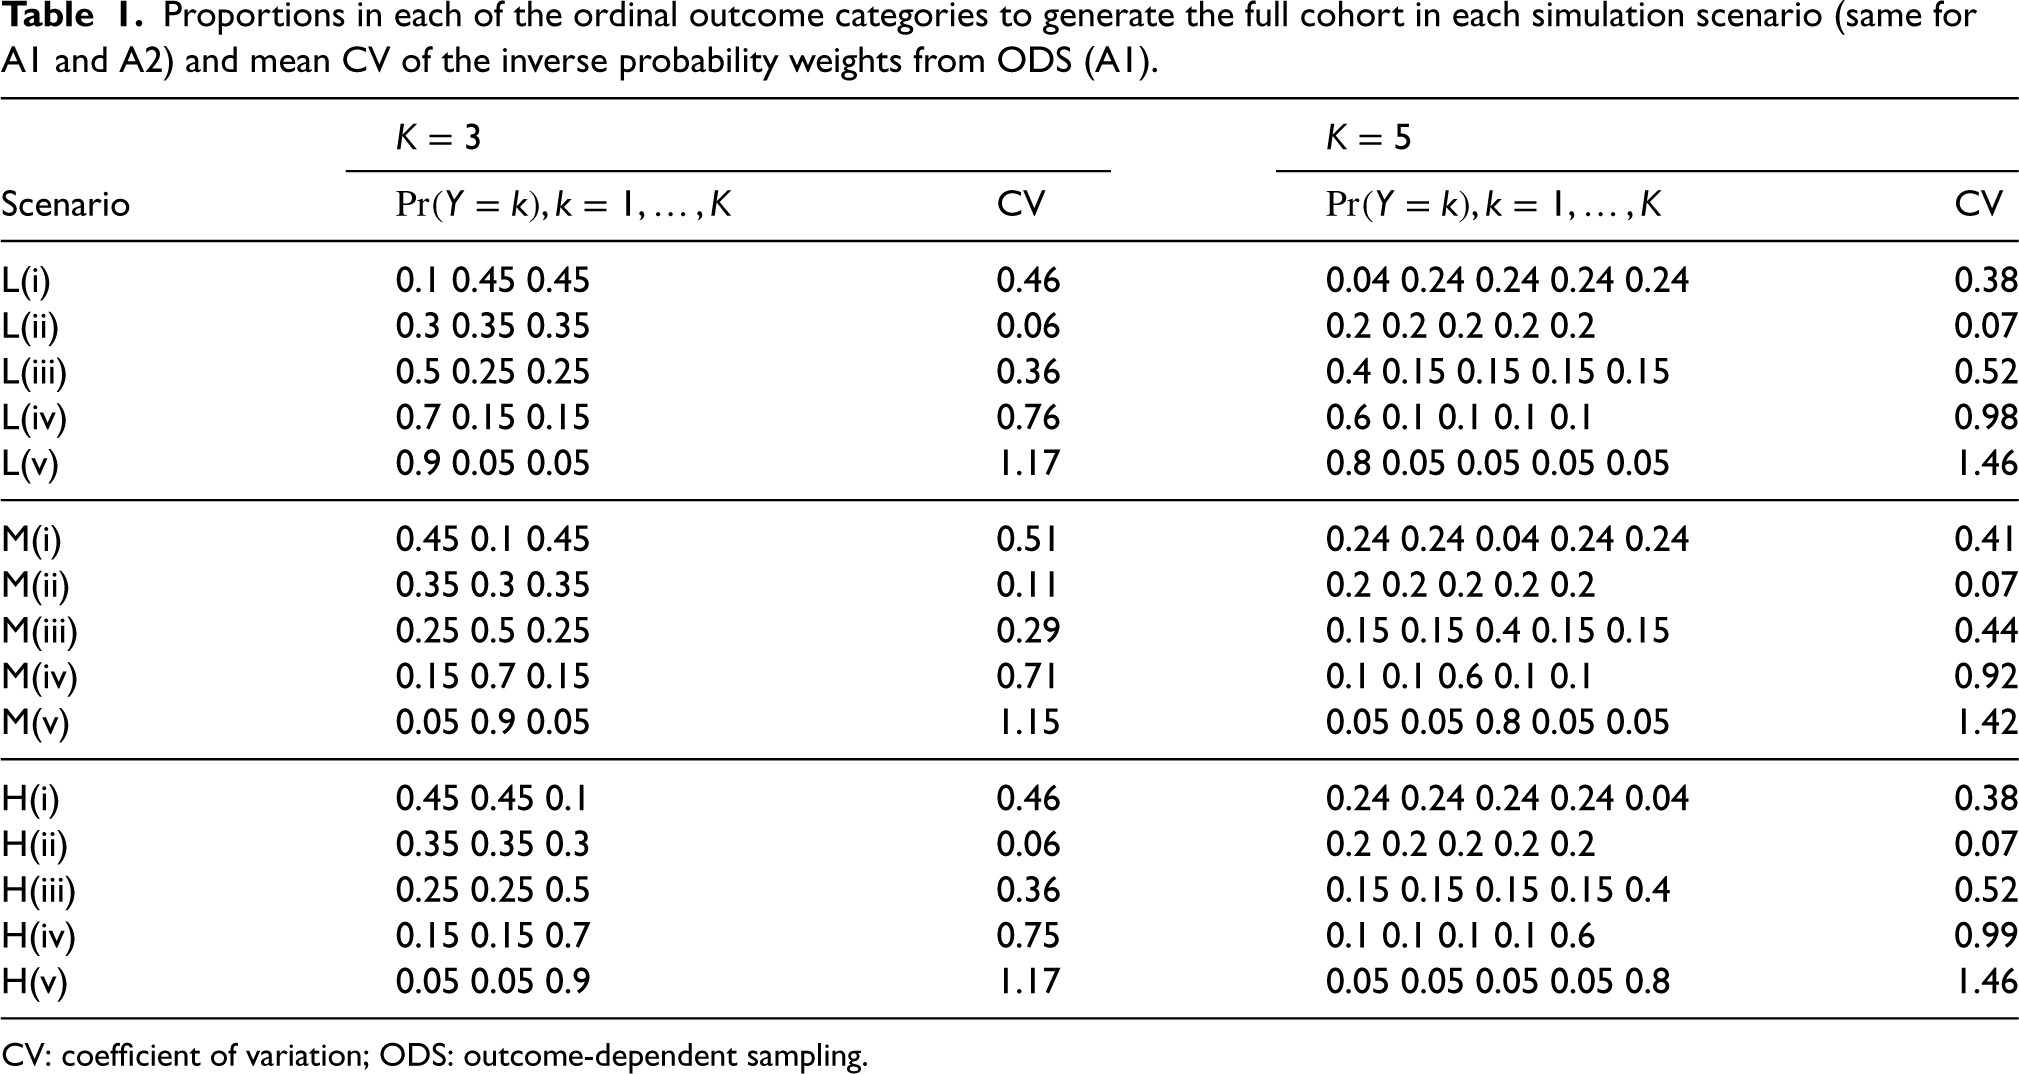
Proportions in each of the ordinal outcome categories to generate the full cohort in each simulation scenario (same for A1 and A2) and mean CV of the inverse probability weights from ODS (A1).
CV: coefficient of variation; ODS: outcome-dependent sampling.
The coefficients in each SM, AC, CR, and CM have different interpretations and cannot be directly compared to each other. Therefore, we generated ordinal outcomes from four separate models: SM, AC, CM, and CR. However, we wanted the data generated from each model to be comparable in outcome and covariate distributions as well as the outcome-covariate relationship. Therefore, the values of the true vector 
For each of the four models, we simulated a cohort of
The R statistical environment was used to conduct the simulation study. Packages and functions used to fit each model are described in Section 3.1.
The simulation results of
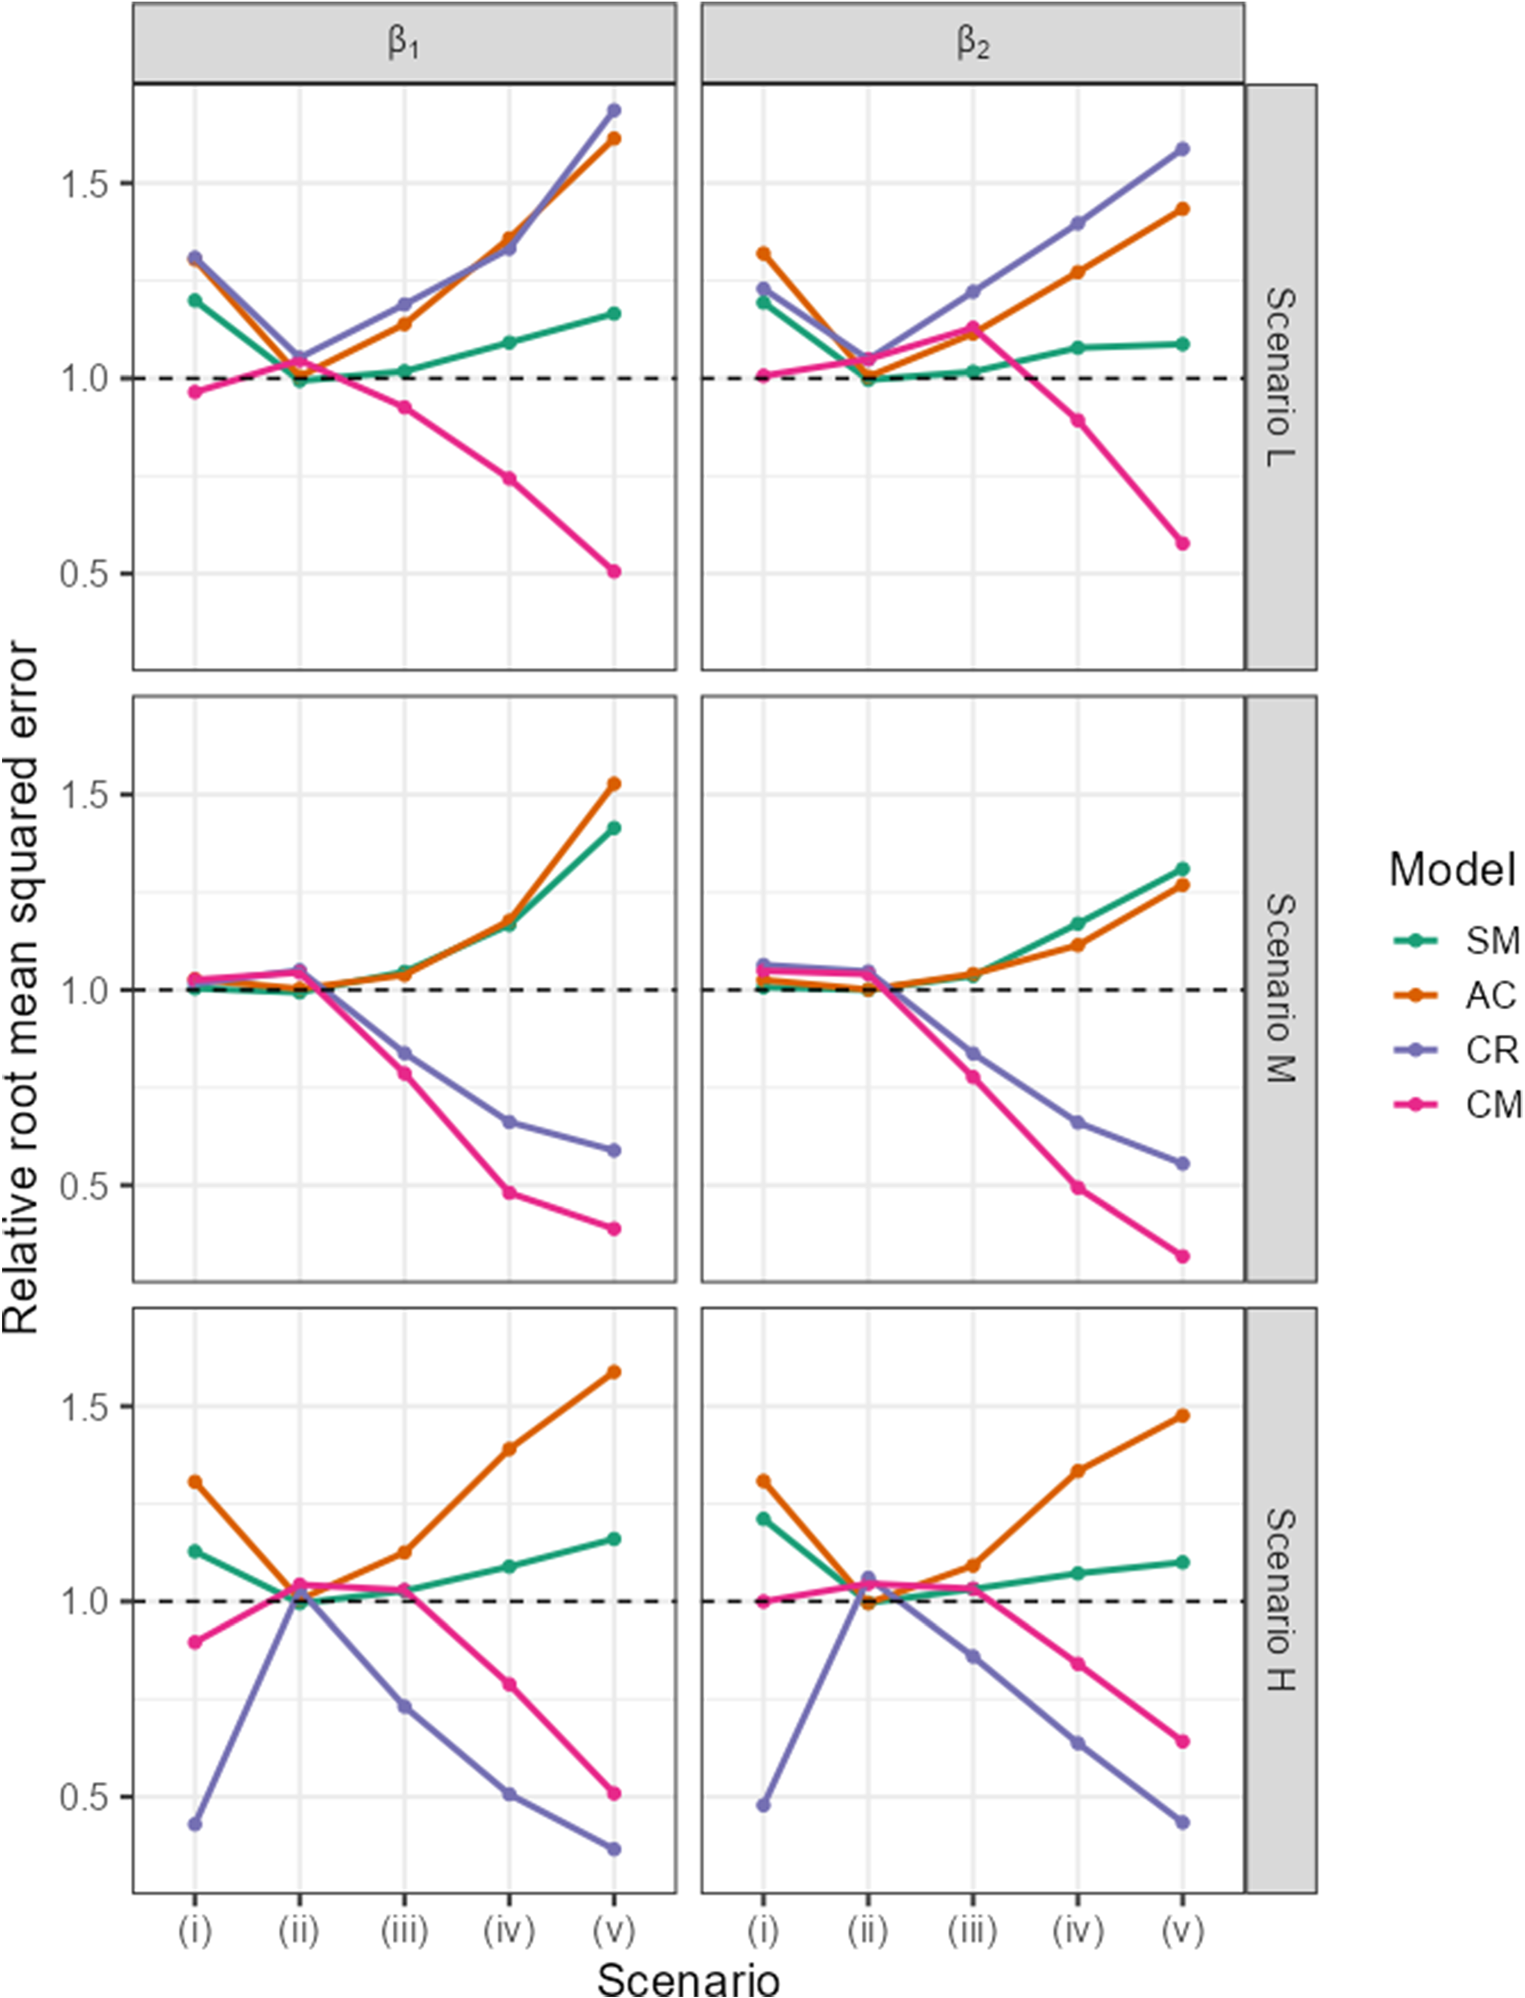
Patterns of relative root mean squared error for
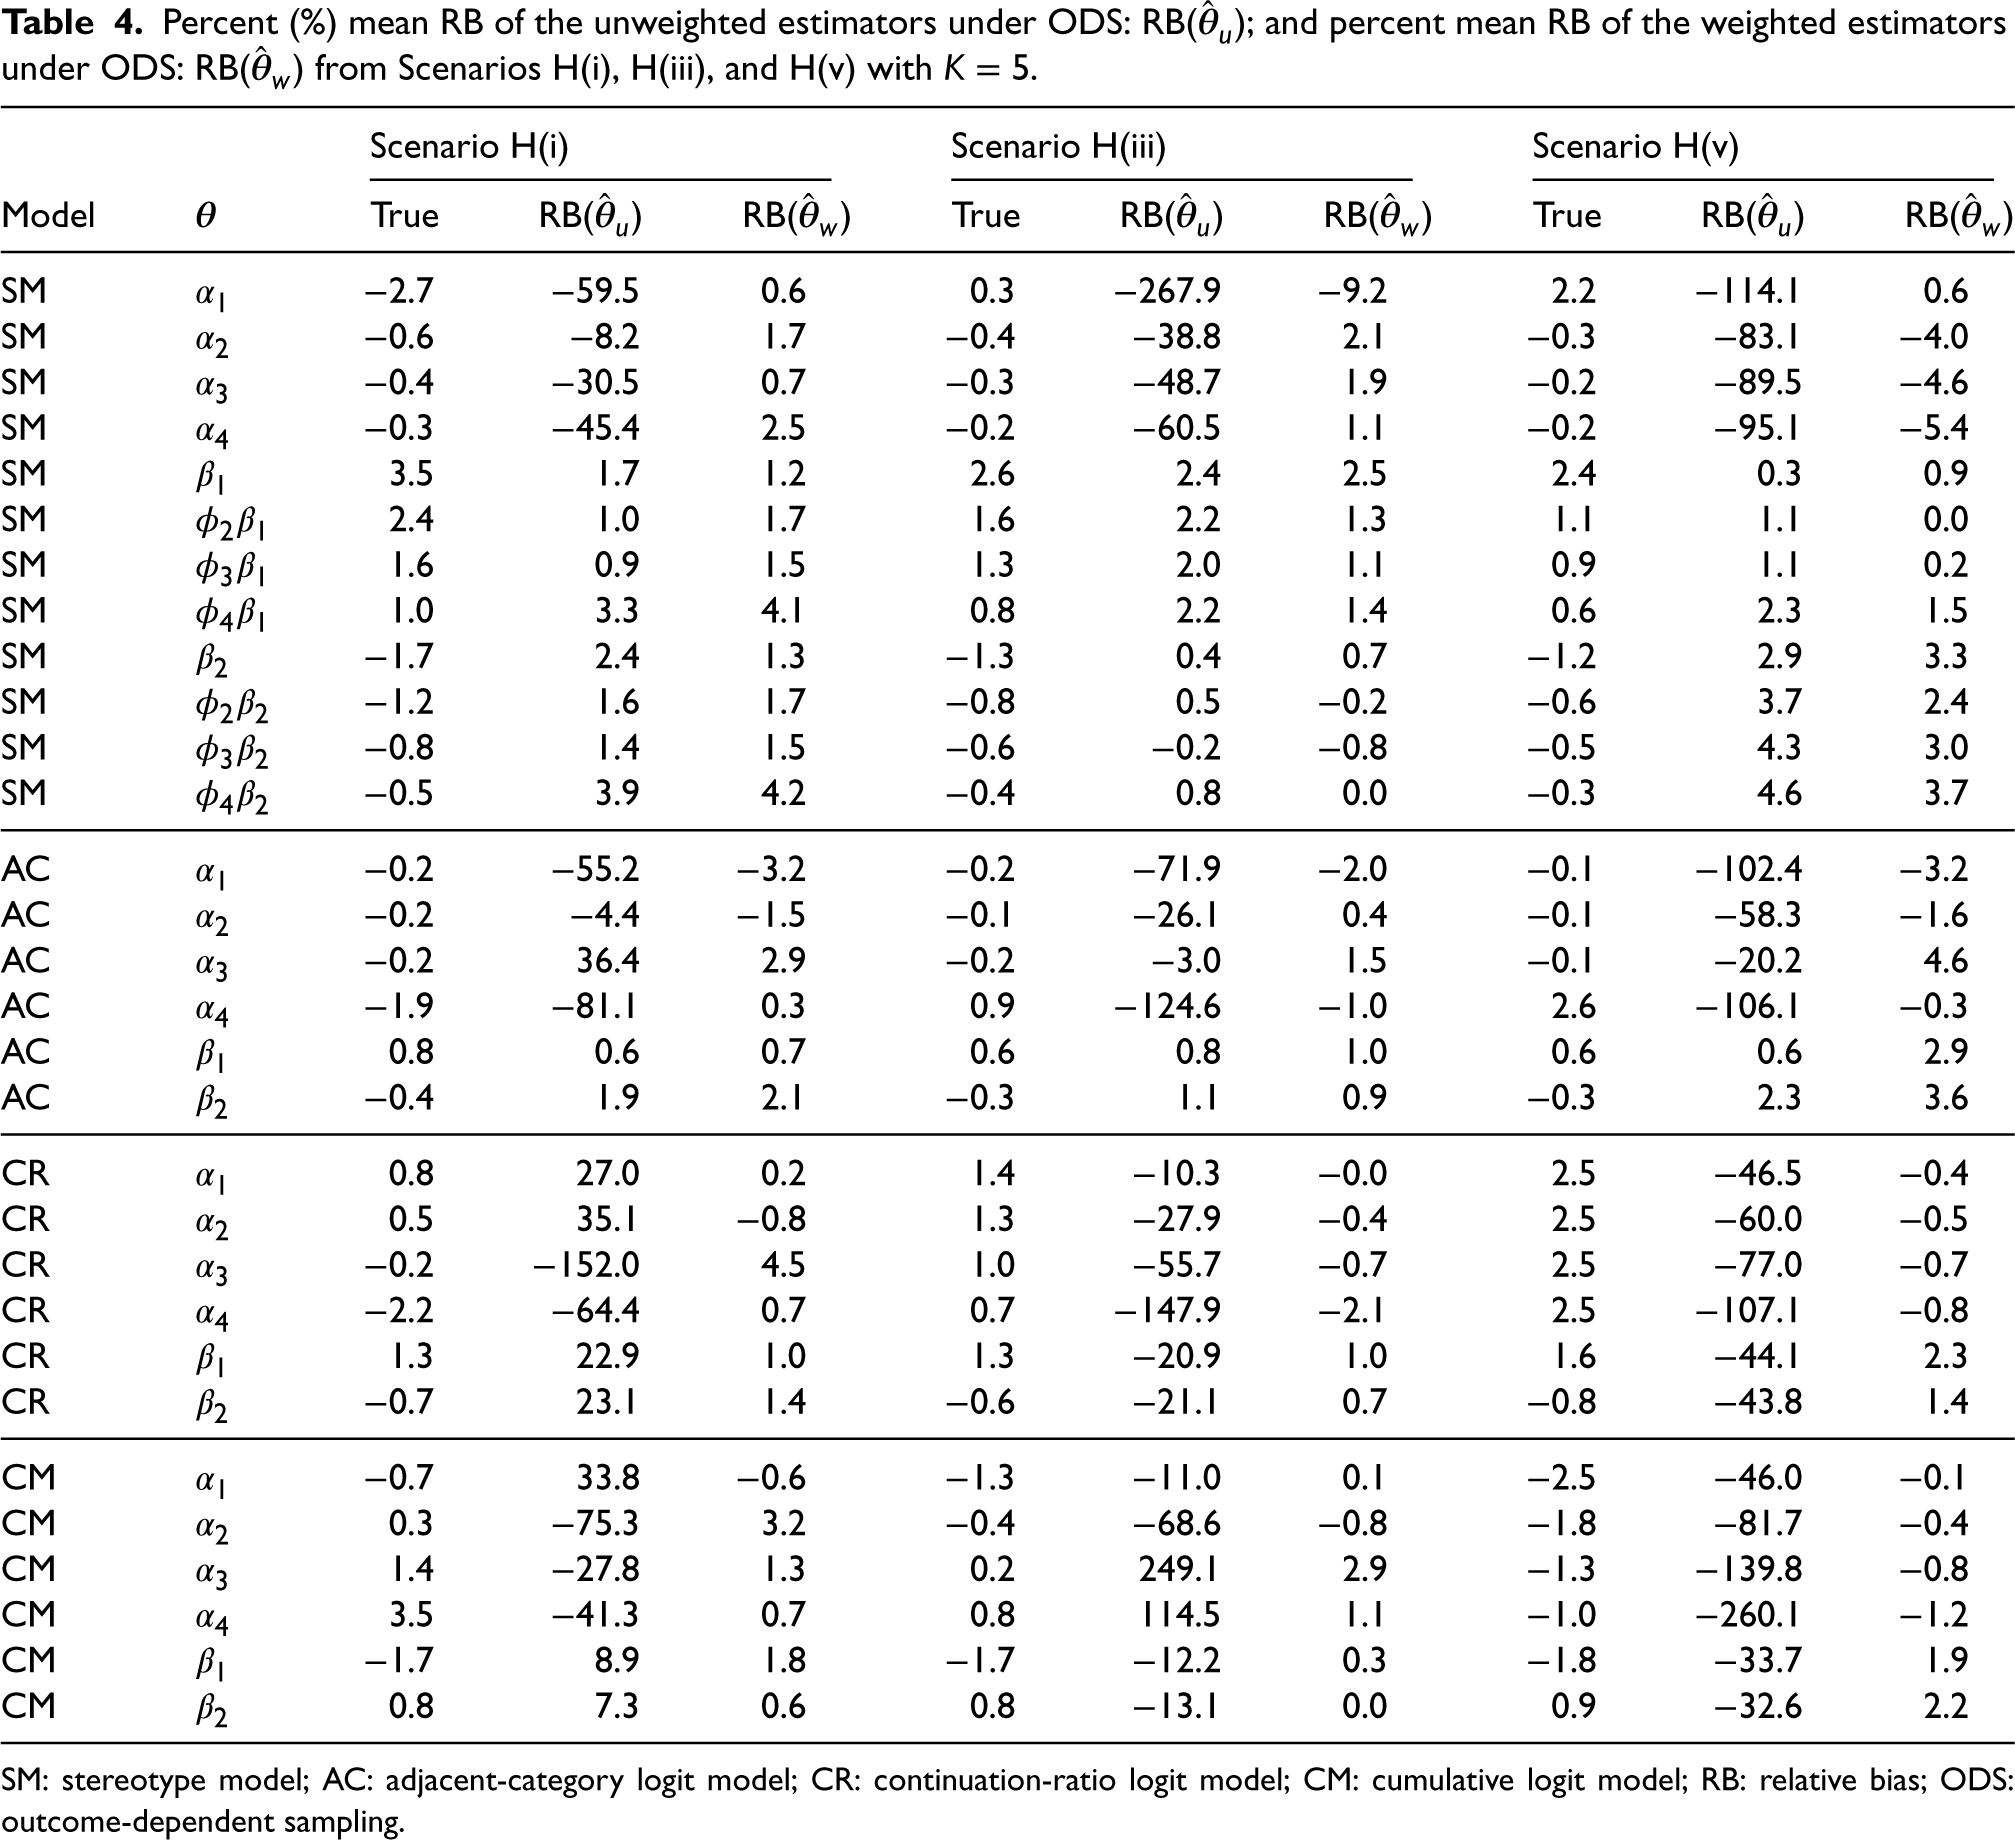
Percent (%) mean RB of the unweighted estimators under ODS: RB(
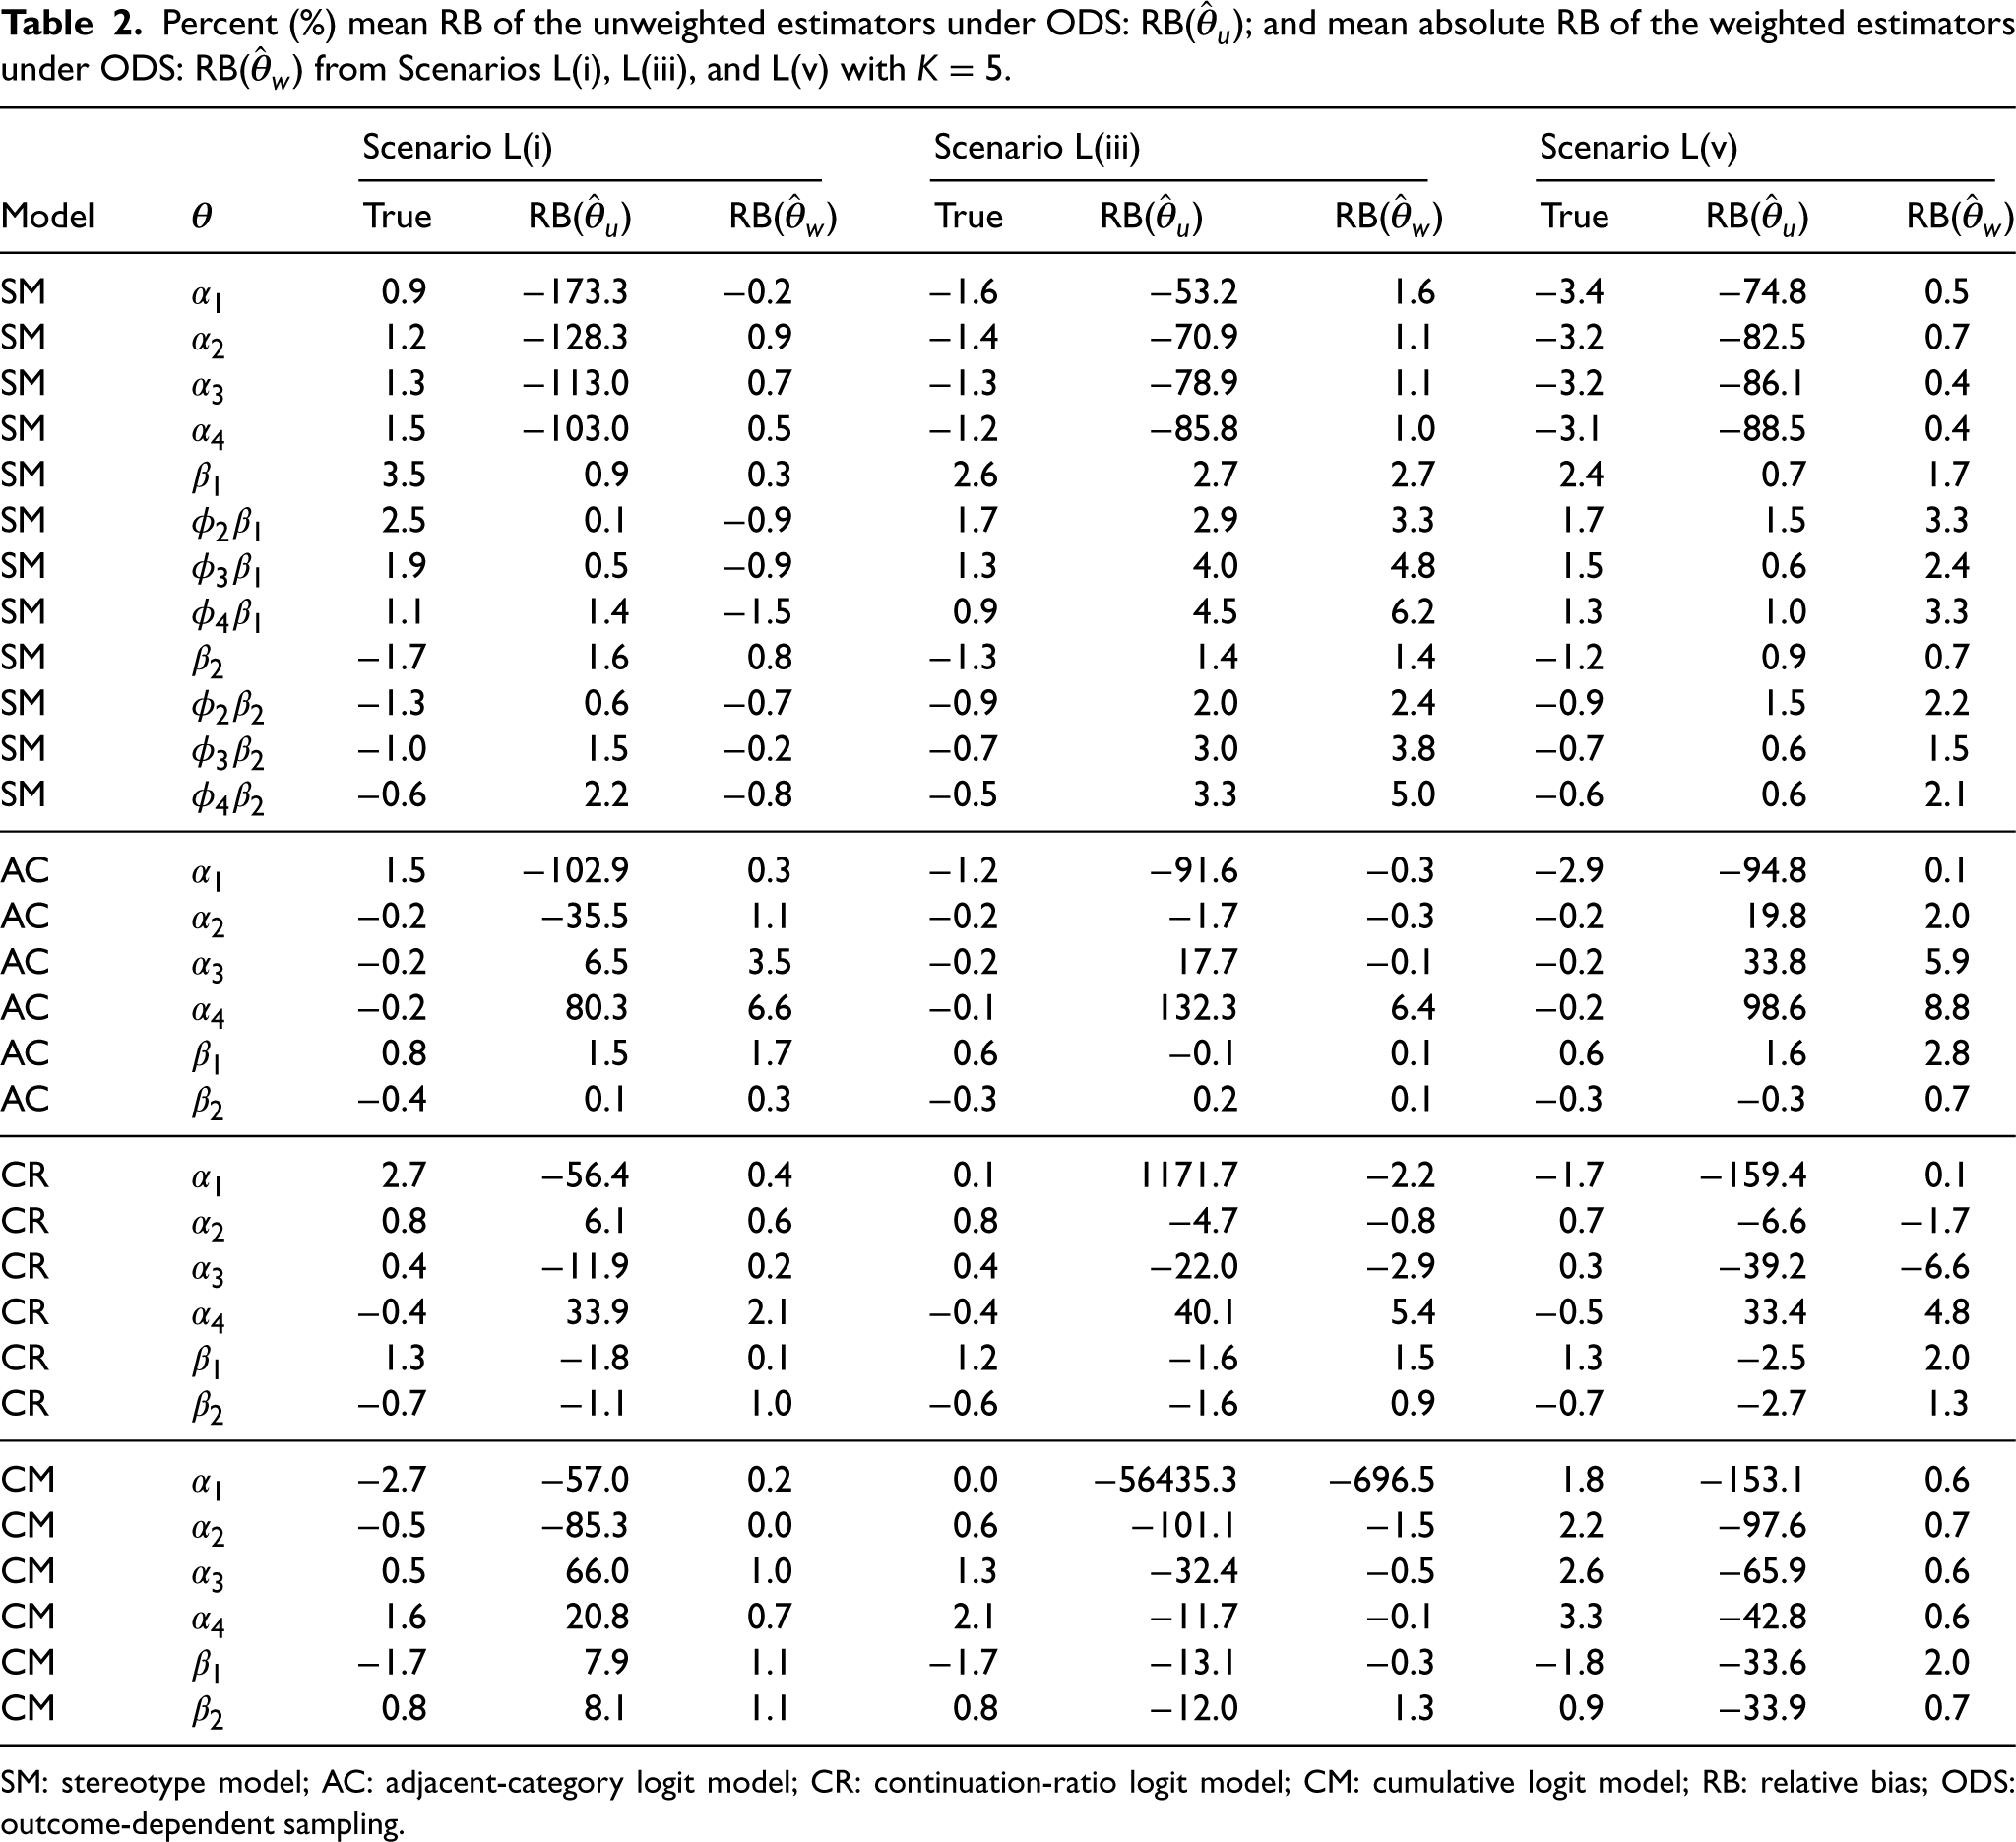
SM: stereotype model; AC: adjacent-category logit model; CR: continuation-ratio logit model; CM: cumulative logit model; RB: relative bias; ODS: outcome-dependent sampling.
Percent (%) mean RB of the unweighted estimators under ODS: RB(
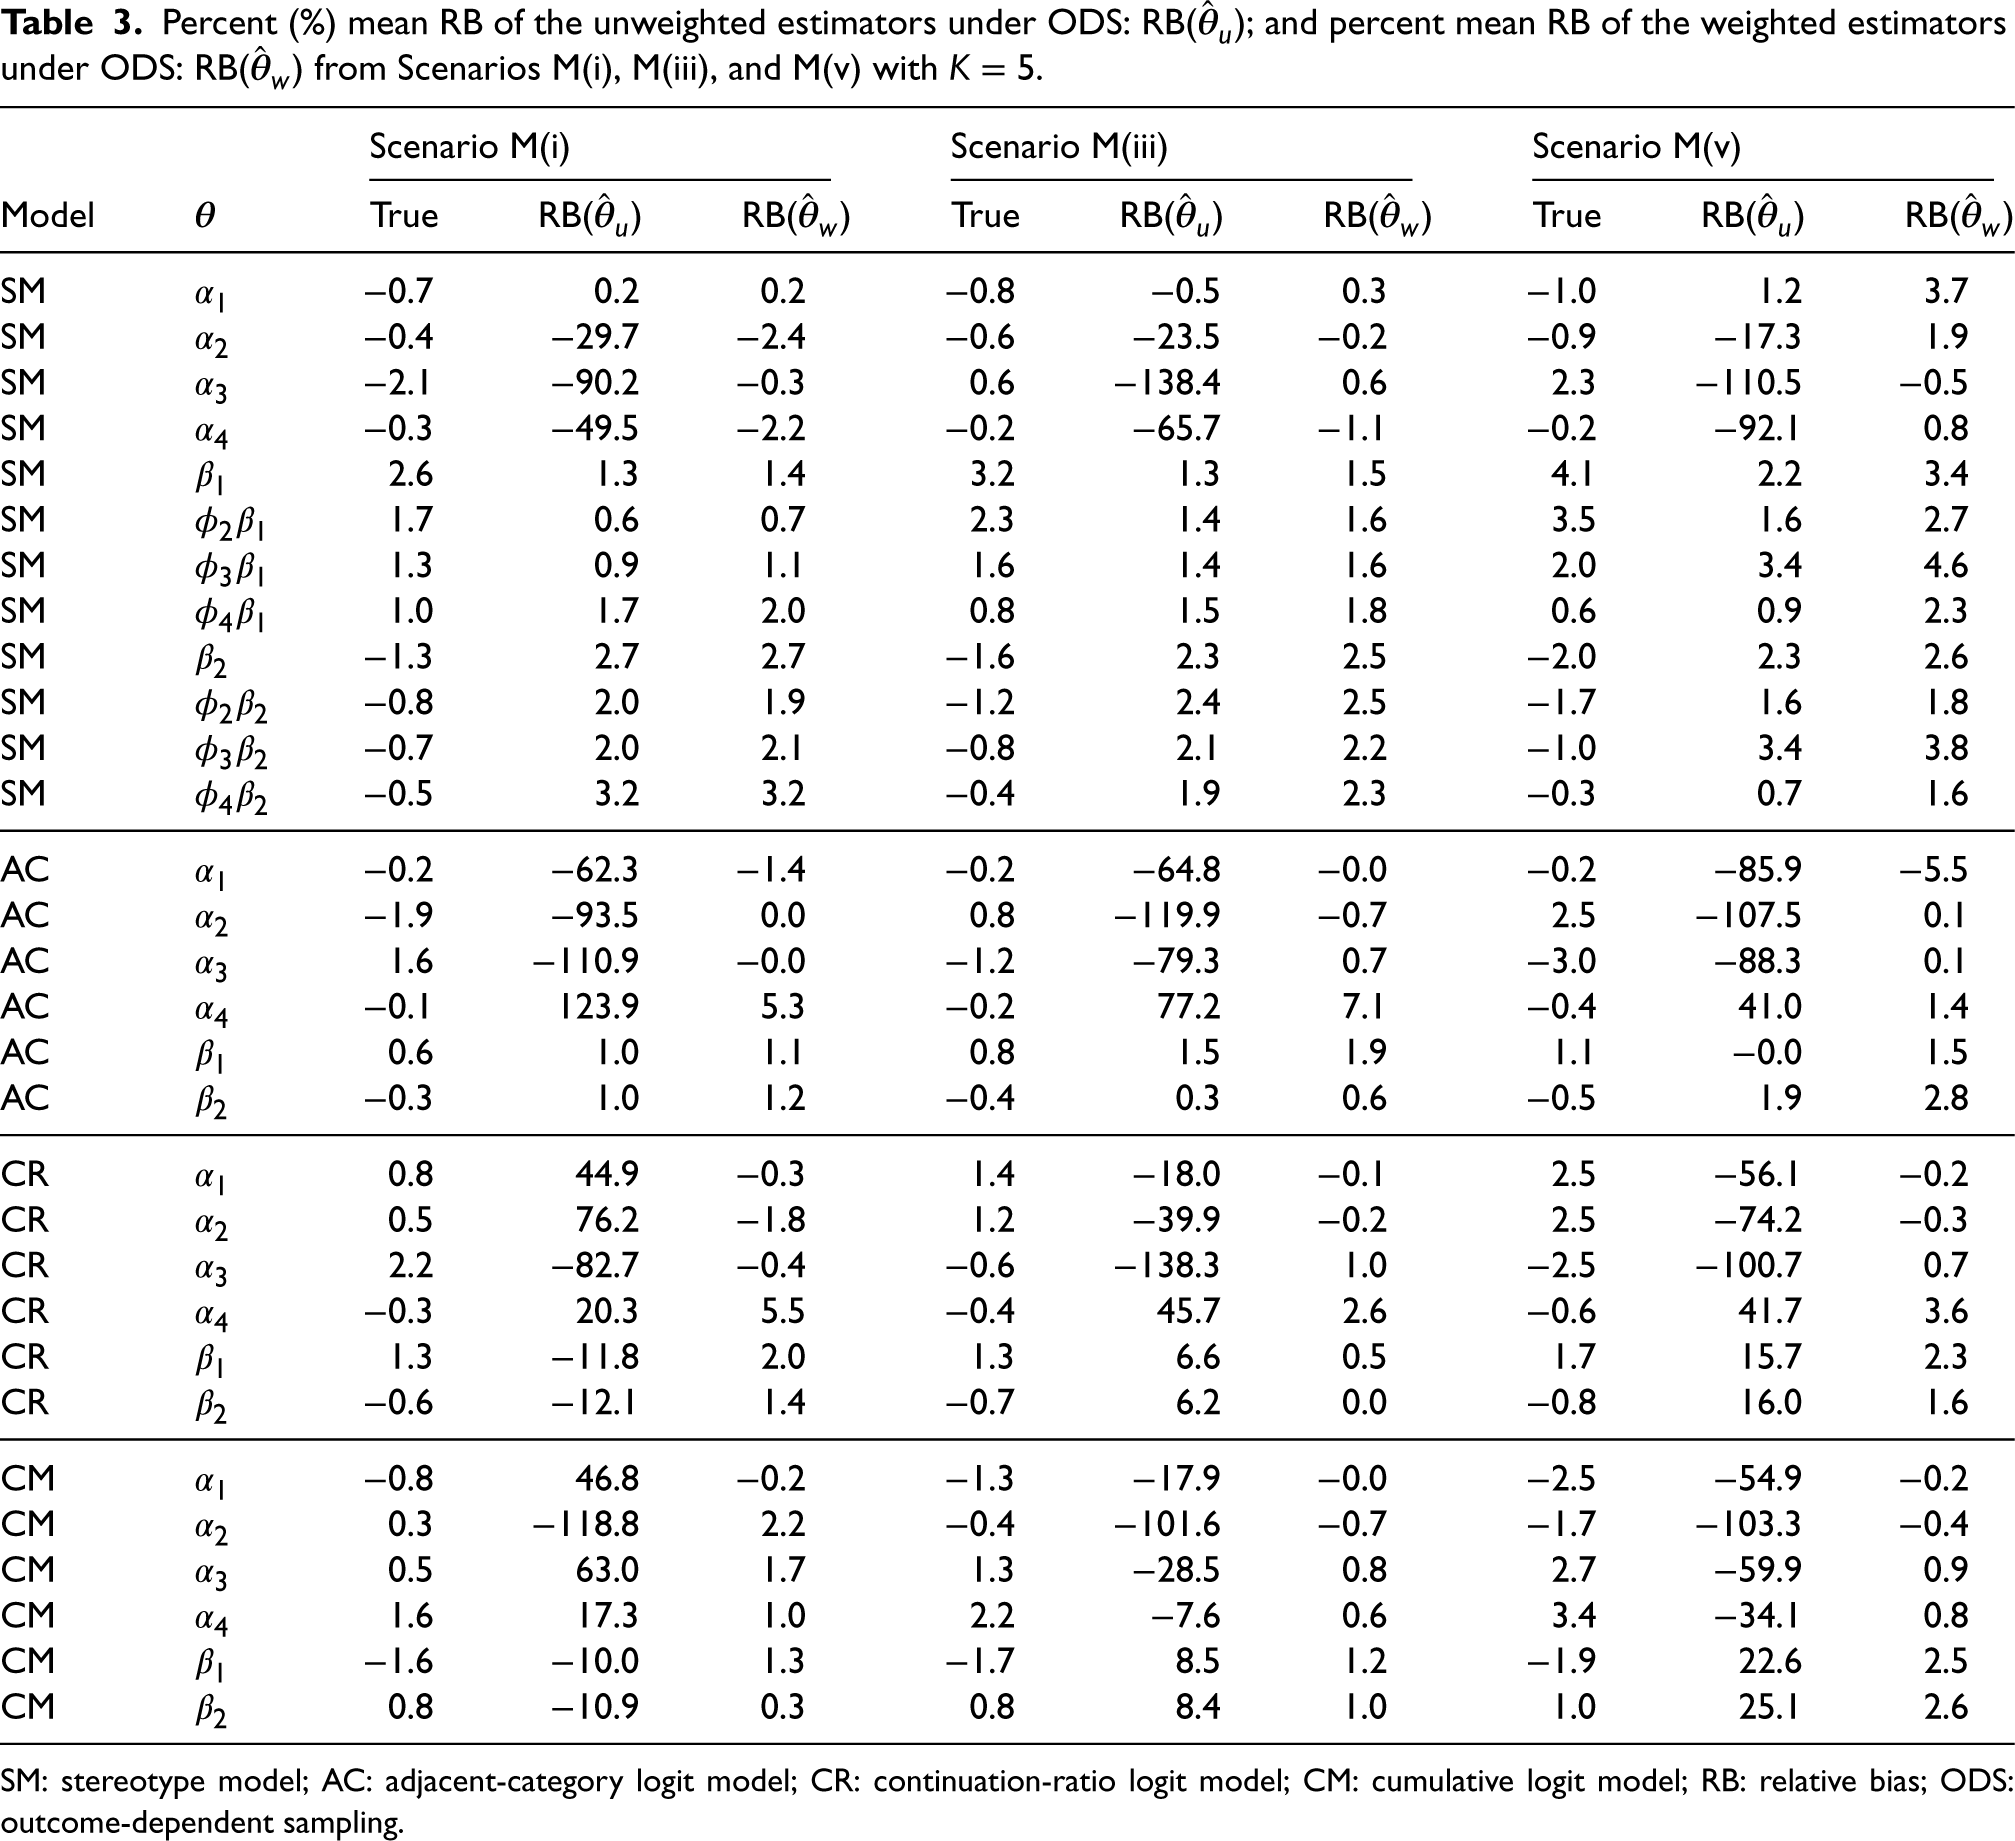
SM: stereotype model; AC: adjacent-category logit model; CR: continuation-ratio logit model; CM: cumulative logit model; RB: relative bias; ODS: outcome-dependent sampling.
Percent (%) mean RB of the unweighted estimators under ODS: RB(
SM: stereotype model; AC: adjacent-category logit model; CR: continuation-ratio logit model; CM: cumulative logit model; RB: relative bias; ODS: outcome-dependent sampling.
Percent (%) RE of model-based standard errors and percent RE of design-based standard errors of weighted models under ODS from Scenarios L(i), L(iii), and L(v) with
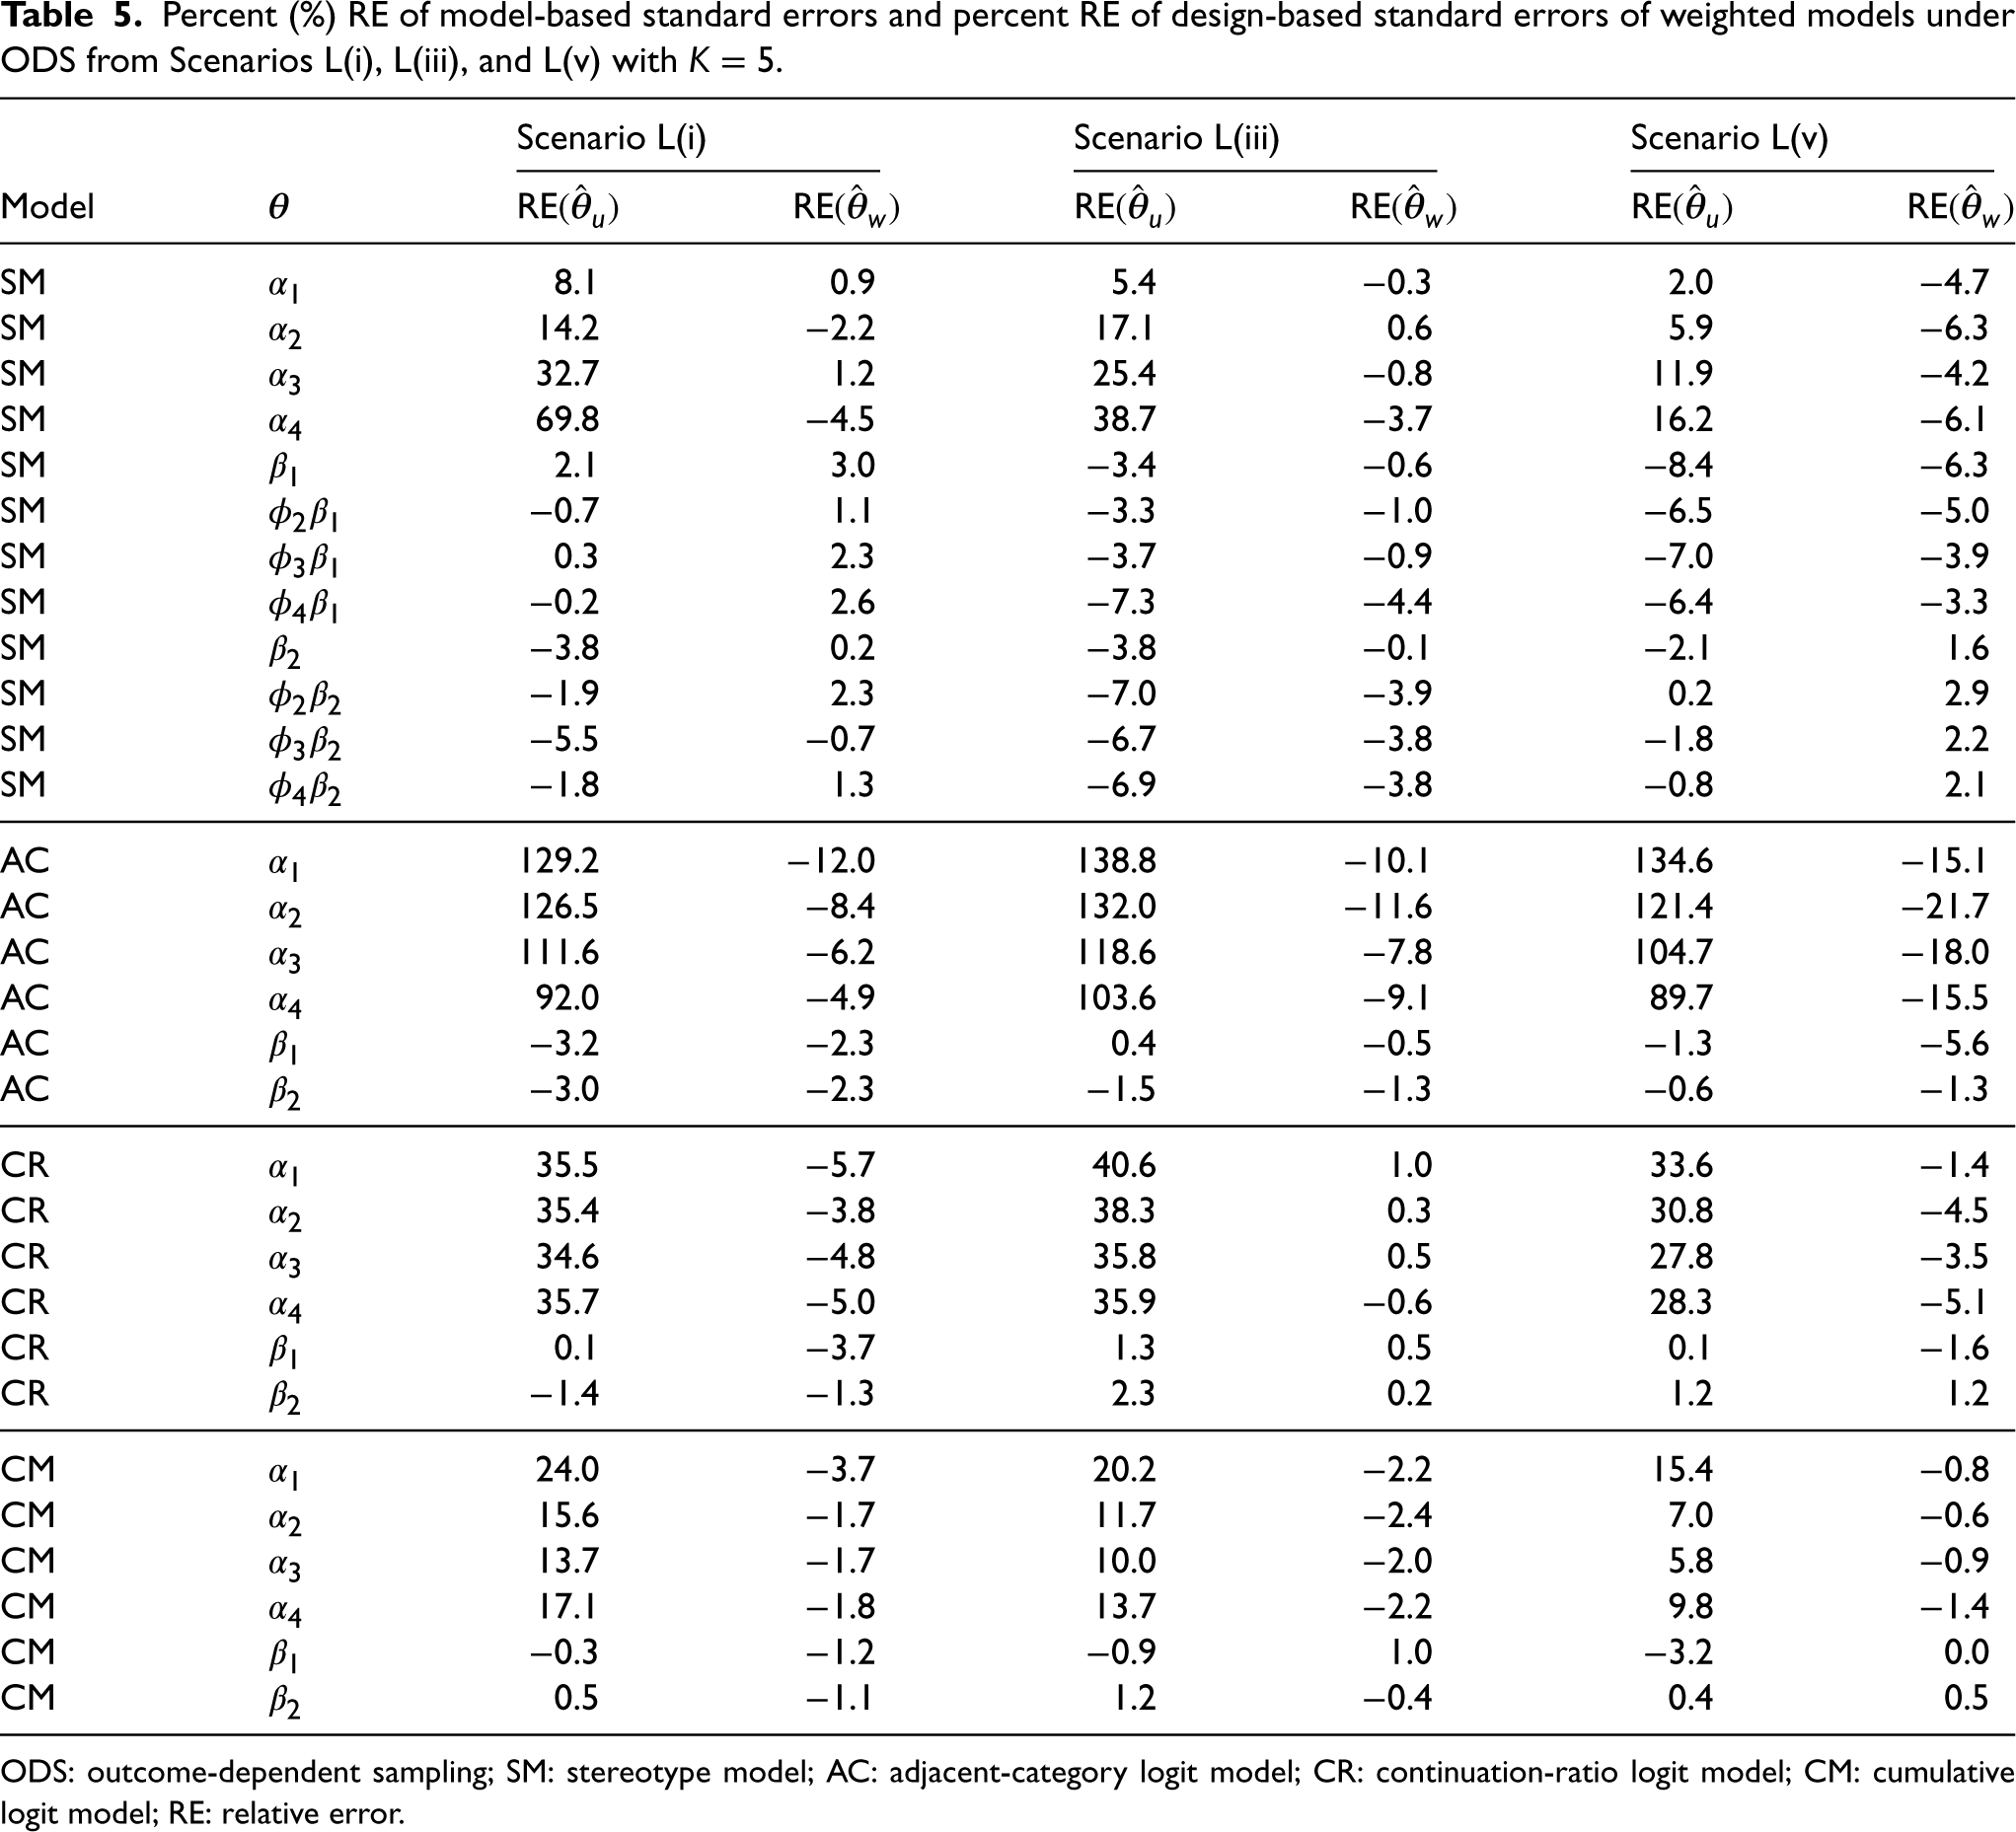
ODS: outcome-dependent sampling; SM: stereotype model; AC: adjacent-category logit model; CR: continuation-ratio logit model; CM: cumulative logit model; RE: relative error.
Percent (%) RE of model-based standard errors and percent RE of design-based standard errors of weighted models under ODS from Scenarios M(i), M(iii), and M(v) with
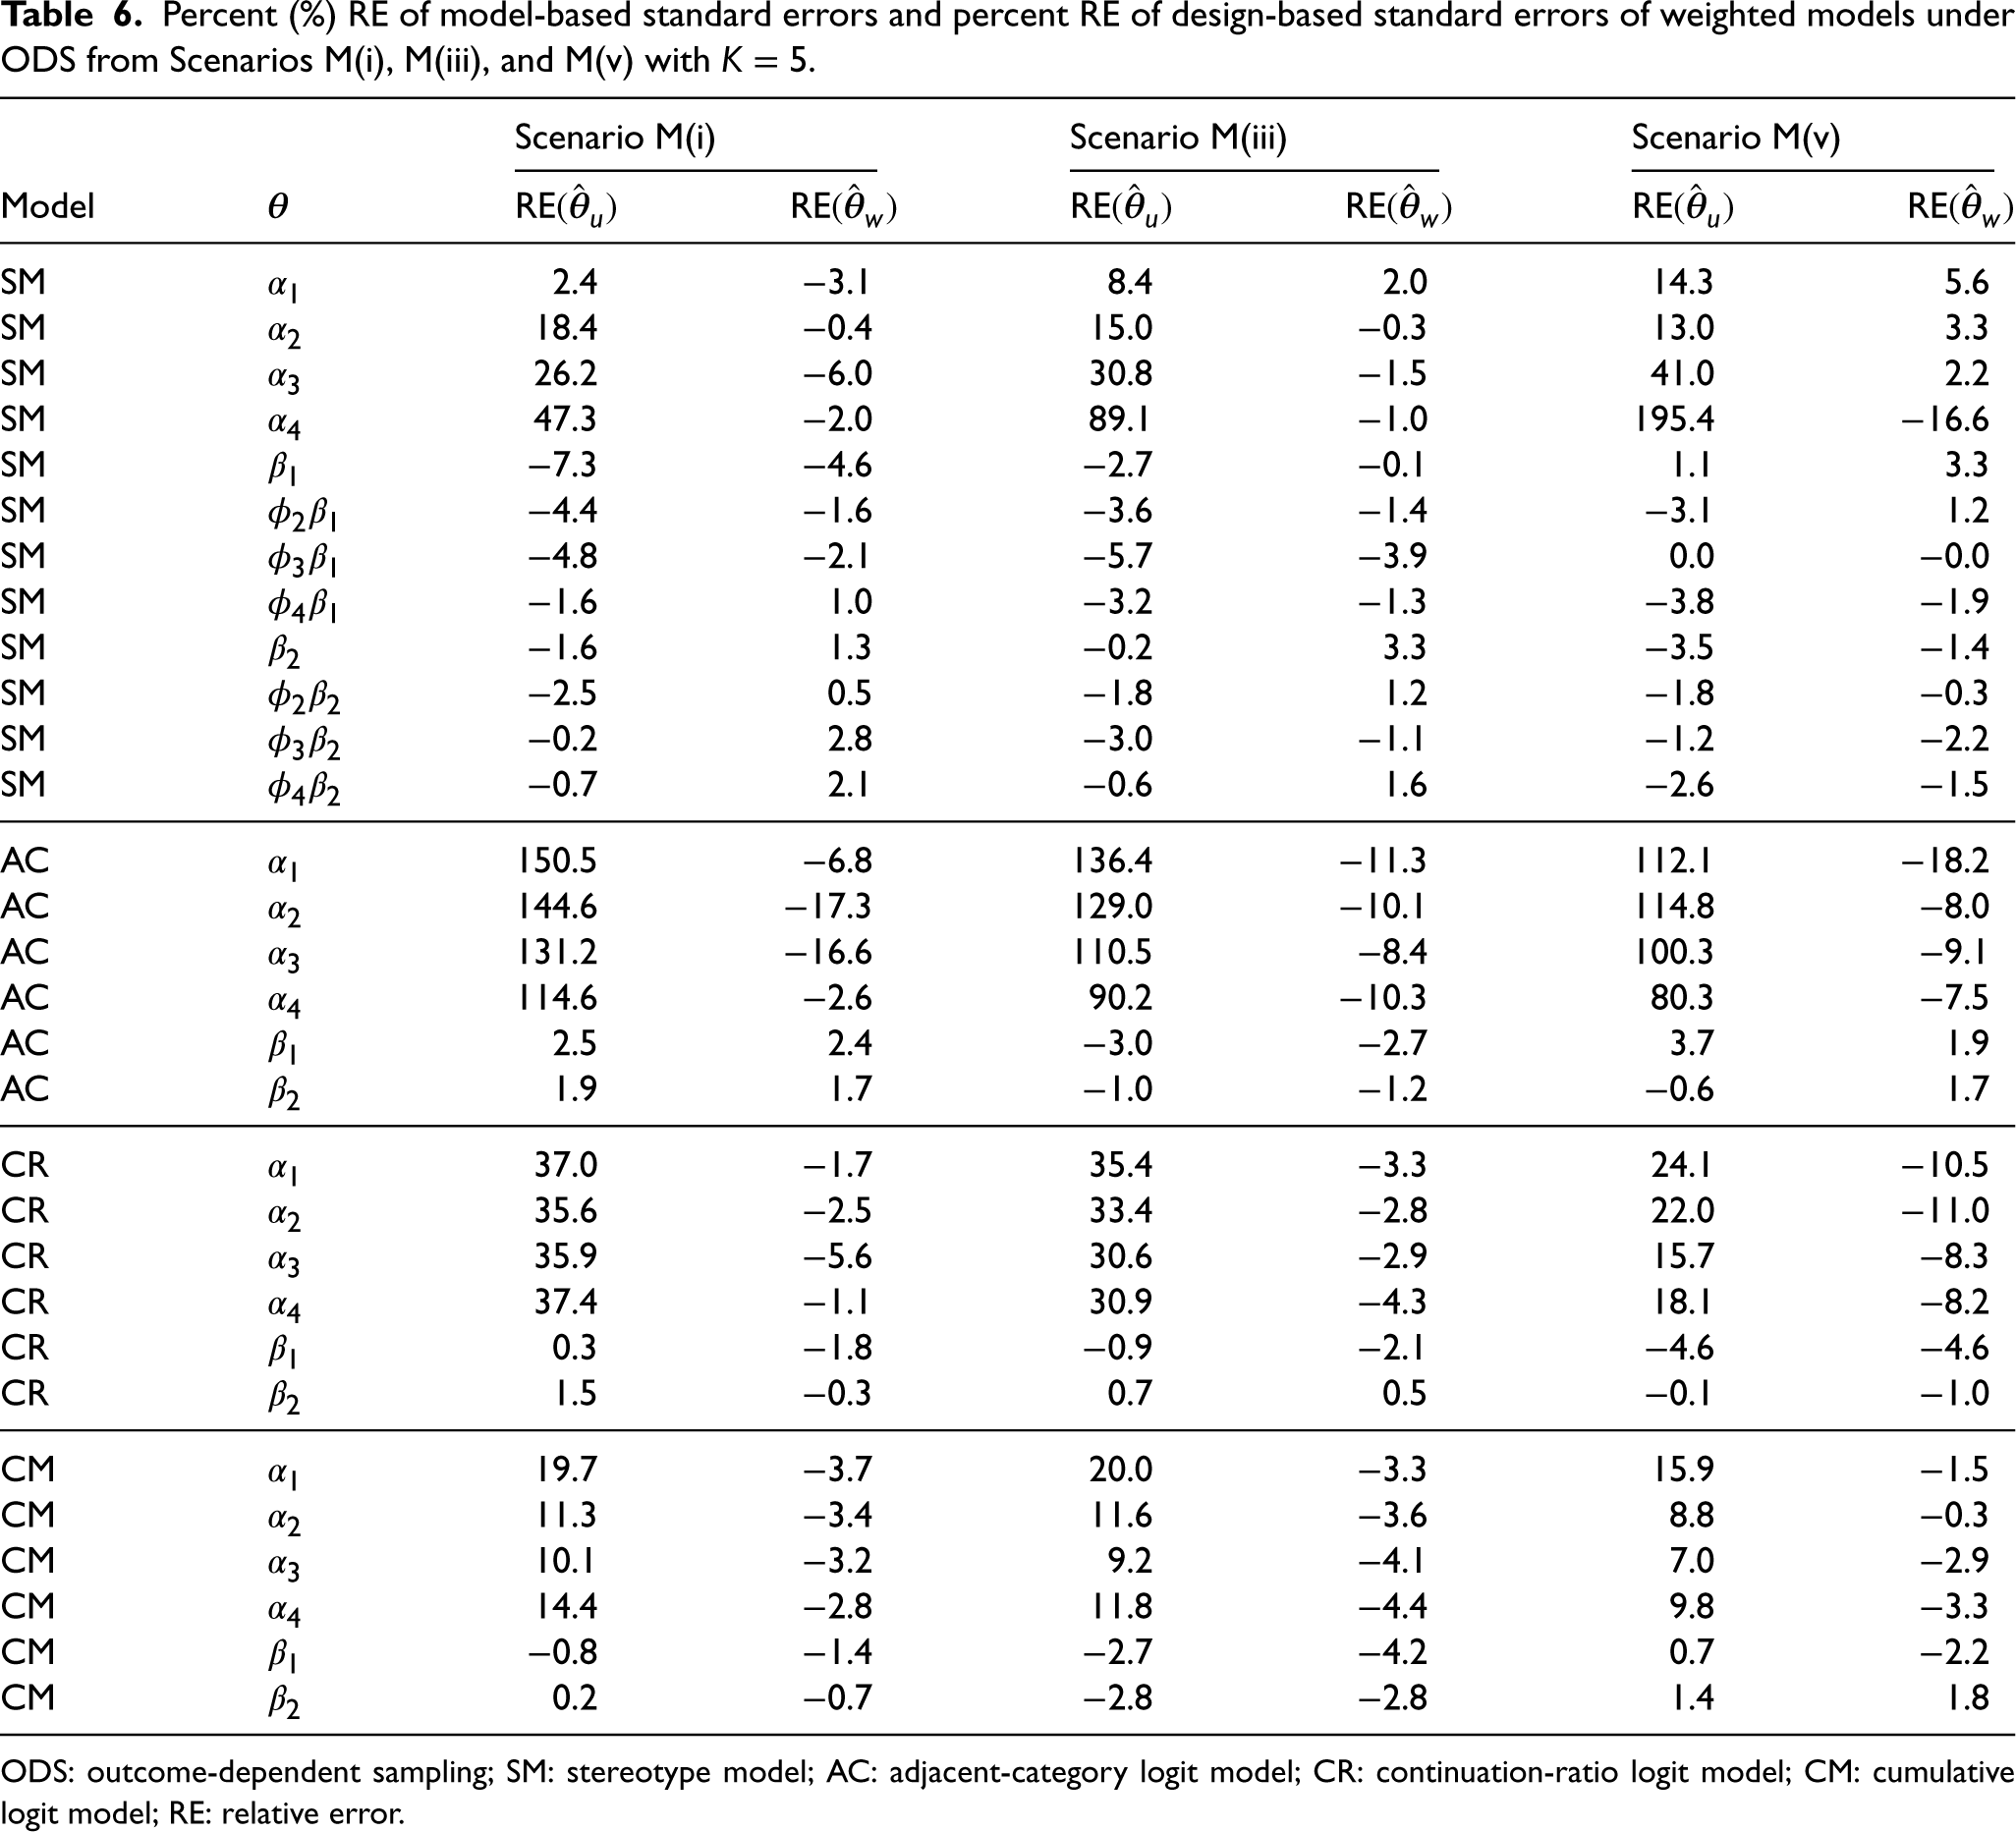
ODS: outcome-dependent sampling; SM: stereotype model; AC: adjacent-category logit model; CR: continuation-ratio logit model; CM: cumulative logit model; RE: relative error.
Percent (%) RE of model-based standard errors and percent RE of design-based standard errors of weighted models under ODS from Scenarios H(i), H(iii), and H(v) with
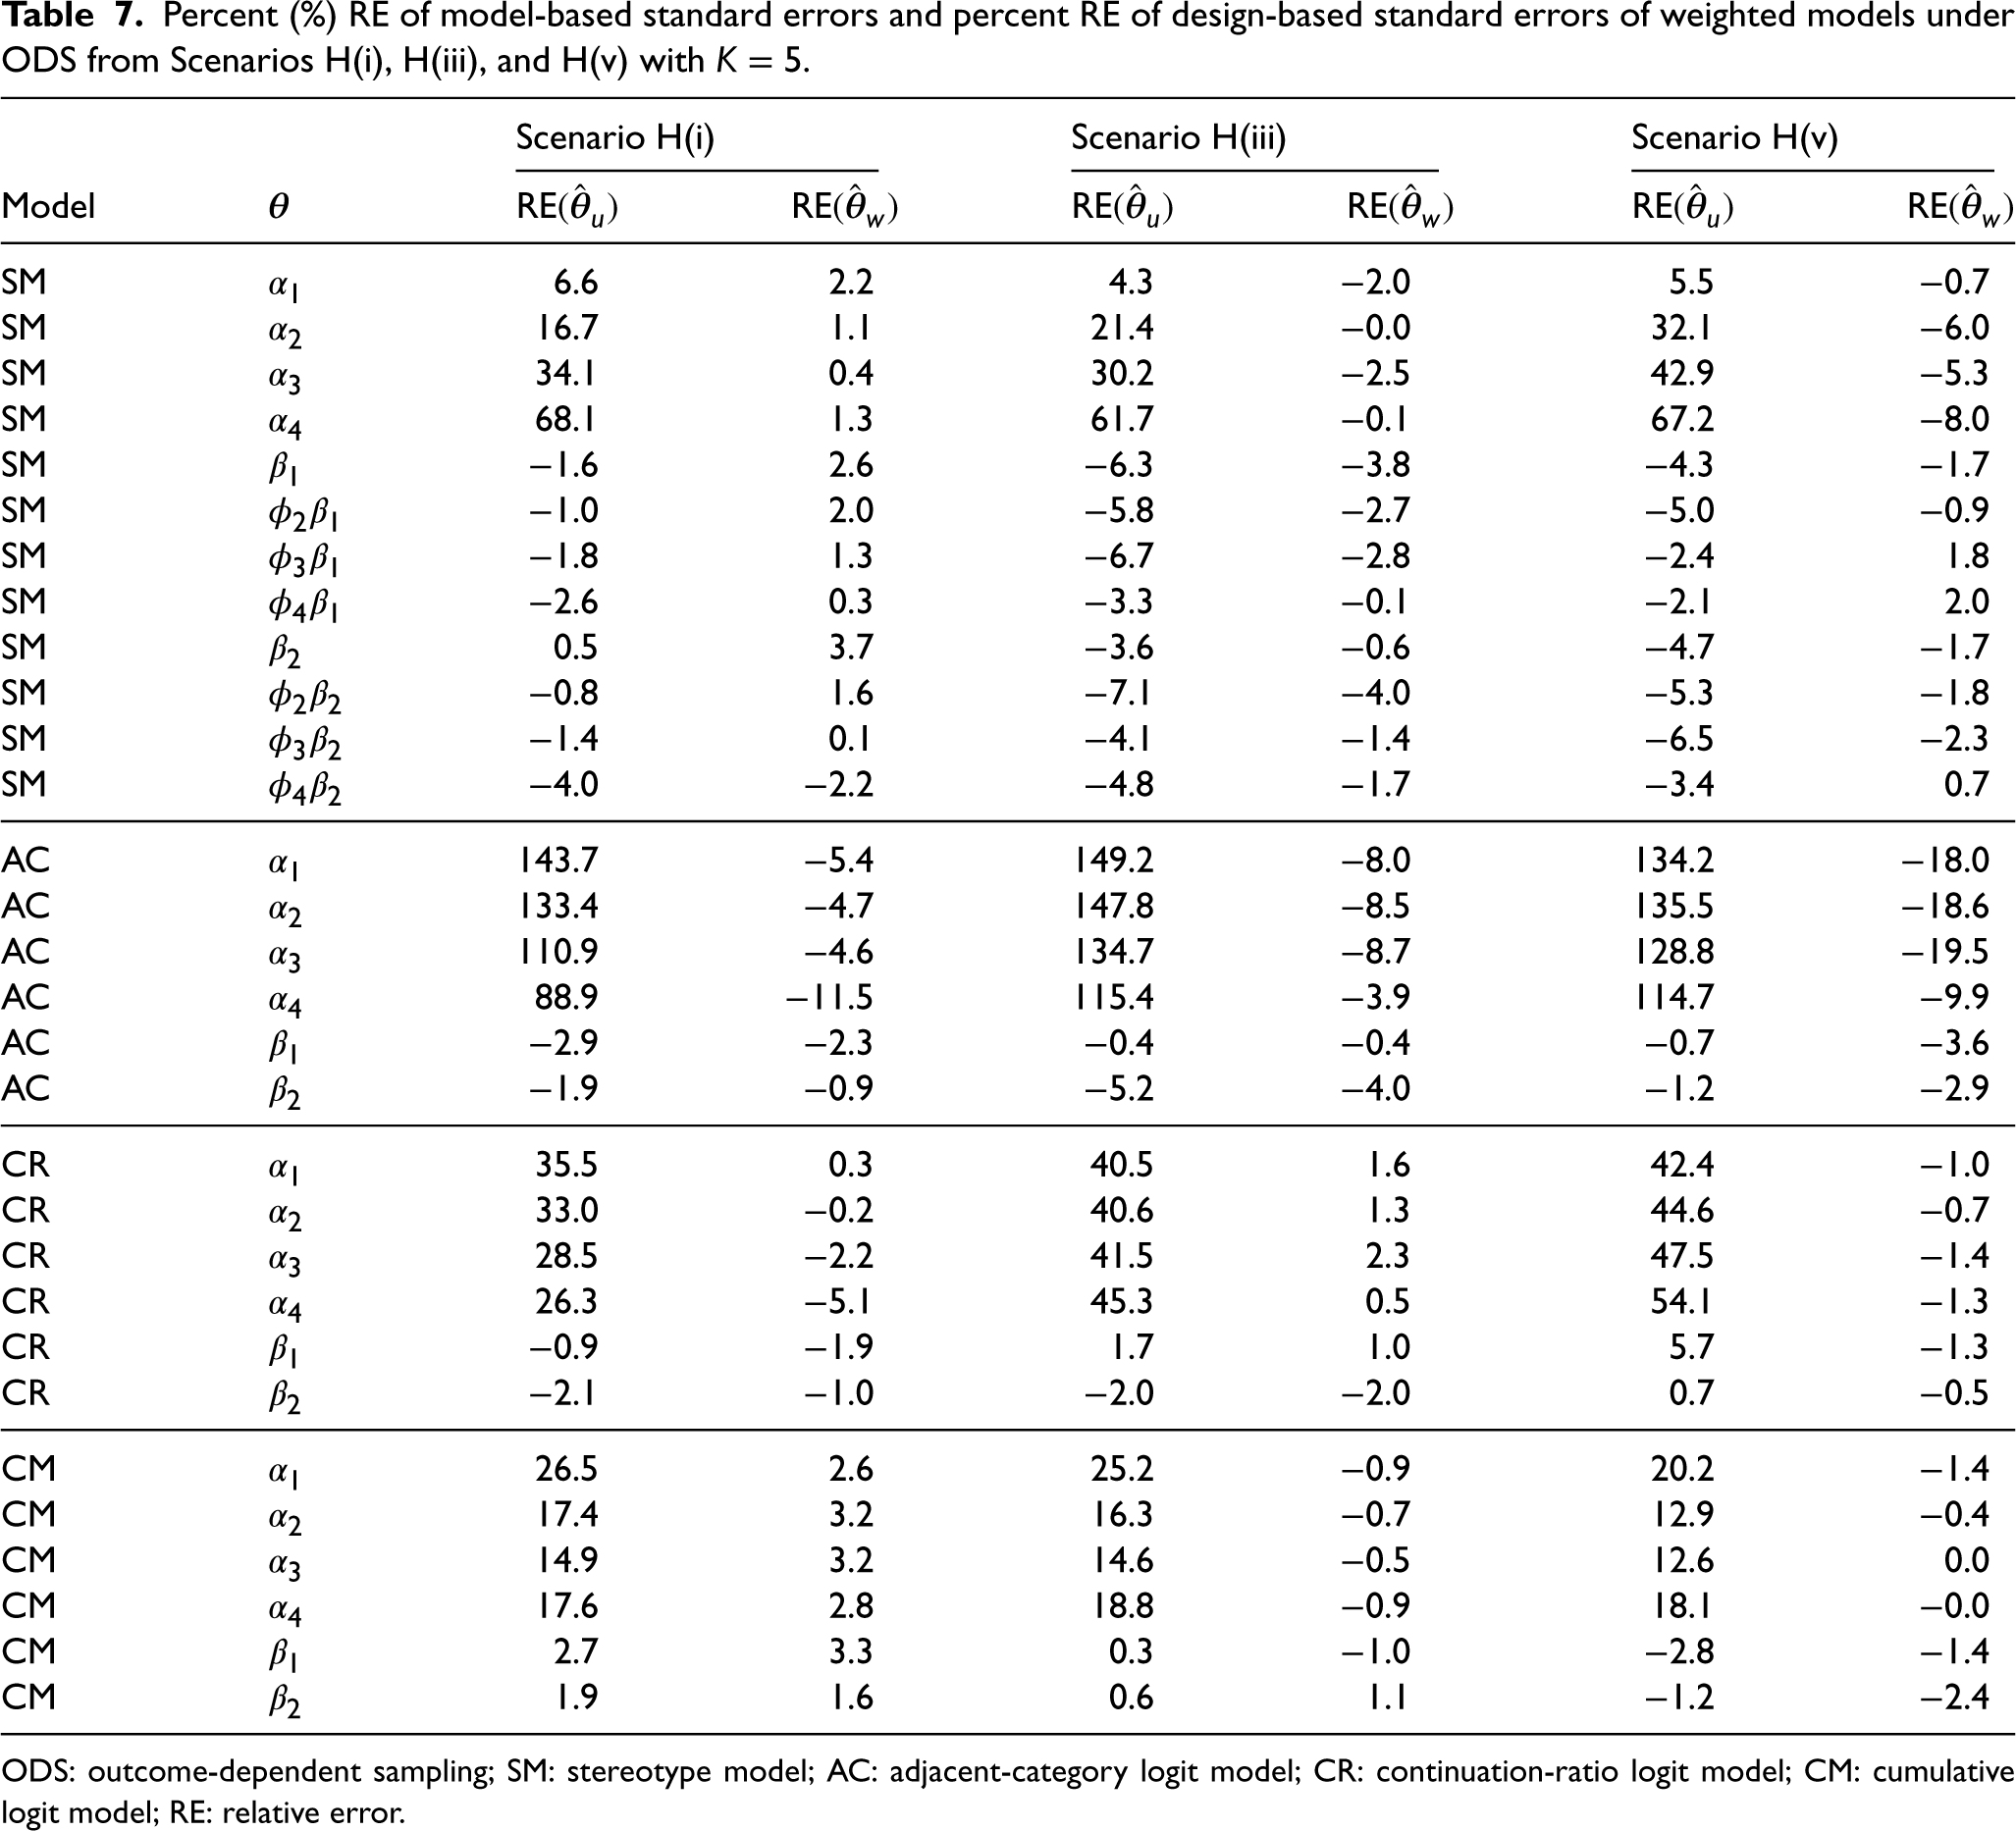
ODS: outcome-dependent sampling; SM: stereotype model; AC: adjacent-category logit model; CR: continuation-ratio logit model; CM: cumulative logit model; RE: relative error.
Table 2 shows the percent mean relative biases, RB(
Also as expected, unweighted AC produced
Table 3 shows the equivalent for Scenarios M(i), M(iii), and M(v). We observed a similar pattern where unweighted SM and AC produced unbiased or low-biased log odds estimates but produced biased intercept estimates, and weighted models produced similarly unbiased or low-biased log odds estimates and unbiased intercept estimates. On the other hand, the RB of the log odds estimates in the unweighted CR was much larger compared to those in the L scenario. The unweighted CM also produced log odds estimates with similarly large RB, which was also observed in the L scenarios. In both models, the weighted log odds estimates had negligible RB. Table 4 shows the equivalent for Scenarios H(i), H(iii), and H(v). Similar patterns were observed in all models. However, compared to the other scenarios, the unweighted CR produced log odds estimates with the largest RB in this scenario.
Table 5 shows
Figure 1 shows the RRMSE of
We illustrated the use of different models for ordinal outcomes with data from a study of knee osteoarthritis (OA), a chronic debilitating disease that affects an estimated 654.1 million people aged 40 and older worldwide. 27 Currently, there is no cure for OA and existing treatments may be inadequate for a significant portion of participants who have to cope with long-lasting pain. Thus, identifying risk factors and biomarkers is necessary to develop preventive strategies and treatment options in the early stages of the disease. In knee OA, the KL radiographic grade is commonly used to determine the severity of the disease. The KL grade ranges from 0 to 4, where grade 0 indicates the absence of OAs and grade 4 indicates the most severe OA condition. 28
The OA initiative (OAI) is a multicenter cohort study started in 2002 designed to identify risk factors for knee OA. A total of 4796 participants aged 45–79 years were recruited into one of three subcohorts: progression (
As part of the OAI, a comprehensive questionnaire was collected along with imaging and biospecimen data from consenting participants with a maximum of seven visits (yearly from years 0 to 4 and every 2 years thereafter) over a span of
We focused on modeling the association between the five-category KL grade (
Distribution of variables of interest separated by full, progression, and incidence cohorts from the longitudinal study of knee osteoarthritis. Categorical variables are reported by their counts (percentages) whereas continuous variables are reported by their mean (sd) and median (range), as indicated.
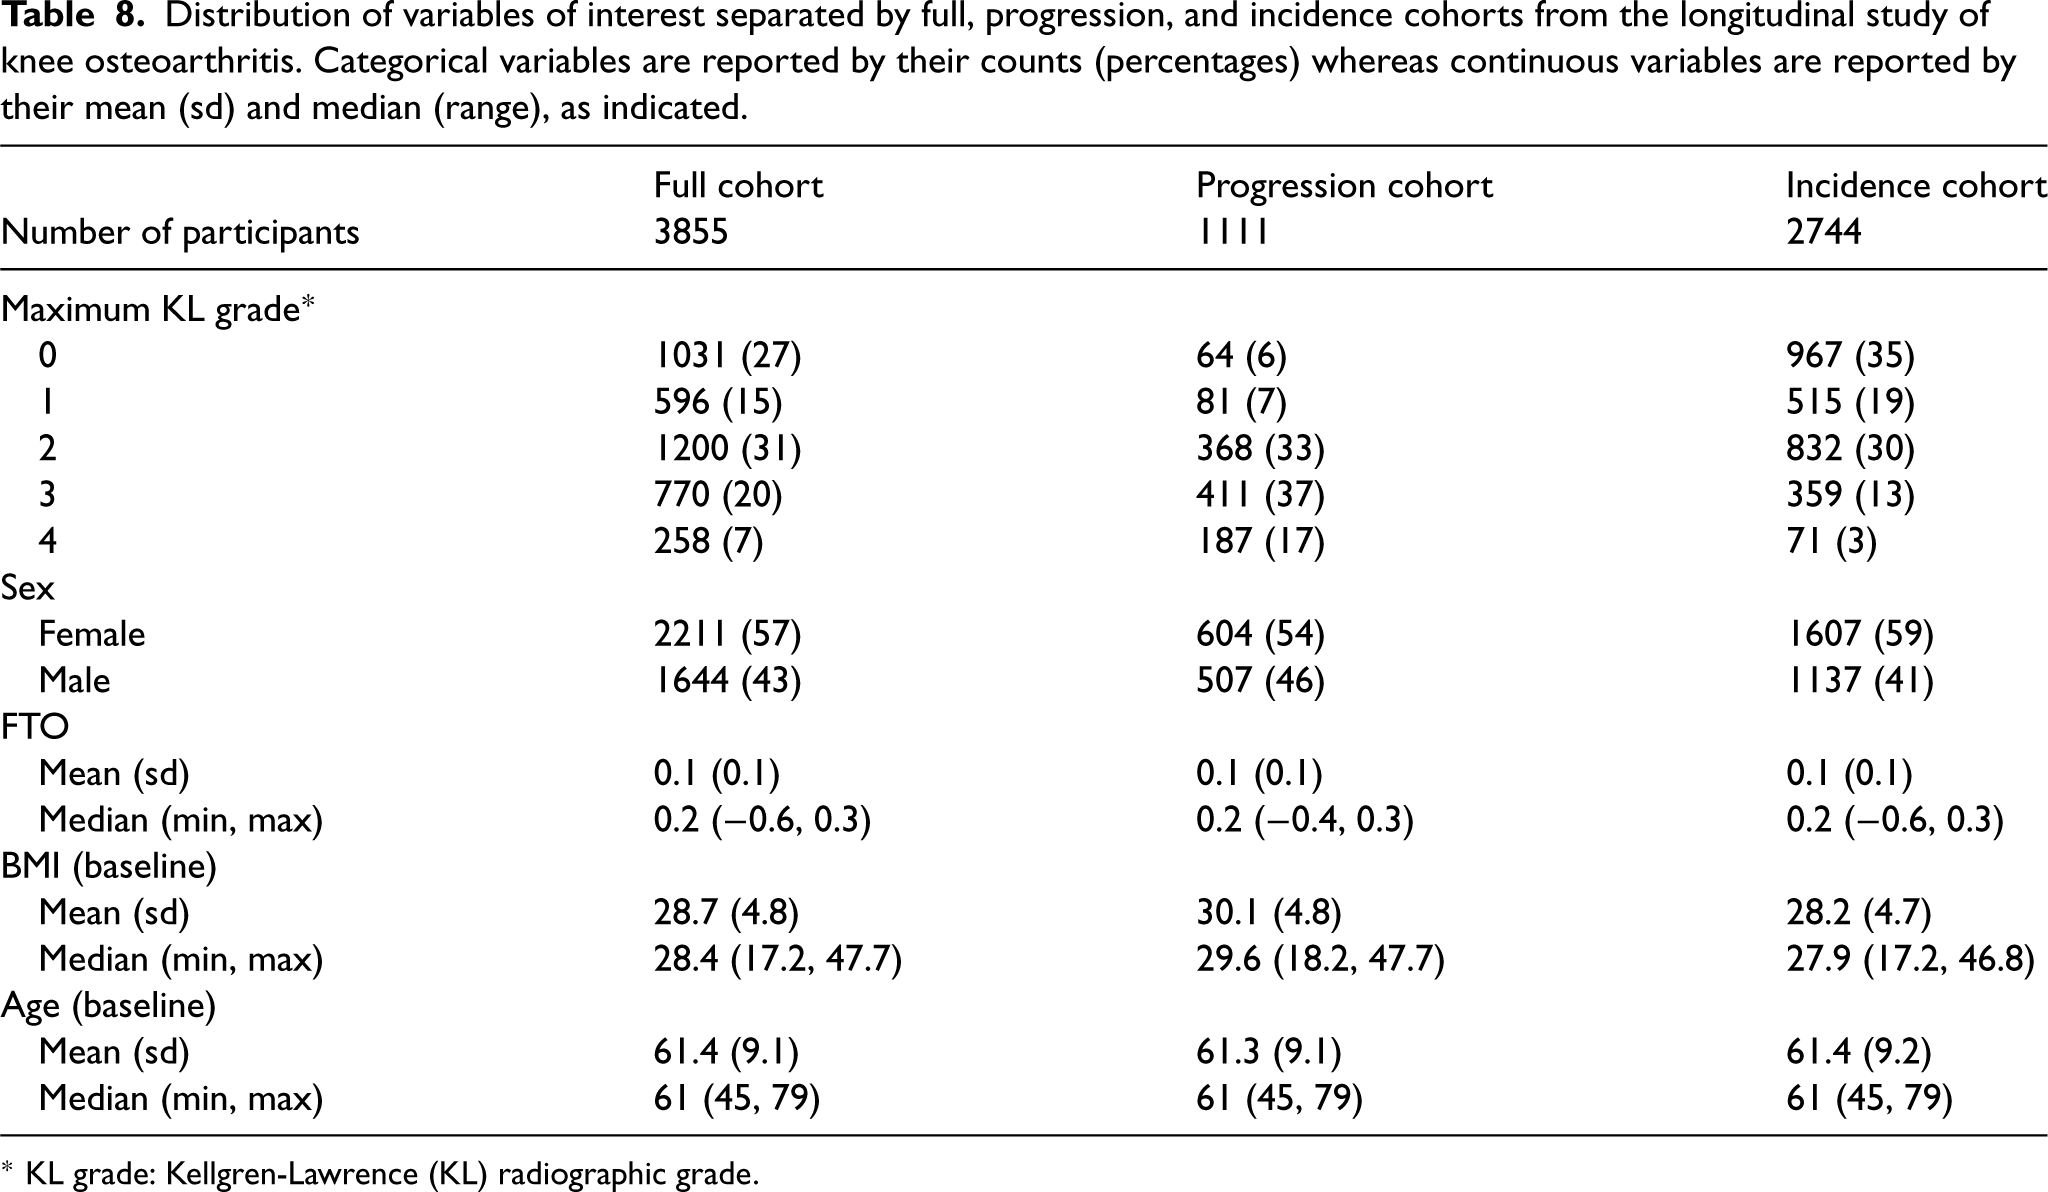
Distribution of variables of interest separated by full, progression, and incidence cohorts from the longitudinal study of knee osteoarthritis. Categorical variables are reported by their counts (percentages) whereas continuous variables are reported by their mean (sd) and median (range), as indicated.
* KL grade: Kellgren-Lawrence (KL) radiographic grade.
Percent RB, Rel eff, and RRMSE of the log odds of FTO predicted expression on the KL grade estimated with unweighted and weighted models across 200 ODS samples compared to full cohort from the study of knee osteoarthritis.
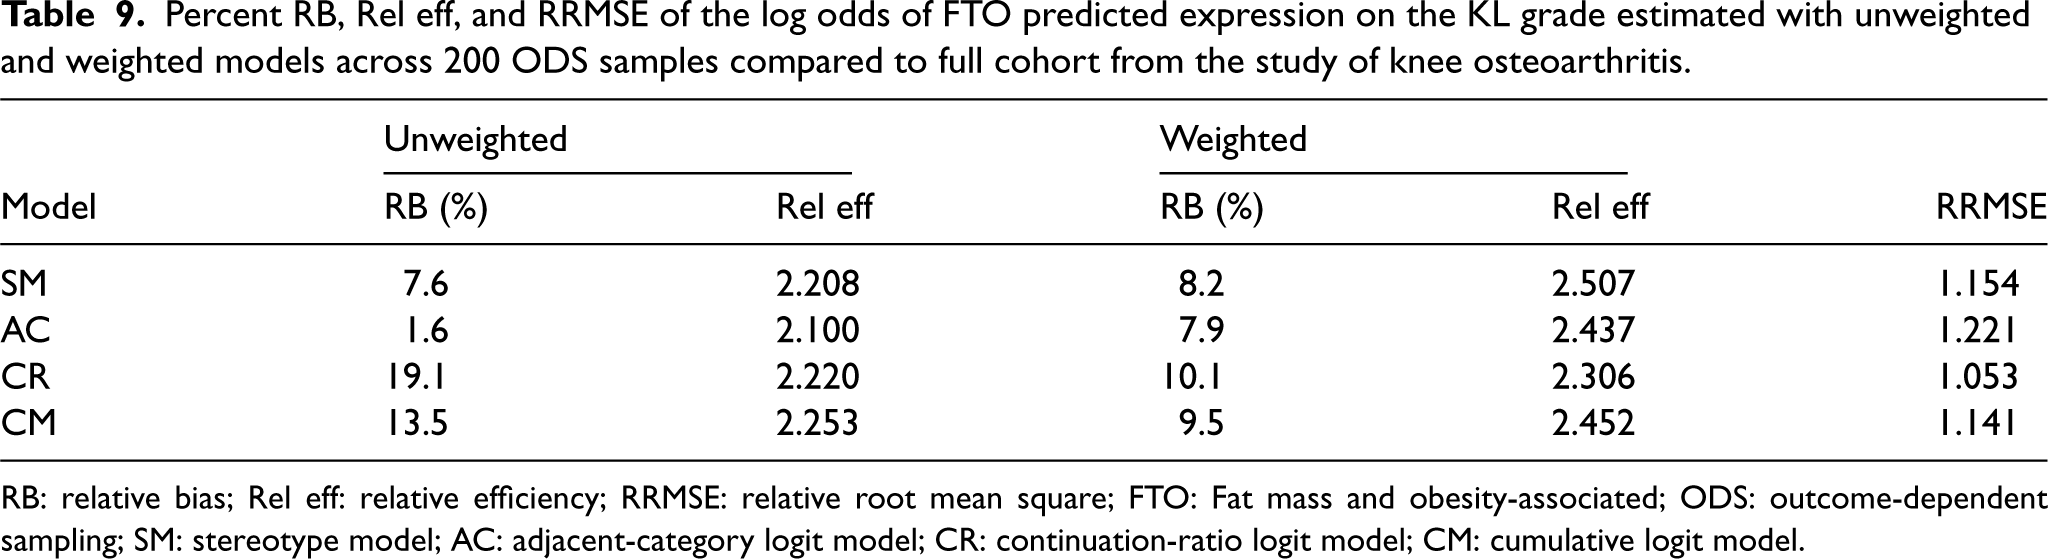
RB: relative bias; Rel eff: relative efficiency; RRMSE: relative root mean square; FTO: Fat mass and obesity-associated; ODS: outcome-dependent sampling; SM: stereotype model; AC: adjacent-category logit model; CR: continuation-ratio logit model; CM: cumulative logit model.
Consistent with the results of our simulation study, the results of the case study showed that the unweighted SM and AC models produced less biased estimates compared to the unweighted CM and CR models. With weights, these relative biases were more comparable across all models, with slightly smaller bias in the weighted SM and AC models. The relative efficiencies of the weighted estimates were higher than those of the unweighted estimates for all models. Lastly, the RRMSE values were 1.154 for SM, 1.221 for AC, 1.141 for CM, and 1.053 for CR, suggesting that the weighted estimates were less efficient than the unweighted ones (Table 9).
The interpretation of these log odds estimates depends on the model. Table 10 shows the parameter estimates from the four ordinal regression models fitted to the full data and one ODS data. For example, based on weighted SM, the log odds ratio (SE) of observing
Parameter estimates and SE estimates from the full data and ODS data with unweighted and weighted models applied to the study of knee osteoarthritis.
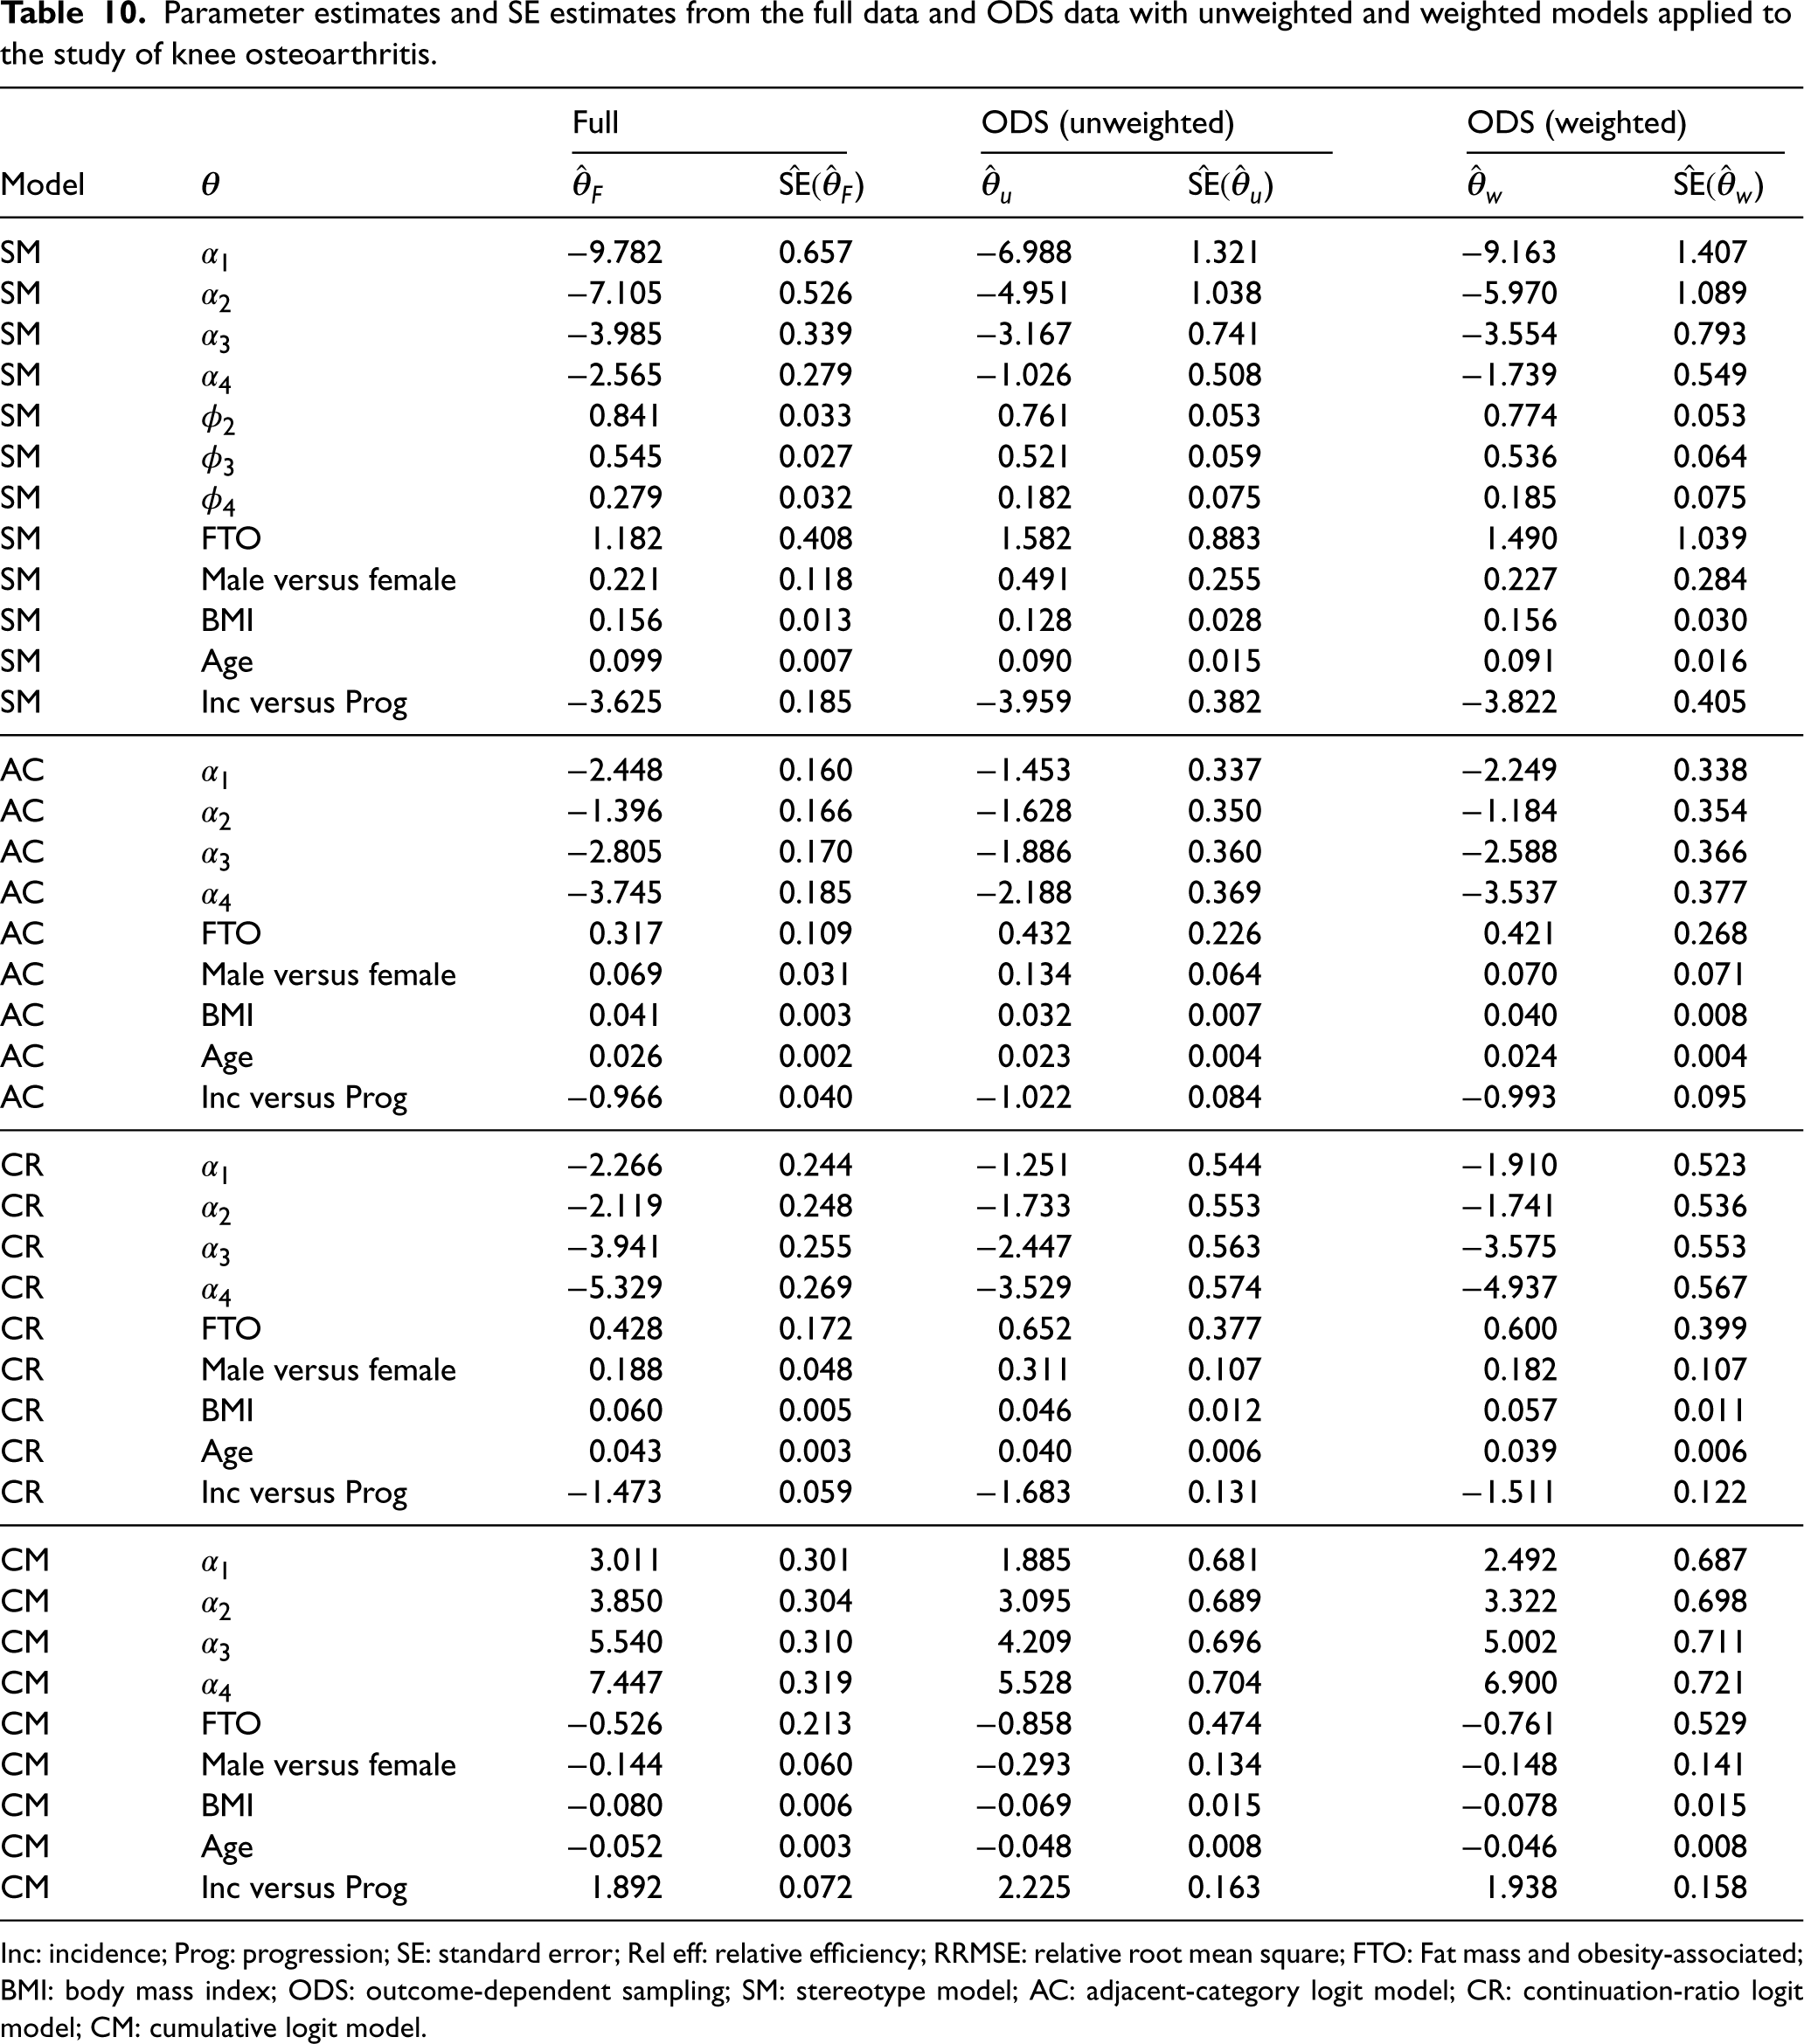
Inc: incidence; Prog: progression; SE: standard error; Rel eff: relative efficiency; RRMSE: relative root mean square; FTO: Fat mass and obesity-associated; BMI: body mass index; ODS: outcome-dependent sampling; SM: stereotype model; AC: adjacent-category logit model; CR: continuation-ratio logit model; CM: cumulative logit model.
We investigated the finite sample properties of unweighted and weighted ordinal regression models under ODS from a cohort with various distributions of the ordinal outcome categories. Through simulation based on synthetic data and a cohort study investigating knee OA, we compared the bias and efficiency of four representative ordinal regression models: the SM; AM; CR; and CM, with and without inverse sampling weights. As shown in our derivation in Appendix I and pointed out by others,7,13,35 the log odds estimates from the unweighted SM and AM are consistent under ODS, but their finite sample properties, including bias and efficiency, of unweighted and weighted SMs had never been investigated previously. Through our numerical investigations, we observed that the unweighted SM and the unweighted adjacent-category logit model produce consistent log odds estimates while the unweighted cumulative logit model while the unweighted continuation-ratio logit model produces biased log odds estimates under various scenarios. However, under ODS, the sampling probabilities from each ordinal outcome category are usually known. In that case, including the inverse of the sampling probability as weights can improve the bias of the intercept estimates as well as the log odds estimates using any of the four ordinal regression models. Estimating the intercept accurately may be important when the goal is to predict or to calculate the absolute risk or risk difference. While both SM and adjacent-category model produced unbiased log odds estimates with and without weights, the standard error estimates from the weighted models were more accurate. The efficiency of the estimates varied across all weighted models, especially when many of the ordinal categories had small prevalence.
Despite its robustness to sampling variability and other useful properties, the SM is not commonly used in practice. One possible reason is the lack of familiarity among researchers and practitioners with this model, as it is not as widely known as other models for ordinal outcome variables. Another possible reason is the limited availability of the procedure or function to directly estimate the SM in commonly used statistical software packages. For example, the
The baseline-category logit model (or multinomial regression model) is another model for discrete outcomes of more than two categories, and under ODS, we can obtain consistent log odds estimates for the population without weights. 13 We did not include the baseline-category logit model in this article because it does not consider the ordinal nature of the outcome and suffers from a lack of parsimony compared to the SM and the adjacent-category model. However, if the outcome categories are nominal and if the sampling probabilities are unknown, then the baseline-category logit model is useful.
We note that the models in our simulation study only had two independent covariates; including a larger number of covariates where some of them may be correlated with each other warrants additional exploration. We also note that we investigated the case where sampling is dependent only on the outcome. Therefore, results may be different when sampling is also dependent on covariates such as a two-phase design. In our case study in which we applied outcome-dependent sampling to the knee OA study, we repeated the sampling 200 times to empirically quantify the variability introduced by the sampling scheme. However, in a realistic setting, the outcome-dependent procedure will only be performed once with a feasible sample size without any knowledge of the true effect of the expensive variable in the original cohort.
Future work includes identifying sampling proportions that minimize the asymptotic variance of the parameter of interest under ODS and two-phase designs. Indeed, previous work by Espin-Garcia et al. 36 suggests that optimal sampling proportions can be obtained via constrained non-linear optimization approaches. Alternatively, stochastic optimization techniques, such as genetic algorithms, can be implemented to identify near-optimal designs in different settings. Extending semiparametric inference in two-phase studies to ordinal outcomes with misclassification errors is another research avenue. 37 This is particularly relevant for OA, where radiographic imaging is subject to error. 38
Imposing the ordinal constraint on the
In conclusion, unbiased and efficient estimates from ordinal models can be obtained with appropriate weights under ODS when the outcome is ordinal. When the sampling depends only on the outcome and the sampling fractions are known, then the inverse of the sampling probability can be used as weights. However, when the sampling probability is unknown, only the SM and AC can yield unbiased log odds estimates.
Supplemental Material
sj-pdf-1-smm-10.1177_09622802241282091 - Supplemental material for Applying survey weights to ordinal regression models for improved inference in outcome-dependent samples with ordinal outcomes
Supplemental material, sj-pdf-1-smm-10.1177_09622802241282091 for Applying survey weights to ordinal regression models for improved inference in outcome-dependent samples with ordinal outcomes by Aya A Mitani, Osvaldo Espin-Garcia, Daniel Fernández and Victoria Landsman in Statistical Methods in Medical Research
Footnotes
Acknowledgements
We thank the two reviewers for the valuable comments that led to an improved version of this article. This research was enabled in part by the support provided by the SciNet Consortium and the Digital Research Alliance of Canada (![]() ). Computations were performed on the Niagara supercomputer. SciNet is funded by Innovation, Science and Economic Development Canada; the Digital Research Alliance of Canada; the Ontario Research Fund: Research Excellence; and the University of Toronto.
). Computations were performed on the Niagara supercomputer. SciNet is funded by Innovation, Science and Economic Development Canada; the Digital Research Alliance of Canada; the Ontario Research Fund: Research Excellence; and the University of Toronto.
Data availability statement
Data used in the preparation of this article were obtained and analyzed from the controlled access datasets distributed from the Osteoarthritis Initiative (OAI), a data repository housed within the NIMH Data Archive (NDA). OAI is a collaborative informatics system created by the National Institute of Mental Health and the National Institute of Arthritis, Musculoskeletal and Skin Diseases (NIAMS) to provide a worldwide resource to quicken the pace of biomarker identification, scientific investigation and OA drug development. R code for the simulation study is available from https://github.com/ayamitani/ordinalODS-simulation. The function to compute design-based standard errors of weighted stereotype model is available from ![]() .
.
Declaration of Conflict of Interest
The author(s) declared no potential conflicts of interest with respect to the research, authorship and/or publication of this article.
Funding
The author(s) disclosed receipt of the following financial support for the research, authorship, and/or publication of this article: Aya Mitani and Osvaldo Espin-Garcia are partially supported by the Natural Sciences and Engineering Research Council of Canada—Discovery Grants Program [RGPIN-2022-05356 (AM); RGPIN-2023-03602 (OE)]. Daniel Fernndez is a Serra-Húnter Fellow, a member of the Centro de Investigación Biomédica en Red de Salud Mental (Instituto de Salud Carlos III), and his work has been supported by the Ministerio de Ciencia e Innovación (Spain) [PID2019-104830RB-I00/ DOI (AEI): 10.13039/501100011033], and by grant 2021 SGR 01421 (GRBIO) administrated by the Departament de Recerca i Universitats de la Generalitat de Catalunya (Spain).
Supplemental material
Supplemental materials for this article are available online.
Appendix I
Appendix II
Special case for CR when
References
Supplementary Material
Please find the following supplemental material available below.
For Open Access articles published under a Creative Commons License, all supplemental material carries the same license as the article it is associated with.
For non-Open Access articles published, all supplemental material carries a non-exclusive license, and permission requests for re-use of supplemental material or any part of supplemental material shall be sent directly to the copyright owner as specified in the copyright notice associated with the article.