
Abstract
This study investigates the heterogeneity of a biomarker’s discriminative performance for predicting subsequent time-to-event outcomes across different patient subgroups. While the area under the curve (AUC) for the time-dependent receiver operating characteristic curve is commonly used to assess biomarker performance, the partial time-dependent AUC (PAUC) provides insights that are often more pertinent for population screening and diagnostic testing. To achieve this objective, we propose a regression model tailored for PAUC and develop two distinct estimation procedures for discrete and continuous covariates, employing a pseudo-partial likelihood method. Simulation studies are conducted to assess the performance of these procedures across various scenarios. We apply our model and inference procedure to the Alzheimer’s Disease Neuroimaging Initiative data set to evaluate potential heterogeneities in the discriminative performance of biomarkers for early Alzheimer’s disease diagnosis based on patients’ characteristics.
Introduction
Biomarkers have gained widespread use in biomedical research, encompassing various applications such as disease diagnosis, monitoring, and drug development. 1 The discriminative ability of prognostic biomarkers, which are designed for identifying the likelihood of clinical events, disease recurrence, or progression in patients with a certain medical condition or disease, must undergo rigorous evaluation before their use in practice. In cases where research outcomes are time-to-events such as time-to-death, disease progression, or relapse, 2 the conventional measures used for binary outcomes, including sensitivity, specificity, and the area under the curve (AUC) of the receiver operating characteristic (ROC) curve, have been extended to account for the dynamic nature of biomarker performance over time.3–7 The concept of time-dependent ROC and AUC in the context of both longitudinal and time-to-event outcomes has been extensively reviewed in Chapter 6 of “ROC Analysis for Classification and Prediction in Practice.” 8 Additionally, joint modeling settings are also discussed in Chapter 7 of “Joint models for longitudinal and time-to-event data: With applications in R.” 9
AUC and its time-dependent variants are commonly used as global measures to characterize the discriminative performance of biomarkers. One of their practical drawbacks is that it summarizes the entire ROC curve, although clinical and practical interests often focus on specific regions under the ROC curve rather than the full range of specificity. This is particularly relevant in cancer population screening, where high specificity is a top priority. 10 Given the low incidence of cancer, it is preferable to prioritize high specificity to minimize the number of subjects who undergo unnecessary medical procedures and experience significant psychological stress. 11 To address this clinical need, the partial area under the ROC curve (partial time-dependent area under the curve [PAUC]) has been recommended as a suitable metric for evaluating and comparing the performance of biomarkers, aligning with the clinical interest in targeted areas of the ROC curve.12,13
With the rapid advancements in biomarker research, it has become increasingly clear that identifying a single optimal biomarker with consistent discriminative performance across the entire population is not a realistic expectation. By analyzing the heterogeneity in biomarker discriminative performance, researchers can gain valuable insights into which specific groups or subpopulations exhibit favorable performance with the investigated biomarker, and conversely, which groups may not benefit as much. Understanding the limitations of biomarker performance in specific subgroups can guide further research and the development of improved biomarkers that may better serve those populations. For example, it has been reported that levels of prostate-specific antigen (PSA), a biomarker widely used to screen men for prostate cancer, tend to increase with age. 14 With this finding, age-adjusted PSA would provide a more accurate screening tool for prostate cancer, particularly in older populations.
In the context of evaluating biomarker performance for binary outcomes, such as disease status, researchers have dedicated considerable attention to regression analysis to directly assess the discriminative performance using regression techniques. Particularly, several methods have been proposed for directly evaluating the performance of partial AUC using regression techniques with an emphasis on the control of higher specificity.13,15,16 When biomarkers are employed for risk stratification and monitoring disease progression, the outcomes of interest often involve time-to-event outcomes. In such circumstances, both nonparametric and regression approaches have been proposed to estimate the covariate-specific time-dependent ROC curve.17–19 To the best of our knowledge, no existing methods have been developed to model the time-dependent PAUC and investigate the heterogeneity in biomarker discriminative performance within the region of the clinically acceptable specificity over time. Therefore, our objective is to fill this research gap and gain insights into the variations in biomarker performance and its discriminatory abilities over different time periods.
One motivation study is to understand how the discriminative ability of biomarkers for Alzheimer’s disease (AD) is influenced by subjects’ characteristics. Data used in the preparation of this article were obtained from the AD Neuroimaging Initiative (ADNI) database (adni.loni.usc.edu). The ADNI was launched in 2003 as a public–private partnership, led by Principal Investigator Michael W. Weiner, MD. The primary goal of ADNI has been to test whether serial magnetic resonance imaging, positron emission tomography (PET), other biological markers, and clinical and neuropsychological assessment can be combined to measure the progression of mild cognitive impairment (MCI) and early AD.20,21 Among the factors being investigated, three cerebrospinal fluid (CSF) biomarkers, namely A
The remaining sections of this article are organized as follows. In Section 2, we begin by providing a definition of the covariate-specific PAUC. We then introduce the regression model for the PAUC and propose a pseudo-partial likelihood approach to estimate the model parameters. Initially, we focus on categorical covariates and subsequently extend the estimation procedure to handle continuous covariates. Furthermore, we establish the asymptotic behavior of the proposed approach. In Section 3, we conduct comprehensive simulation studies to assess the finite sample performance of the proposed methods under various scenarios. In Section 4, we apply the proposed method to the ADNI data set and evaluate how the discriminative performance of biomarkers, as characterized by the PAUC, changes with different subjects’ characteristics. We conclude the article with a discussion of our findings in Section 5.
Methods
Notations and time-dependent measures
Denote the event time as
Building upon the framework proposed by Heagerty and Zheng,
3
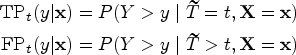
we adopt the incident/dynamic definition of time-dependent accuracy summaries to incorporate covariate information. Specifically, the covariate-specific incident sensitivity, dynamic false positive (i.e. 1-specificity), and the corresponding time-dependent ROC are defined as follows:


Model for the covariate-specific PAUC
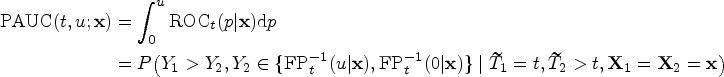
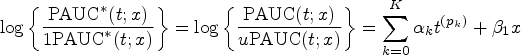
Motivated by the need to comprehend the heterogeneity of biomarker discriminative performance, we propose a regression model for the covariate-specific PAUC. Using a link function


Acknowledging clinical interest in the discriminative accuracy evaluation of a biomarker, which often lies in the discrimination between cases and controls within the same subgroup, 15 we have enforced the use of identical covariate information for both cases and controls in our regression model. Although this model constraint is clinically meaningful, it presents a new challenge in estimating regression coefficients, particularly for continuous covariates due to the inherent curse of dimensionality. 24 In the following sections, we present separate estimation procedures tailored for handling discrete and continuous covariates. These procedures are designed to effectively tackle the challenges introduced by the constraint of using identical covariate information for cases and controls in our regression model and also incorporate covariate distance between cases and controls to enable information borrowing.
For a given subject


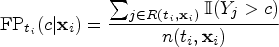

When dealing with continuous covariates, the strategy of grouping subjects with the same covariate information to define the at-risk set is not feasible. Alternatively, we propose to assign weights to the controls, who are event-free at the event time of a case, based on the distance in covariates between the case and its controls, using a kernel smoothing technique. For illustrative purposes, we consider the scenario with one continuous covariate. Under this approach, we utilize the conventional risk set, defined as
Accordingly, the false positive rate would be estimated by weighting the controls based on their covariate information in the risk set:


Our proposed pseudo-partial likelihood is inspired by the pseudo-likelihood, which has been demonstrated as the most effective approach for analyzing censored data within the framework of the Cox proportional hazards model. To illustrate our method, we consider a scenario with discrete covariates. At each observed failure time point, denoted as
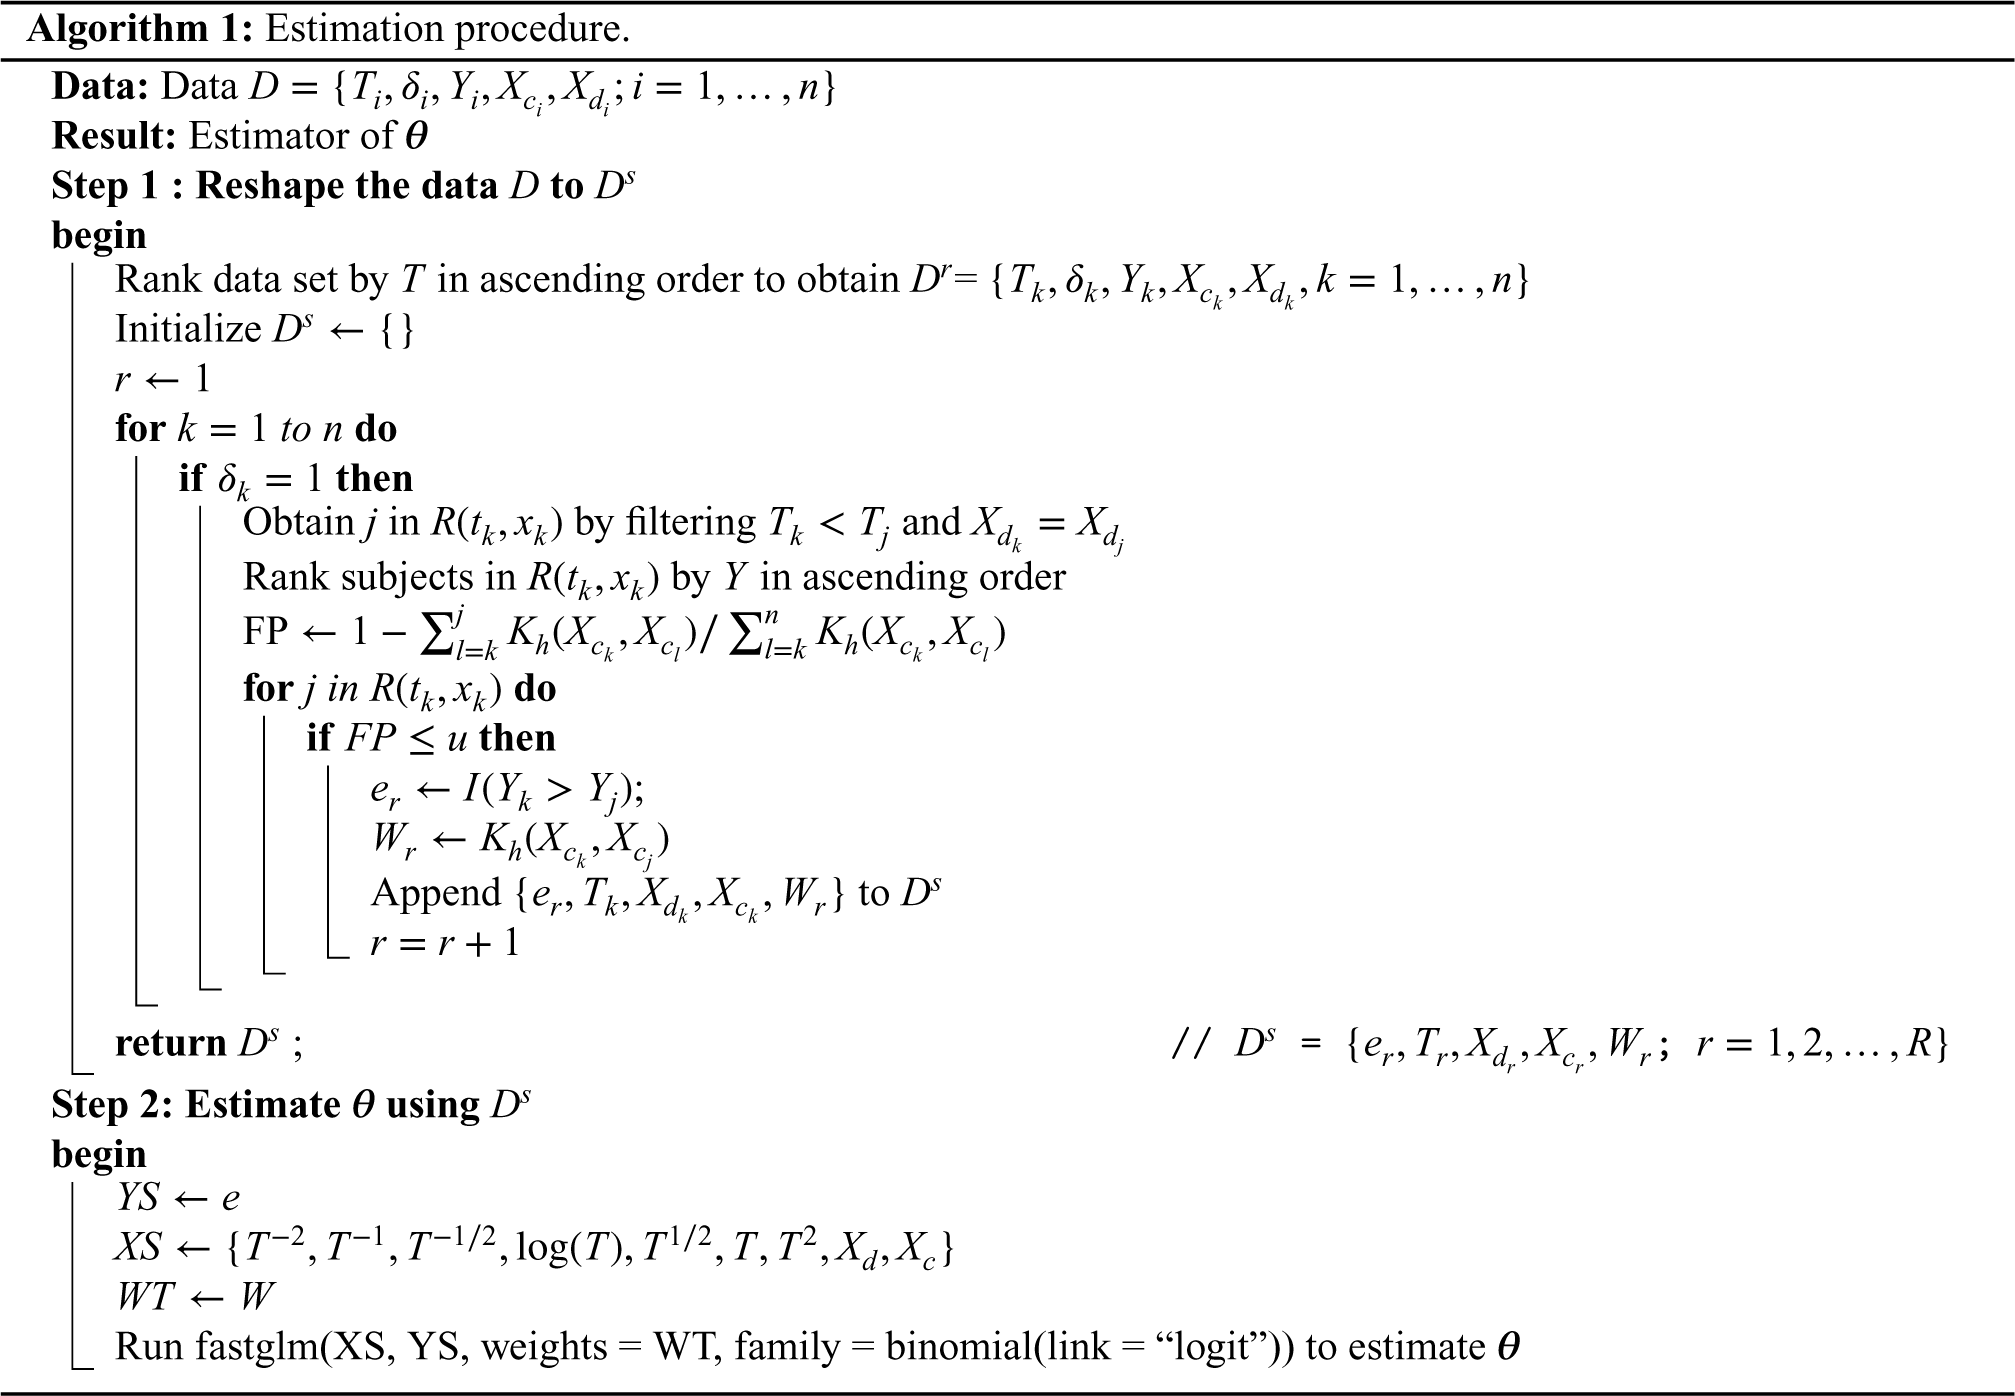
In terms of implementation, while developing computational codes to maximize our likelihood functions should not be complex, leveraging existing software would facilitate broader adoption of our proposed methods. Recognizing the similarity between the pseudo-partial likelihood functions presented in (4) and (7) and the likelihood function commonly associated with binary outcomes, we reshape the data and leverage the existing software for fitting generalized linear model for estimation.
26
Algorithm 1 summarizes the implementation procedure with one discrete (e.g.
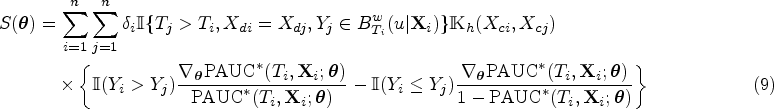
Asymptotic properties
In this section, we delve into the asymptotic properties of the proposed method. Note that the concordant events or the kernel-based concordant events do not exhibit mutual independence. As a result, the likelihood formulated using these events cannot be readily treated as a conventional likelihood for inference purposes, and overcoming this challenge requires additional considerations. Without loss of generality, we assume the model includes one discrete covariate 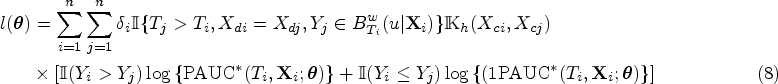
Under the regularity conditions (A1–A6) in the supplemental materials, the estimator
The covariance matrix
Under the regularity conditions (A1–A6) in the supplemental materials,
For the purpose of evaluating the performance of our proposed methods, we conducted a comprehensive simulation study under various data-generating scenarios.
Simulation settings
The biomarker
We considered three scenarios to evaluate the performance of the proposed methods when there are different types of covariates. In Scenario 1, we evaluated the performance of the proposed methods in the presence of a discrete covariate 


Simulation results
All results were derived from 1000 simulated data sets. Due to space constraints, we have included simulation results for Scenario 3 within the main body of the paper and left simulation results for Scenarios 1 and 2 in the supplemental materials.
For Scenarios 1 and 2, empirical biases (Bias) and standard deviations (SDs) of the proposed estimators under various sample sizes (500 or 1000), censoring rates (
The empirical coverage probabilities (CPs) of
Detailed simulation results under Scenario 3 are presented in Figures 1 to 3. To elaborate, Figure 1 provides an overview of biases and SDs for estimated regression coefficients. Figure 2 illustrates the CPs of these estimates. Additionally, Figure 3 displays the average of the estimated baseline time-dependent partial AUC, along with their corresponding 95% empirical confidence intervals.
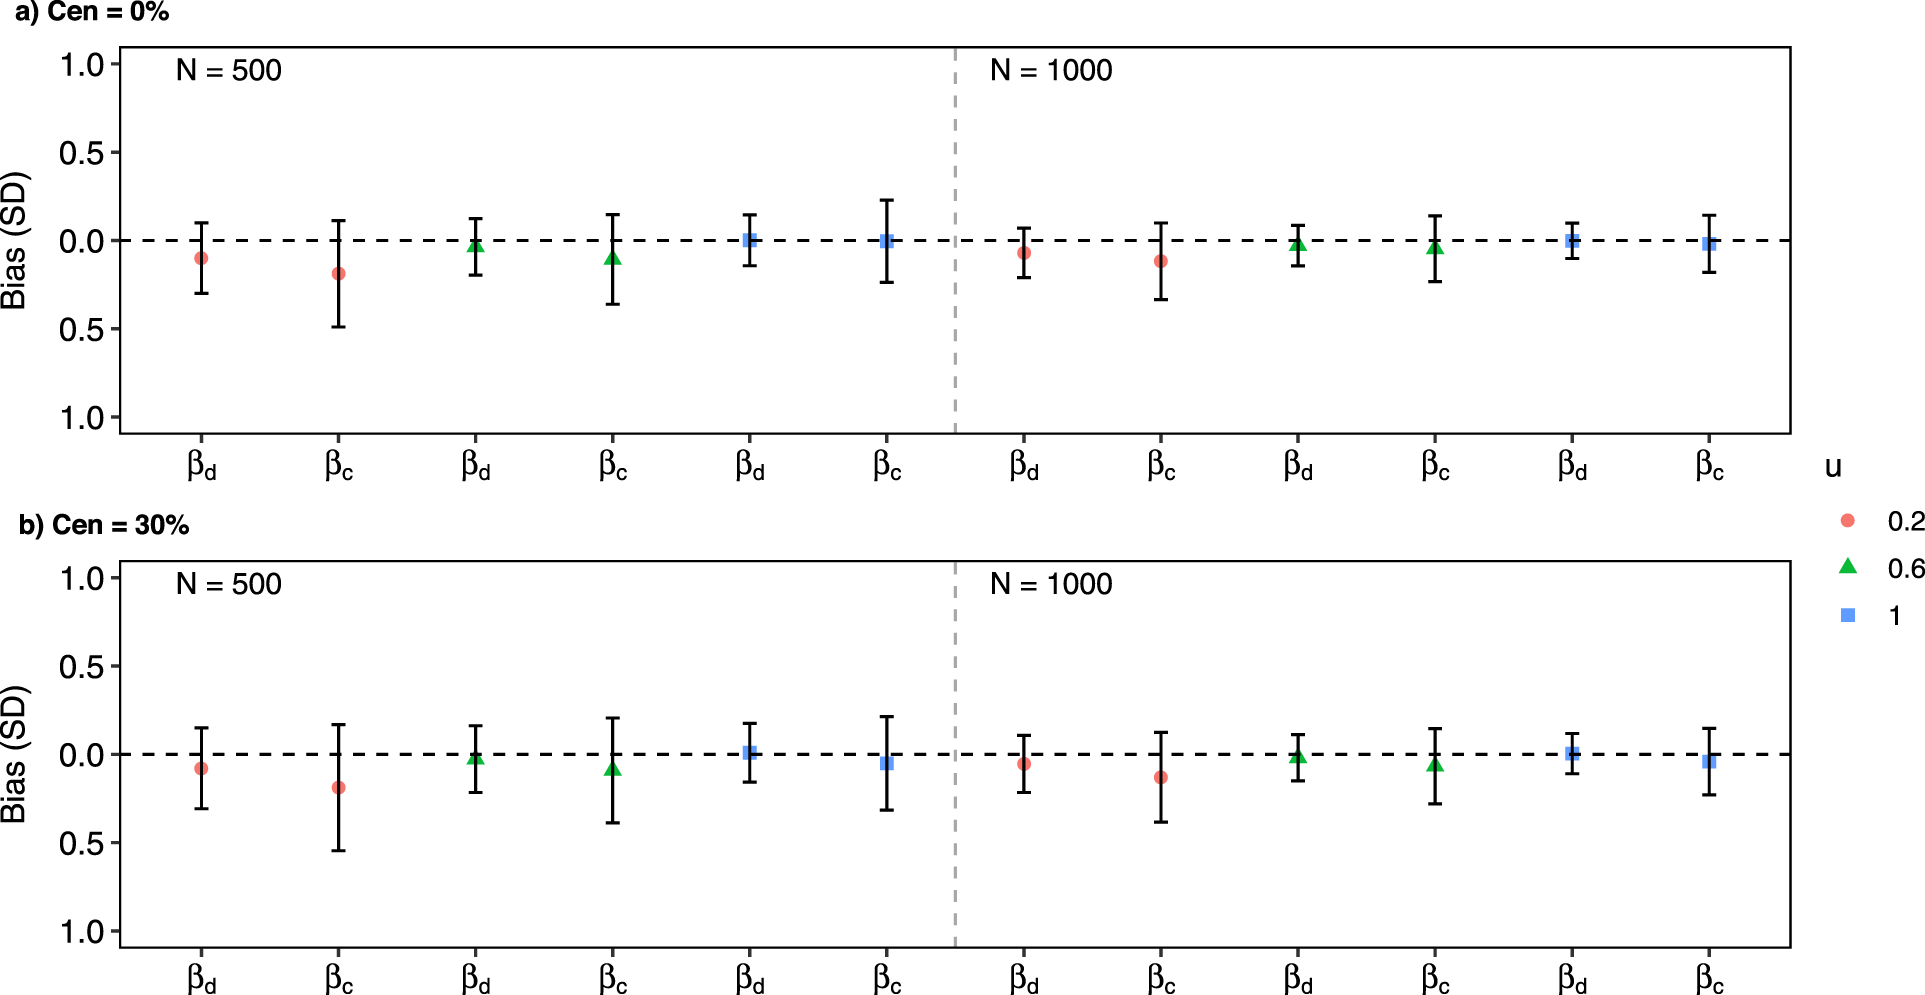
Simulation results: biases and empirical standard deviations in scenario 3.
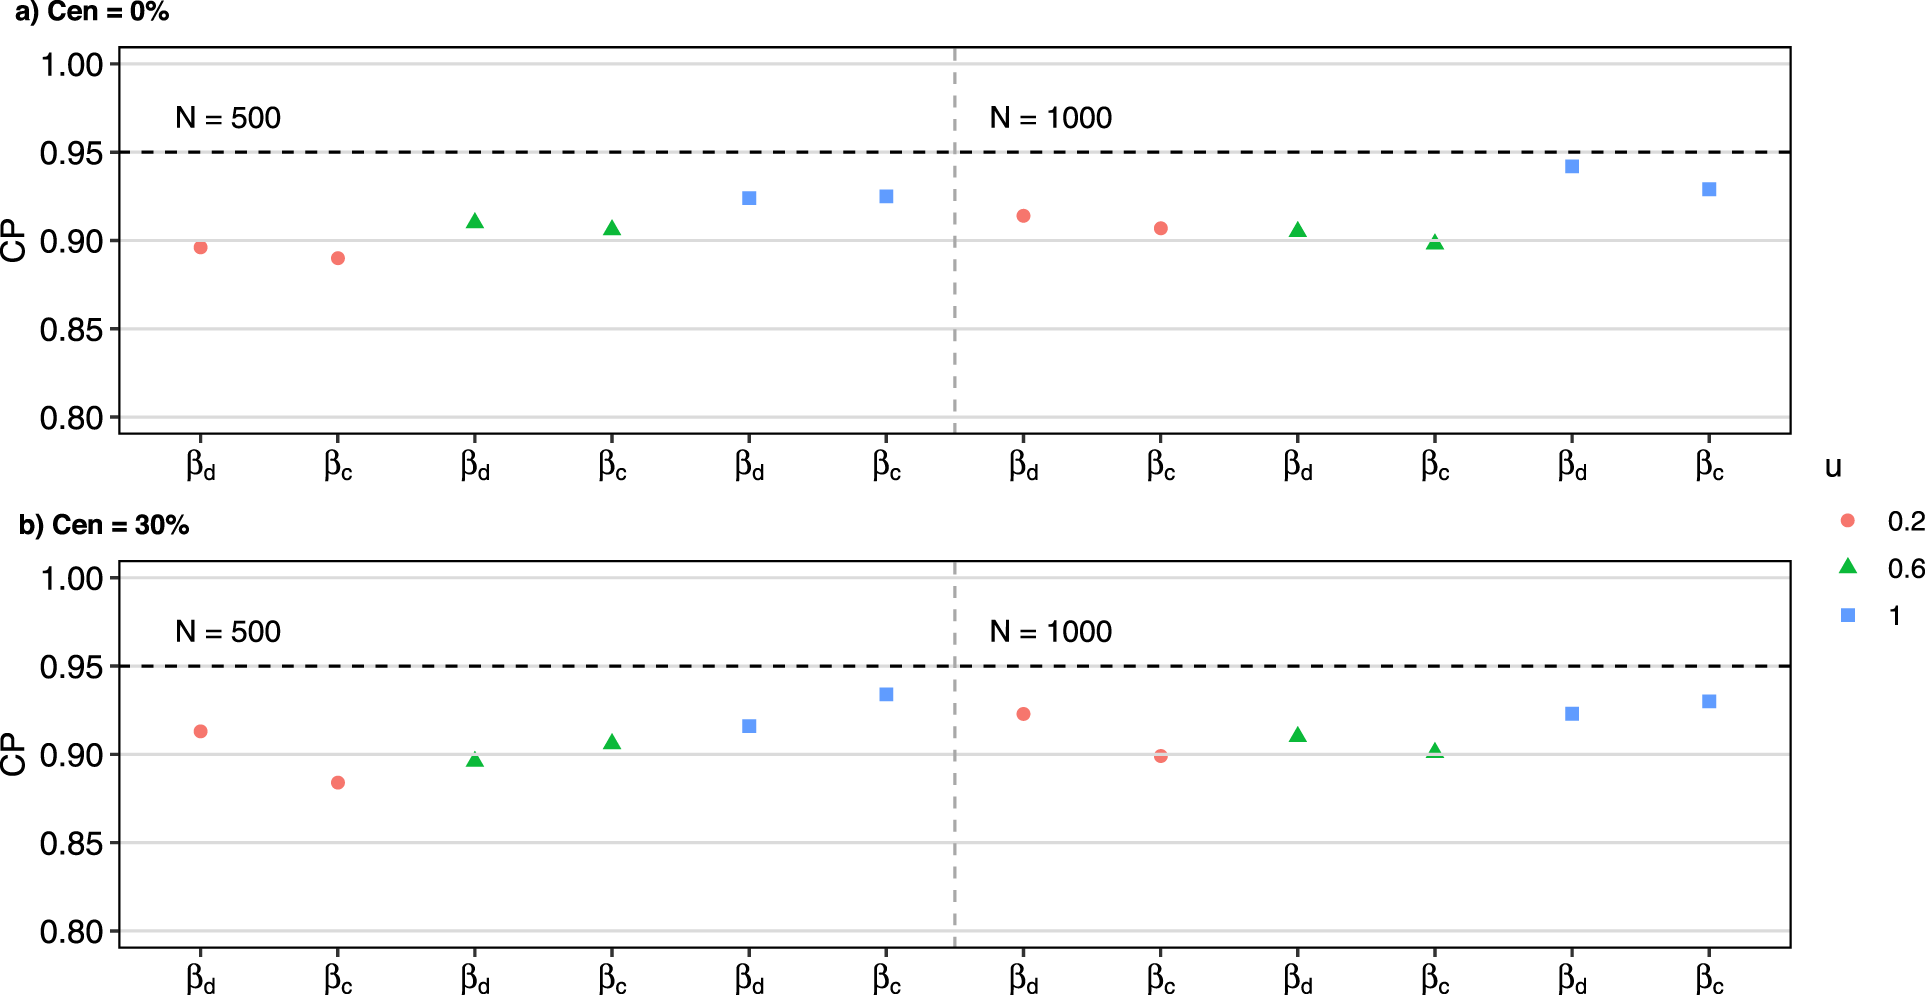
Simulation results: empirical coverage probabilities in scenario 3.
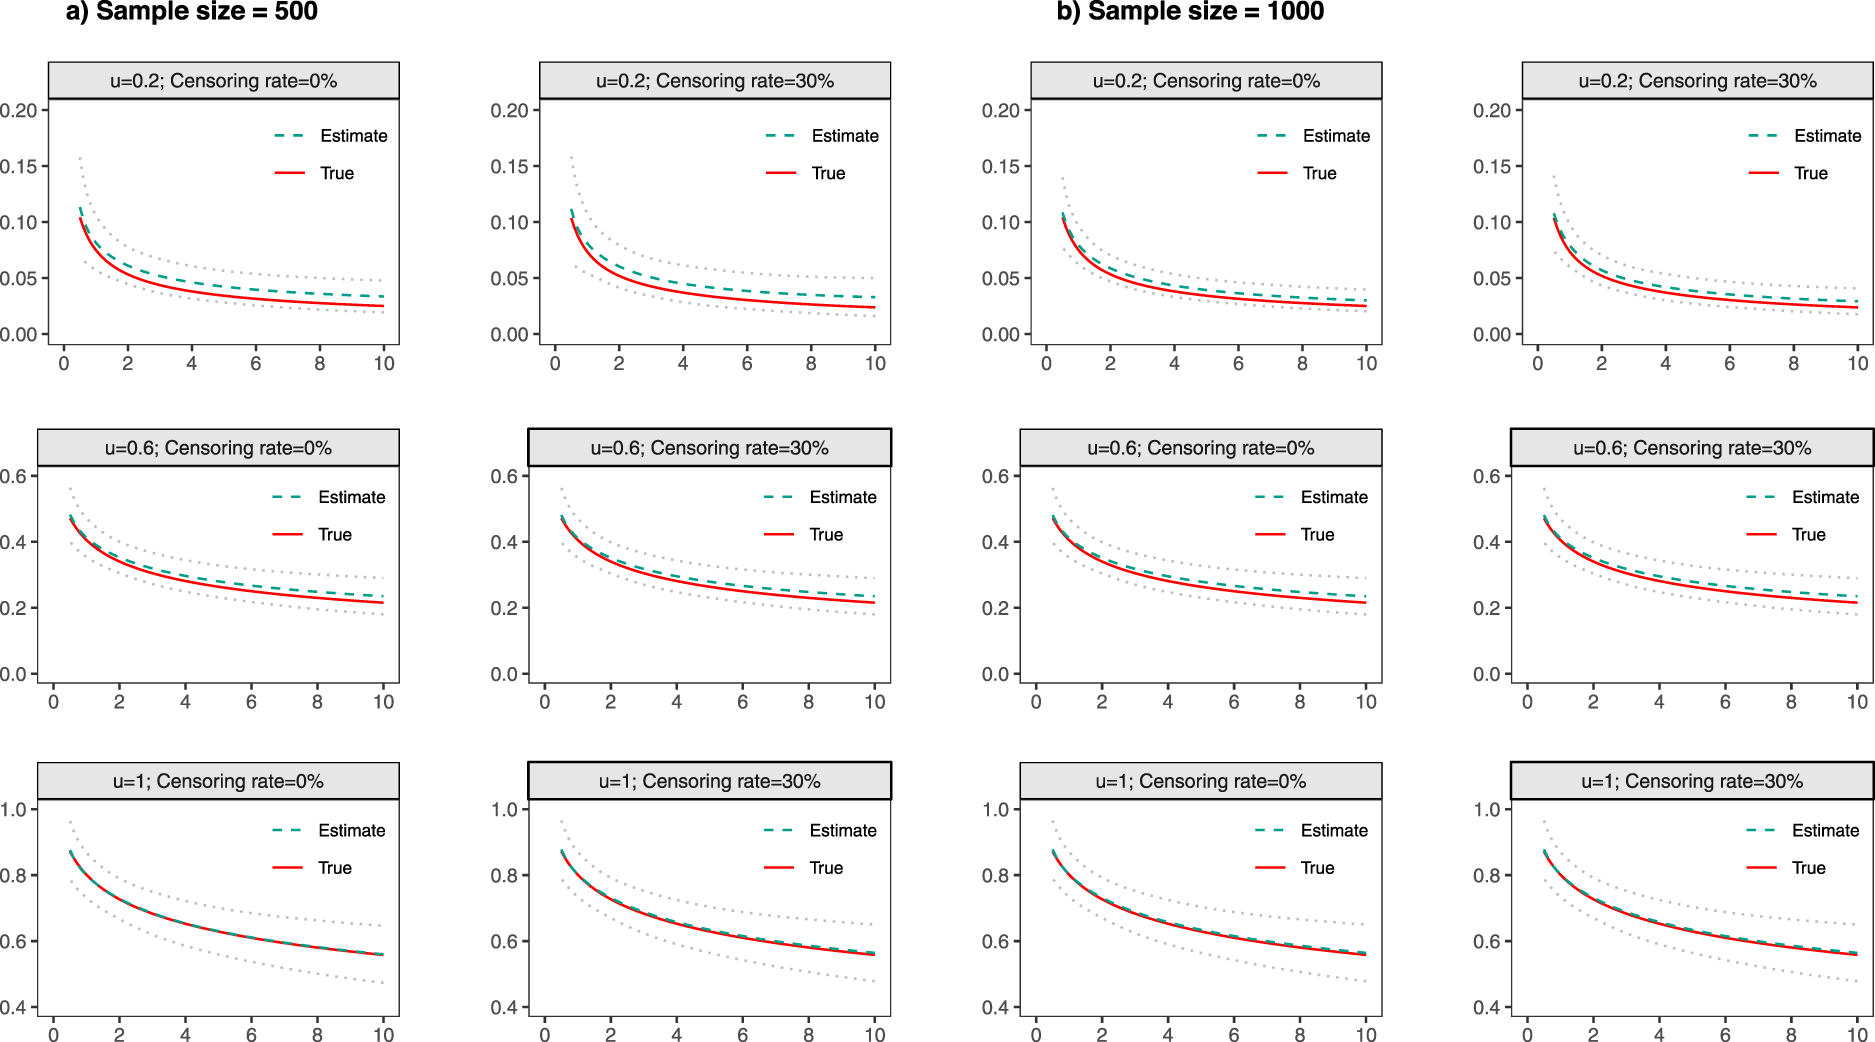
Estimated baseline
With both continuous and discrete covariates involved in the model, the simulation results had a minimal bias, with slightly larger biases observed under smaller effective sample sizes (i.e. smaller values of
Additional simulation studies have been conducted to further assess the performance of our proposed method. These studies include evaluations of models with varying numbers of polynomials included, models incorporating interaction terms, and additional settings with censoring times derived from the ADNI data. Detailed descriptions of these additional simulations and their results can be found in Section S2 of the supplemental materials.
In recent studies, three CSF biomarkers—A
During the ADNI study, participants were enrolled with varying AD statuses, including normal aging, early mild cognitive impairment, and late mild cognitive impairment or AD. These participants were prospectively followed and reassessed over time to track the progression of the disease. The primary outcome of our investigation was the time to diagnosis of AD. Our analytic cohort comprised 957 subjects after excluding prevalent cases (subjects with AD before study enrollment). The median follow-up time was 48 months, with a range from 6 to 180 months. Among these subjects, 261 (27.3%) were diagnosed with AD or died during the study period. The analytical cohort comprised 434 female patients (45.4%) and 523 male patients (54.6%). The median patient age was 73 years, with an interquartile range of 66 to 78 years (Table S7 in supplemental materials).
We fitted three separate regression models to evaluate whether the discriminative ability of the three aforementioned biomarkers for AD progression would be influenced by subjects’ age and gender. In these regression models, age was treated as a continuous variable centered at 75 years old, and the reference group for gender was set as male. Previous research by Pettigrew et al.
27
suggests that age may exhibit a nonlinear effect on AD progression, prompting the inclusion of a quadratic term in the regression model. Following this precedent, we incorporated the quadratic term in our model. Fitting results affirmed that a straightforward linear effect of age might not sufficiently capture the nuances of age-related effects. Let 
Table 1 summarizes the estimated regression coefficients with different threshold values on the PAUC for the biomarker t-tau, while Tables S4 and S5 of the supplemental materials list the estimated regression coefficients for the other two biomarkers. For the t-tau biomarker, the influence of subjects’ age on their performance was contingent on the chosen threshold values. For values of 
Estimated covariate effects on the PAUC of biomarker
-tau using the ADNI data.
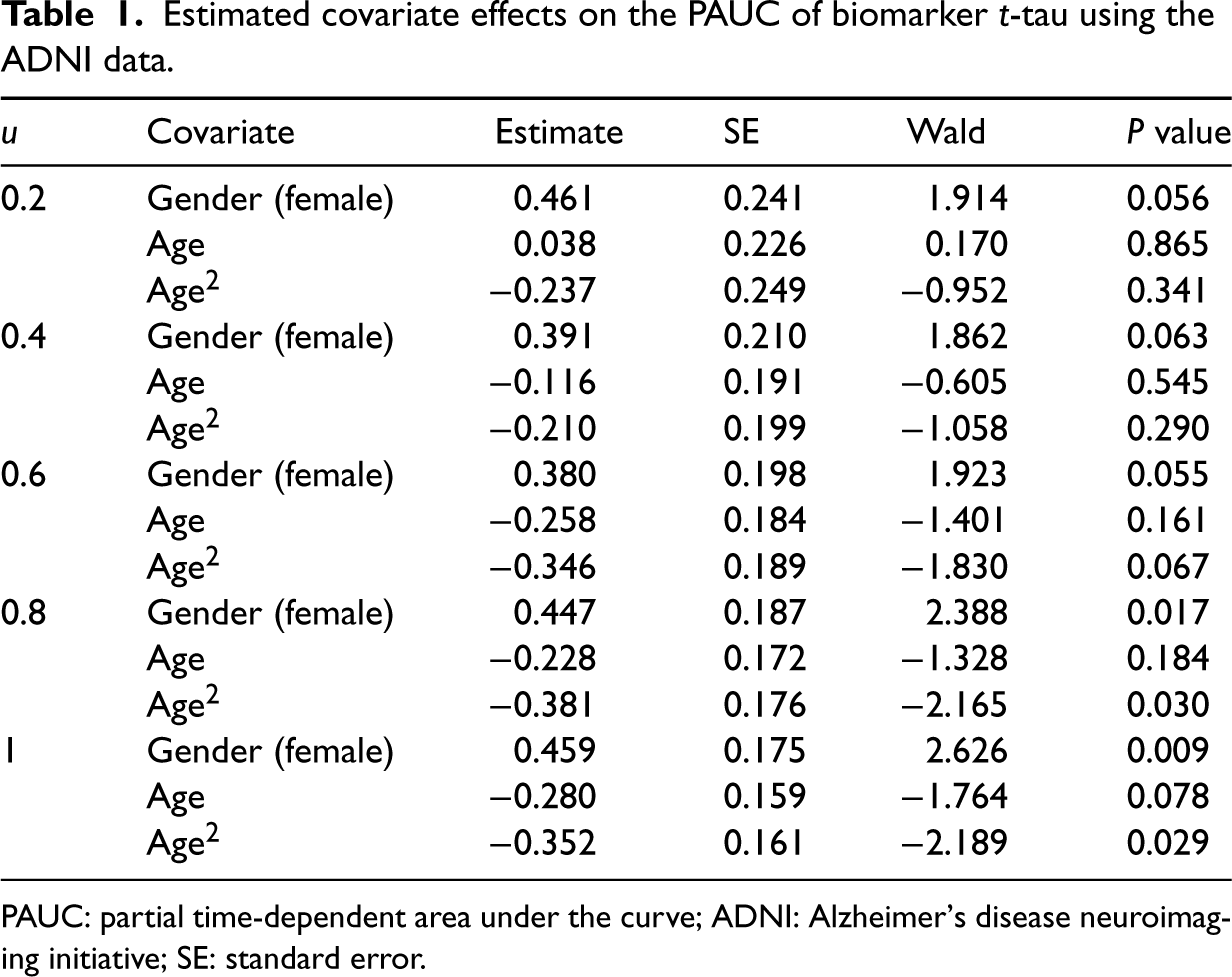
Estimated covariate effects on the PAUC of biomarker
PAUC: partial time-dependent area under the curve; ADNI: Alzheimer’s disease neuroimaging initiative; SE: standard error.
For a visual representation, Figure 4 plots the PAUC across different subgroups determined by subjects’ gender and age. The estimated
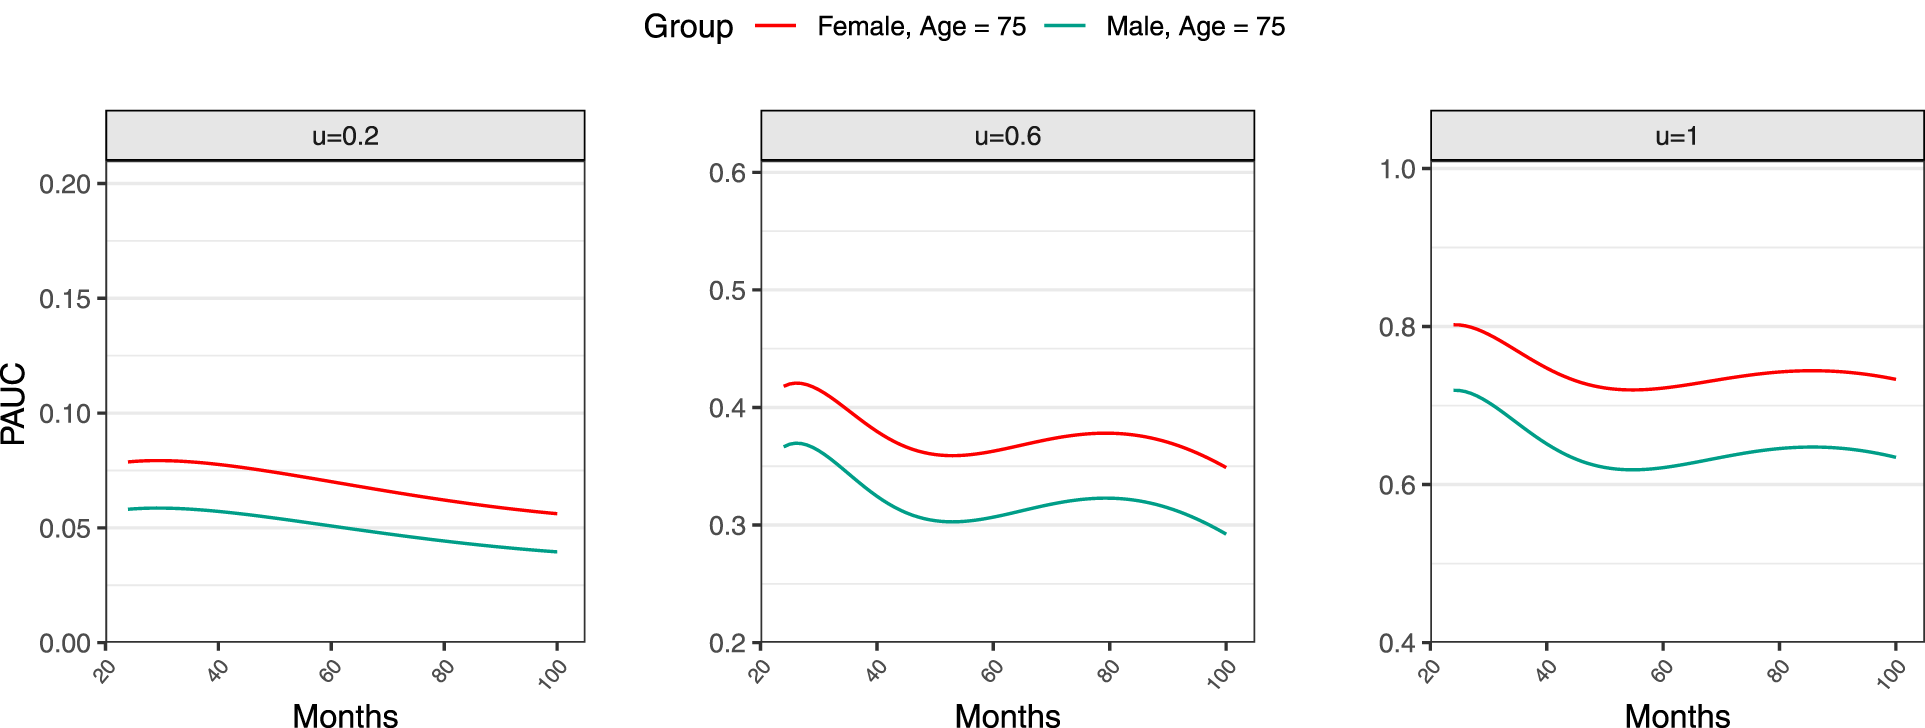
Estimated time-dependent time-dependent area under the curve (PAUC) curves by sex.
Recognizing the clinical and practical interest in specific regions under the ROC curve, we introduce the PAUC regression model and inference procedure to comprehend the heterogeneity in the discriminative performance of biomarkers with time-to-event outcomes. One notable advantage of our proposed estimation approach lies in its simplicity for handling right censoring, obviating the need for an inverse weighting approach that involves estimating the censoring distribution. Furthermore, the analytical formula provided for variance estimation alleviates computational burden in practical applications.
While our primary focus in this paper is the assessment of heterogeneity in the discriminative performance of individual biomarkers, the proposed model and inference procedure can be extended to evaluate the performance of biomarker combinations or risk stratification scores. This extension would require the incorporation of cross-validation procedures to address additional variability when coefficients for biomarker combinations or risk stratification scores are unknown and need to be estimated. While our work does not focus specifically on formal heterogeneity testing, our proposed regression models can indeed serve as valuable tools for assessing the heterogeneity of a biomarker’s effectiveness across various subgroups. By evaluating regression coefficients associated with covariates, such as age and gender, our models enable us to evaluate whether there are significant differences in the discriminative performance of the biomarker across diverse subgroups. Specifically, we can employ Wald-type tests to determine whether regression coefficients associated with these covariates are significantly different from zero. These tests allow us to investigate whether there are notable variations in the biomarker’s discriminative performance among different subgroups. Identifying such disparities can be instrumental in pinpointing specific subgroups where further improvement in biomarker effectiveness may be necessary.
One assumption underlying our proposed inference procedure is the assumption of independent censoring. It is important to acknowledge that in the presence of competing risks, this assumption might be violated. However, the proposed model and inference procedure can be generalized to accommodate competing risks by drawing on the existing literature on time-dependent predictive measures. 28 This, however, falls beyond the scope of this present paper. Another challenge in our method is assessing model fitting for the PAUC. Standard tools, such as residual plots, are not directly applicable toevaluating the adequacy of the model. Developing rigorous statistical tools for this purpose is worthy of future research.
Supplemental Material
sj-pdf-1-smm-10.1177_09622802241262521 - Supplemental material for Analyzing heterogeneity in biomarker discriminative performance through partial time-dependent receiver operating characteristic curve modeling
Supplemental material, sj-pdf-1-smm-10.1177_09622802241262521 for Analyzing heterogeneity in biomarker discriminative performance through partial time-dependent receiver operating characteristic curve modeling by Xinyang Jiang, Wen Li, Kang Wang, Ruosha Li and Jing Ning in Statistical Methods in Medical Research
Footnotes
Acknowledgements
The authors acknowledge the Texas Advanced Computing Center at The University of Texas at Austin for providing high performance computing resources that have contributed to the research results reported within this paper. Data used in the preparation of this article were obtained from the Alzheimer’s Disease Neuroimaging Initiative (ADNI) database (adni.loni.usc.edu). As such, the investigators within the ADNI contributed to the design and implementation of ADNI and/or provided data but did not participate in the analysis or writing of this report. A complete listing of ADNI investigators can be found at ![]() ADNI data are disseminated by the Laboratory for Neuro Imaging at the University of Southern California.
ADNI data are disseminated by the Laboratory for Neuro Imaging at the University of Southern California.
Declaration of conflicting interests
The authors declared no potential conflicts of interest with respect to the research, authorship, and/or publication of this article.
Funding
The authors received no financial support for the research, authorship, and/or publication of this article: This work was partially supported by awards from the National Institutes of Health (R01DK117209, U24CA230144, R01CA269696, and P50CA281701) and the Cancer Prevention and Research Institute of Texas (RP200633). Data collection and sharing for this project was funded by the ADNI (National Institutes of Health Grant U01 AG024904) and DOD ADNI (Department of Defense award number W81XWH-12-2-0012). ADNI is funded by the National Institute on Aging, the National Institute of Biomedical Imaging and Bioengineering, and through generous contributions from the following: AbbVie, Alzheimer’s Association; Alzheimer’s Drug Discovery Foundation; Araclon Biotech; BioClinica, Inc.; Biogen; Bristol-Myers Squibb Company; CereSpir, Inc.; Cogstate; Eisai Inc.; Elan Pharmaceuticals, Inc.; Eli Lilly and Company; Eurolmmun; F. Hoffmann-La Roche Ltd and its affiliated company Genentech, Inc.; Fujirebio; GE Healthcare; IXICO Ltd.; Janssen Alzheimer Immunotherapy Research ![]() ). The grantee organization is the Northern California Institute for Research and Education, and the study is coordinated by the Alzheimer’s Therapeutic Research Institute at the University of Southern California.
). The grantee organization is the Northern California Institute for Research and Education, and the study is coordinated by the Alzheimer’s Therapeutic Research Institute at the University of Southern California.
Supplemental material
Supplemental material for this article is available online.
References
Supplementary Material
Please find the following supplemental material available below.
For Open Access articles published under a Creative Commons License, all supplemental material carries the same license as the article it is associated with.
For non-Open Access articles published, all supplemental material carries a non-exclusive license, and permission requests for re-use of supplemental material or any part of supplemental material shall be sent directly to the copyright owner as specified in the copyright notice associated with the article.