
Abstract
Linear mixed models are commonly used in analyzing stepped-wedge cluster randomized trials. A key consideration for analyzing a stepped-wedge cluster randomized trial is accounting for the potentially complex correlation structure, which can be achieved by specifying random-effects. The simplest random effects structure is random intercept but more complex structures such as random cluster-by-period, discrete-time decay, and more recently, the random intervention structure, have been proposed. Specifying appropriate random effects in practice can be challenging: assuming more complex correlation structures may be reasonable but they are vulnerable to computational challenges. To circumvent these challenges, robust variance estimators may be applied to linear mixed models to provide consistent estimators of standard errors of fixed effect parameters in the presence of random-effects misspecification. However, there has been no empirical investigation of robust variance estimators for stepped-wedge cluster randomized trials. In this article, we review six robust variance estimators (both standard and small-sample bias-corrected robust variance estimators) that are available for linear mixed models in R, and then describe a comprehensive simulation study to examine the performance of these robust variance estimators for stepped-wedge cluster randomized trials with a continuous outcome under different data generators. For each data generator, we investigate whether the use of a robust variance estimator with either the random intercept model or the random cluster-by-period model is sufficient to provide valid statistical inference for fixed effect parameters, when these working models are subject to random-effect misspecification. Our results indicate that the random intercept and random cluster-by-period models with robust variance estimators performed adequately. The CR3 robust variance estimator (approximate jackknife) estimator, coupled with the number of clusters minus two degrees of freedom correction, consistently gave the best coverage results, but could be slightly conservative when the number of clusters was below 16. We summarize the implications of our results for the linear mixed model analysis of stepped-wedge cluster randomized trials and offer some practical recommendations on the choice of the analytic model.
Keywords
Introduction
The cluster randomized trial (CRT) is a commonly used design for evaluating the effectiveness of cluster-level interventions or when there are substantial risks of contamination of the intervention within clusters. 1 In CRTs, individuals who are members of the same group (such as a neighborhood, hospital, or school) are randomized as an entire unit to either the control or the intervention arms. A major implication of cluster randomization is that individuals from the same cluster tend to be more similar than individuals from different clusters. This similarity is measured by the intracluster correlation coefficient (ICC). 2 In recent years, a novel type of longitudinal CRT design, referred to as the stepped-wedge cluster randomized trial (SW-CRT) has become increasingly popular.3,4 In the basic version of this design (Figure 1), all clusters commence the trial in the control condition and conclude in the intervention condition, with clusters randomized to one of several treatment sequences defined by the time of transition from the control condition to the intervention condition. Depending on the sampling structure, a SW-CRT can be either cross-sectional (a different set of individuals is included in each observation period), closed cohort (each individual contributes to all observation periods), or open cohort. 3 Each observation period (e.g. each cell in Figure 1) is also referred to as a cluster-period.
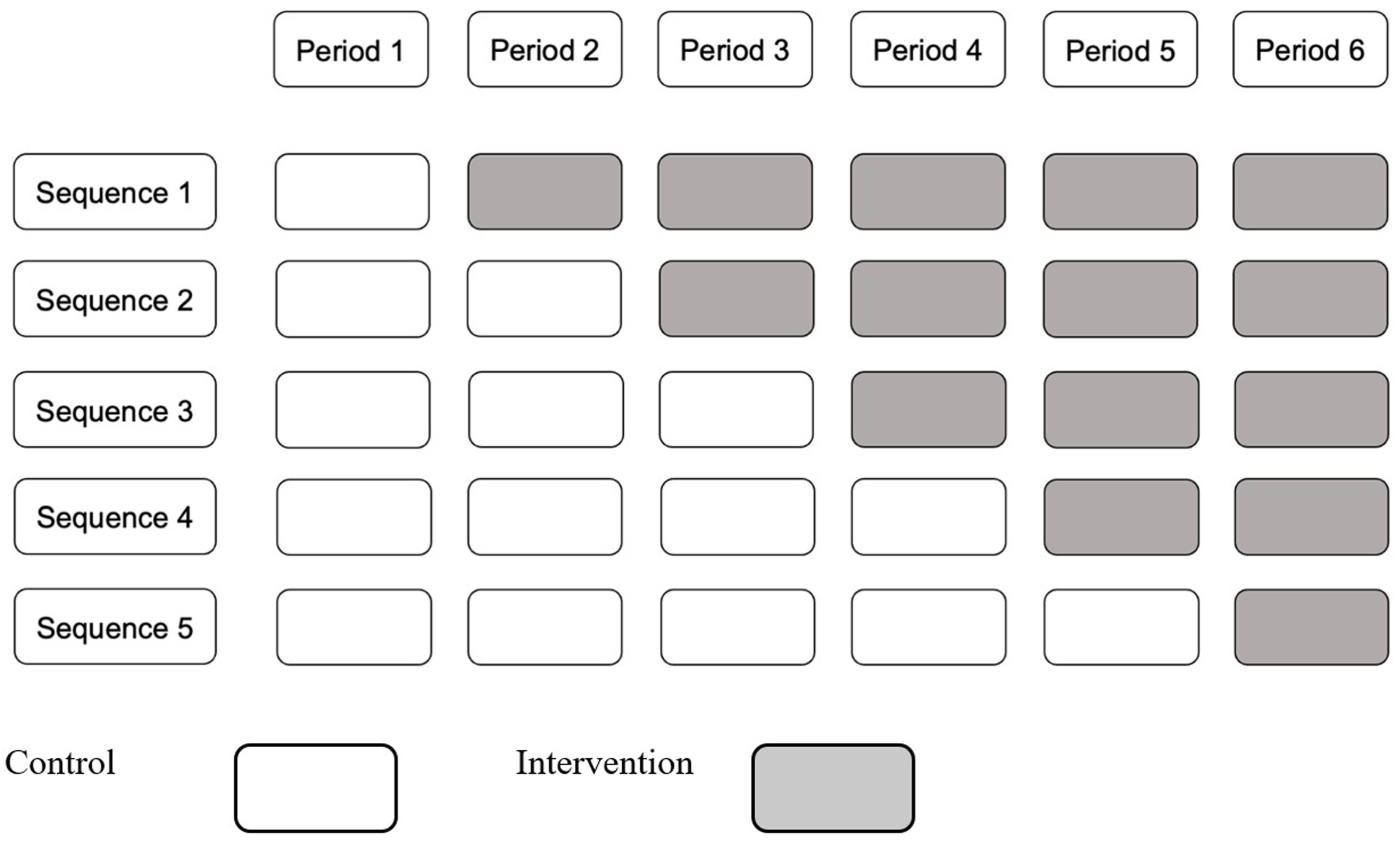
Illustration of a stepped wedge design, with five sequences, six periods.
A commonly used analytical model for stepped-wedge cluster randomized trials (SW-CRTs) is the linear mixed model, 5 which accounts for the ICC through the specification of random effects. The specification of random effects induces particular within-cluster correlation structures for the marginal distribution of the outcome vector for each cluster. Three popular forms of correlation structures induced by the specification of random effects are the exchangeable (EXCH), 4 nested exchangeable (NE),6,7 and discrete-time decay (DTD) structures. 8 Sample size and power calculation software are available for SW-CRTs.9–12 The choice of different random-effects structures and hence the correlation structures could impact both sample size calculations and statistical inference.5,13,14 The exchangeable model arises from a single random intercept for clusters and implies a common ICC both within and across periods. 2 The nested exchangeable model arises from a model with a random intercept and an additional random cluster-by-period interaction effect. This correlation structure allows researchers to distinguish a within-period ICC (correlation between measurements from two individuals in the same cluster-period) and a constant between-period ICC (correlation between measurements from two individuals in the same cluster but different periods). 6 The ratio of the within- and between-period ICCs is defined as the cluster autocorrelation coefficient (CAC) and is generally smaller than one (i.e. when the variance component for the random cluster-by-period interaction is greater than zero). 6 Finally, the DTD model assumes that the between-period ICC decays exponentially by period and arises from a first-order autoregressive (AR(1)) random-effects specification. 8 In this model, the CAC measures the decay rate per period. 8 In addition to these three types of correlation structures, it has also been recommended to allow for cluster-treatment effect heterogeneity, that is, to allow the treatment effect to vary across clusters by including a random cluster-by-intervention interaction effect.15,16
The existing literature has demonstrated the potential impact of random-effects misspecification in linear mixed models and generalized linear mixed models. Frequently, the random effects are assumed to follow normal (Gaussian) distributions, which can be incorrectly specified when their true distributional forms deviate from normality. 17 Litière et al. 18 showed that under an individually randomized design, error distribution misspecifications can either over- or under-estimate power and could substantially inflate the type I error rate. In SW-CRTs, rather than error distribution misspecification, random-effects misspecification can also occur when certain random effects are omitted (e.g. assuming an exchangeable correlation structure when a decay parameter is needed). 19 In this article, we focus on this latter type of misspecification and empirically explore methods that can maintain the validity of inference under such misspecification. In practice, investigators are often faced with an array of modeling choices without clear guidance as to which random effects or correlation structures they should choose. When the true random effects component is unknown, the final choice may depend heavily on subject-matter expertise and/or subjective judgment. Hui et al. 20 empirically demonstrated the sensitivity of linear mixed model inference to the random effects choices with clustered data. Voldal et al. 21 examined the implications of misspecified correlation structures in SW-CRTs (with linear mixed models) and showed that misspecification affects both type I error rates and the efficiency of the treatment effect estimator. Although some guidance has recently been provided on the selection of a correlation structure using information criteria for continuous outcomes, adequate selection performance requires a large number of clusters, and the validity of post-selection inference in SW-CRTs has not been sufficiently investigated. 22 In fact, since the true correlation structure for any application is always unknown, it is also impossible to assess the impact of correlation structure misspecification for any given application.23,24 In addition, even if researchers believe a more complex model is appropriate, it may not be possible to fit a more complex model, as SW-CRTs often have a small number of clusters25,26 and computational challenges may arise.
A potential solution to misspecification has been provided under the generalized estimating equations (GEEs) framework,
27
where researchers may utilize the robust variance estimator (RVE), sometimes referred to as the sandwich variance estimator, to consistently estimate the sampling variance of the treatment effect estimator in an assumed marginal model for the mean of the outcome.28–30 Although RVEs have been implemented in mixed-effects models and previous studies have hinted that RVEs might be used to maintain the validity of inferences under misspecified random-effects structures,21,31 the performance of RVEs in mixed-effects models has not been empirically examined in the context of SW-CRTs, and there has been no recommended practice for their use to date. Given the popularity of the mixed-effects model in SW-CRTs,5,32 we investigated the performance of RVEs under different types of misspecified random-effects structures. Furthermore, as SW-CRTs often have a limited number of clusters, and several modified versions of RVEs with small-sample corrections have been proposed, we also explored the performance of small-sample corrections that are currently available in standard software for mixed-effects models—in particular, the R software package. Therefore, our objectives were to conduct an extensive simulation study to address the following emerging questions:
First, does the use of RVEs in linear mixed models lead to valid inferences for the estimation of the intervention effect when the random-effects structure is misspecified, even in the most severe form of misspecification, that is, with a simple exchangeable correlation? Second, if small-sample corrections are required to maintain statistical properties with a small number of clusters, which available small-sample corrections in linear mixed model perform the best when using RVEs under random-effects misspecification?
The remainder of the article is organized as follows. In Section 2, we review the RVEs that are currently available in the R package “clubSandwich” for mixed-effects models. In Section 3, we present the results of a simulation study to investigate the performance of these RVEs for SW-CRT across a range of scenarios. In Section 4, we demonstrate the use of RVEs in a real data example. Section 5 concludes with a discussion.
Model and notations
We review some general notation and linear mixed model formulations in the context of the multilevel data structure. Commonly used linear mixed models in SW-CRTs are special cases of this general model formulation.
5
Let


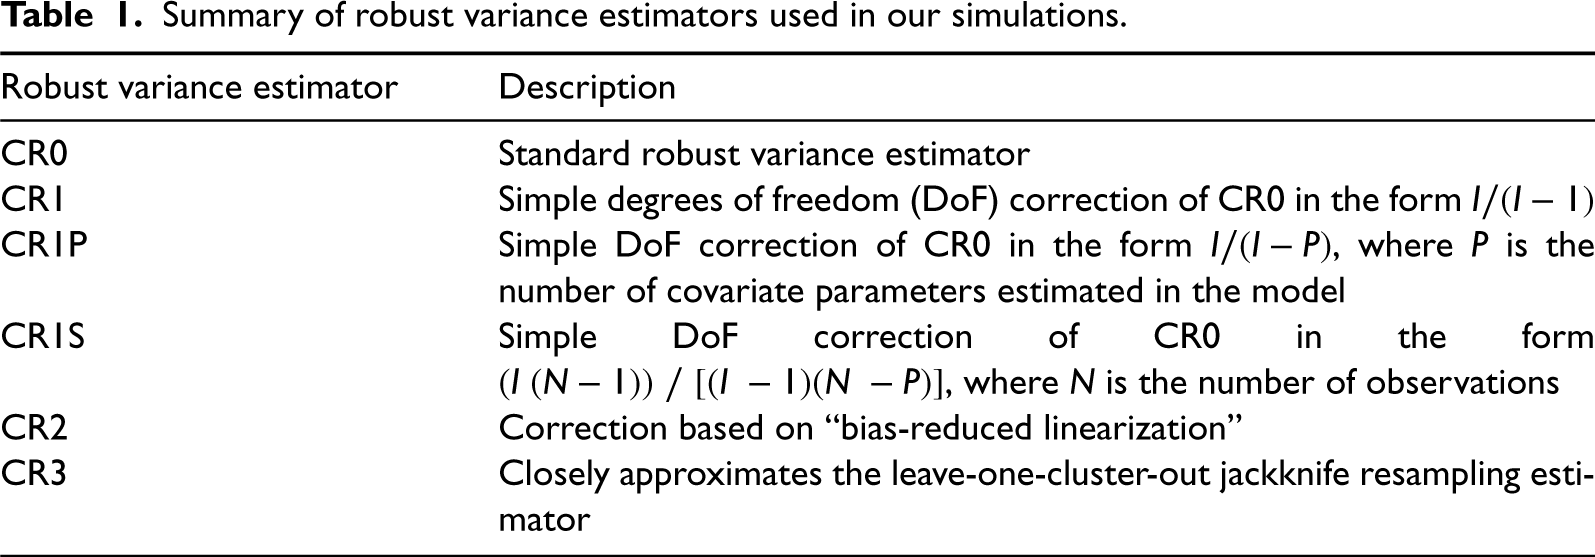
A simple small sample correction is to adjust the CR0 variance estimator by different degrees of freedom (DoF) corrections. In “clubSandwich,” there are three types of DoF corrections: (1) correct the standard RVE by
Bias-reduced linearization and approximation of jackknife estimator
In addition to the DoF correction, a common correction is to use resampling methods, such as jackknife resampling estimators.42–44 Mancl and DeRouen
36
proposed a bias-reduced correction by deriving an approximation for the bias of


Summary of robust variance estimators used in our simulations.
In this section, we report the results of a simulation study to determine whether utilizing RVEs can help to maintain valid inference when the correlation structure has been incorrectly specified in SW-CRTs and to identify which specific RVE performs best under different scenarios, including with a limited number of clusters.
Trial design
We considered the standard SW-CRT design with cross-sectional measurement, assuming I clusters, S sequences, and
Data-generating process
We assumed a continuous outcome and generated data under two different models: (1) the discrete-time decay with random intervention (DTD-RI) model and (2) the nested exchangeable with random intervention (NE-RI) model. Both data generators share the same mean model (i.e. fixed effects) and only differ in their random effect structures. While we explicitly write out each data generator below, we refer to Li et al.
5
for a unified model representation that includes these two data generators as special cases with different specifications of the random-effects structure.
DTD-RI model: The DTD-RI model can be written as
NE-RI model: The NE-RI model can be written as
where

This model has an additional random intercept for the cluster and is denoted as 
The definitions for the ICCs under both models are summarized in Table 2; also see Ouyang et al. 14 for a more detailed exposition of the definition of ICCs in simpler models without the random intervention effect. Notice that, due to the inclusion of random intervention effects, the definitions of the within- and between-period ICCs are different under control and intervention conditions. Furthermore, the interpretation of the CAC under the control condition is different for models (1) and (2). In the nested exchangeable model, the CAC is fixed regardless of the distance between periods, whereas, in the exponential decay model, the CAC is the fixed decay rate per period. The original definition of the CAC, namely the ratio of the between- to within-period ICCs, is still applicable under both intervention and control conditions. We emphasize that an extra term for the random intervention effect must be added to the ICC definition under the intervention condition, and the inclusion of a random intervention effect induces between-arm heterogeneity.
Summary of within-period and between-period intracluster correlation coefficients under data generating models.
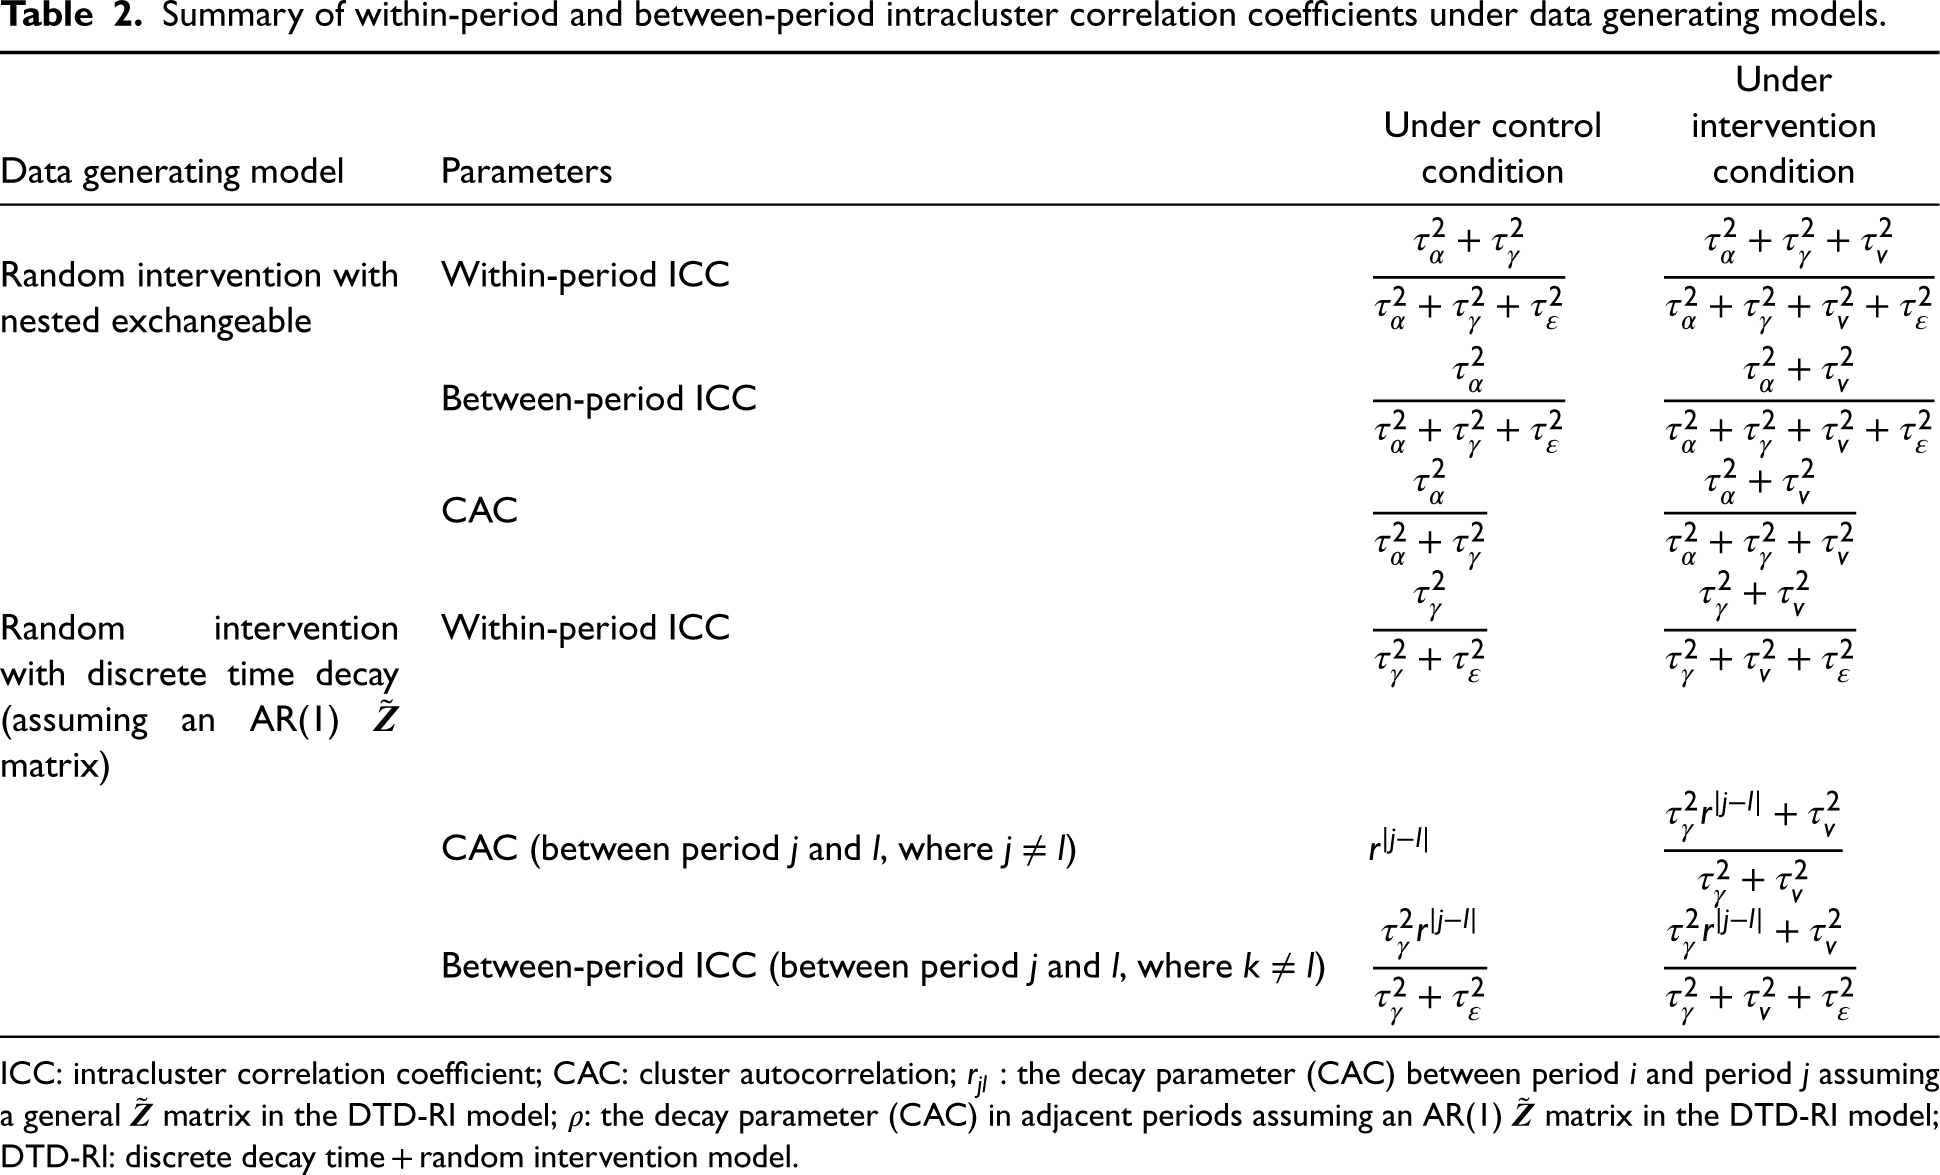
ICC: intracluster correlation coefficient; CAC: cluster autocorrelation;
We chose simulation parameters (i.e. number of clusters, correlation parameters, and cluster sizes) based on published literature. The assumed values are summarized in Table 3. For example, Nevins et al.26,48 conducted a review of 160 published SW-CRT and found that the median number of clusters was 11 with first and third quartiles of 8 and 18. Furthermore, Korevaar et al.
49
presented a database of estimated correlation parameters from reanalyzing multiple SW-CRTs and found that ICC (depending on the correlation structure) tended to range between 0.01 and 0.1 and a typical CAC value was 0.8. We therefore generated data with
Range of trial configuration and simulation parameter values under random intervention with nested exchangeable correlation structure model.
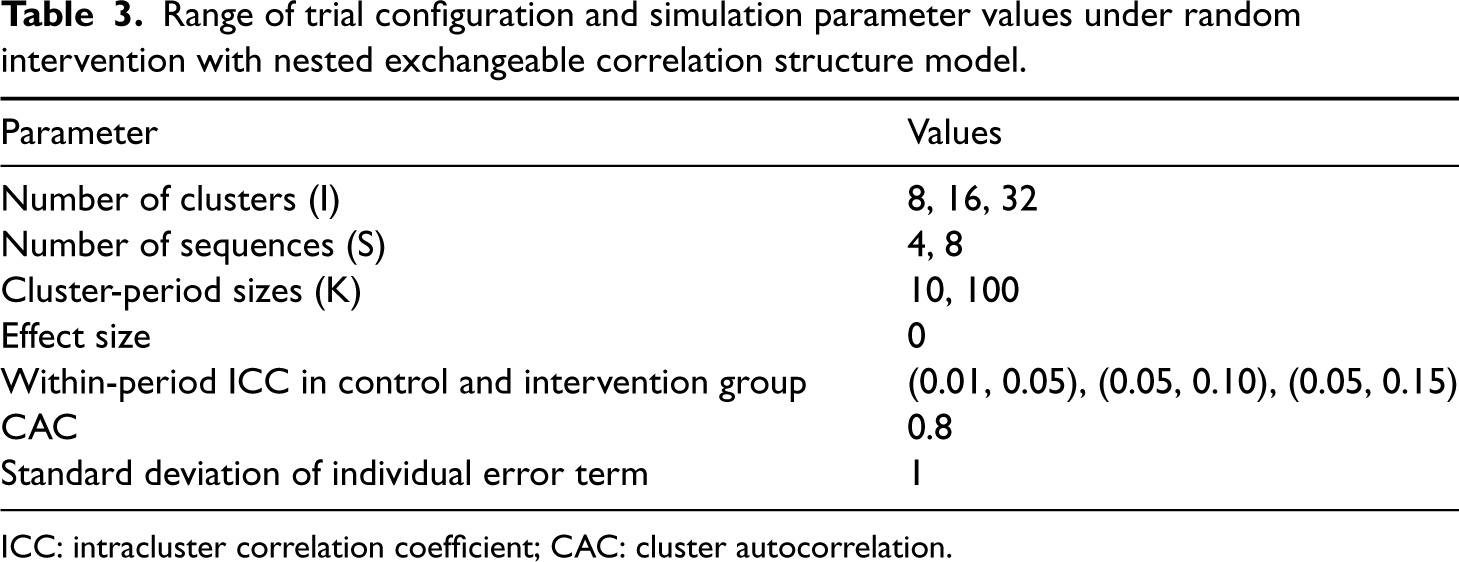
Range of trial configuration and simulation parameter values under random intervention with nested exchangeable correlation structure model.
ICC: intracluster correlation coefficient; CAC: cluster autocorrelation.
Each simulated dataset was analyzed with (1) the correctly specified model (either DTD-RI or NE-RI), and then with two misspecified models: (2) EXCH and (3) NE, each with and without RVE. We estimated six different RVEs (see Table 1) under each mixed-effects model (described in Section 2.4) using “clubSandwich” (version 0.5.10) in the R package. In total, for each simulated dataset, there were 15 fitted models. All models were fitted using “lmerTest” in R 50 with the exception of the DTD-RI model which was fitted using “glmmTMB” in R. 51 All models were fitted with their default non-linear optimizers. As an ad hoc analysis, the NE-RI models were also fitted using bound optimization by quadratic approximation (“bobyqa”) in an attempt to improve the convergence rate. 52
The definitions of the performance measures of interest are shown in Table 4. We first calculated the bias of the estimated time-invariant treatment effects. Then, we recorded the empirical (Monte Carlo) standard error (SE) of the estimated treatment effect as well as the average SE (from models with and without RVEs) and the percentage error in the averaged model-based SE (SE estimate from a model) relative to the empirical SE. The coverage of 95% confidence intervals (CIs) for the treatment effect was assessed over repeated data generations.
Summary of performance measures.
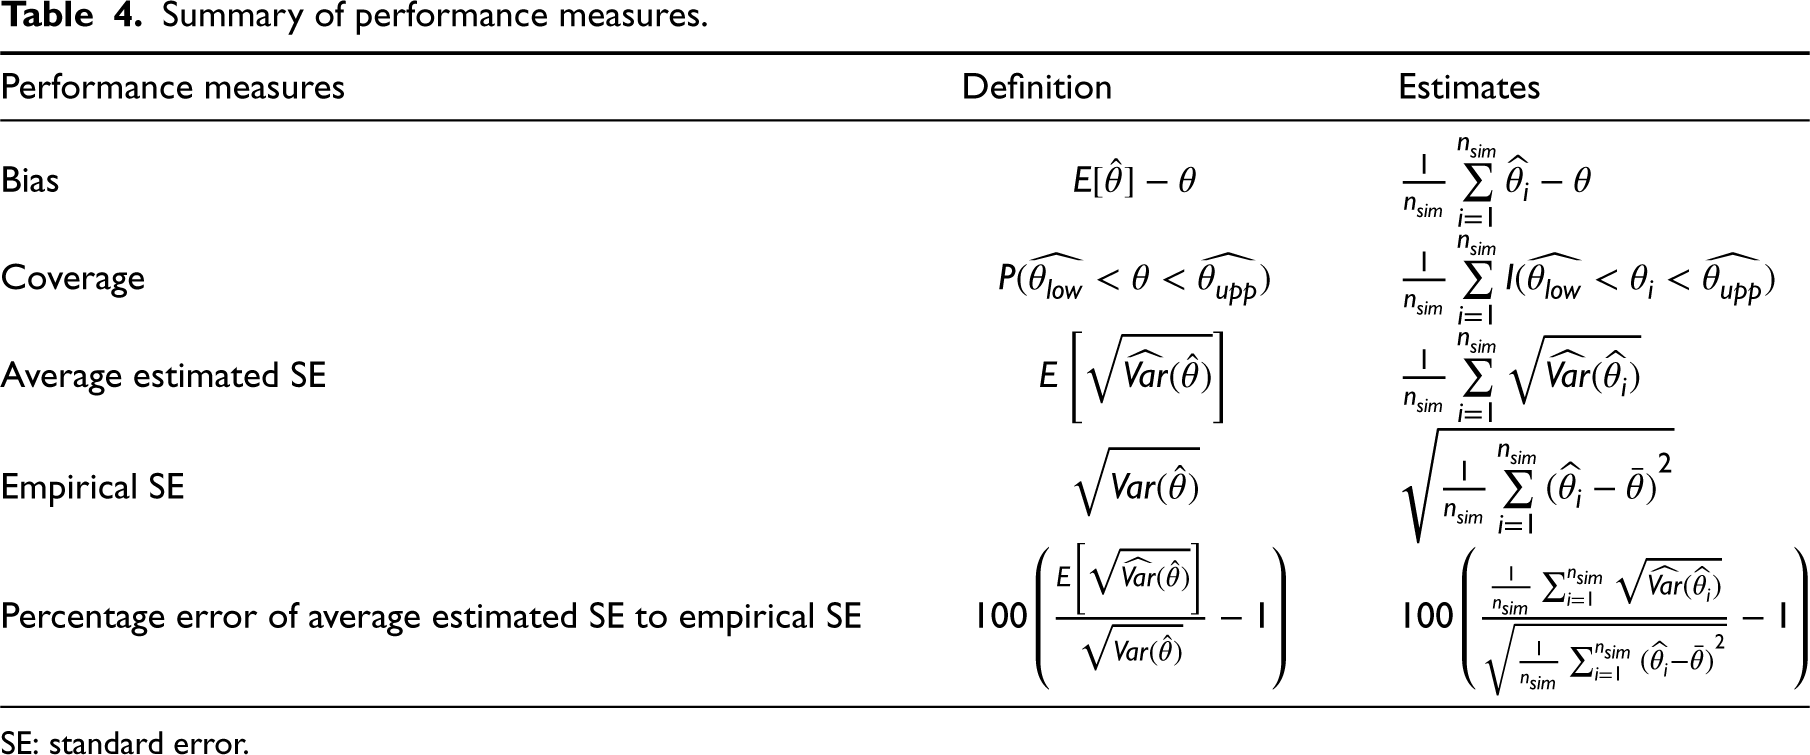
Summary of performance measures.
SE: standard error.
For each trial configuration, we simulated 2000 datasets. This allowed us to control the Monte Carlo standard error (MCSE) to within
With a small number of clusters, studies have shown the need to correct the asymptotic normal approximation for Wald tests. For all our assessments of inferential properties (e.g. 95% CI coverage), we used a
Simulation results
Bias of the estimated treatment effects
Not surprisingly, since we used linear mixed models with correctly specified models for the conditional mean outcome (fixed-effects component), the estimated treatment effects were unbiased across all trial configurations, even if the random effects structure was misspecified.21,58 The details are presented in Supplemental Table S1.
Coverage probabilities of 95% confidence intervals
Data generated from the DTD-RI model
We first present simulation results with data generated from the DTD-RI model. The SEs of estimated treatment effects from the different fitted models varied substantially. As expected, misspecified random-effects structures (e.g. EXCH and NE) without RVEs produced smaller (but biased) average model-based SEs, which led to the coverage probabilities being smaller than the nominal 95% level. In Figure 2, we show the coverage probabilities of 95% CI obtained from the EXCH and NE models with and without RVE, and from the true models (based on model-based SE). Each quarter-block of Figure 2 presents the 95% CI coverage for various combinations of within-period ICCs, number of sequences, and cluster period sizes, together with Monte Carlo bounds around 95% coverage. For example, the first quarter of Figure 2, (the top-right four mini-panels) present comparisons between models with and without RVEs, first under exchangeable (EXCH) and then under nested exchangeable (NE) correlation structures. We only present results for ICC combinations of (0.01, 0.05) and (0.05, 0.15). The results for the ICC combination (0.05 and 0.10) are presented in Supplemental Table S2. The results show that the misspecified models with model-based SE estimators were generally not able to reach 95% coverage. Both the EXCH and NE models without RVEs had similar coverage when
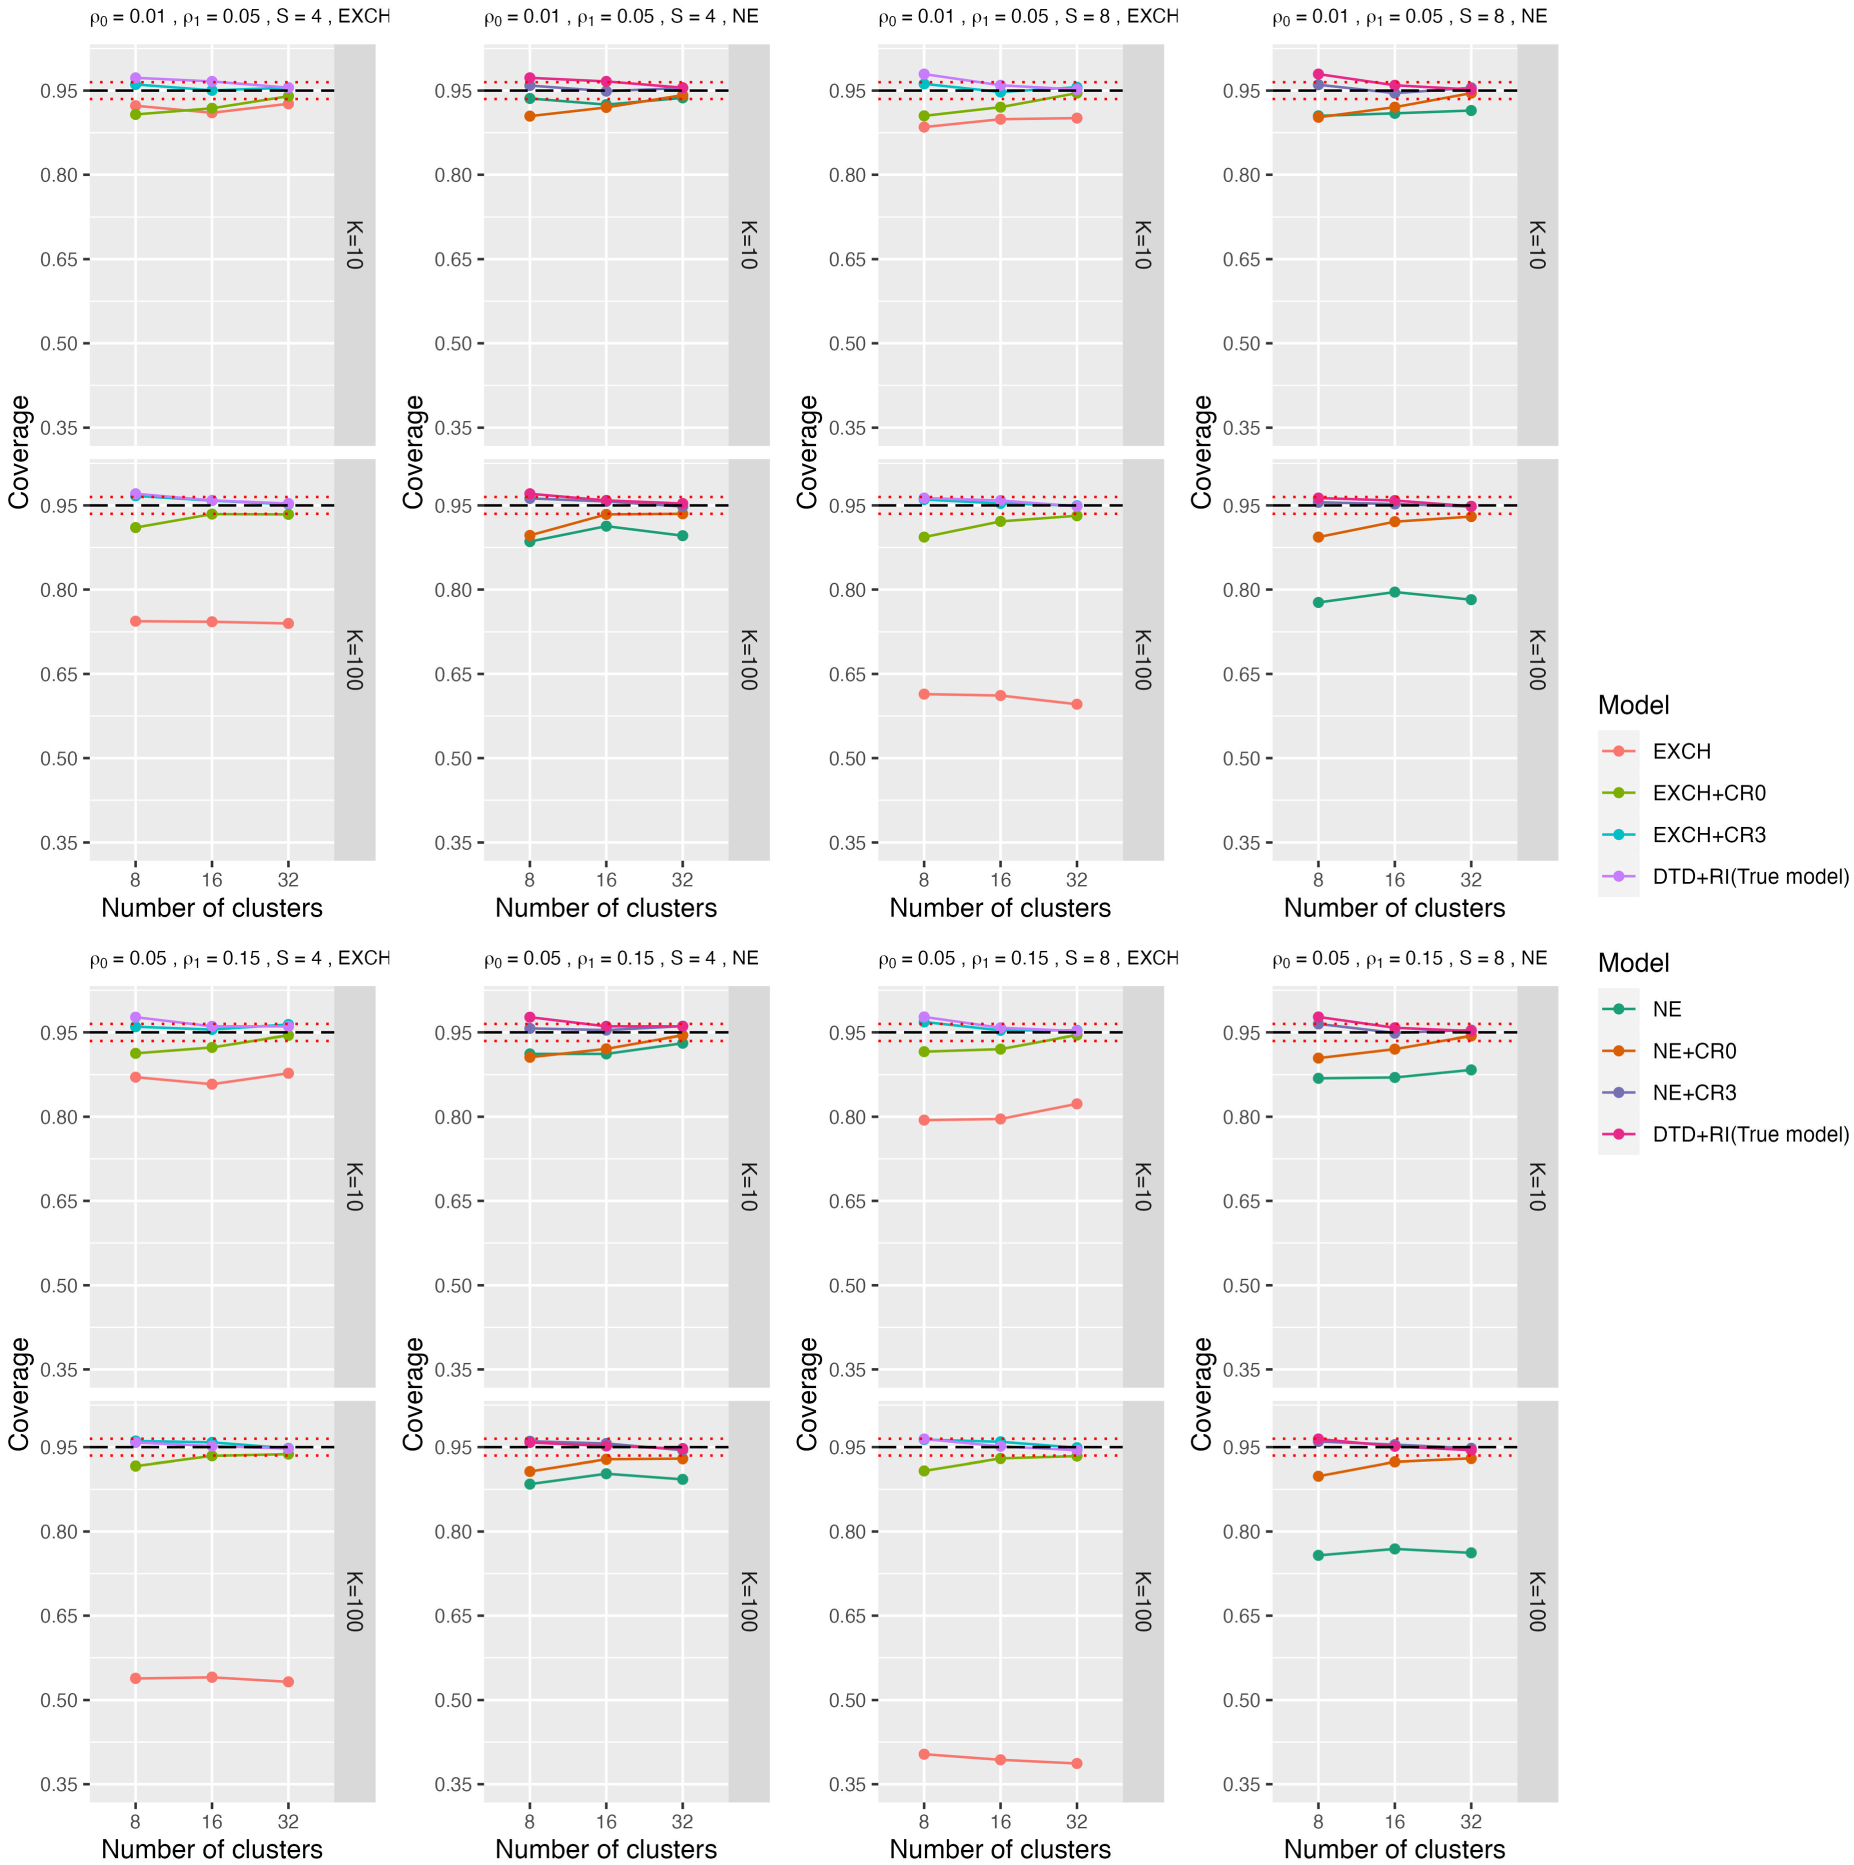
Coverage probability of 95% confidence intervals for the treatment effect under both the true model and misspecified models with or without RVE when data were generated under DTD-Rl. CR0 is the standard robust variance estimator, and CR3 closely approximates the leave-one-cluster-out jackknife resampling estimator. The three dashed lines represent the 95%
To investigate the performance of RVEs in finite samples, Figure 2 also presents the coverage probabilities under CR0 (standard RVE) and CR3 (the RVE of approximating the leave-one-cluster-out jackknife variance estimator), respectively, compared to coverage under the true model. We chose to focus on the presentation of results for these two RVEs because CR0 is the standard RVE, and CR3 had the best performance among all RVEs we investigated. In general, the coverage probabilities tended to be closer to 95% when using RVEs than without RVEs. CR0 did not always reach a nominal 95% coverage, even with 32 clusters. Therefore, small sample corrections are generally required to maintain the validity of misspecified linear mixed models in SW-CRTs. Corrections with a simple DoF (CR1 and CR1S) led to coverage probabilities much lower than the nominal 95%. The bias-reduced linearization (CR2) had better coverage and produced decent coverage probabilities in some cases. However, it generally had underestimated SEs, leading to likely under-coverage with 16 clusters. CR1P consistently led to coverage probabilities over 96% and overestimated SEs (Supplemental Tables S2 and S3). It is important to note that CR1P (with correction
The results when the data were generated from the NE-RI model are similar to those from DTD-RI. In Figure 3, we present the coverage probabilities of 95% confidence intervals obtained from the misspecified EXCH and NE with and without RVE, and the true NE-RI models. Since the NE-RI is basically the NE model with a random intervention effect, the performance of the NE model with the model-based SE estimator would be associated with the standard error of the random intervention across clusters (the NE model under the ICC combination of (0.05, 0.15) shows worse performance due to larger
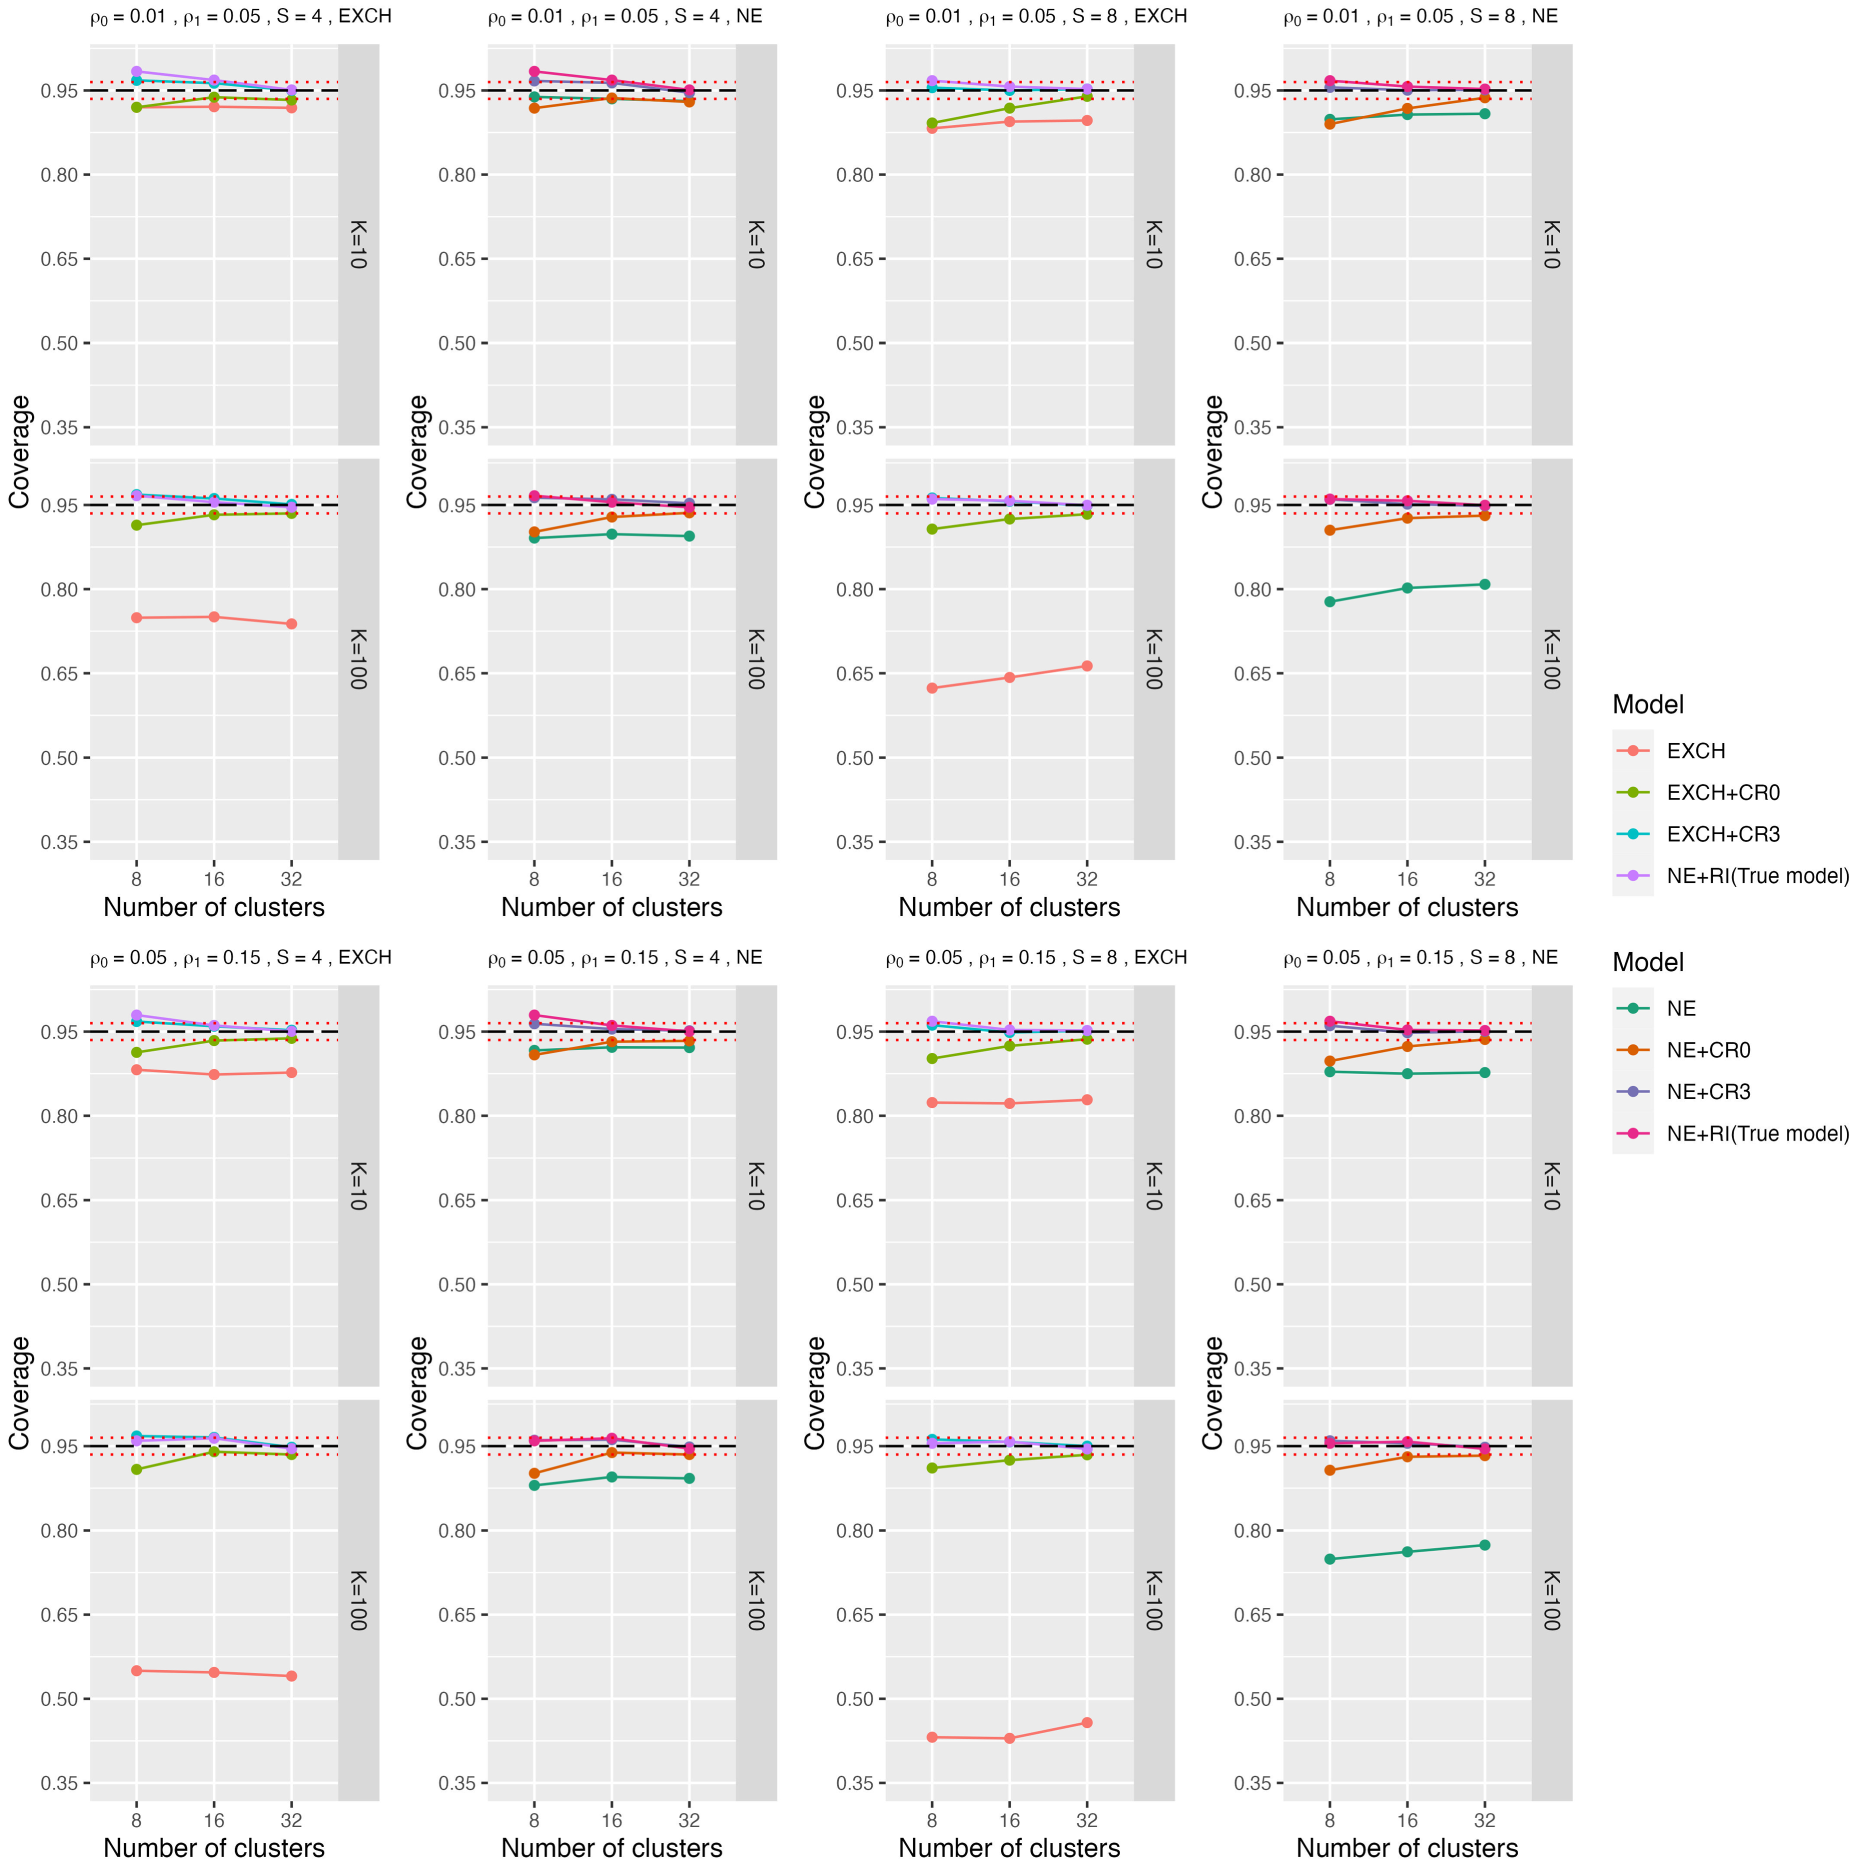
Coverage probability of 95% confidence intervals for the treatment effect under both the true model and misspecified models with or without RVE when data were generated under NE-Rl. CR0 is the standard robust variance estimator, and CR3 closely approximates the leave-one-cluster-out jackknife resampling estimator. The three dashed lines represent the 95%
DTD-RI model
Supplemental Table S3 summarizes the percentage errors of model-based SE to empirical SE under all models. When the data were analyzed using misspecified models without RVE, the standard errors were often underestimated by over 60%. Relative errors decreased substantially when RVEs were used. In Supplemental Figure S1, we compare the percentage error of model-based SEs from CR0 and CR3 to the true models. Across simulation scenarios, the patterns were similar to those presented for coverage probabilities: the correction by CR0 was too small, and standard errors were underestimated by over 24%. CR3 had the smallest relative errors compared to other types of RVEs, although the error could still be as high as 8% when the number of clusters was only eight. The overestimate of SEs indicates a potential loss in efficiency after applying RVEs. When the number of clusters was larger (e.g. 16 or 32), the relative error was usually within 5% and could be as low as 1%. Comparing across all RVEs, CR3 had relative errors closest to the relative errors obtained by fitting the true models (based on the model-based SE).
NE-RI model
We observed similar results when the data were generated from the NE-RI model. In Supplemental Figure S2, we present the percentage error of model-based SE to empirical SE for both true model and misspecified models with CR0 and CR3.
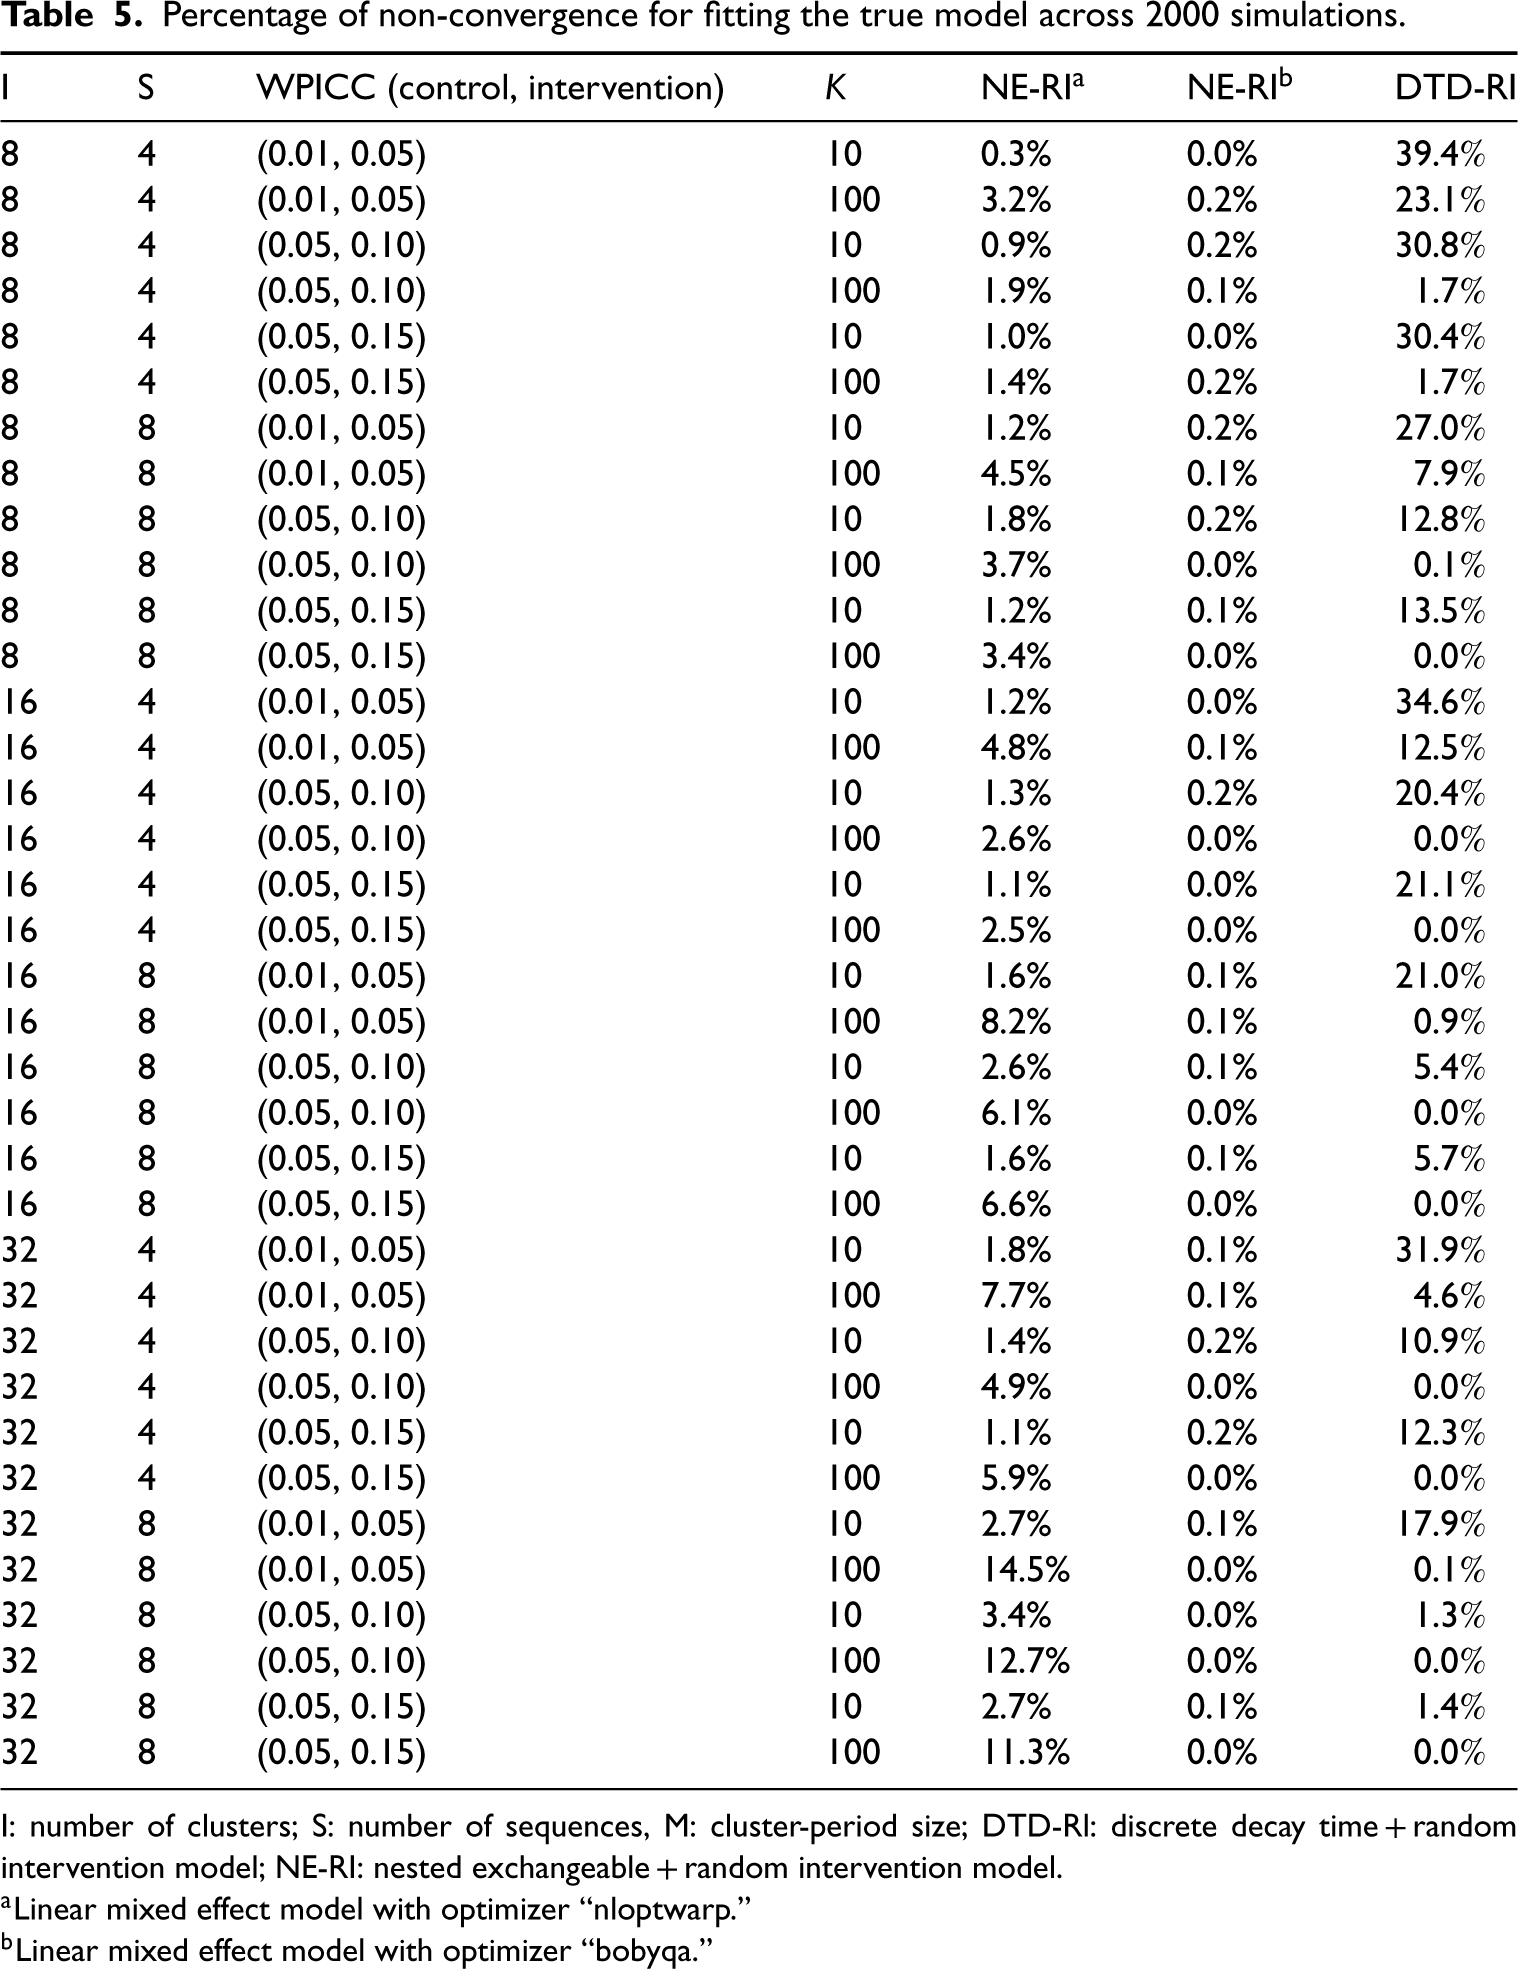
Prevalence of non-convergence
In our simulations, we excluded results when models did not converge. Table 5 summarizes the percentage of non-convergence for each trial configuration by model. Generally, when all other parameters remain the same, larger cluster-period sizes K tend to have larger non-convergence rates whereas a larger number of clusters tend to have smaller non-convergence rates. The proportion of non-convergence was as high as 39% for DTD-RI when the number of clusters and cluster-period sizes were both small (in the most extreme scenario we investigated). Under the default optimizer (“nloptwarp”: nonlinear optimizer), non-convergence for the NE-RI models was as high as 15%. However, with bound optimization by quadratic approximation (“bobyqa” optimizer), the non-convergence rate was close to zero, suggesting that this is a promising optimization routine for fitting more complex linear mixed models in SW-CRTs. As the “nloptwarp” option is a nonlinear version of the “bobyqa” option, the better convergence rate may be explained by the simpler optimization tolerance parameters required by “bobyqa.”
Percentage of non-convergence for fitting the true model across 2000 simulations.
Percentage of non-convergence for fitting the true model across 2000 simulations.
I: number of clusters; S: number of sequences, M: cluster-period size; DTD-Rl: discrete decay time + random intervention model; NE-RI: nested exchangeable + random intervention model.
Linear mixed effect model with optimizer “nloptwarp.”
Linear mixed effect model with optimizer “bobyqa.”
As suggested by reviewers, we conducted additional analysis with selected scenarios to evaluate the statistical power of linear mixed models with RVEs. In addition, we compared the performance of the linear mixed model with RVE with alternative robust analytical methods (GEE and permutation test) that researchers proposed in the literature.
Statistical power
As an additional set of evaluations, we compared power when using linear mixed models with CR3 and the true model under selected scenarios. Specifically, we considered 6 scenarios for each data generator (12 scenarios in total), including a combination of various factors such as the number of clusters (8 and 32), sequences (4), and ICC values ((0.01, 0.05), (0.05, 0.10), (0.05, 0.15)). The results are presented in Supplemental Table S5. We primarily focus on CR3 because it has comparable coverage probabilities to the true model and the size of the test is generally well maintained to the nominal level. We observed that the loss of statistical power in the RVE (CR3) model is minimal when the number of clusters is 32 and is less than 10% when the number of clusters is only eight.
Comparison with GEE and permutation tests
Both GEE and permutation tests have been used in stepped wedge trials for robust inference and to protect potential random-effects misspecification.54,59 Under the 12 scenarios mentioned in the above section, we conducted additional simulations (Supplemental Table S6) to show that bias and coverage probabilities under linear mixed models (CR2 and CR3) were very similar to those under GEE (KC and MD).
Similarly, we compared the coverage probabilities under linear mixed models (CR2 and CR3) with the permutation test. We implemented the permutation test for SW-CRT suggested by Ren et al. 60 The test statistic was defined as the estimated treatment effect under the fitted linear mixed effect model. The permutation test was implemented as follows. We first estimated the test statistics from the observed allocation. Then, by randomly “shuffling” the randomized treatment sequences among all clusters, we generated 1000 permutations from all possible randomized allocations. The permutation distribution of the test statistic was obtained by estimating the treatment effects from the permuted datasets. We rejected the null hypothesis if the test statistic computed from the observed dataset is either smaller than the 2.5th percentile or larger than the 97.5th percentile of the permutation distribution. The whole process was repeated with 500 simulated datasets. The results, presented in Supplemental Table S7, show that the permutation test consistently gave inflated type I errors. These results are expected as we were investigating the performance of the permutation test when the data-generating process includes a random treatment effect; therefore, in each simulated data, only the weak null holds but not the sharp null. While the permutation test should still be valid as advertised with respect to a sharp null, it can carry an inflated type I error rate when only the weak null holds.
Illustrative example
This section presents a real example to demonstrate the application of the different models considered in this article. OXTEXT-7 was an open cohort SW-CRT involving 11 community mental health teams in the Oxford Health NHS Foundation Trust to assess the effectiveness of a program: “Feeling Well with TrueColours” (an intervention originally used for individuals with bipolar disorder) in producing better health outcomes for participants in their care.61,62 Teams were assigned at random to receive the intervention throughout 16 months. The Health of the Nation Outcome Scales (HoNOS) total score (continuous) was the primary outcome and was measured monthly, primarily on different people. There were 4595 observations with an average cluster period size of 26. Since the expected churn rate is close to 1 (0.91), for simplicity, we treated this trial as a cross-sectional design in the analysis. 63
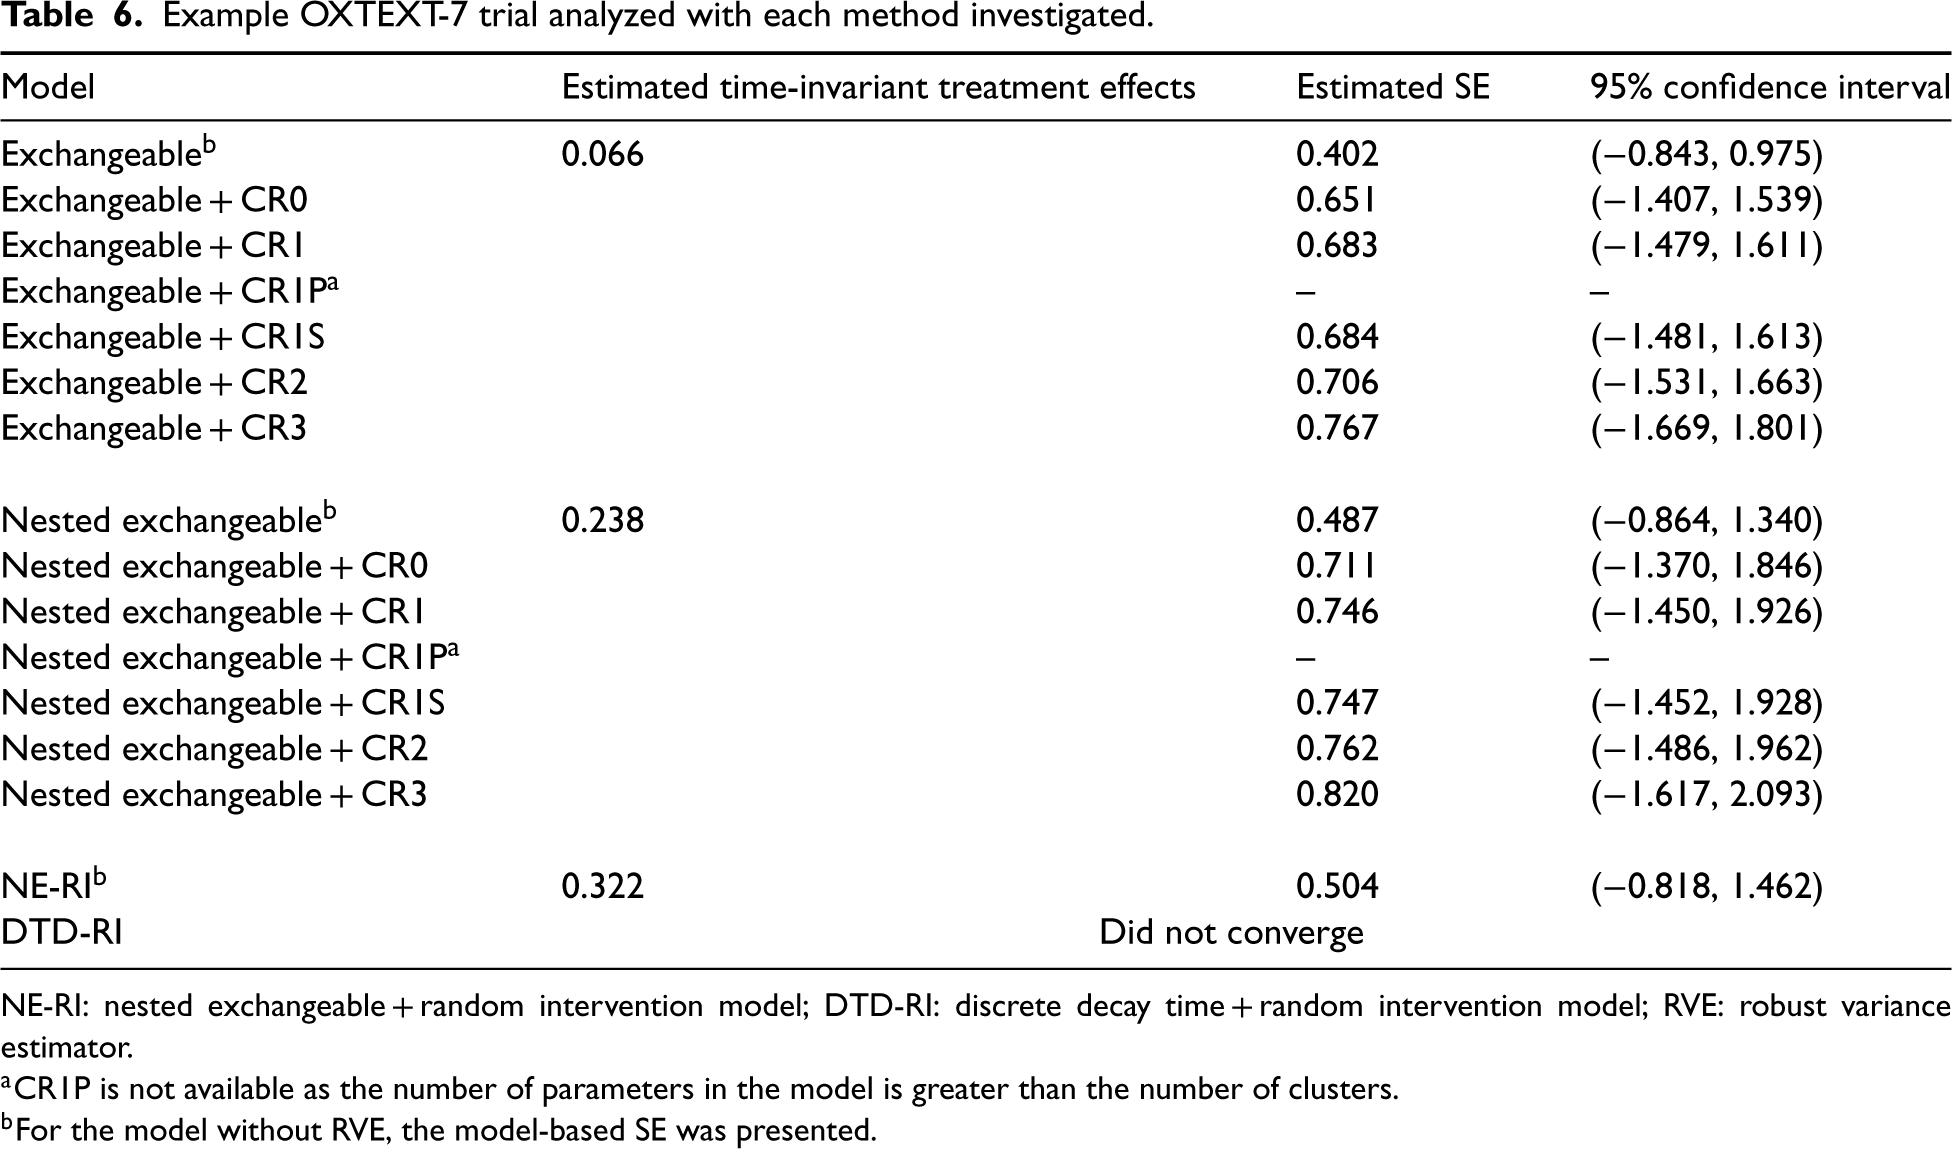
Table 6 shows the estimated time-invariant treatment effect, model-based SE, and 95% CI for the treatment effect for OXTEXT-7 under all models investigated in the simulations. For models without RVEs, the NE model produced higher SEs. Even though the point estimates slightly differed across the two models, all 95% CIs included zero. Clearly, SEs under EXCH and NE models without RVE were smaller than with any RVE. In this case, it might suggest some degree of random-effect structures misspecification, and hence overly optimistic model-based SE estimates. The RVE results were generally similar across working model specifications for this application. When adding the RVEs, the SE correction for small samples resembled what we saw in our simulations. Not surprisingly, the standard error produced by CR0 was the smallest, but our simulations show that this choice could lead to under-coverage with a small number of clusters, and CR3 is the recommended method. RVEs were generally larger in the NE model (which may be explained by the larger number of random cluster-by-time interactions required by the NE model); however, the CIs were generally similar. When we fitted the RI model, the model-based SE was still much smaller than that under the RVE. This may suggest that the true data generator deviates from the RI model, and based on our simulation results, the RVE, in theory, should be consistent regardless of the random-effects structure specification (assuming the correct fixed-effects specification such that the true treatment effect is time-invariant) and serves as an objective reflection of the uncertainty in the treatment effect estimates. In this example, the DTD-RI model failed to converge. Since the number of periods was larger than the number of clusters, some corrections (e.g. CR1P) would not be available if we treated the period as a categorical variable. One could treat the period as a continuous variable in the analytic model to obtain CR1P, and the impact of this change, particularly for the RVE, is worthy of future investigation.40,64,65
Example OXTEXT-7 trial analyzed with each method investigated.
Example OXTEXT-7 trial analyzed with each method investigated.
NE-RI: nested exchangeable + random intervention model; DTD-RI: discrete decay time + random intervention model; RVE: robust variance estimator.
CR1P is not available as the number of parameters in the model is greater than the number of clusters.
For the model without RVE, the model-based SE was presented.
One caveat in our illustrative application is that we have assumed that the true treatment effect structure is constant and time-invariant. Although this is the primary focus of our simulation study, this simple treatment effect structure might not hold true for OXTEXT-7, as implied in the reanalysis of Nickless et al. 62 We wish to reiterate that the use of RVEs in linear mixed models may not address the systematic bias that may arise from the incorrect specification of the treatment effect structure (such as specifying a time-invariant treatment effect in the presence of a true exposure-time-specific treatment effect).66,67 We leave a comprehensive examination of small sample variance corrections under the general time-on-treatment linear mixed model for future research.
Summary of main findings
We examined by simulation whether the use of RVEs in linear mixed models can help maintain valid statistical inference under random-effects structure misspecification when the true data are generated under either DTD-RI or NE-RI. Furthermore, we examined the performance of RVEs under five small-sample corrections (available in the R package “clubSandwich”) when the number of clusters is limited, which is common in SW-CRTs. We confirmed, as expected with linear mixed models, that misspecification of the correlation structure generally does not introduce bias to the estimated treatment effects. However, random effects misspecification substantially affected the standard errors of estimated treatment effects. This was reflected in large relative errors of model SEs and under-coverage. When the linear mixed model was misspecified, model-based SEs generally underestimated the (true) Monte Carlo SE by 60%. The coverage probability of 95% confidence intervals for the estimated treatment effect dropped to around 50% in misspecified models without RVEs. Similar results have been noticed in previous studies. For example, Kasza and Forbes 24 showed analytically that fitting a simpler correlation structure would lead to an underestimated model-based SE. Our simulation results also confirmed results by Bowden et al. 23 and Voldal et al. 21 that failing to include random treatment effects would lead to an underestimated (model-based) variance of the treatment effect causing lower coverage (or equivalently, inflation of type I error rates). Beyond confirming these findings, our simulations provide compelling evidence that adding RVEs generally improved the validity of statistical inference for a misspecified linear mixed model. This has not been thoroughly discussed in previous literature in the context of SW-CRTs. It is important to notice that even a simple exchangeable model with RVEs (with small-sample correction) has acceptable performance with respect to bias and coverage in SW-CRTs. Adding extra random effects (e.g. using an NE model) did not appreciably improve the model performance in terms of bias and coverage. Regardless of the true data generation mechanism, the performance of different types of RVEs was very similar. Finally, we also wish to point out that although we have only considered DTD-RI and NE-RI as two data generators, our findings should be generalizable to other types of linear mixed data generators as the RVE, in theory, converges to the true variance of the treatment effect estimator under arbitrary random-effects misspecification (assuming the same fixed-effect model).
In the stepped wedge design literature, it is well-known under the GEE framework that the standard RVE could underestimate the variance when the number of clusters is small.
68
Unfortunately, this has not been as widely appreciated for linear mixed models and has led to reservations about adopting linear mixed models with a simple random-effects structure for data analysis. Our study has empirically demonstrated that the RVE can help maintain the validity of inference under a potentially misspecified linear mixed model, and to some extent, provides a path forward in practice when it might be challenging to correctly specify a complicated random-effects structure for SW-CRTs. In our simulations, the number of clusters was the most important factor that affected the performance of RVEs. The relative error of the model SE produced by using standard RVE (CR0) without small sample correction could still be as high as −22%, and the coverage probability could be as low as 83%. In fact, with fewer than 32 clusters, we found that small-sample corrections were essential. Among five types of small-sample correction methods (CR1, CR1P, CR1S, CR2, and CR3), when a trial has a relatively large number of clusters (e.g. 32), all types of small-sample corrections had similar performance. With a small number of clusters, CR2 performed reasonably well and was clearly better than the others but exhibited some mild under-coverage. Using CR3 generally led to similar performance to the true model, small relative errors of model-based SEs, and coverage probabilities close to 95%. In our simulations, we found that models with CR3 (DoF =
Recommendations and limitations
To the best of our knowledge, our study is the first to comprehensively examine the performance of misspecified random-effects structures in linear mixed models with RVEs in the context of SW-CRTs. When the true correlation structure is unknown, we found that a random intercept model with standard RVE (CR0) is usually sufficient to achieve valid inference with at least 32 clusters. A small-sample correction (e.g. CR3) is highly recommended for cases with fewer than 32 clusters. With the number of clusters minus two DoF correction, CR3 achieved appropriate 95% CI coverage with as few as eight clusters, at the expense of a slight overestimation of SEs. Putting our results in the context of the SW-CRT literature, we notice that our findings are slightly different from those obtained from previous simulations of SW-CRTs with GEE estimators. To give a few examples, Li et al.
41
and Li
47
have found that the Kauermann and Carroll variance estimator (the equivalence of CR2 under GEE inference), coupled with the DoF
Historically, GEE is known to be more robust than linear mixed models but usually requires larger numbers of clusters. Our findings empirically demonstrate that linear mixed models may be equally—if not more—competitive than GEE in providing robust analysis of small SW-CRTs. In fact, for continuous outcomes, the performance of GEE and linear mixed models is very similar when the marginal model (fixed effects) is correctly specified: their differences lie in the estimation of nuisance parameters such as the variance components and the correlation parameters. A potential advantage of linear mixed models is that it is generally easier to specify and estimate more complicated random-effects structures, whereas substantial conceptual difficulty and computational burden may be introduced to the formulation and estimation of an equally complex working correlation structure with multiple parameters in GEE. 41 In the analysis of SW-CRTs, there is a potential efficiency advantage in specifying a more complicated correlation structure, especially when the fitted model with RVE is closer to the true model (as also shown in our simulation Supplemental Table S5). For example, when the true model is NE-RI, the nested exchangeable model with RVE has slightly higher power than the exchangeable model with RVE. To specify the former structure beyond simple exchangeability, the linear mixed model is arguably much more accessible and may have a computational advantage over GEE when the cluster size is large. On the other hand, GEE inference may enjoy other advantages such as directly reporting the correlation parameters on the natural scale of the outcomes, and may be particularly preferred for the analysis of binary and count outcomes in SW-CRTs with a non-identity link function.39–41,56 In a pair of recent systematic reviews of 160 published SW-CRTs by Nevins et al.,26,48 70% (112/160) adopted a mixed-effects model in the primary analysis of the primary outcome, likely due to software accessibility and flexibility in specifying the random-effects structure. However, although not examined in the previous systematic review, our experience is that the RVE is infrequently used in practice as it tends to return anti-conservative inferences with a small number of clusters (i.e. the standard RVE tends to have lower than nominal coverage). Therefore, an important contribution of our study is promoting awareness and empirically demonstrating the use of bias-corrected RVE as a reliable tool for robust inference in misspecified linear mixed models in SW-CRTs.
Previous studies have indicated that design-based inference, such as the permutation test, is a powerful tool to provide robust inference under model misspecification. With a limited number of clusters, one clear advantage of the permutation test is that the inferences are exact such that the type I error rate can often be controlled at the nominal level without the need for small sample corrections. For example, Wang and De Gruttola 69 and Ji et al. 70 have considered testing the null hypothesis based on identifying the permutational distribution of the Wald statistic estimated from the simple exchangeable and the nested exchangeable random-effects model. In the same spirit of the use of RVE in our article, they both demonstrated that the specification of the random-effects has little impact on the type I error rate but only affected the power of the permutation test. Alternative test statistics with fewer modeling assumptions in SW-CRTs have subsequently been discussed by Thompson et al., 71 Kennedy-Shaffer et al., 72 Hughes et al., 59 under the principle of conditional exchangeability (which often serves as the basis for permutation inference). Zhang and Zhao 73 further carefully distinguished between the permutation test and the randomization test, and illustrated the practical importance of this distinction with a SW-CRT example. More recently, Ren et al. 60 have found that the permutation test may not protect against all types of random effect misspecification. Specifically, they found that when the true model includes a random intervention effect, but the fitted model did not account for that, the type I error rate of the permutation test based on a Wald statistic was inflated. This matches our additional simulation results and is mainly because the treatment sequence affects both the mean and variance structures, leading to violations of conditional exchangeability even under the null based on the working model with a random intervention effect. In this scenario, however, the use of RVEs based on a misspecified linear mixed model can successfully preserve the validity of inference, and therefore could be preferred. Finally, it is worth noting that the construction of the permutation-based confidence intervals can require substantial computation from inverting the permutation test. As an improvement, Rabideau and Wang 74 recently studied more efficient search algorithms for obtaining permutation confidence intervals for SW-CRTs. In comparison, the construction of the confidence interval based on an RVE is simple and essentially instantaneously computed. We provide in Table 7 of our revision a concise summary of the potential advantages and caveats of using RVEs in mixed-effects models, RVEs in GEE, and permutation tests to provide robust inference in SW-CRTs.
A concise comparison of methods regarding their features for robust analyses of SW-CRTs under model misspecification.
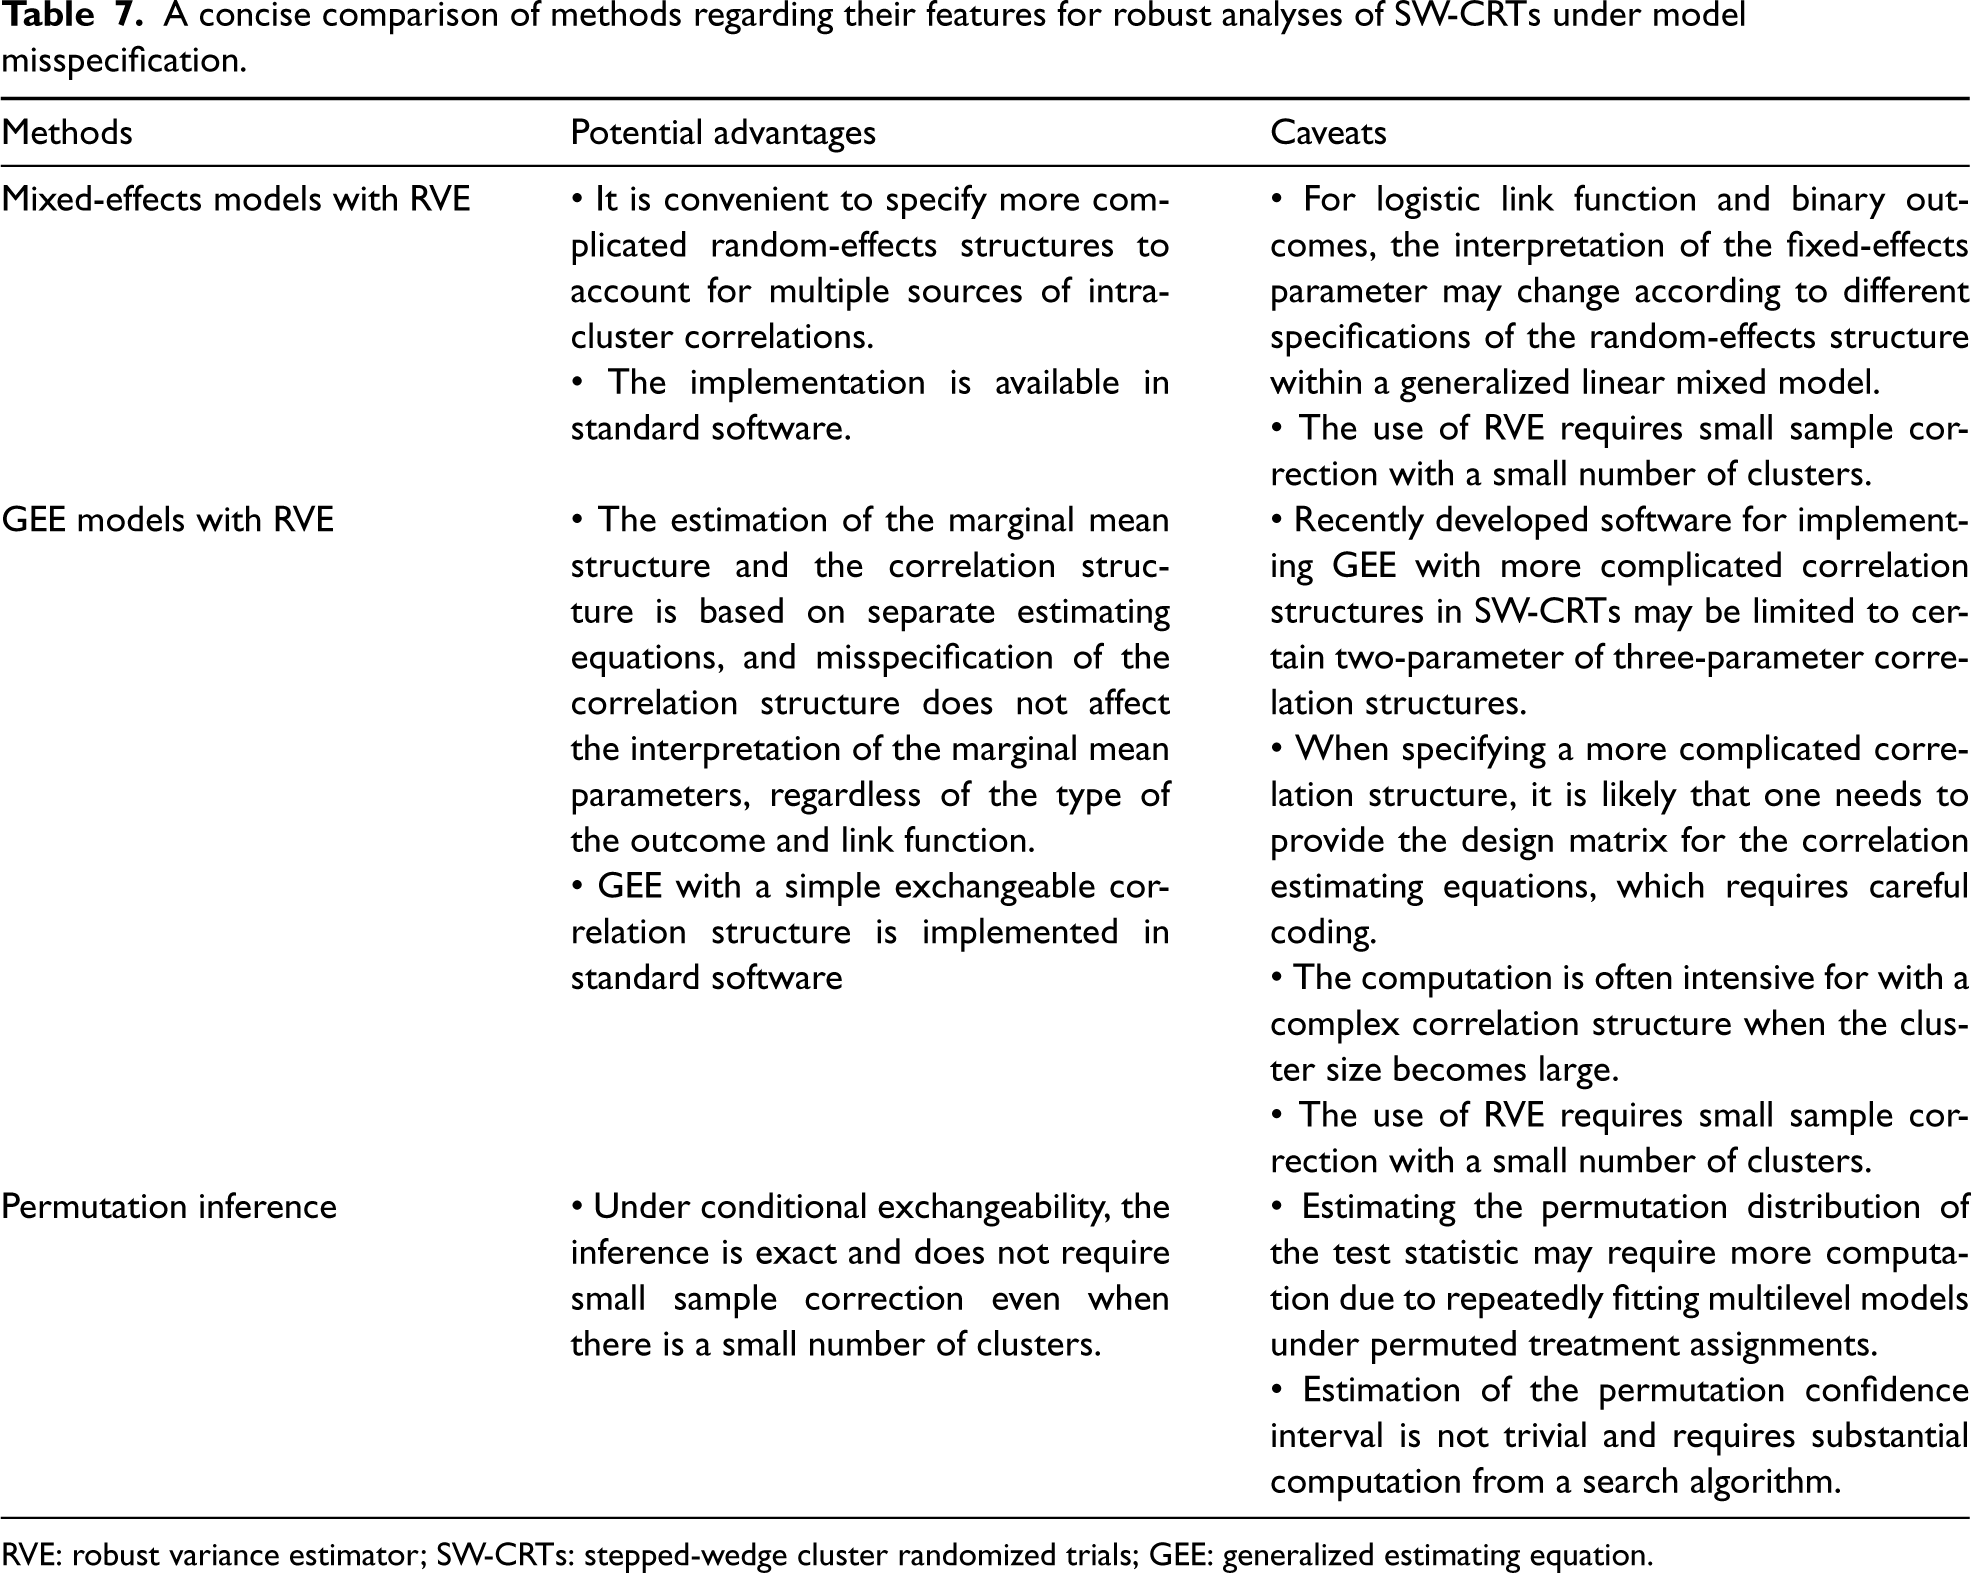
RVE: robust variance estimator; SW-CRTs: stepped-wedge cluster randomized trials; GEE: generalized estimating equation.
In practice, while we still maintain the usual standpoint of carefully specifying the random-effects structure in SW-CRTs (for reasons such that we could obtain intra-cluster correlation coefficients that are essential for future trial planning, 14 or that we might be able to obtain a more efficient treatment effect estimator when the specified random-effects structure approximates the truth), RVEs are recommended when a more complex model cannot be fit or fails to converge, or researchers are strongly concerned about model misspecification. It is also recommended to fit a model with a RVE as a sensitivity analysis even if researchers have a strong belief about the true correlation structure—in such a case one would expect the results to be similar between the model-based variance estimator and the RVE if the number of clusters is large enough. We also conjecture that, because treatment effects in other types of multiple-period cluster randomized trial designs are often estimated via linear mixed models, our results can be generalized to such other types of CRTs (such as longitudinal parallel-arm CRTs and cluster randomized crossover trials).
Non-convergence is another practical issue when the fitted linear mixed model involves a complicated random-effects structure. We observed more than a 30% non-convergence rate for the DTD-RI model when the trial is small. In practice, the DTD-RI model is still encouraged if the investigators believe it reflects their beliefs about the true random effect correlation structures. In case of convergence failure, investigators could change the default optimizer or follow the troubleshooting documentation included in the “glmmTmb” package. SAS and STAT users may follow some strategies denoted in an instruction document by Kiernan. 75
Our study has several limitations. First, although we have demonstrated that appropriate inference for treatment effects can be obtained from misspecified random-effects structures in linear mixed models by using the RVE, we wish to point out that the estimates of the random-effects variance components from misspecified models will no longer be valid. If the goal is to obtain valid ICC estimates (e.g. to inform future sample size calculations), then the interpretation of the variance component and ICC estimates from a misspecified working model can become challenging.21,23,76 An exception is discussed by Kasza et al., 76 where one may obtain decay parameter estimates from variance component estimates under a misspecified exchangeable random-effects model. Second, we only considered continuous outcomes as RVEs for non-Gaussian outcomes are currently not available across all software packages. For example, the “clubSandwich” R package does not support non-Gaussian outcomes. Even though SAS GLIMMIX allows for RVE, the estimation routine for a generalized linear mixed model proceeds by linearization and should be considered as pseudo-GEE. However, a more conceptual challenge with using misspecified generalized linear mixed models with binary outcomes, and particularly with a logit link, is that the treatment effect coefficient may carry a different interpretation when the random-effects structure is misspecified, due to non-collapsibility. 77 Future studies should be carried out to reconcile the challenges in using misspecified generalized linear mixed models in SW-CRTs. Despite all these complexities, the linear mixed models we considered can still be used to estimate the treatment effect on the risk difference scale for binary outcomes, in which case the RVE becomes essential as it can simultaneously account for a misspecified variance function and potentially misspecified random-effects structure. Third, when considering the models used to generate the data, we assumed the DTD-RI was the most complex model. In fact, more complex correlation structures, such as Toeplitz and unstructured, have been discussed previously. 31 Although RVE is in theory valid under more complex linear mixed data generators, its performance under such scenarios was not examined in this study. Fourth, in this study, we still found that when the number of clusters is small (e.g. eight), RVE with small-sample correction tended to have slightly inflated type I error rates. Under the GEE framework, alternative small-sample corrected RVEs (such as that due to Fay and Graubard 78 ) have been studied, but under relatively restrictive data-generating processes.27,79–82 However, such a bias-reduced estimator has not been widely implemented for linear mixed models and its performance with a potentially misspecified mixed model is unclear. Currently, the Fay and Graubard 78 variance estimator for linear mixed models is only available in SAS PROC GLIMMIX (which fits mixed models via a GEE-like routine rather than a maximum likelihood routine). Future studies may consider evaluating this additional RVE for linear mixed models fitted in SAS PROC GLIMMIX. Lastly, we only discussed cross-sectional designs. The cohort design requires additional random effects for repeated measures on each individual. We expect that our results can be extended to cohort designs, but future studies should investigate the performance of each RVE when additional random effects are specified for repeated measurements.
Supplemental Material
sj-xlsx-1-smm-10.1177_09622802241248382 - Supplemental material for Maintaining the validity of inference from linear mixed models in stepped-wedge cluster randomized trials under misspecified random-effects structures
Supplemental material, sj-xlsx-1-smm-10.1177_09622802241248382 for Maintaining the validity of inference from linear mixed models in stepped-wedge cluster randomized trials under misspecified random-effects structures by Yongdong Ouyang, Monica Taljaard, Andrew B Forbes and Fan Li in Statistical Methods in Medical Research
Supplemental Material
sj-pdf-2-smm-10.1177_09622802241248382 - Supplemental material for Maintaining the validity of inference from linear mixed models in stepped-wedge cluster randomized trials under misspecified random-effects structures
Supplemental material, sj-pdf-2-smm-10.1177_09622802241248382 for Maintaining the validity of inference from linear mixed models in stepped-wedge cluster randomized trials under misspecified random-effects structures by Yongdong Ouyang, Monica Taljaard, Andrew B Forbes and Fan Li in Statistical Methods in Medical Research
Footnotes
Acknowledgements
This research was enabled in part by support provided by Compute Ontario (computeontario.ca) and the Digital Research Alliance of Canada (alliancecan.ca).
Data availability
Declaration of conflicting interests
The author(s) declared no potential conflicts of interest with respect to the research, authorship, and/or publication of this article.
Funding
The author(s) disclosed receipt of the following financial support for the research, authorship, and/or publication of this article: MT and FL are supported by the National Institute of Aging (NIA) of the National Institutes of Health (NIH) under Award Number U54AG063546, which funds NIA Imbedded Pragmatic Alzheimer's Disease and AD-Related Dementias Clinical Trials Collaboratory (NIA IMPACT Collaboratory). Research in this article was also partially supported by a Patient-Centered Outcomes Research Institute Award® (PCORI® Award ME-2022C2-27676, to FL). YO is funded by the Canadian Institutes of Health Research Health System Impact Postdoc Fellowship. The statements presented in this article are solely the responsibility of the authors and do not necessarily represent the official views of NIH, PCORI®, or its Board of Governors or Methodology Committee.
Supplemental material
Supplemental material for this article is available online.
References
Supplementary Material
Please find the following supplemental material available below.
For Open Access articles published under a Creative Commons License, all supplemental material carries the same license as the article it is associated with.
For non-Open Access articles published, all supplemental material carries a non-exclusive license, and permission requests for re-use of supplemental material or any part of supplemental material shall be sent directly to the copyright owner as specified in the copyright notice associated with the article.