
Abstract
Antimicrobial resistance is becoming a major threat to public health throughout the world. Researchers are attempting to contrast it by developing both new antibiotics and patient-specific treatments. In the second case, whole-genome sequencing has had a huge impact in two ways: first, it is becoming cheaper and faster to perform whole-genome sequencing, and this makes it competitive with respect to standard phenotypic tests; second, it is possible to statistically associate the phenotypic patterns of resistance to specific mutations in the genome. Therefore, it is now possible to develop catalogues of genomic variants associated with resistance to specific antibiotics, in order to improve prediction of resistance and suggest treatments. It is essential to have robust methods for identifying mutations associated to resistance and continuously updating the available catalogues. This work proposes a general method to study minimal inhibitory concentration distributions and to identify clusters of strains showing different levels of resistance to antimicrobials. Once the clusters are identified and strains allocated to each of them, it is possible to perform regression method to identify with high statistical power the mutations associated with resistance. The method is applied to a new 96-well microtiter plate used for testing Mycobacterium tuberculosis.
Keywords
Introduction
Public health authorities throughout the world are becoming more and more concerned about antimicrobial resistance, due to the reduced ability of standard compounds to treat infectious diseases.1–3 Antimicrobial resistance mechanisms have been observed in bacteria,4–6 in fungi,7,8 and in viruses.9,10
There are two main causes of the development of drug resistance, that is, either the prescription of suboptimal treatments which encourage the development of resistance or direct transmission of resistant strains. Methods used to tackle the rise of antimicrobial resistance include a wiser prescription of antimicrobials, that takes into account known resistance patterns. Such patterns are studied through antimicrobial susceptibility testing to identify at which concentration of a particular drug the growth of the pathogen is inhibited. In this respect, microtiter plates allow the effectiveness of several drugs to be tested at the same time on a single clinical isolate.
Antimicrobial data, obtained through dilution methods, 11 are registered as minimum inhibitory concentration (MIC) values, expressed in milligrams per litre (mg/L). The MIC is defined as the minimal concentration of an antimicrobial substance that inhibits the visual growth of a pathogen after incubation. Since this type of test is more accurate than diffusion tests, MICs are considered the golden standard of susceptibility tests. 12 According to the experiment design adopted to obtain MIC values, data for a specific drug follow a distribution as shown in Figure 1. The shape of this distribution may vary considerably from drug to drug, according to the specific resistance patterns.
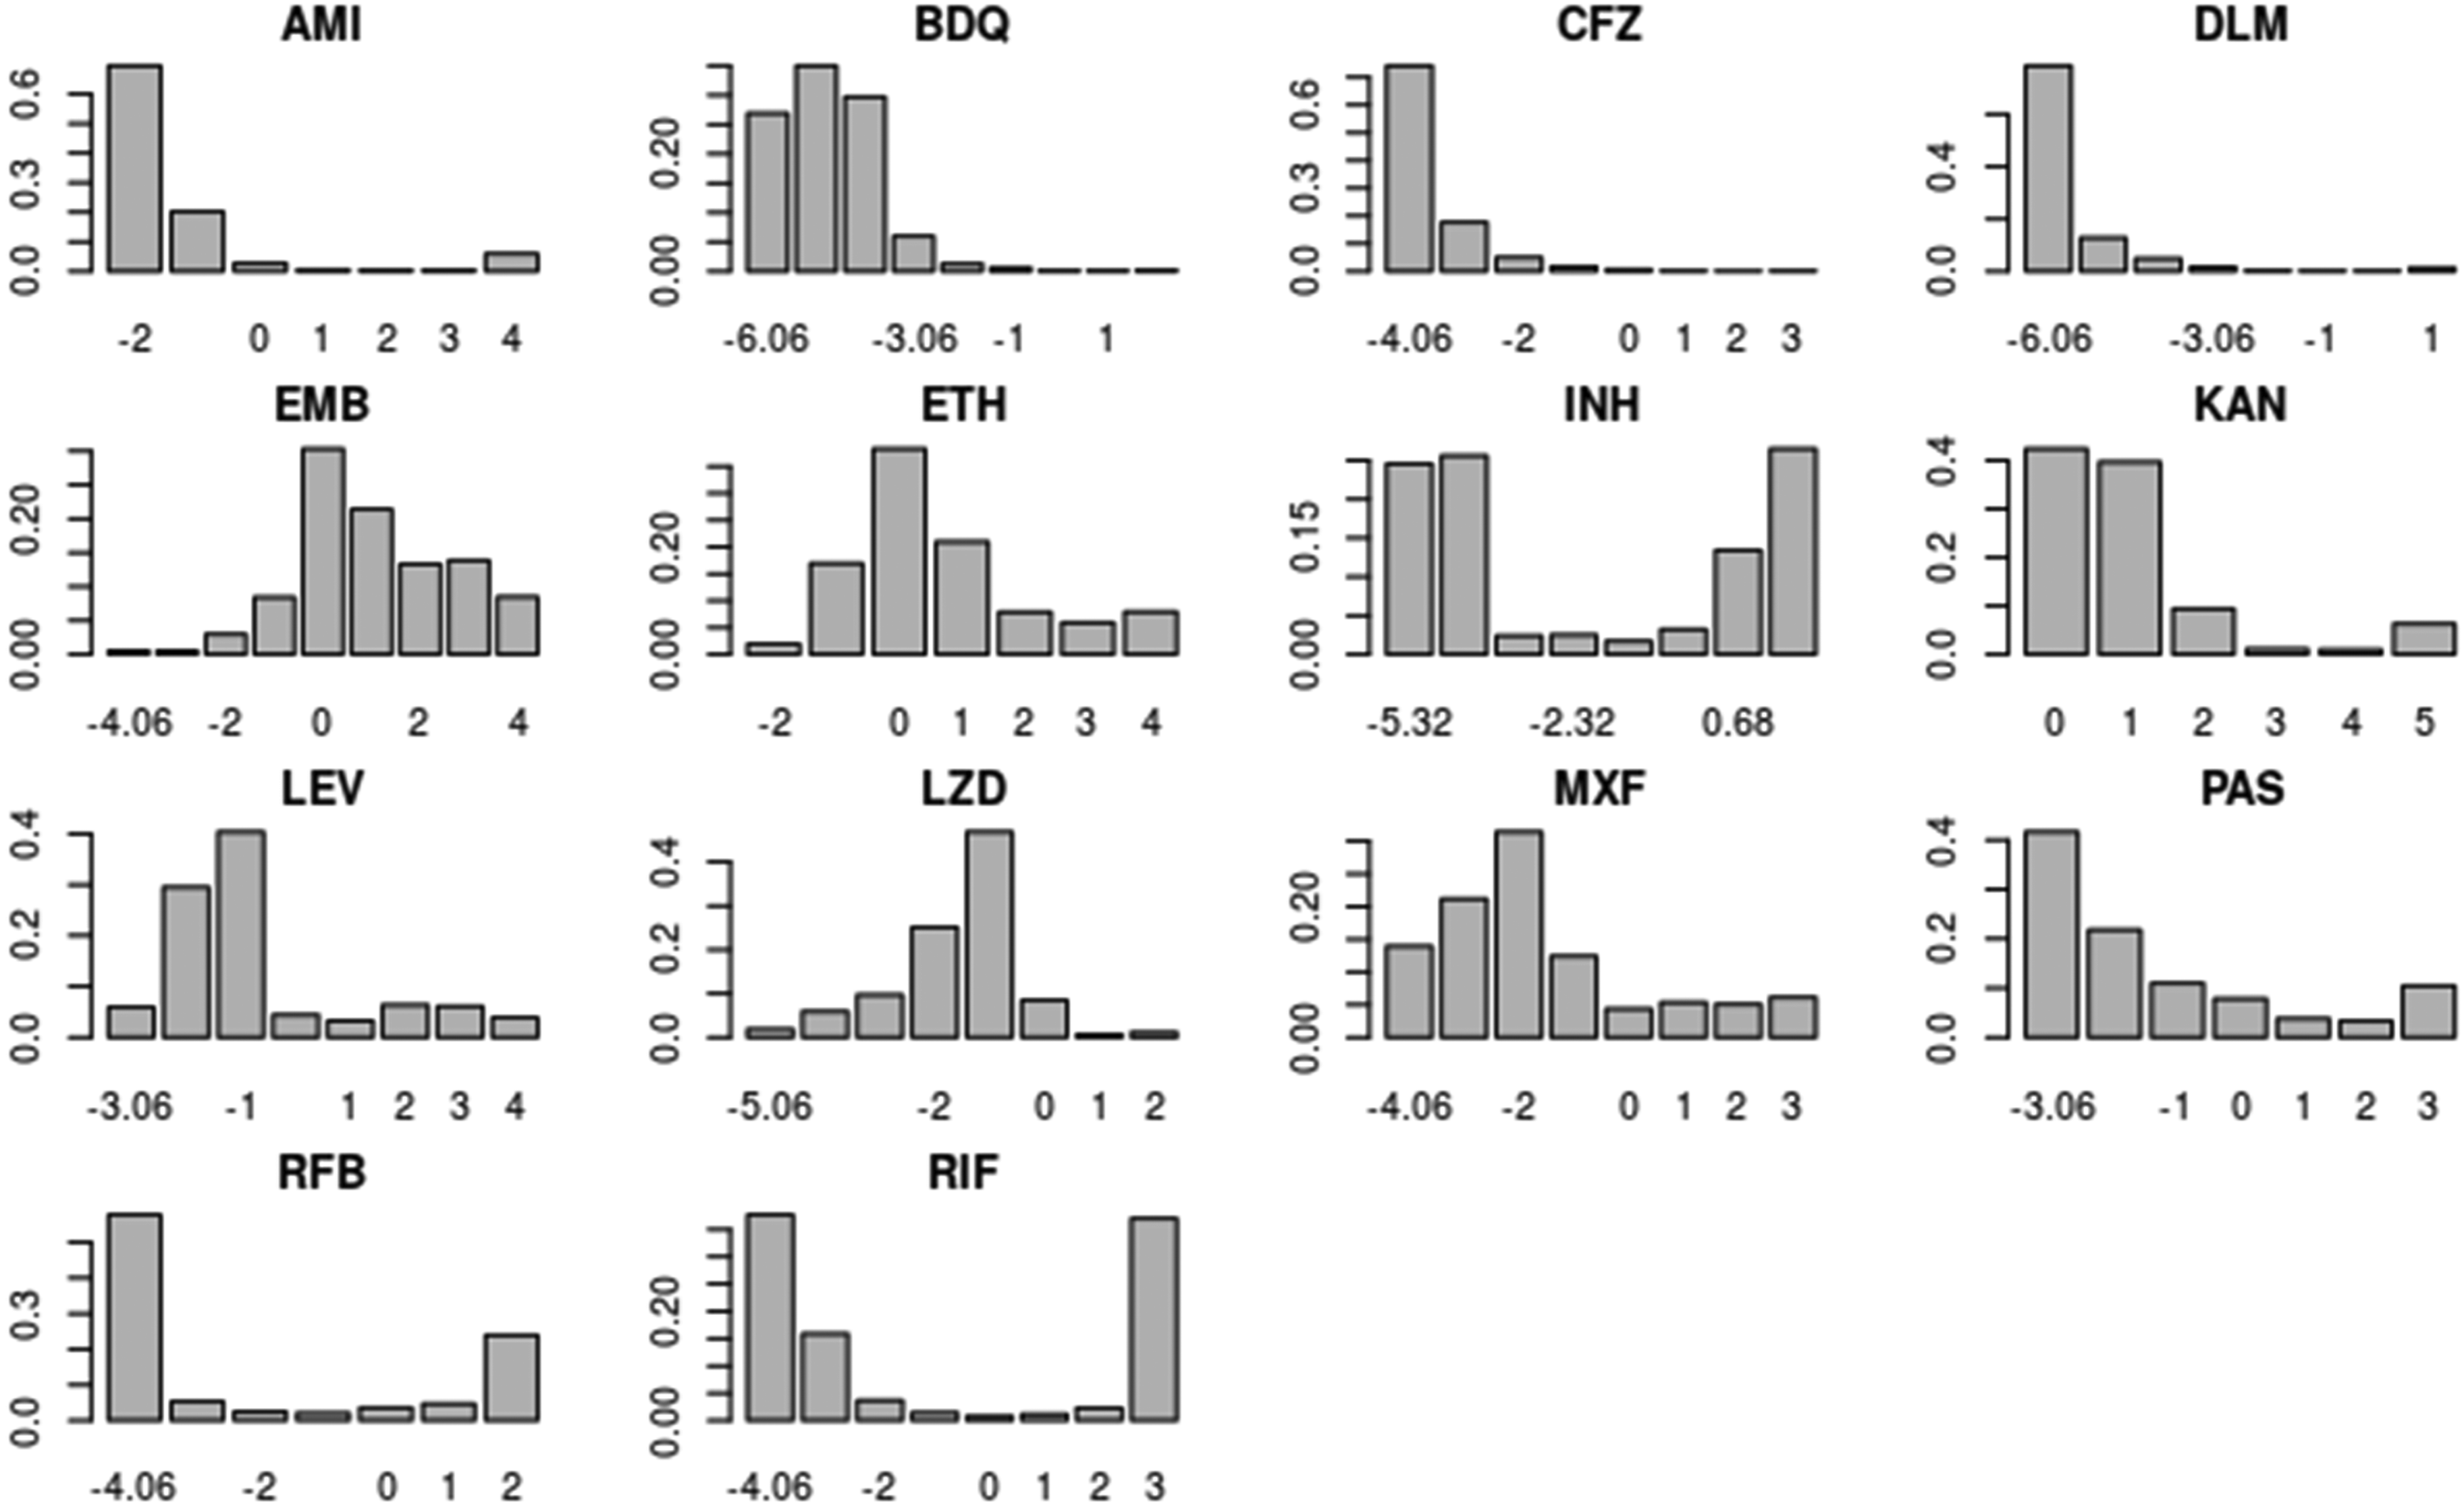
Barplots of the minimal inhibitory concentration (MIC) distributions of each drug under plate design UKMYC5. The
The aim of this work is to propose a general method, the censored Gaussian mixture approach, to define clusters of strains showing different levels of resistance in order to associate them to specific mutations in genome-wide association studies (GWASs). 13 The method relies on a latent represention where a continuous variable, following a Gaussian mixture model with a prior on the number of components, is only partially observed. This representation allows to derive a posterior distribution on the number of clusters, that is, levels of resistance, and the allocations of strains to each cluster will be shown to have a better performance in association studies, in particular for rare or low-frequency mutations.
Although the methods presented in this work may be applied to any pathogen and any dilution method, the attention is focused on Mycobacterium tuberculosis, given the importance of the resistance mechanisms developed by this pathogen. While the trend of new cases of tuberculosis is decreasing, 14 the number of cases resistant to one or more drugs, in particular to first-line drugs (rifampicin, ethambutol, isoniazid, and pyrazinamide) is increasing.15,16
In this work, we propose an alternative approach to the standard definition of critical concentrations to define resistance. A critical concentration is the concentration used to classify isolates in the susceptible group or the resistant group. However, the critical concentrations of most of the anti-TB drugs have been recently revised and updated by the World Health Organization,17,18 through an extensive study of the literature, and it has emerged that the identification of critical concentrations is not a simple task, as is usually assumed. We propose, instead, to use a classification approach, where isolates are allocated to clusters of resistance, in order to identify potential intermediate levels to define phenotypic subgroups (and not only two main groups – susceptible and resistant); this multi-label classification will be shown to be essential in order to identify the mutations associated with specific levels of resistance more clearly, in particular for those antimicrobials for which only a few resistant cases are observed (e.g. for bedaquiline which is a new treatment).
When defining critical concentrations, it is ofted assumed that the wild-type group of isolates (defined as the group of isolates with no acquired resistance to antimicrobials) follows a log-normal distribution, as given by Turnidge et al., 19 where the cutoffs are identified by fitting a log-normal cumulative distribution, through non-linear least squares regression. This method is implemented in the ECOFFinder software available on the website of the European Society of Clinical Microbiology and Infectious Diseases (EUCAST). This method strongly relies on the assumption that a log-normal is a suitable model for the binary logarithm of MIC values and it does not take into account the region of the distribution where wild-type and non-wild types strains overlap. Jaspers et al. 20 relaxed the assumption that the wild-type distribution is log-normal: the MIC values for the wild-type distribution are still considered realization of continuous random variables, however, the authors model the MIC groupings with a multinomial distribution, with parameters corresponding to the probabilities to belong to any of the different concentrations (or dilutions) analysed on the testing plate.
Such methods, also defined ‘local’, rely on the possibility to well identify the wild-type group of isolates; however, in many cases, such as M. tuberculosis, the wild-type group itself may be heterogeneous. On the other hand, the approach proposed in this work is ‘global’, that is, it is aimed at modelling the whole mixing distribution. Jaspers et al.,21–23 considered a mixture-type model

Gaussian mixture models have already been suggested in the study of MIC distributions, for example, by Craig 24 and Annis and Craig. 25 However, although MIC values may be considered ideally continuous, they are registered as discrete values or, more specifically, as counts of the number of isolates associated to every dilution. Moreover, considering a fixed and known number of components is a strong implicit assumption when the resistance mechanism is not yet fully understood.
Mixture models for ordinal data, including regression on covariates, have been proposed by McLachlan and Jones, 26 Cadez et al., 27 and Hamdan and Wu 28 with estimation via expectation–maximization (EM) algorithm, and Kottas et al., 29 and DeYoreo and Kottas 30 in a Bayesian setting, among others. Similarly to the approach proposed in this work, a latent Gaussian variable is introduced, following a mixture model, to describe the behaviour of the implicit continuous variable which is observed at a discrete scale. The main difference with the censored Gaussian mixture model (censored GM) proposed here is that in previous works the latent continuous variables is modelled according to an infinite mixture of Gaussian distributions, using a Dirichlet process prior. However, Miller and Harrison 31 showed inconsistency of this model in estimating the number of clusters. The results on the available dataset (Section 4) will show such inconsistency empirically.
The use of a prior distribution on the number of components for a finite mixture model has been shown to allow for consistency in estimating the number of clusters, differently from the use of Dirichlet process priors. The reason for this is that, in finite mixture models, most of the prior mass is associated to clusters of similar size, while in Dirichlet processes the prior mass is associated to clusters of highly variable size, favouring an increasing number of small clusters. 32 See also Frühwirth-Schnatter et al. 33 for a recent characterization of the prior distribution on the number of clusters, induced by the prior distribution on the number of components.
The remaining of the article is organized as follows. Section 2 describes the dataset which motivates the study. The censored Gaussian mixture approach proposed in this work is formally presented in Section 3. Several approaches are applied and compared on the motivating dataset in Section 4. The labelling provided by the proposed method is then used to perform a GWAS in Section 5, in order to identify mutations associated with resistance to each of the antimicrobials under considerations: several previously unreported variants, or variants identified in smaller studies will be associated, to several levels of resistant to specific drugs. Section 6 concludes the article. Supporting Information includes a simulation study to test the approach.
The CRyPTIC Consortium (Comprehensive Resistance Prediction for Tuberculosis: an International Consortium) was created in order to collect and study about
As part of the project, the CRyPTIC Consortium designed a UKMYC 96-well microtiter plate. The plate design has been validated by seven laboratories in Asia, Europe, South America, and Africa, by using 19 external quality assessment (EQA) strains, including the most frequently studied tuberculosis strain, H37Rv. A full description of the experiment and of the results, in terms of reproducibility of the plate, is available by Rancoita et al. 34 Since the highest level of reproducibility was identified for readings at day 14 after inoculation with the Vizion imaging system, attention is here only concentrated on data relative to this subset. Moreover, the PAS compound was shown to not perform well on the plate, and has therefore been discarded in the following part of the CRyPTIC study. For this reason, the outcomes relative to PAS, although still presented in this work, should be considered more uncertain. The validation experiment also showed that there is a biological variability depending on both the plate and the culture preparation, so that by repeating the culture of the same strain several times, a full distribution of possible values is obtained and this distribution is concentrated within three dilutions 95% of the times.
In this article, MIC values obtained from dilution experiments on a 96-well microtiter plate containing a liquid growth medium (broth) are analysed, where the same dose of pathogen is cultured in each well, but in the presence of successively increasing antimicrobial concentrations (double dilutions). The MIC value is identified as the concentration of the first well which does not allow the pathogens to grow. By convention, if growth is inhibited in all wells, the MIC is set to the lowest concentration available and, if growth is observed at each concentration level, the MIC is set to an agreed higher level of antimicrobial concentration that has not been studied on the plate.
While the results from the validating experiment were studied, the laboratories involved in the CRyPTIC consortium analysed the first set of strains with the initial plate design (Plate Design ‘UKMYC5’); in May 2018 a new plate design (Plate Design ‘UKMYC6’) was concorded and the laboratories started to use it in July 2018. The dataset used for the current work includes only strains analysed with the UKMYC5 plate design (
Number of isolates analysed for each compound.
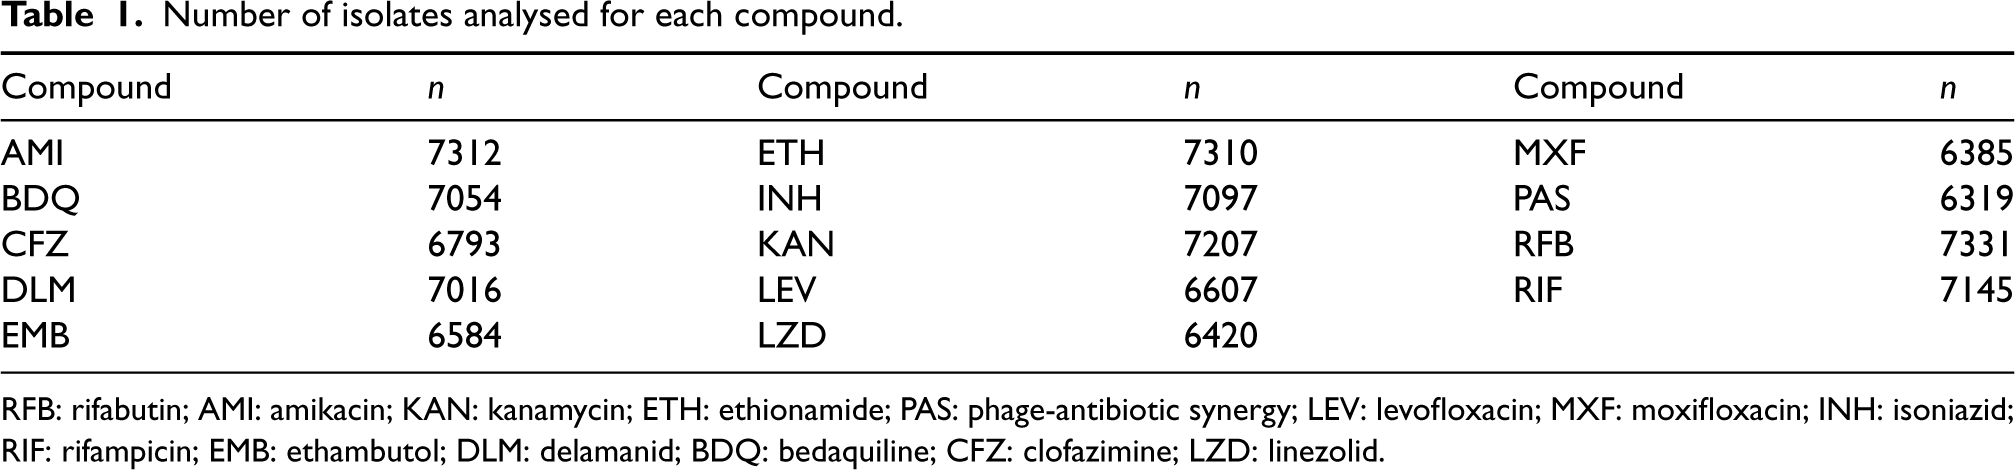
Number of isolates analysed for each compound.
RFB: rifabutin; AMI: amikacin; KAN: kanamycin; ETH: ethionamide; PAS: phage-antibiotic synergy; LEV: levofloxacin; MXF: moxifloxacin; INH: isoniazid; RIF: rifampicin; EMB: ethambutol; DLM: delamanid; BDQ: bedaquiline; CFZ: clofazimine; LZD: linezolid.
Figure 1 also shows an important feature of the dataset and, in general, of the problem of studying MIC distributions: the data are censored. First, the MIC value is only partially known at the boundary of the analysed concentration range. Moreover, the MIC values are not continuous variables as they are observed at fixed levels of concentrations (interval-censoring). Approaches usually applied to the estimation of MIC distributions often do not take into account these two sources of censoring, while one of the advantages of our proposed approach is being able to control for both of them.
Consider a set of random variables 
The model can be rewritten as

Equation (1) can be augmented including a latent variable relative to the allocation of an observation to a particular component: it is possible to hypothesize the existence of a latent variable
The decision to fit a mixture model is motivated by three reasons. First, it seems more appropriate to model the whole mixing structure rather than only the wild-type group of isolates (preferring a global method to a local method), since the classification is unsupervised and the microtiter plates under study are characterized by biological noisiness. Second, the mechanisms of resistance are heterogeneous; considering the possibility that the resistant group can be described by more than one component may allow to identify intermediate levels of resistance. Moreover, the complete patterns of resistance are not known for most of the drugs under analysis and are almost completely unknown for new drugs. This represents an important first step for subsequent analysis, like GWAS. Third, the standard way of defining a wild-type group is by looking at those isolates that have no known conferring-resistance mutations. However, strains of
Although the use of Gaussian components is already very flexible, it does not take into account the discrete and censored nature of the data: MIC values are not actually continuous, and are in fact rounded to the next two-fold dilution. Moreover, the data are truncated at the minimum and maximum dilution chosen for the plate. Therefore, it is possible to consider a mixture of distributions, where the discrete nature of the data is taken into account by rounding continuous (for instance, Gaussian) variables. A latent variable, 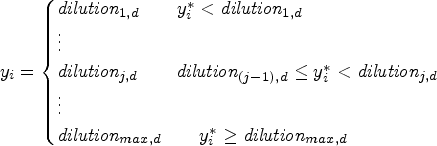
The probability mass function 
Several approaches are available to generalize latent variable algorithms 38 to mixture models, in particular in a nonparametric setting; for example, a nonparametric estimation for mixed count data based on the infinite mixture models is proposed by Kottas et al. 29 While these methods are similar to the one proposed here with respect to the latent representation, there are some important differences: the goal of these approaches is often density estimation and not clustering. In this work, the use of a finite mixture model with an unknown number of components is preferred in order to introduce the information that a small number of components is expected; this is particularly important in this setting, where the clusters are defined with a biological interpretation. Moreover, it avoids the inconsistency of the Dirichlet process in estimating the correct number of components discussed by Miller and Harrison. 31
The estimation of the proposed model is made within a Bayesian framework
39
to obtain posterior distributions (and the relative credible intervals) of all the parameters involved. In this analysis, it is necessary to define prior distributions for all parameters, such that they describe the prior knowledge the experimenter has about them. For the location and scale parameters, it is common to use weakly informative priors, for instance a
The prior distribution for the number of components is known to be delicate. Here, the default prior distribution proposed by Grazian et al.
43
based on a loss-information definition is used, since it has shown a good balance between conservativeness and accuracy: it is important that the number of components is well estimated and that, at the same time, lower values of 
The parameters 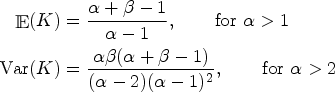
It is worth reminding that a major issue when estimating the parameters of mixture models is the label-switching phenomenon, due to the symmetry in the likelihood of the model parameters. The method used to tackle this problem in this article is post-processing the output of the Bayesian algorithms to re-label the components and keep the labels consistent. In more details, once the MCMC samples are obtained, each sample is permuted to induce an identifiability constraint such that
The methodology described in Section 3 is now applied to the dataset presented in Section 2. The goal of the analysis is to characterize the clusters representing different levels of resistance. Antimicrobials are analysed independently here.
For the parameters of the mixture, the following prior distributions are used: for each
The censored Gaussian mixture model with conservative prior on the number of components proposed in this work has been compared with other three methods of classifications:
ECOFFinder,
19
as implemented in the a Gaussian mixture (GM) model, as given by Annis and Craig
25
; a Dirichlet process (DP) mixture for discrete observations.
29
Supplemental Appendix A provides information about the MCMC scheme that was implemented for the censored Gaussian mixture model. For all methods, the MCMC algorithm has been implemented with
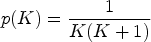
Table 2 displays the estimated number of clusters obtained via the censored GM, along with the posterior means of the mixture weights associated with these clusters for each antimicrobial. Certain antimicrobials exhibit associations with two clusters; for instance, the majority of the new or repurposed drugs, such as BDQ, CFZ, and LZD. Conversely, DLM appears to possess a heavy tail, encompassing highly resistant strains as well as intermediate cases, as depicted in Figure 1. Interestingly, RIF, RFB, and INH each display three or four clusters, reinforcing the notion of multiple intermediate levels of resistance. In contrast, EMB presents a single cluster; however, it is worth noting that the range of MIC values might not have been precisely defined in the study.
Number of identified clusters, and posterior means of the relative mixture weights for the censored GM.
Number of identified clusters, and posterior means of the relative mixture weights for the censored GM.
RFB: rifabutin; AMI: amikacin; KAN: kanamycin; ETH: ethionamide; PAS: phage-antibiotic synergy; LEV: levofloxacin; MXF: moxifloxacin; INH: isoniazid; RIF: rifampicin; EMB: ethambutol; DLM: delamanid; BDQ: bedaquiline; CFZ: clofazimine; LZD: linezolid; GM: Gaussian mixture.
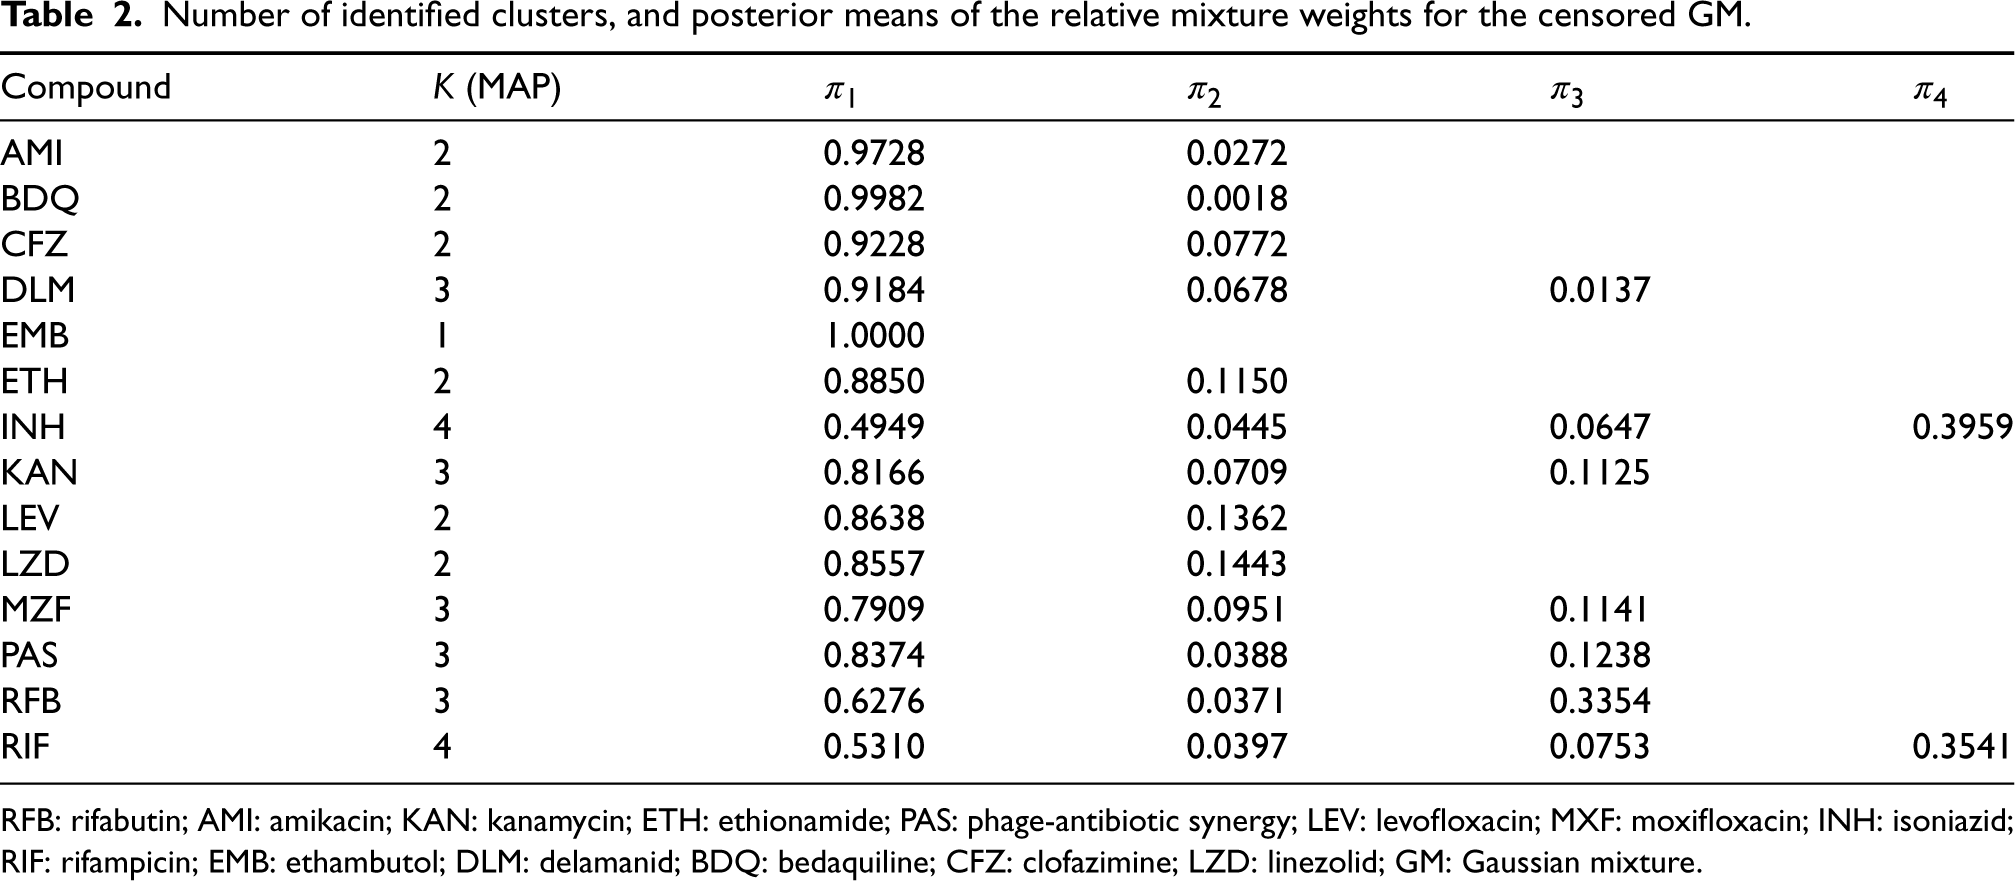
Percentages of strains characterized by known resistance mutations for the first-line drugs and correctly classified as resistant.
INH: isoniazid; RIF: rifampicin; EMB: ethambutol; GM: Gaussian mixture; DP: Dirichlet process.
The ground truth for the dataset described in Section 2 is not known: we have no information about whether a strain belongs to the wild-type group or to one of the resistant groups. However, some strains can be predicted to be resistant with high confidence because they are characterized by genomic variants well known to be associated with resistance to specific antimicrobials. For example, Walker et al. 49 reported candidate genomic variants from the literature and classified them as not conferring resistance, resistance determinants, or uncharacterized.
To test the ability of the compared methods to identify resistant cases, we selected strains predicted as resistant to first-line drugs (EMB, INH, and RIF) with high predictive ability (
Table 3 shows the percentage of strains in the dataset correctly identified as resistant, meaning strains that were classified by the method as resistant and were characterized by one or more of the genomic variants selected from Walker et al.
49
as conferring resistance with high probability (
ECOFFinder directly produces cutoffs that classify isolates into a susceptible and a resistant group. For the other methods, it is assumed that the first component represents the susceptible isolates, while the others represent some level of resistance. Once the classification is done, the strains are checked for the presence of genomic variants identified by Walker et al.
49
to predict resistance. All the methods identify the resistant strains with an accuracy above
The dataset described in Section 2 does not include information about susceptible strains. However, the experiment carried out by CRyPTIC was first validated by a pilot experiment, as described by Rancoita et al. 34 In this validation experiment, the fully susceptible strain H37Rv (reference strain) was subcultured and tested 10 times, and an additional 4 times as a blind strain in each of the laboratories participating in the experiment.
To study the percentage of strains correctly identified as susceptible (true negatives), the methods under comparison were then applied to the validation data-set, and the percentage of duplicates of strain H37Rv correctly identified as susceptible was recorded. For this analysis, we assumed the model with drug and strain intercepts (see Section 3). Percentages of true negative cases are shown in Table 4.
Percentages of strains H37Rv tested during the validation experiment and correctly classified as susceptible.
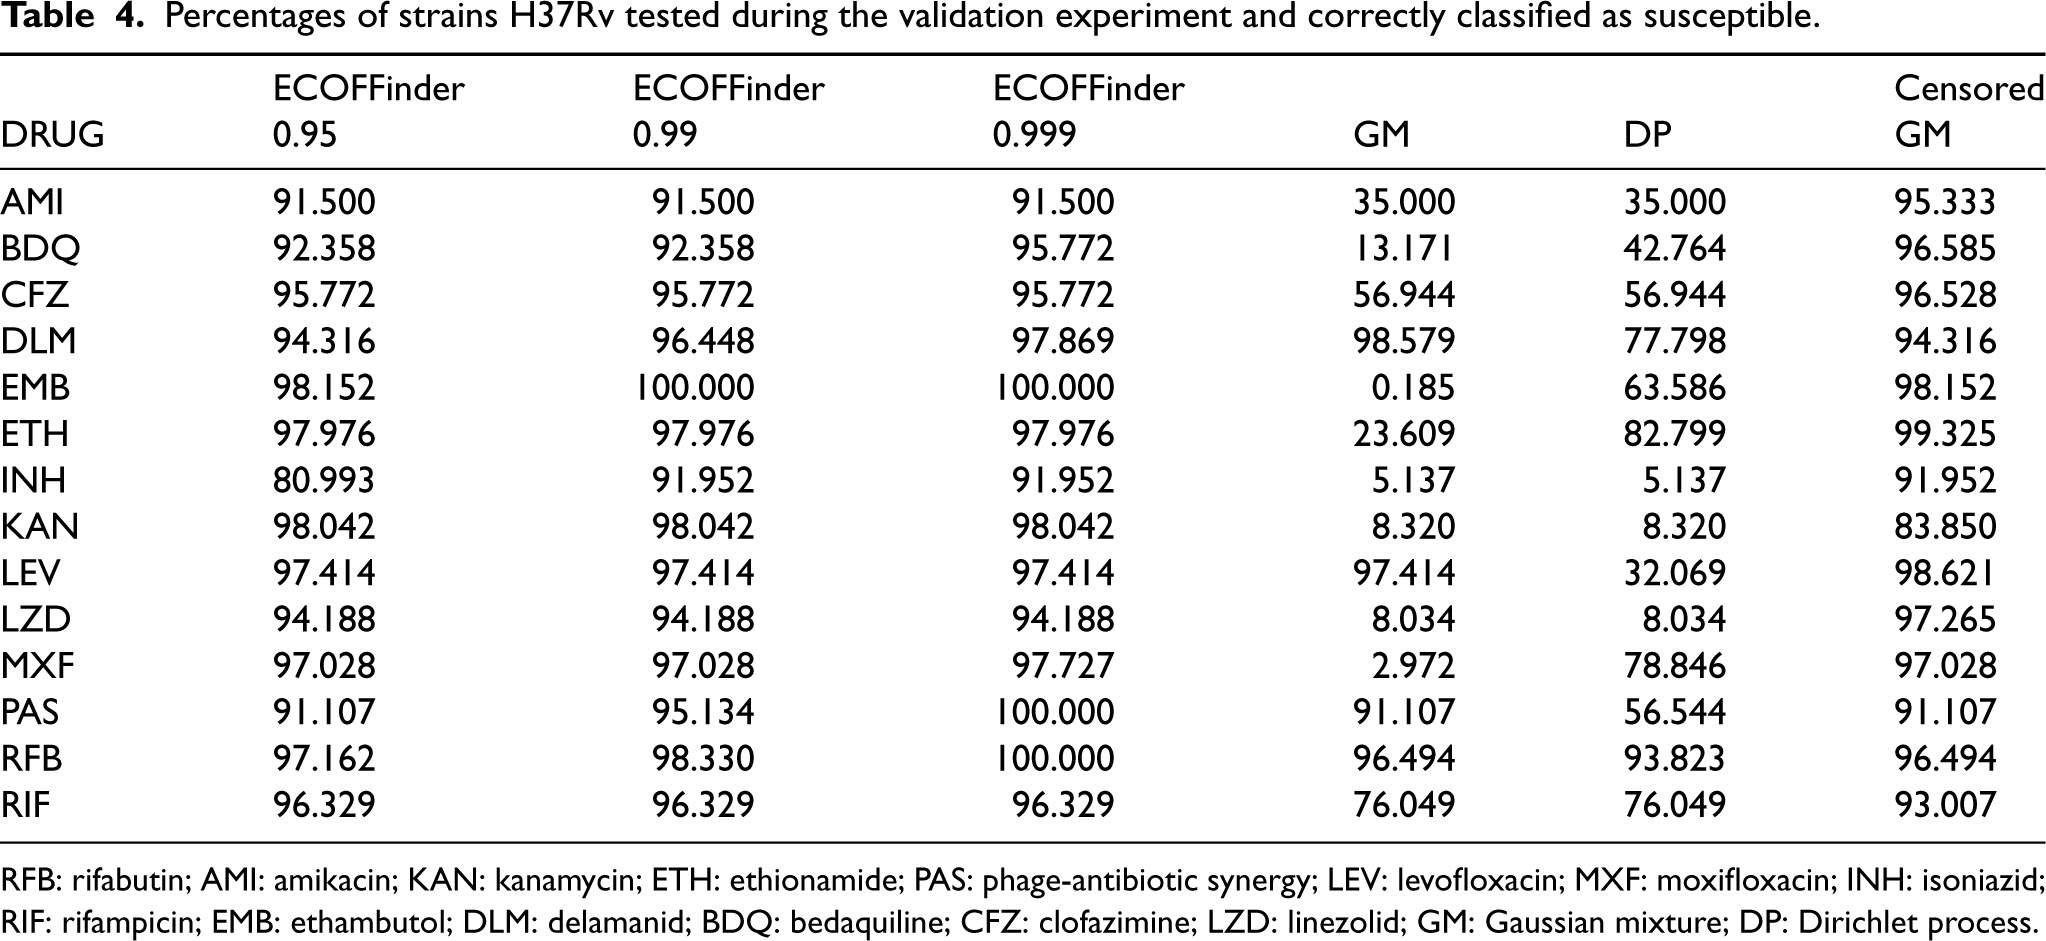
RFB: rifabutin; AMI: amikacin; KAN: kanamycin; ETH: ethionamide; PAS: phage-antibiotic synergy; LEV: levofloxacin; MXF: moxifloxacin; INH: isoniazid; RIF: rifampicin; EMB: ethambutol; DLM: delamanid; BDQ: bedaquiline; CFZ: clofazimine; LZD: linezolid; GM: Gaussian mixture; DP: Dirichlet process.
For the censored GM, duplicates of H37Rv are correctly identified as susceptible in most cases, more than
Comparing Tables 3 and 4 allows to see that the censored GM seems to perform well (with correct classification
In general, censored GM allows to reach good levels of correct classification without the introduction of additional information or experimental choices (as the choice of the reference quantiles) and can be seen as an automatic method of definition of the resistance levels, which is particularly important for the less investigated antimicrobials, but can also highlight unknown mechanisms of resistance for first-line drugs.
GWASs are a class of methods that involve a model of association of a particular phenotype (e.g. resistance to a specific antimicrobial or the MIC value with respect to that antimicrobial) to a set of genomic variants. Once a genetic association is identified, researchers can further study the biological mechanisms and develop better strategies to detect or treat the disease.
The methods can be classified depending on the type of covariates (e.g. single nucleotide polymorphisms (SNPs) or substrings of some length of the genome,
GWASs have been run for each of the antimicrobials under study, including SNPs of the whole genome as predictors. The involved model is
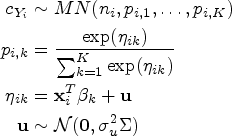
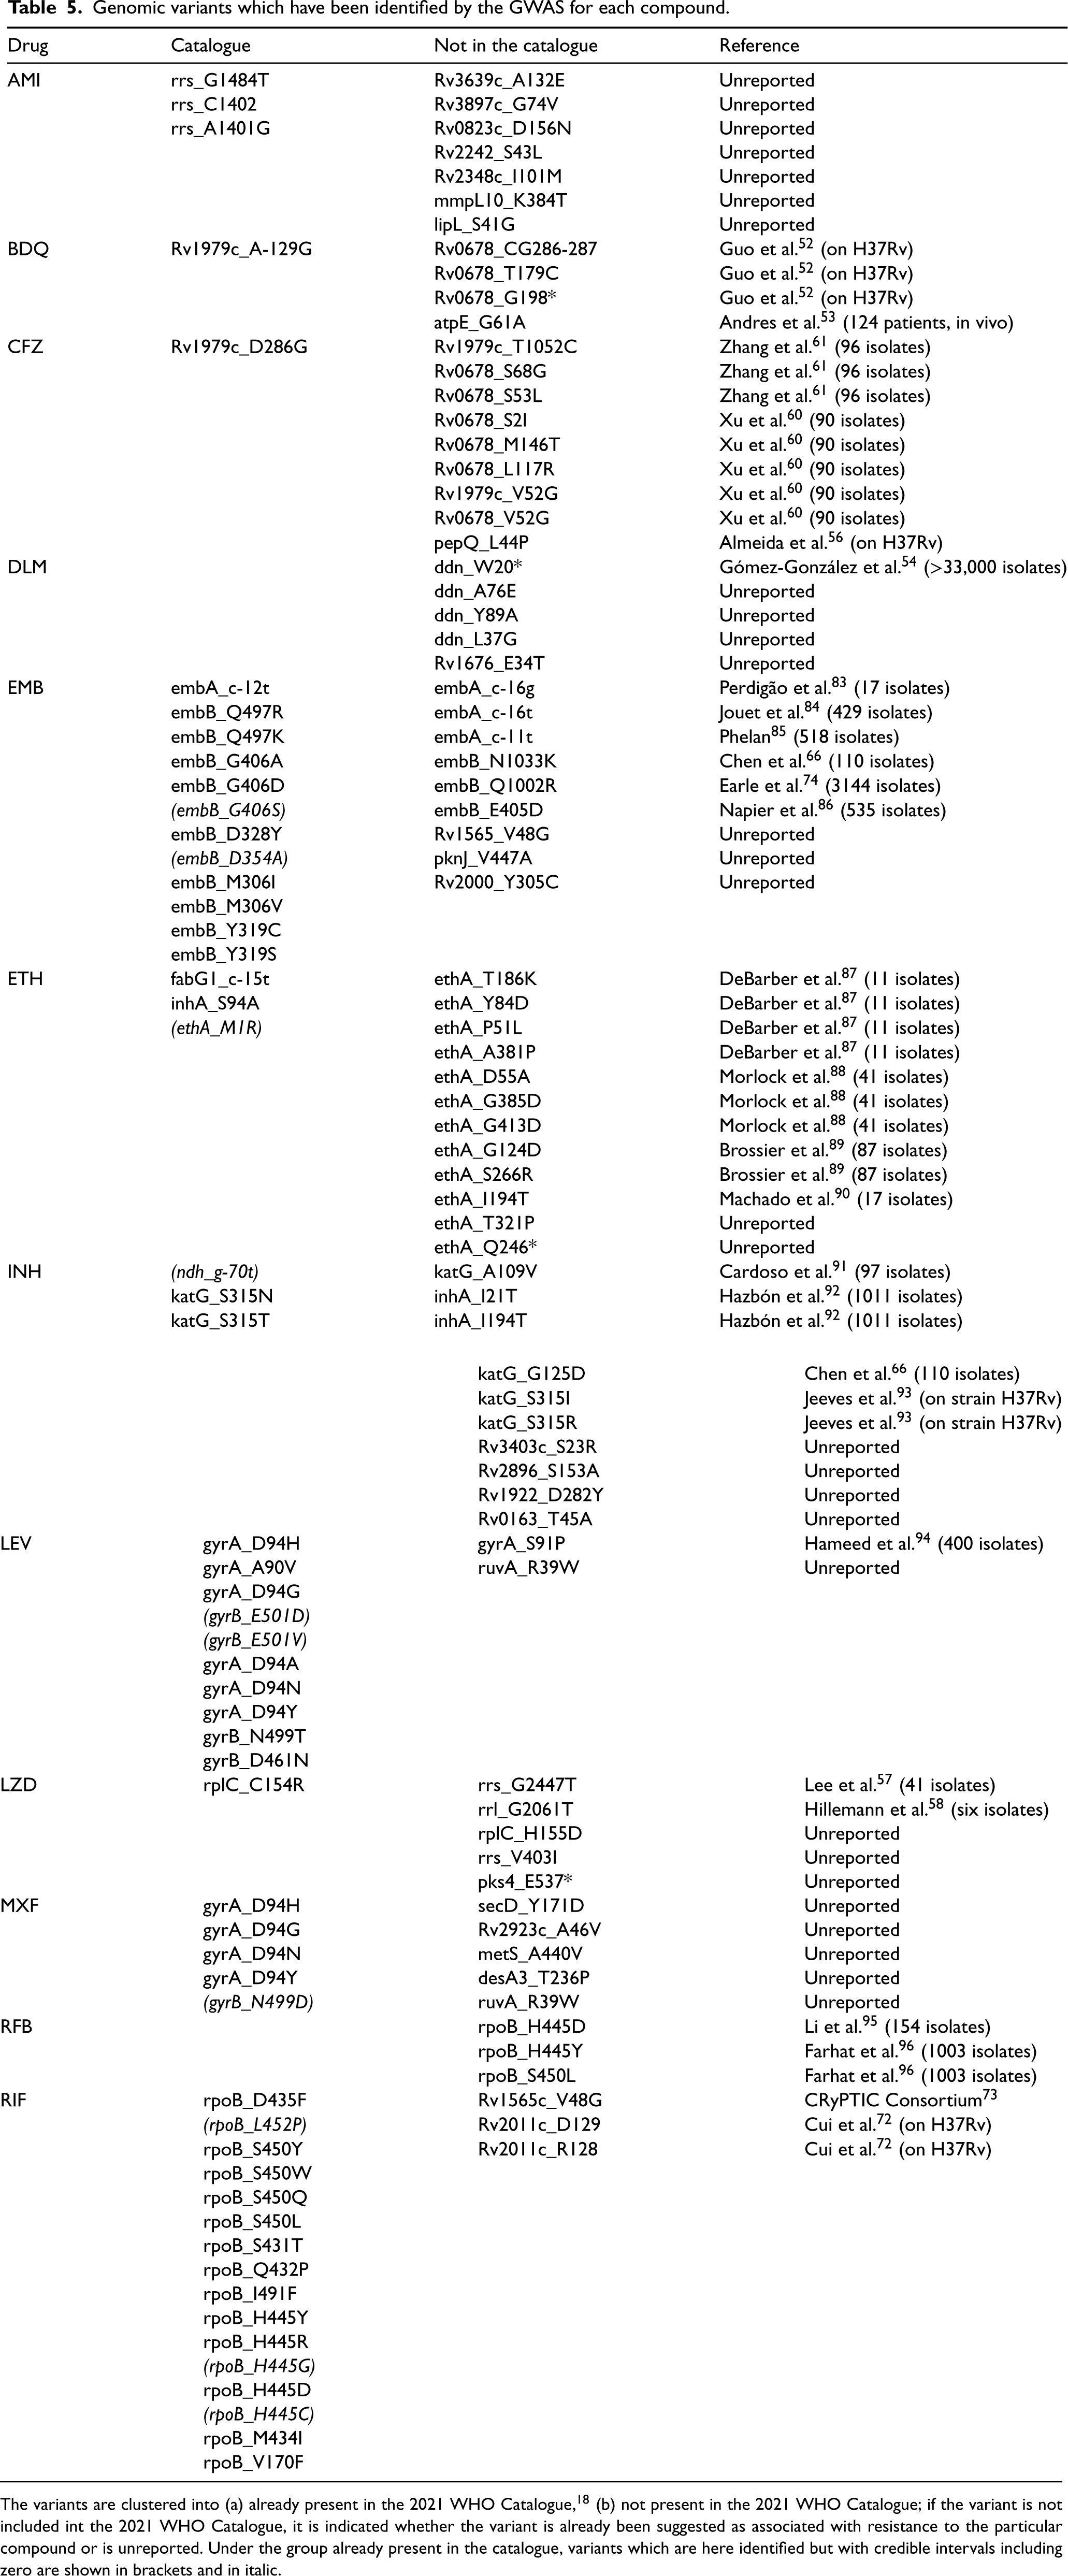
Table 5 includes all the variants that has been identified as positively associated to some levels of resistance in the isolates, for each compound. For each compound, the proposed approach has been able to suggest variants which are not included in the recent WHO Catalogue, 18 whose results are based on the same dataset analysed in our work. Some of these variants have already been proposed in the literature, but usually with experiments involving a small number of isolates, or only virulent version of H37Rv, or more generically associated with resistance but not for a specific compound.
Genomic variants which have been identified by the GWAS for each compound.
Genomic variants which have been identified by the GWAS for each compound.
The variants are clustered into (a) already present in the 2021 WHO Catalogue, 18 (b) not present in the 2021 WHO Catalogue; if the variant is not included int the 2021 WHO Catalogue, it is indicated whether the variant is already been suggested as associated with resistance to the particular compound or is unreported. Under the group already present in the catalogue, variants which are here identified but with credible intervals including zero are shown in brackets and in italic.
With respect to the new drugs, it is interesting to notice that the method has identified mutations on
Relatively to the repurposed drugs, in the 2021 WHO Catalogue no mutation meets the criteria for association to the CFZ resistance. On the other hand, in this study, we were able to associate three mutations in
For these new or repurposed drugs, the proposed approach present one strong advantage. From Figure 1, it is evident that the distributions of some drugs present long tails, but with small number of cases with high values of MIC (BDQ, CFZ, and DLM): since the drugs have more recently introduced for treatment of tuberculosis, the bacteria have not yet developed widespread mechanisms of resistance. The ability to identify clusters to separate susceptible from resistant cases is important because in a GWAS for such drugs the signals coming from the susceptible cases are stronger than the ones coming from resistant cases, since there is a disparity in the number of strains associated with each group. As an example, Figure 2 shows the Manhattan plots for CFZ when using the clusters identified using GM (similar results for DP) and when using the clusters identified using censored GM. A Manhattan plot is a scatter plot displaying the p-values in logarithmic scale associated with each genomic variant, ordered on the
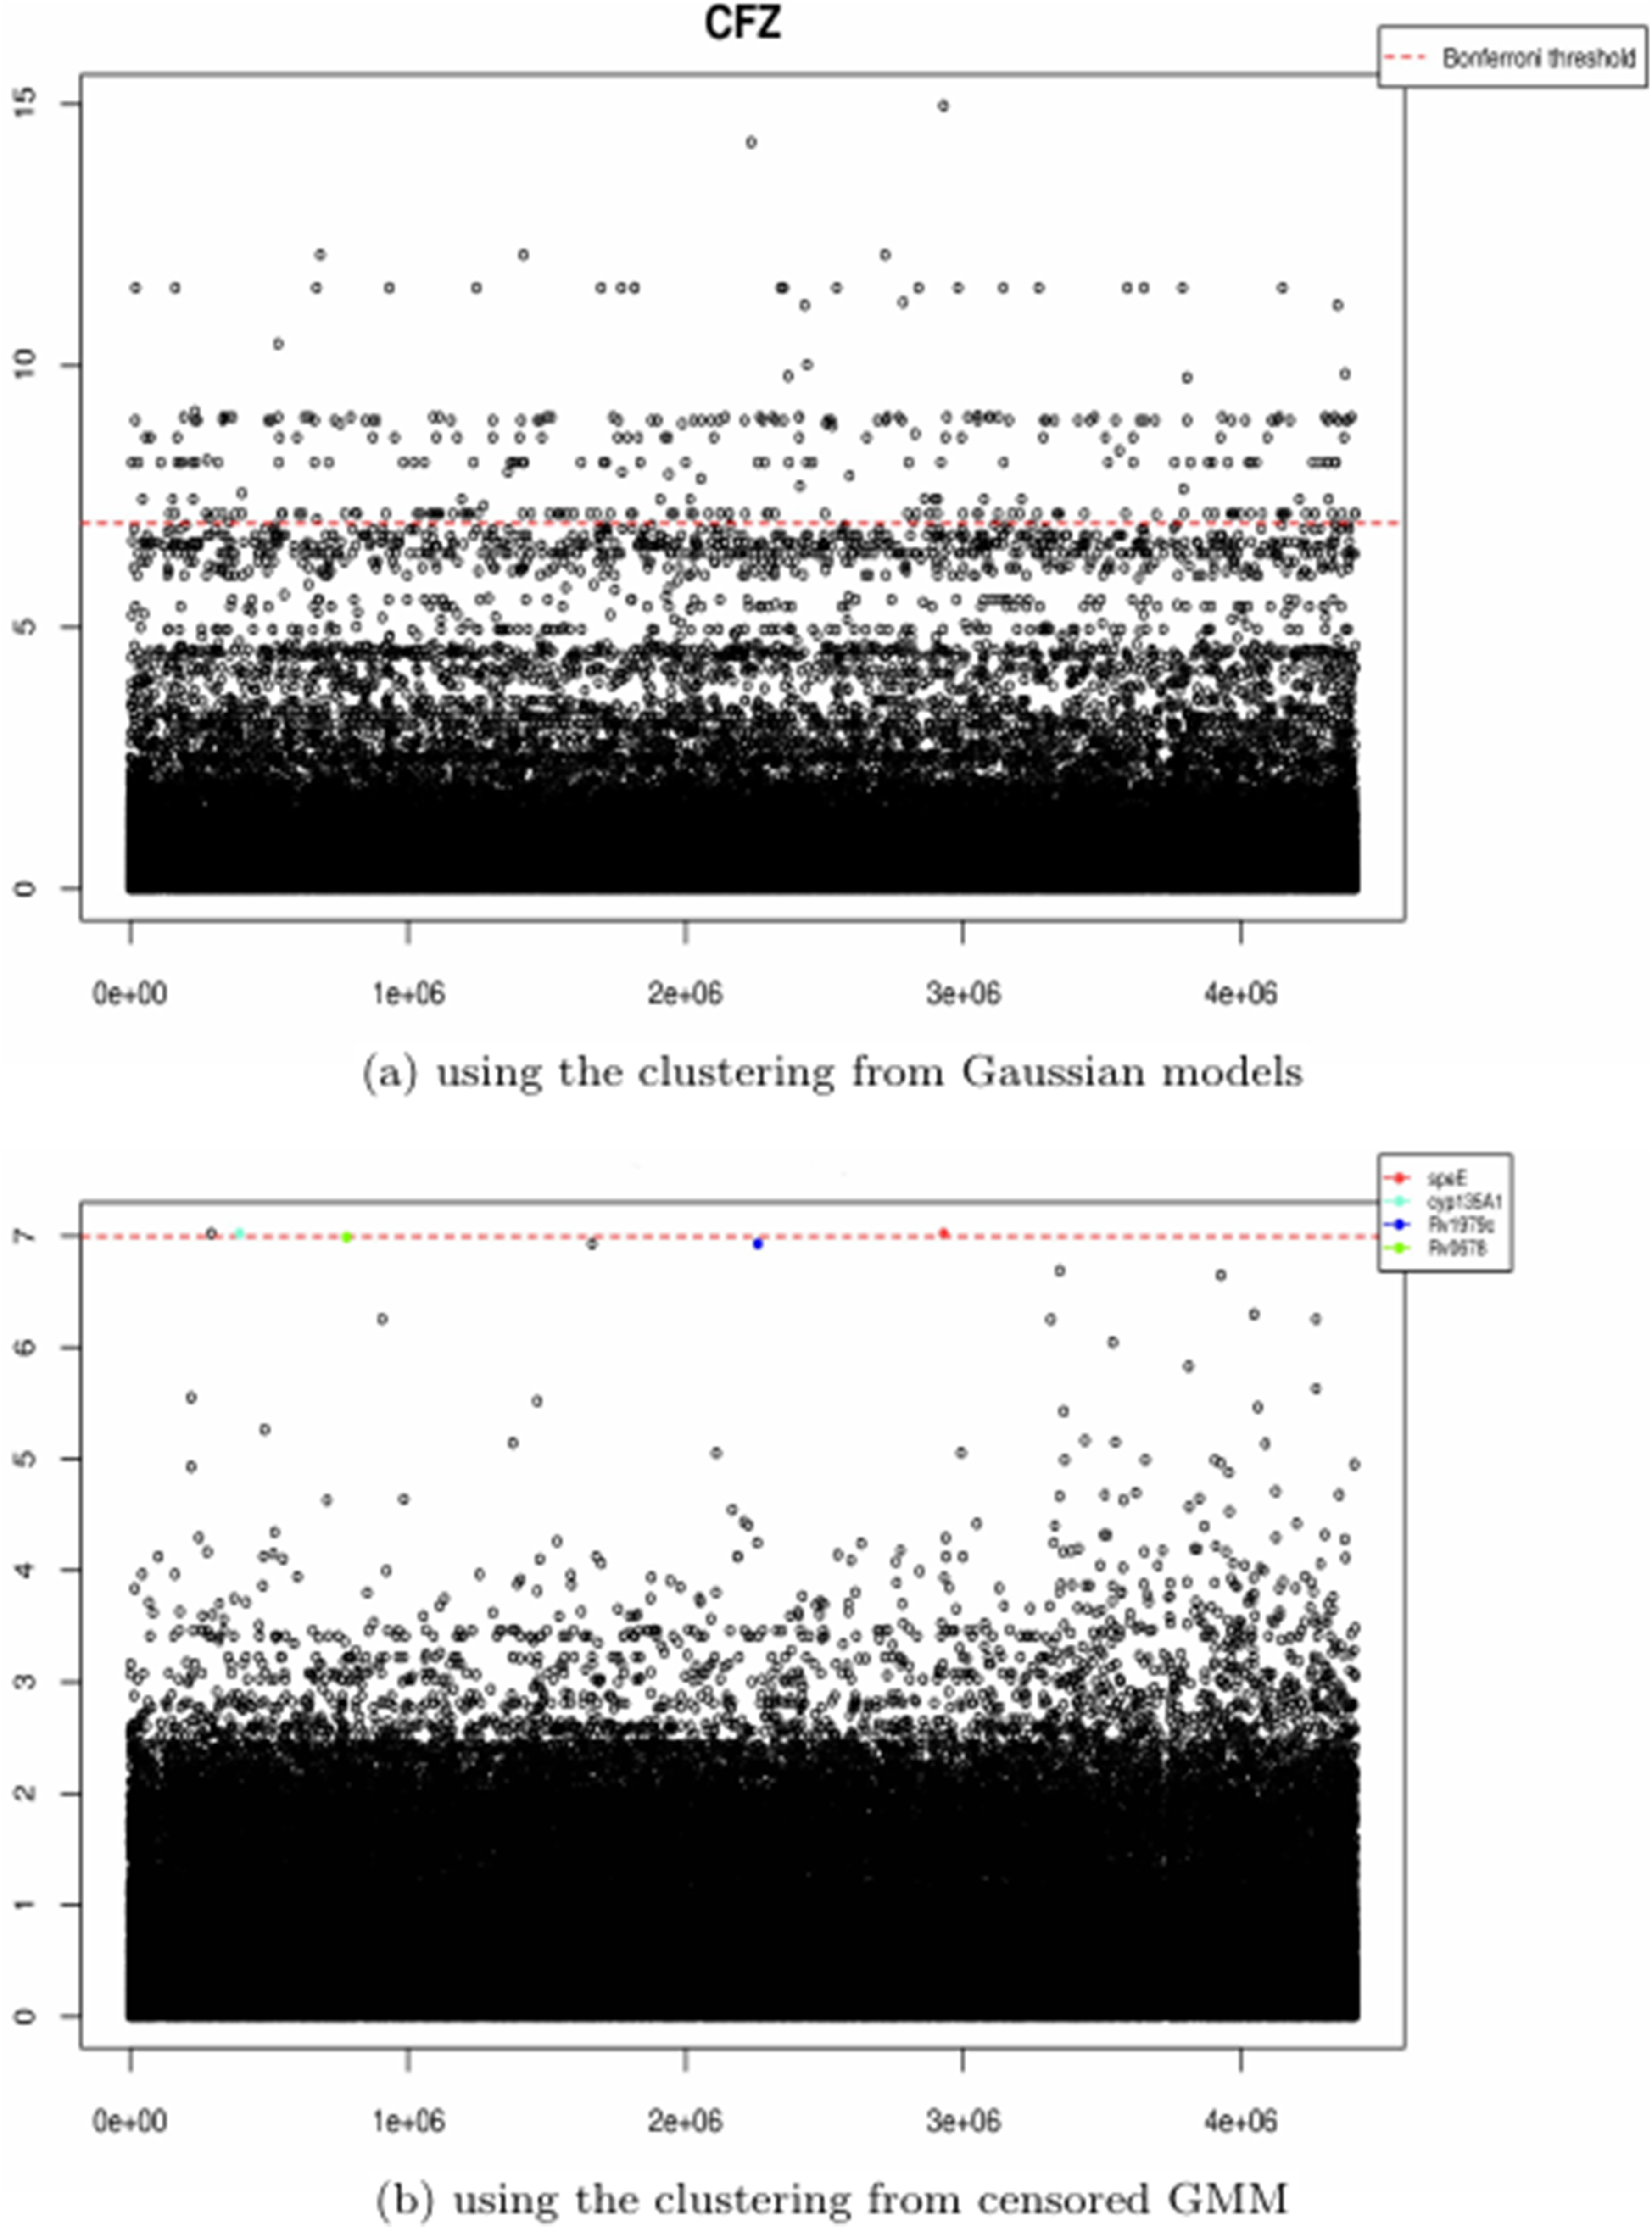
Manhattan plots resulting from a genome-wide regression with outcomes given by level of resistance identified by a Gaussian mixture model (a) and the censored Gaussian mixture model proposed in this work (b).
The first-line drugs have been extensively studied in the literature. The proposed approach identifies most of the positive associations for resistance to INH in genes
Most mutations present in the 2021 WHO Catalogue as associated to resistance to RIF have been identified in this study as well, however, it is interesting to notice that our approach is able to identify two variants relative to gene
Several variants already present in the 2021 WHO Catalogue as associated to resistance to EMB have been found with our approach (including few variants which were not found significant). Six more variants on genes
Among the other second-line drugs, the proposed approach allows to identify additional genes involved in the development of resistance to AMI, beyond
Most of the variants associated to resistance to LEV in the WHO Catalogue, on gene
Finally, three variants in
This work has proposed a method to analyse distributions of MICs through mixture models and allocate strains to groups representing different levels of resistance to the antimicrobials, instead of using a binary classification defined via critical concentrations. The method presents several advantages.
First, the use of mixture models allows to identify several levels of resistance and possibly associate each of them with different genomic variants: some of them can be associated with high level of resistance, while others can be associated with intermediate levels of resistance and the possibility to separate levels of resistance is important to identify rare genomic variants.
Second, the method is defined in a Bayesian framework and this allows to introduce assumptions on the phenomenon of resistance. In particular, Section 4 shows that an assumption of conservativeness in the number of groups in the mixture model allows to increase the accuracy of the classification of susceptible and resistant strains. On the contrary, using a uniform prior distribution on the number of components or a nonparametric approach based on Dirichlet process priors leads to a large number of components, and it is more likely to split the susceptible group into subgroups, which may hide resistance mechanisms in particular associated with rare variants.
Finally, the method allows to deal with the discrete nature of the registered data, which are characterized by double censoring: both interval censoring (data are recorded at fix levels of concentrations) and boundary censoring (there are a maximum and a minimum concentration tested in the plate). The possibility to deal with this double censoring reduces the bias in the estimation process noticed by Annis and Craig. 25
The proposed approach is flexible and general, and can be automatically applied, with the reduction of experimental inputs. At this stage, antimicrobials are treated independently, however, since treatments to tuberculosis are usually defined as combinations of drugs given at the same time to the patient, tuberculosis is known to have developed high levels of multi-drug resistance. Generalizations to a multivariate version of the approach are subject of current research; such modification needs to take into account the complex structure of dependence among drugs: while some drugs are dependent because they have similar chemical structure, other groups of drugs are dependent because they are often prescribed together and strains develop associated mechanisms of resistance. Therefore, it is reasonable to expect non-linear structure of dependence.
Supplemental Material
sj-pdf-1-smm-10.1177_09622802231211010 - Supplemental material for Clustering minimal inhibitory concentration data through Bayesian mixture models: An application to detect
resistance mutations
Supplemental material, sj-pdf-1-smm-10.1177_09622802231211010 for Clustering minimal inhibitory concentration data through Bayesian mixture models: An application to detect
Footnotes
Declaration of conflicting interests
The author(s) declared no potential conflicts of interest with respect to the research, authorship, and/or publication of this article.
Funding
The author(s) received no financial support for the research, authorship and/or publication of this article.
Supplemental material
Supplemental material for this article is available in another file.
References
Supplementary Material
Please find the following supplemental material available below.
For Open Access articles published under a Creative Commons License, all supplemental material carries the same license as the article it is associated with.
For non-Open Access articles published, all supplemental material carries a non-exclusive license, and permission requests for re-use of supplemental material or any part of supplemental material shall be sent directly to the copyright owner as specified in the copyright notice associated with the article.