
Abstract
In large epidemiologic studies, it is typical for an inexpensive, non-invasive procedure to be used to record disease status during regular follow-up visits, with less frequent assessment by a gold standard test. Inexpensive outcome measures like self-reported disease status are practical to obtain, but can be error-prone. Association analysis reliant on error-prone outcomes may lead to biased results; however, restricting analyses to only data from the less frequently observed error-free outcome could be inefficient. We have developed an augmented likelihood that incorporates data from both error-prone outcomes and a gold standard assessment. We conduct a numerical study to show how we can improve statistical efficiency by using the proposed method over standard approaches for interval-censored survival data that do not leverage auxiliary data. We extend this method for the complex survey design setting so that it can be applied in our motivating data example. Our method is applied to data from the Hispanic Community Health Study/Study of Latinos to assess the association between energy and protein intake and the risk of incident diabetes. In our application, we demonstrate how our method can be used in combination with regression calibration to additionally address the covariate measurement error in self-reported diet.
Keywords
Introduction
In large epidemiologic or clinical studies with periodic follow-up, it is often impractical to obtain a gold standard or reference standard test on all subjects at each visit time throughout the study. Instead, an inexpensive measure is typically used to assess the outcome of interest at each follow-up visit, and the reference standard diagnostic test is obtained less frequently, if at all. Compared to some reference standard diagnostic tests that may involve invasive or otherwise impractical biomarkers, self-reported disease status is inexpensive, noninvasive, and relatively easy to obtain in large cohorts. However, self-reported disease status is often prone to measurement error. For example, some studies have shown that the sensitivity and specificity of self-reported diabetes are imperfect compared to the reference instruments of fasting glucose and hemoglobin A1c (HbA1c).1,2
There has been considerable interest in methods that use surrogate or auxiliary data to improve the efficiency of inference for time-to-event analyses. In this context, surrogate endpoints are defined as outcomes that are intended to replace the true, or gold standard, outcome of interest, while auxiliary data refers to variables that are used to improve the efficiency of the analysis of the gold standard endpoint. 3 Pepe 4 introduced an estimated likelihood method for general data structures in which surrogate outcomes are available on all subjects and true outcomes are available on a subset. Magaret 5 extended this work to the setting of the discrete proportional hazards model. Zee et al. 6 proposed a similar semiparametric estimated likelihood approach for parameter estimation that allows for real-time validation and does not require true and surrogate censoring times to be equal when the surrogate outcome is censored. Fleming et al. 7 presented an augmented likelihood approach that incorporates auxiliary information into the proportional hazards model for cases when true endpoints are available on all study subjects. In their method, the likelihood can be augmented for subjects using an auxiliary (surrogate) outcome whose true endpoints are censored prior to their auxiliary endpoints.
Several methods have been developed to correct errors in binary outcome variables for discrete or interval-censored time-to-event settings when gold or reference standard outcome data are not available. For these approaches, estimated values of sensitivity and specificity are incorporated into the analysis to correct for the bias induced by errors in the event classification variable. Specifically, Meier et al. 8 introduced an adjusted proportional hazards model for estimating hazard ratios in the presence of discrete failure time data subject to misclassification. Gu et al. 1 developed a likelihood-based method that models the association of a covariate with an interval-censored time-to-event outcome recorded by error-prone self-reports or imperfect diagnostic tests, assuming the proportional hazards model. Boe et al. 9 extended this work by incorporating regression calibration to additionally adjust for covariate measurement error for cases in which one or more exposure variables of interest are also recorded with error. Each of these methods addressed the misclassification by incorporating externally estimated sensitivity and specificity into the estimation.
In this article, we develop an augmented likelihood approach that incorporates error-prone auxiliary data into the analysis of an interval-censored, gold standard assessment of a time-to-event outcome. Our method is distinct from prior work in that we consider the setting where subjects have both frequent follow-up with an auxiliary outcome and infrequent follow-up with a gold standard evaluation. Our method may be applied when auxiliary outcome data, observed through periodically collected self-reports or diagnostic tests, are available either before or after the gold standard is scheduled to be observed. This work is motivated by the Hispanic Community Health Study/Study of Latinos (HCHS/SOL), a prospective longitudinal cohort with (1) a reference standard biomarker-defined diabetes status variable, using fasting glucose and/or hemoglobin A1c (HbA1c), available at baseline and once more after 4–10 years, and (2) self-reported diabetes status recorded annually, up to 4 years beyond the reference test.
We begin the next section by introducing notation and presenting the theoretical development of our augmented likelihood function. We also extend our method to handle data from a complex survey design and develop a sandwich-form for the estimated design-based variance. In Section 3, we provide an extensive numerical study to demonstrate how we can improve statistical efficiency by using the proposed method instead of standard approaches for interval-censored survival data that do not leverage the auxiliary data. Section 4. introduces the HCHS/SOL study and illustrates the results of applying the proposed approach to this data set to assess the association between dietary energy, protein, and protein density intake and incident diabetes. For this analysis, we additionally address the covariate measurement error. We conclude by providing a discussion of our findings and potential extensions of this work inSection 5.
Methods
Notation and time-to-event model
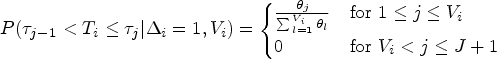
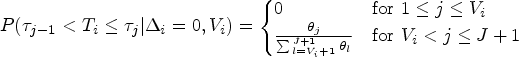
Define
Following previous work to address misclassified interval-censored outcomes in the proportional hazards model,9,1,10 we assume the

We will now derive the likelihood contribution for subjects with observed


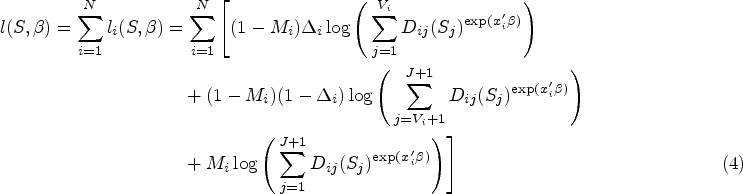
In this section, we extend our proposed method that uses both auxiliary and gold standard outcomes to accommodate data from a complex survey sampling design, such as HCHS/SOL, that may include cluster-based probability sampling. We develop a weighted analogue of our log-likelihood function from equation (4). Later, we outline how one might use a sandwich-form variance estimator to address within-cluster correlation and stratification.
Define
Regression calibration to adjust for covariate measurement error
Regression calibration is a popular analysis method for correcting bias in regression parameters when exposure variables are prone to error.13,14 We will now outline how to use regression calibration with our proposed estimator in the setting of a complex sampling design.
Assume
Measurement error model
We assume that the error-prone

With the assumed calibration subset, we can regress
Assuming that the measurement error models described above hold, we can use the predicted values from our calibration model to substitute the first moment
As we described in Section 2.2, variance estimation for data from a complex survey design often requires extra steps to address within-cluster correlation. When regression calibration is applied, variance estimates from the outcome model need to be adjusted further to account for the extra uncertainty added by the calibration model step. To account for this extra uncertainty, we adopt a sandwich variance estimator obtained by stacking the calibration and outcome model estimating equations, following the approach outlined by Boos and Stefanski. 19 This approach was described specifically for the two-stage regression model setting of regression calibration in the context of a complex survey design by Boe et al. 20 We refer to this estimator as the “proposed sandwich variance estimator,” which differs from the “sandwich-form” variance estimator described in Section 2.2. in that it incorporates the extra uncertainty added by the estimated exposure in addition to addressing the complex survey design. The proposed sandwich approach may also be extended to multi-stage models. This is relevant for the HCHS/SOL data example, where two additional components may be added to the stacked estimating equations to account for the extra uncertainty added by the estimation of sensitivity and specificity. We provide details on the form of the proposed sandwich variance estimator in Supplemental Section S2.3.
Asymptotic theory
We assume the regularity conditions of Foutz 21 and apply the techniques of Boos and Stefanski 19 for verifying asymptotic normality of standard maximum likelihood estimators to establish the asymptotic properties of the proposed estimator. In Supplemental Section S3, we outline regularity conditions for the following three settings: (1) the proposed method estimator is applied to data from a simple random sample from the population; (2) the proposed method estimator is extended to accommodate data from a complex survey design; and (3) the proposed method estimator is extended to incorporate regression calibration in the presence of complex survey data.
Numerical study
We now present a simulation study conducted to assess the numerical performance of the proposed method compared to a standard approach for the analysis of interval-censored gold standard time-to-event outcome data that does not make use of the auxiliary outcome data. Following Prentice and Gloeckler,
22
when continuous time data following a proportional hazards model have been grouped into discrete time intervals, as occurs when there is interval censoring over common discrete times, one approach to obtaining regression parameter estimates is to fit a generalized linear model with a binary response and complementary log-log link. We refer to this method as the standard approach, that is, the no auxiliary data analysis approach. We explore various settings to show when the proposed estimator improves over the standard interval-censored approach in terms of statistical efficiency. In particular, we vary the probability that the gold standard indicator
Simulation setup
We first consider a set of simulations assuming a simple random sample. We simulate a single covariate of interest from either a gamma distribution with shape and scale parameters of 0.2 and 1, respectively, (denoted Gamma
True event times were generated from a continuous time exponential distribution. We simulated a follow-up schedule with four fixed visit times at which we collect the auxiliary outcome variables. Later, we run a set of simulations that considered less frequently observed auxiliary data follow-up, where each subject is only observed two or three times. We assume that at year 4, a gold standard outcome variable is also recorded. To obtain average censoring rates (
To simulate scenarios in which the gold standard outcome
We then performed a set of simulations with similar settings, except we sought to examine the performance of the proposed method with data having the structure of a complex survey design. Code for this set of simulations was developed and described by Baldoni et al.
24
and is available on GitHub at https://github.com/plbaldoni/HCHSsim. Briefly, this simulation pipeline creates a superpopulation of nearly 200,000 individuals in 89,777 households, across 376 block groups, and four geographic strata and then for each simulation iteration drew survey samples from it using a stratified three-stage sampling scheme. The resulting simulated data sets include sampling weights, stratification variables, and cluster indicators. To simulate our gamma covariate for this set of simulations, we considered different shape and scale parameters for the four strata: shape
We conducted one additional simulation that aimed to mimic the HCHS/SOL study, which included error-prone covariates. We aimed for an average sample of approximately 12,987 in order to approximate the number of HCHS/SOL cohort subjects without baseline diabetes. We assumed eight fixed visit times at which the auxiliary outcome was recorded, with a simulated gold standard occurring at year 4. Missingness in the gold standard indicator at year 4 was set at
For all simulation settings we conducted 1000 simulation iterations and report median percent (
Simulation results
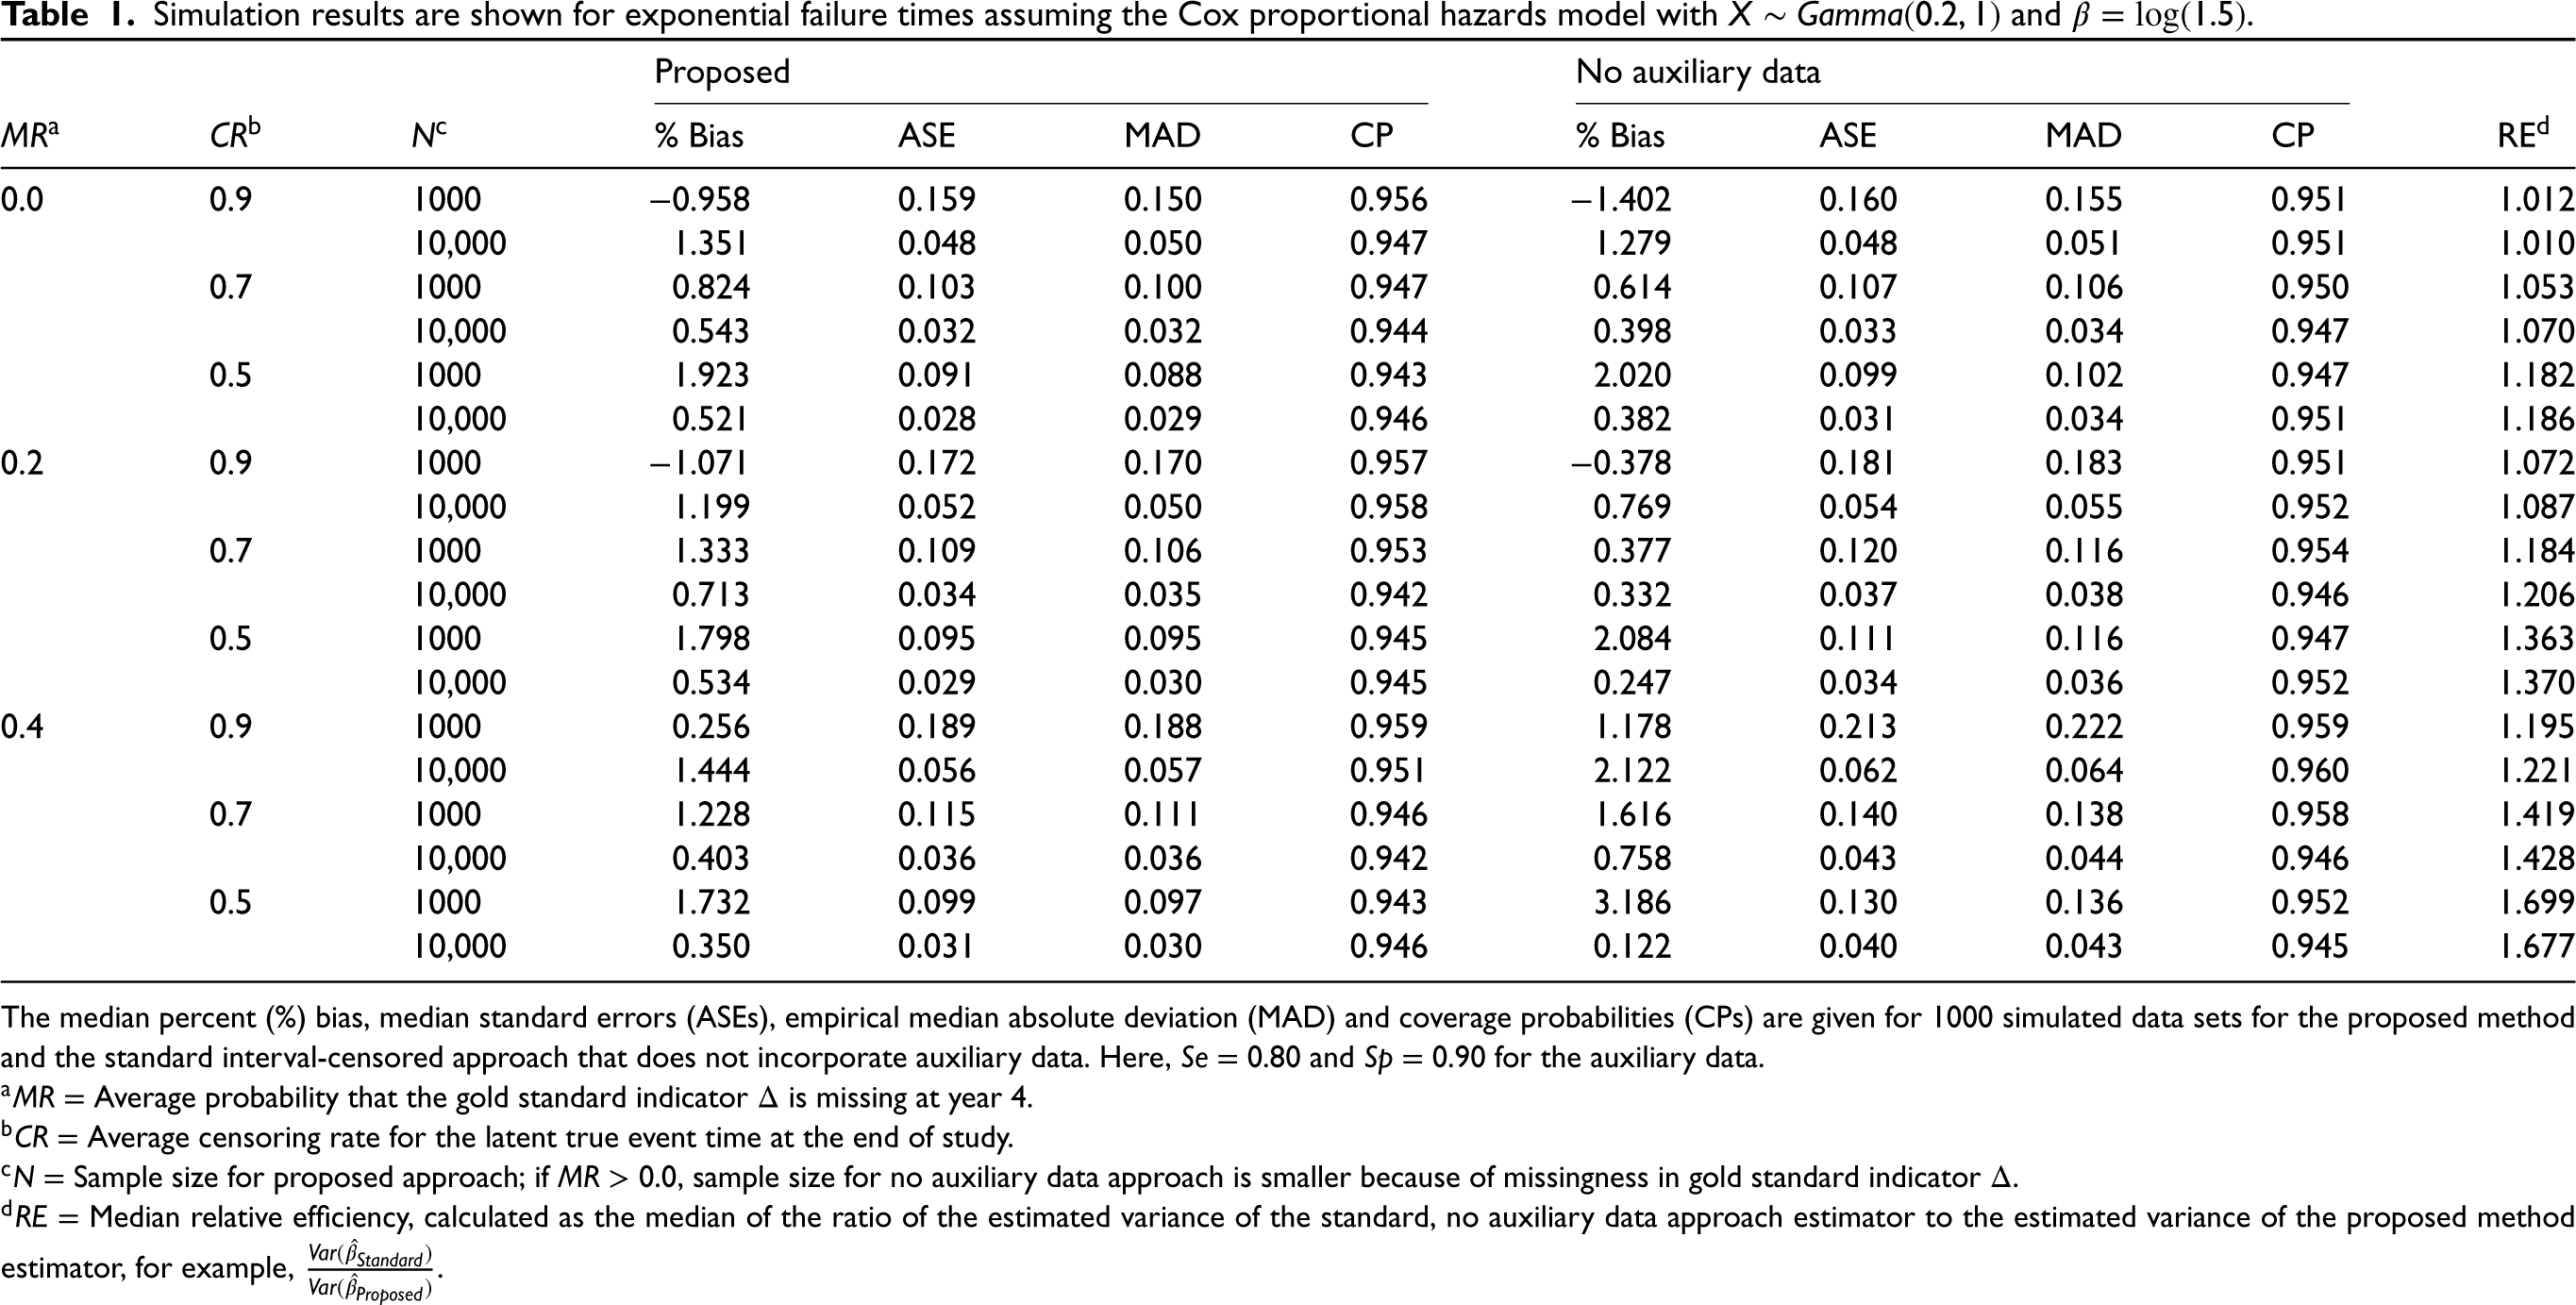
In Tables 1 to 5, we present results for the proposed method compared to the standard interval-censored approach without auxiliary data. Table 1 shows the results for the simple random sample with the regression parameter of interest
Simulation results are shown for exponential failure times assuming the Cox proportional hazards model with
and
.
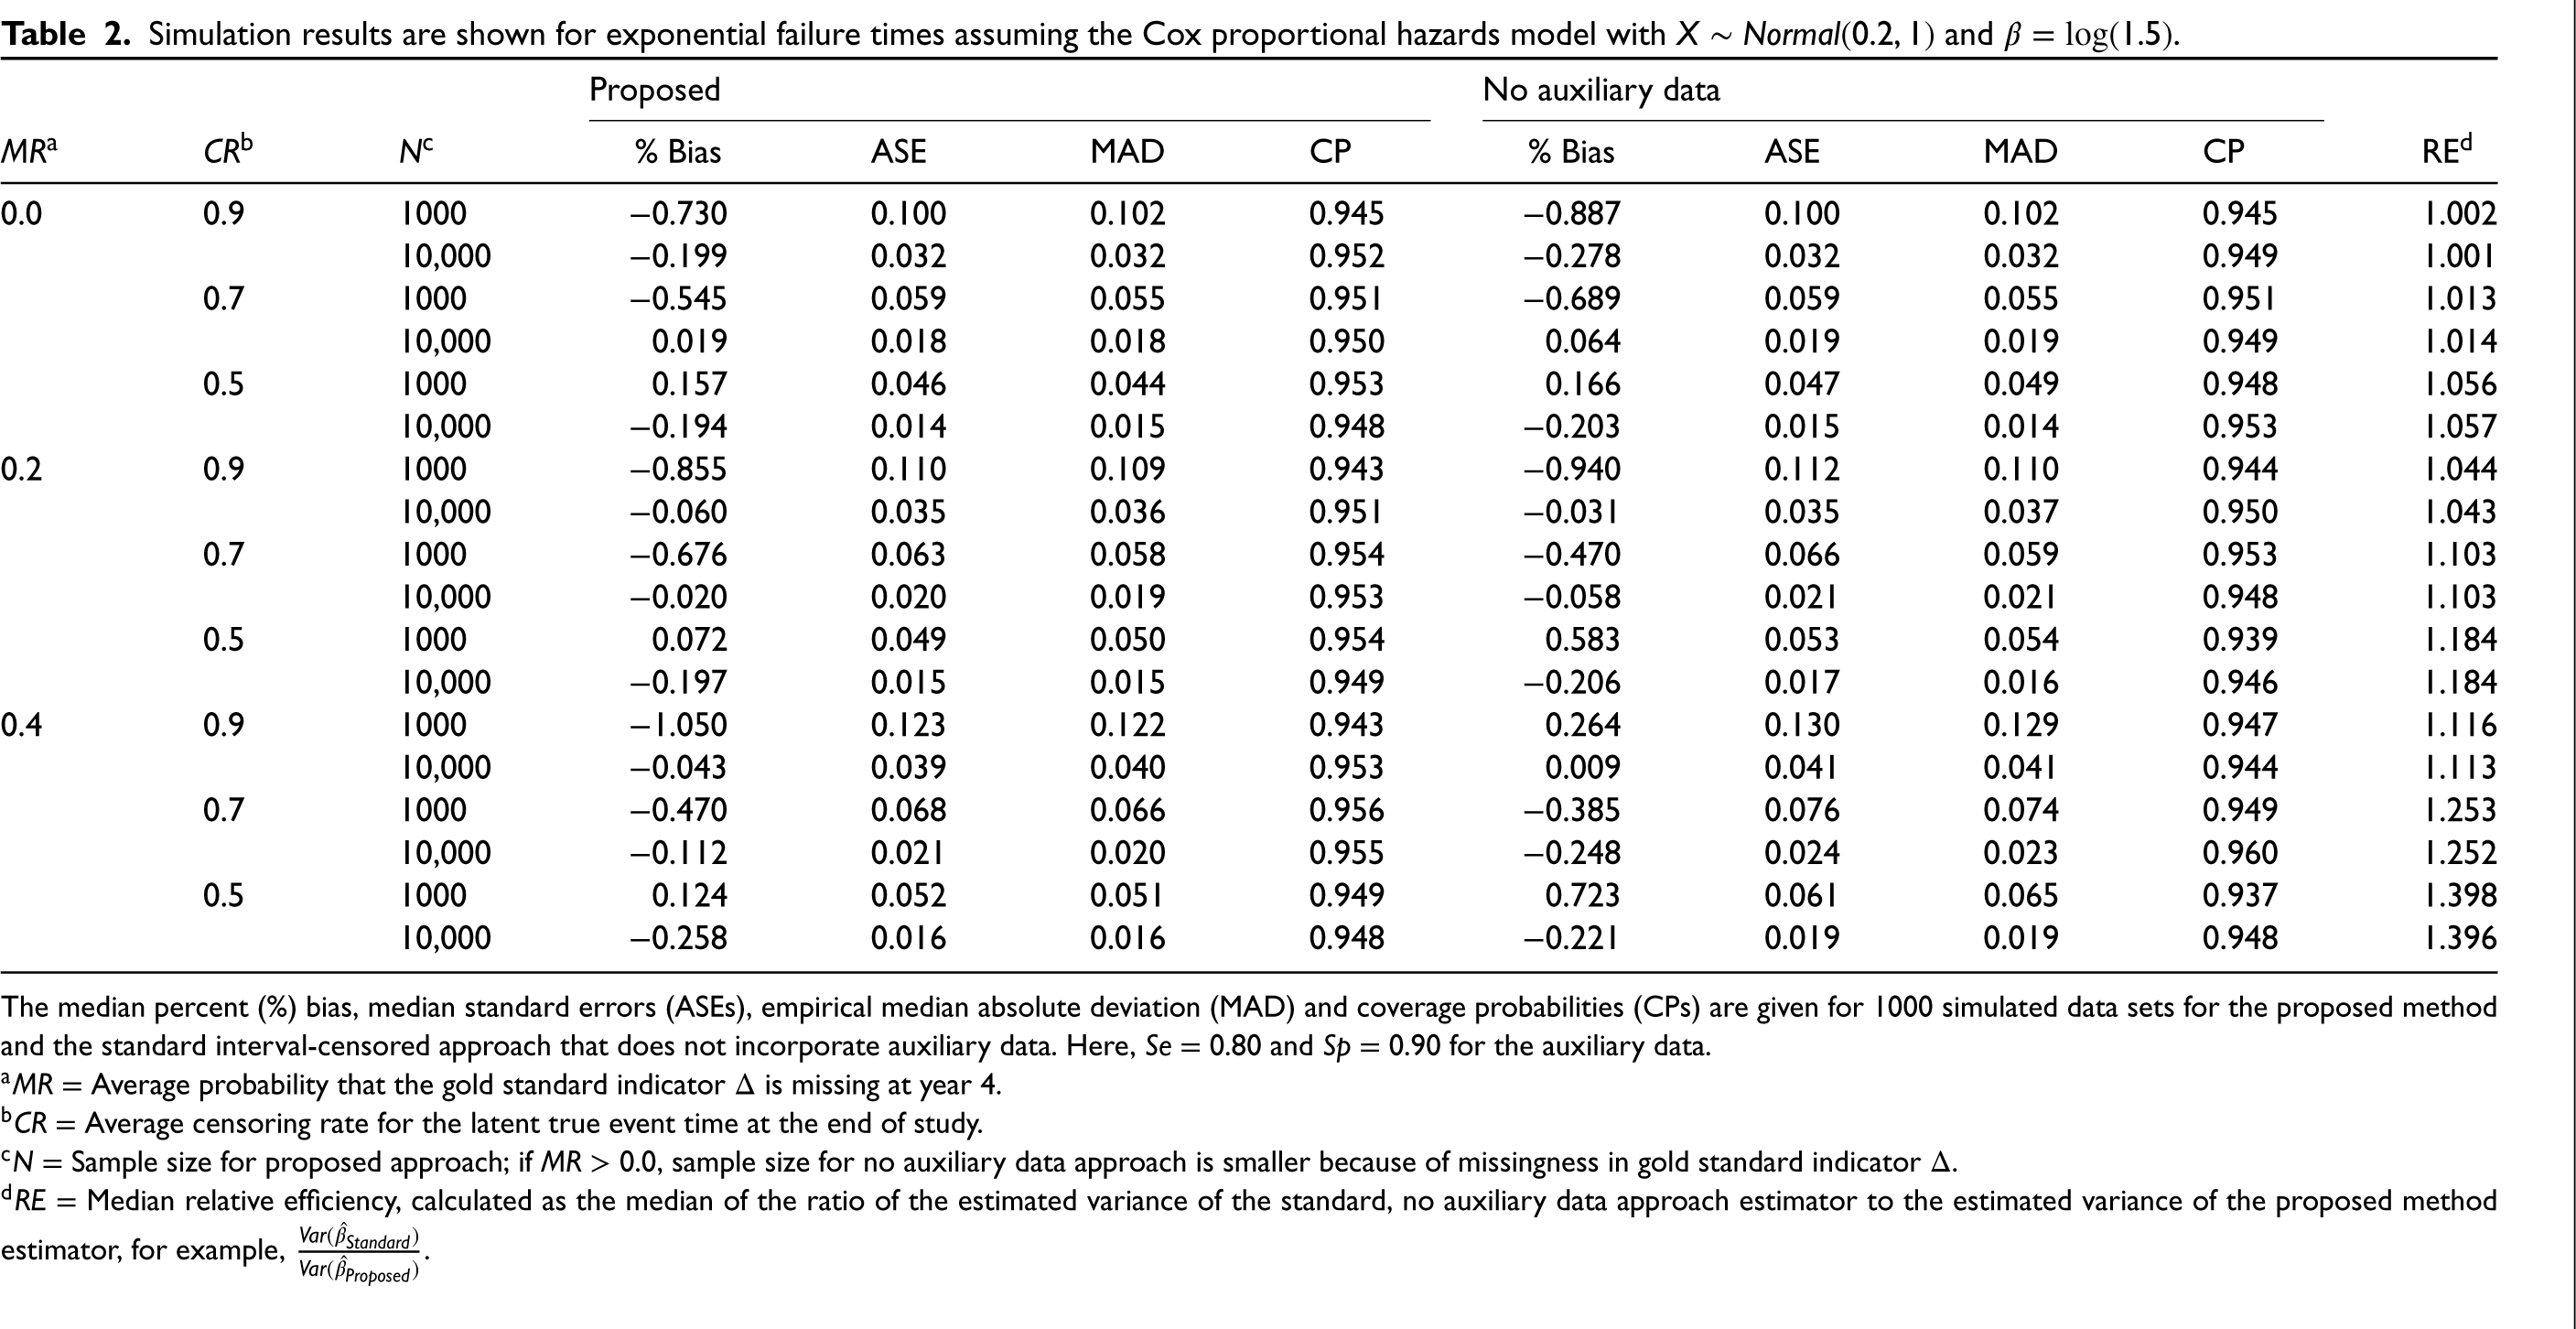
Simulation results are shown for exponential failure times assuming the Cox proportional hazards model with
The median percent (%) bias, median standard errors (ASEs), empirical median absolute deviation (MAD) and coverage probabilities (CPs) are given for 1000 simulated data sets for the proposed method and the standard interval-censored approach that does not incorporate auxiliary data. Here,
In Supplemental Table S2 , we change the sensitivity and specificity values for the auxiliary outcome and let
Table 2 shows the results when the covariate of interest follows a normal distribution. Relative efficiencies in this table range from 0.1% to 39.8%, indicating that efficiency gains are not as high for a normally distributed covariate. We also assess the gains in relative efficiency for the proposed method over the standard interval-censored approach for
Table 3 presents results for data simulated from a complex survey. In all scenarios, the weighted proposed estimator has minimal finite sample bias. The sandwich-form estimator for the design-based variance performs unfavorably in some settings for both the proposed and standard method, with coverage as low as 89.9%, particularly when the sample size is small (
We present results for the simulation that mimic the data structure and complex survey design of the HCHS/SOL study in Table 4. Median percent bias is
Simulation results are shown for exponential failure times assuming the Cox proportional hazards model with
The median percent (%) bias, median standard errors (ASEs), empirical median absolute deviation (MAD) and coverage probabilities (CPs) are given for 1000 simulated data sets for the proposed method and the standard interval-censored approach that does not incorporate auxiliary data. Here,
Simulation results are shown for data simulated to be from a complex survey with exponential failure times assuming the Cox proportional hazards model with
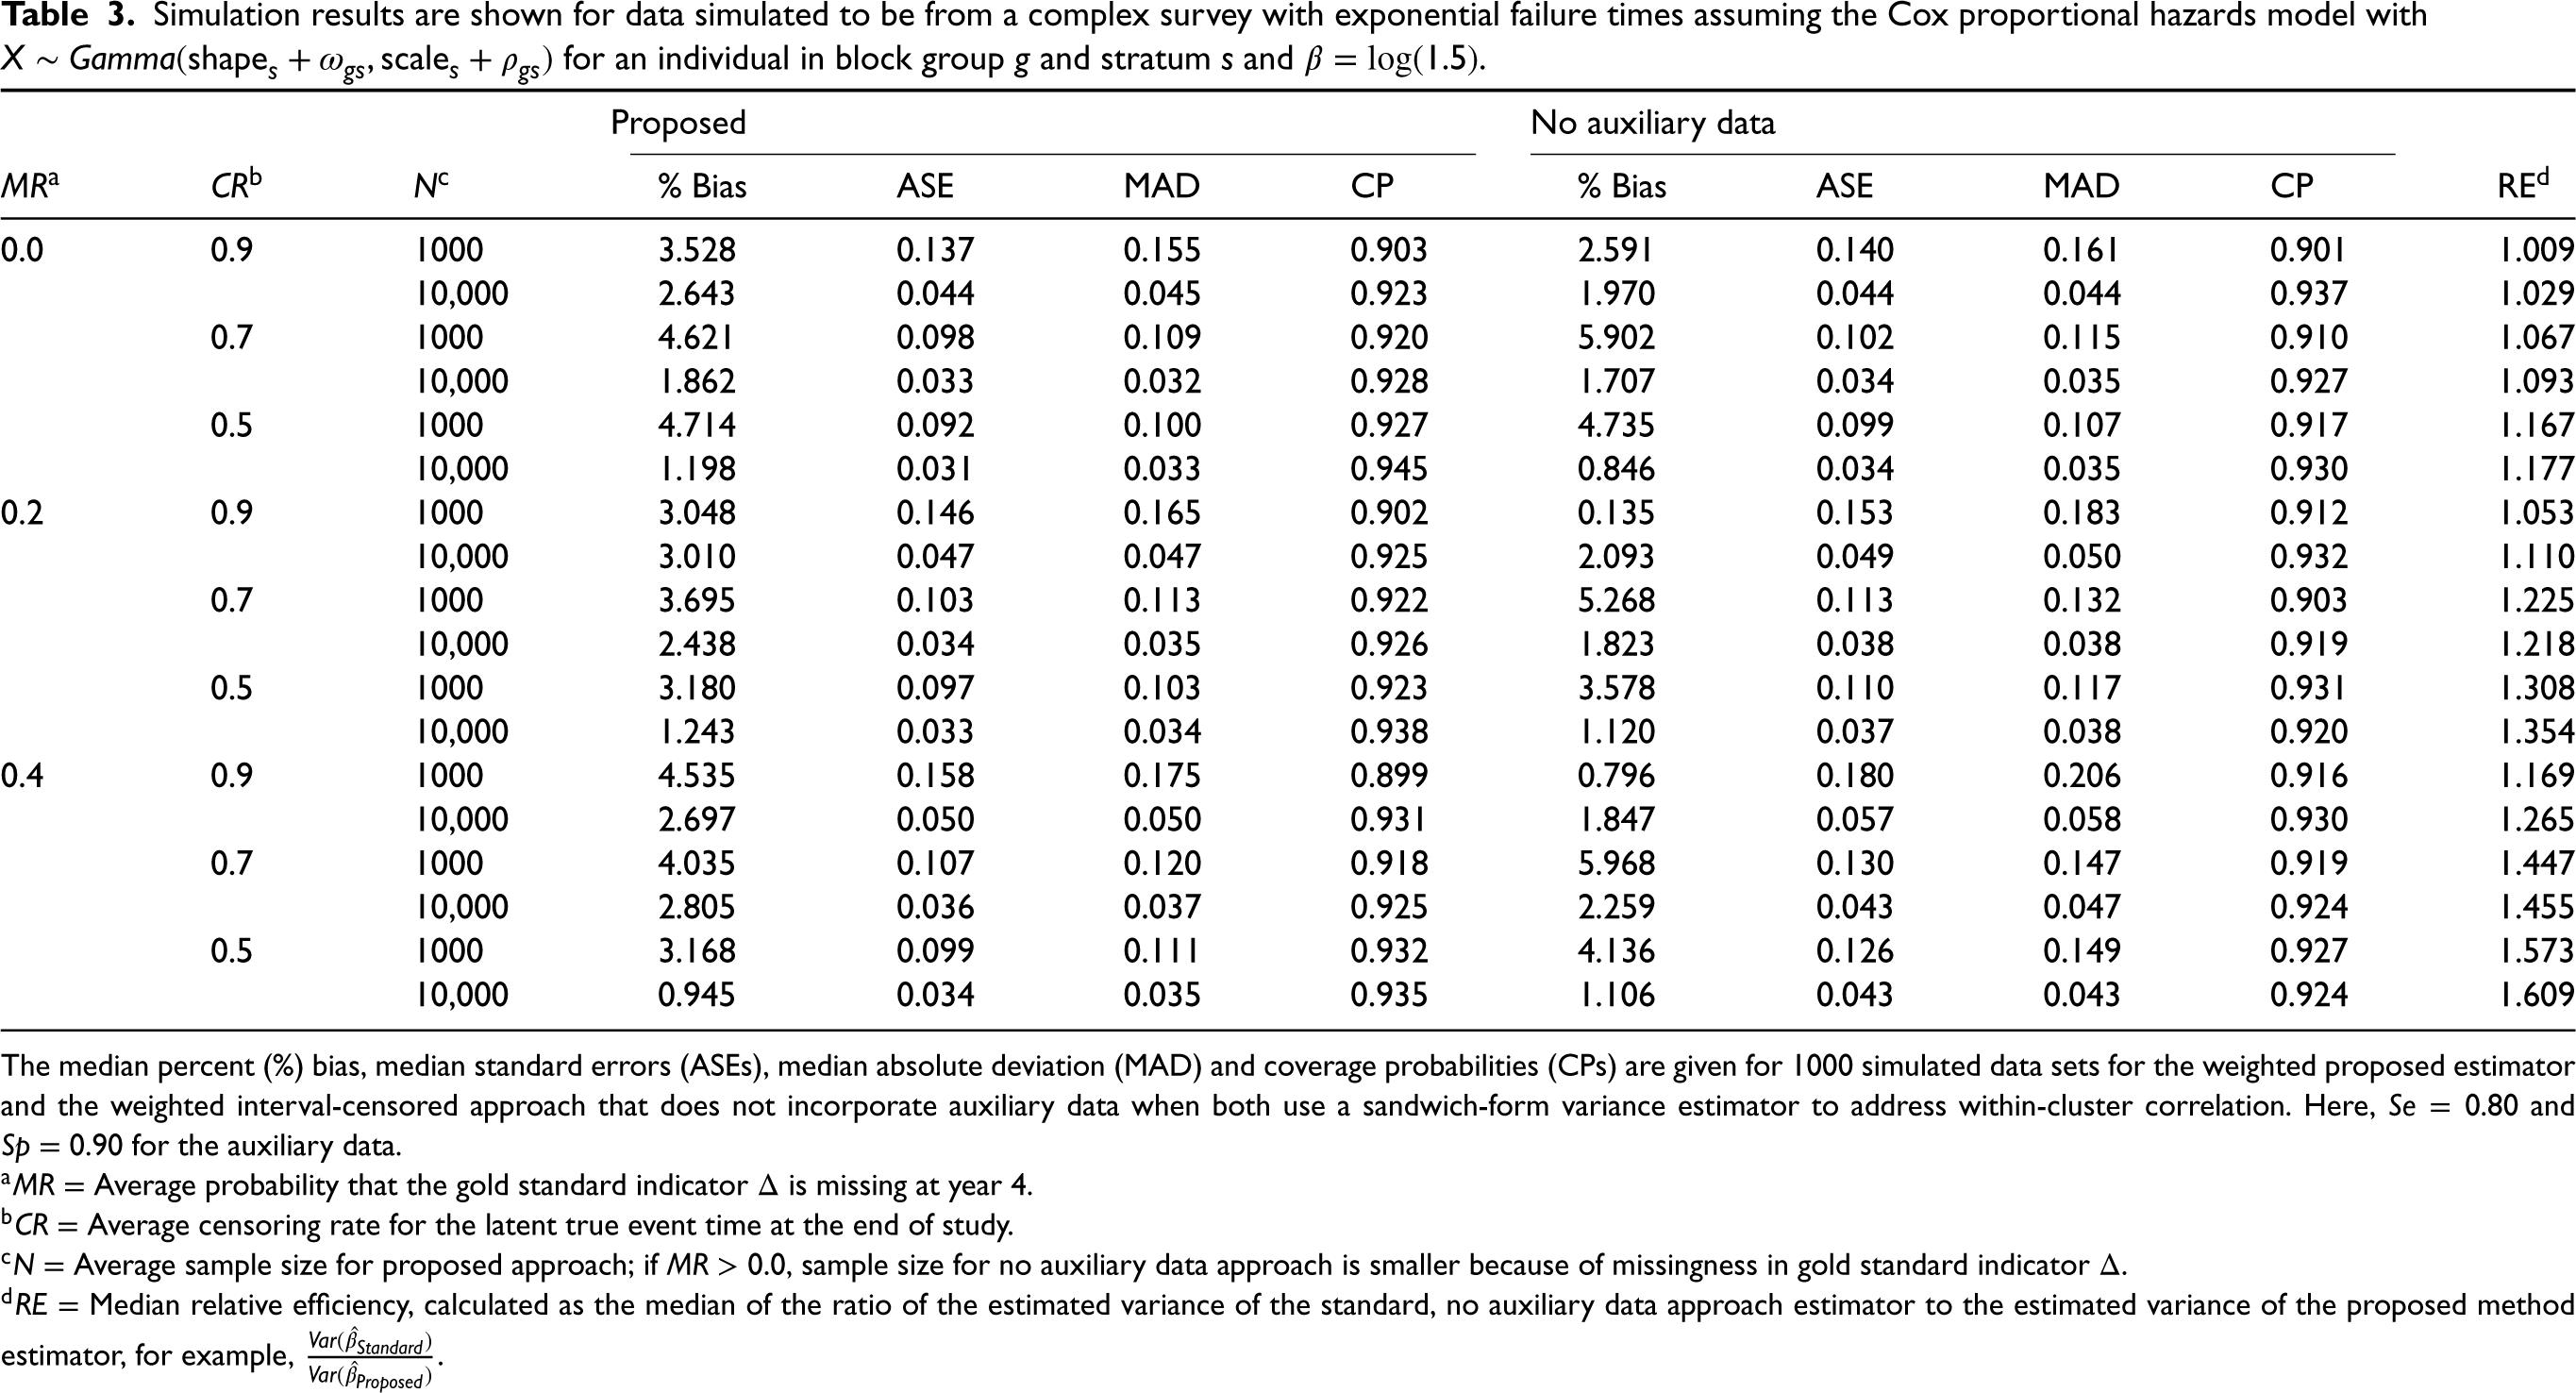
The median percent (%) bias, median standard errors (ASEs), median absolute deviation (MAD) and coverage probabilities (CPs) are given for 1000 simulated data sets for the weighted proposed estimator and the weighted interval-censored approach that does not incorporate auxiliary data when both use a sandwich-form variance estimator to address within-cluster correlation. Here,
Simulation results are shown for data simulated to have a similar structure to the complex survey design of HCHS/SOL, assuming exponential failure times and the Cox proportional hazards model with
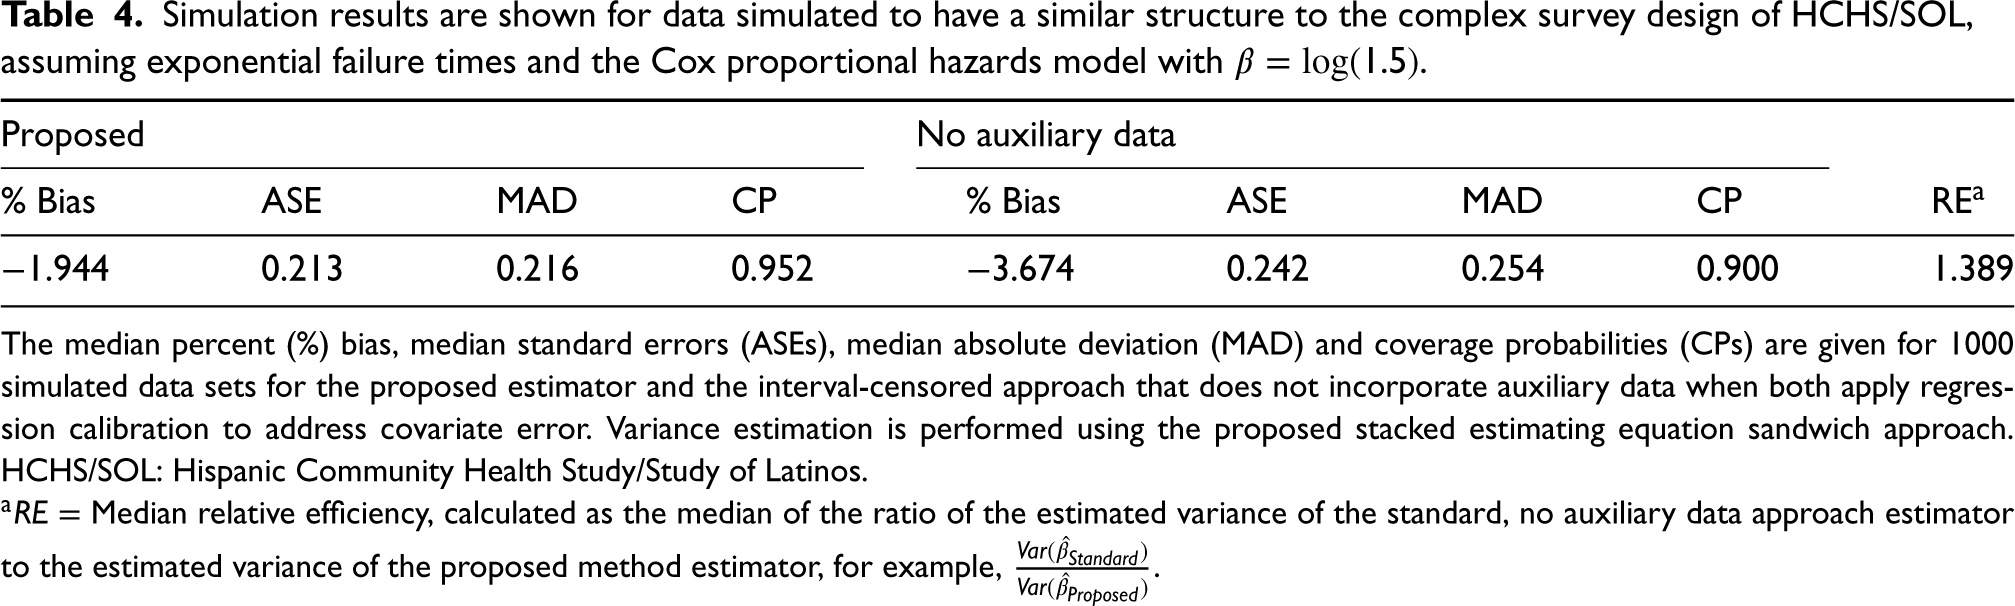
The median percent (%) bias, median standard errors (ASEs), median absolute deviation (MAD) and coverage probabilities (CPs) are given for 1000 simulated data sets for the proposed estimator and the interval-censored approach that does not incorporate auxiliary data when both apply regression calibration to address covariate error. Variance estimation is performed using the proposed stacked estimating equation sandwich approach. HCHS/SOL: Hispanic Community Health Study/Study of Latinos.
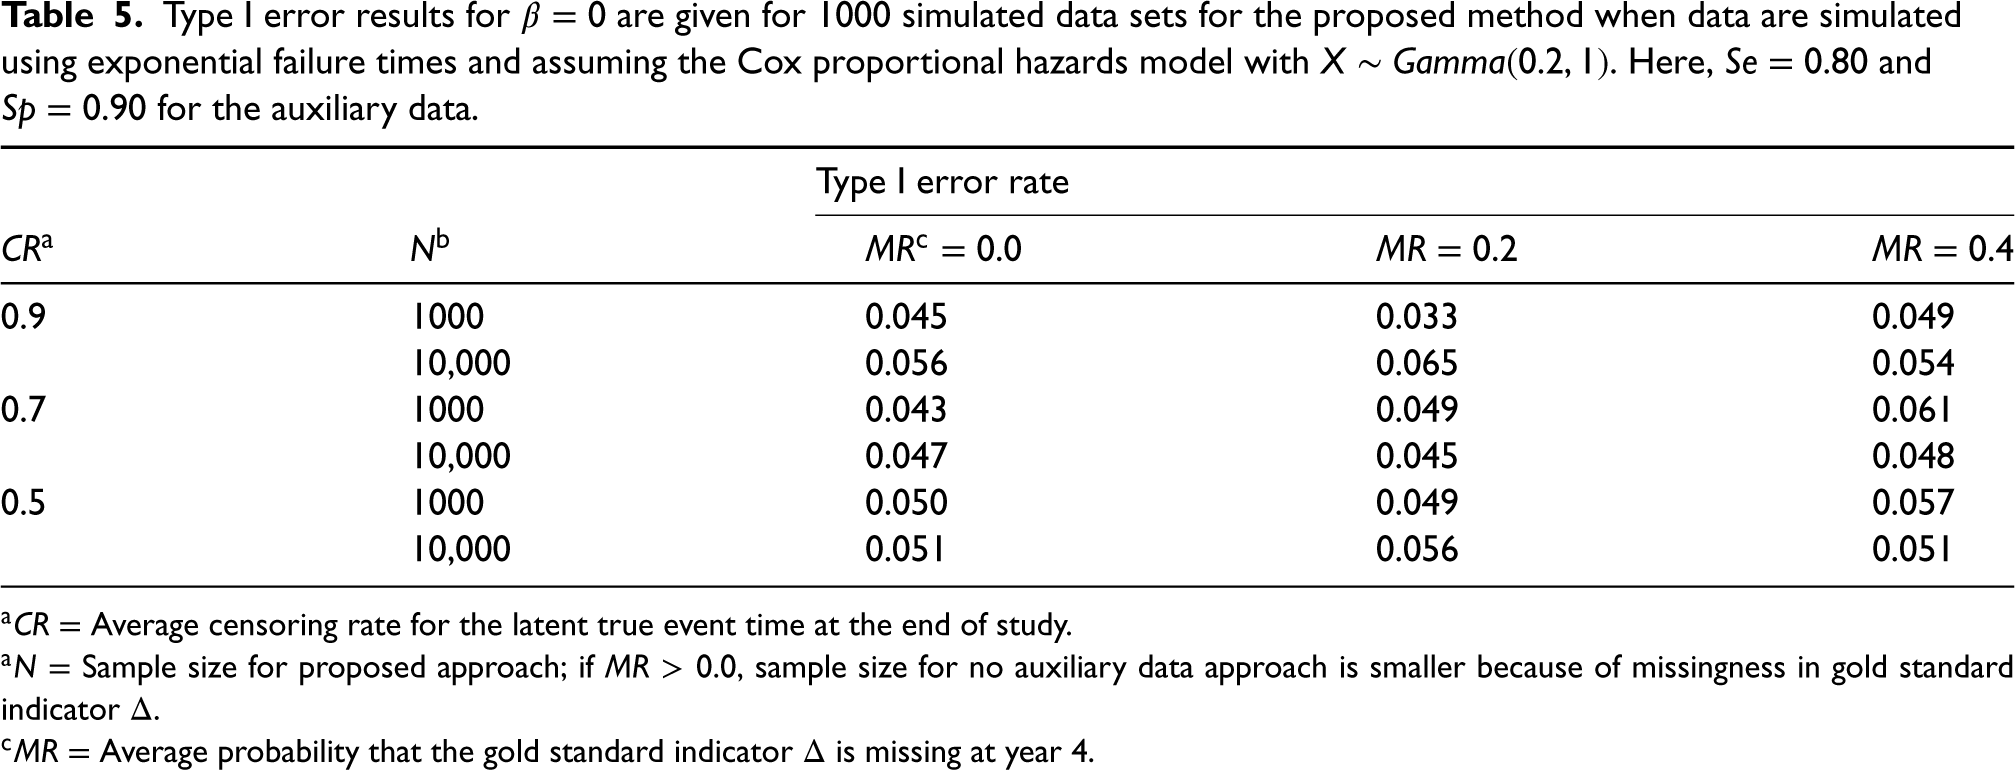
Type I error results for
HCHS/SOL study description
The HCHS/SOL is an ongoing multicenter community-based cohort study of 16,415 self-identified Hispanics/Latino adults aged 18–74 years recruited from randomly selected households at four locations in the United States (Chicago, Illinois; Miami, Florida; Bronx, New York; San Diego, California). Households were selected using a stratified two-stage area probability sample design. The sampling methods, design, and cohort selection for HCHS/SOL have been described previously.27,28 The study was designed to identify risk factors for chronic diseases including diabetes and to quantify morbidity and all-cause mortality. Prevalent diabetes was recorded using a biomarker-defined reference standard at the baseline, in-person clinical examination visit (2008–2011). The study design was such that all participants were scheduled to be assessed for incident diabetes using (1) a biomarker-defined reference standard at a second clinic visit (visit 2) 4–10 years after baseline, and (2) annual telephone follow-up assessments recorded by self-report. Participants have up to eight annual telephone follow-up calls. We found that most (
We applied the proposed method to assess the association between energy, protein and protein density (percentage of energy from protein) dietary intakes and the risk of diabetes in HCHS/SOL using both the self-reported diabetes outcome (auxiliary data) and the reference standard. The dietary exposure variables were recorded using an error-prone, self-reported 24-hour recall instrument that is believed to follow to the linear measurement error model. A subset of 485 HCHS/SOL participants were enrolled in the Study of Latinos: Nutrition and Physical Activity Assessment Study (SOLNAS). 25 The SOLNAS subset included the collection of objective recovery biomarkers that conform to the classical measurement error model and therefore can be used to develop calibration equations for the self-reported dietary intake variables.
This work was motivated by more detailed, ongoing research looking to understand the relationship between several dietary factors and risk of chronic diseases, including diabetes and cardiovascular disease, in the HCHS/SOL cohort. The proposed method is applied to a random subset of 8200 eligible participants, which is half of the original HCHS/SOL cohort (
All analyses accounted for the HCHS/SOL complex survey design. Specifically, sampling weights reflecting unequal probabilities of selection (i.e.
Results
Of the 8200 randomly selected participants, 5922 (72.2%) had the reference standard diabetes status variable available at visit 2. Of participants who had visit 2 data, 5 (0.1%) participants returned to the clinic 4 years post-baseline, 1490 (25.2%) returned after 5 years, 3294 (55.6%) returned after 6 years, 739 (12.5%) returned after 7 years, and 394 (6.7%) returned after 8 years. Using the reference standard, 623 (10.5%) of the participants with visit 2 data had incident diabetes.
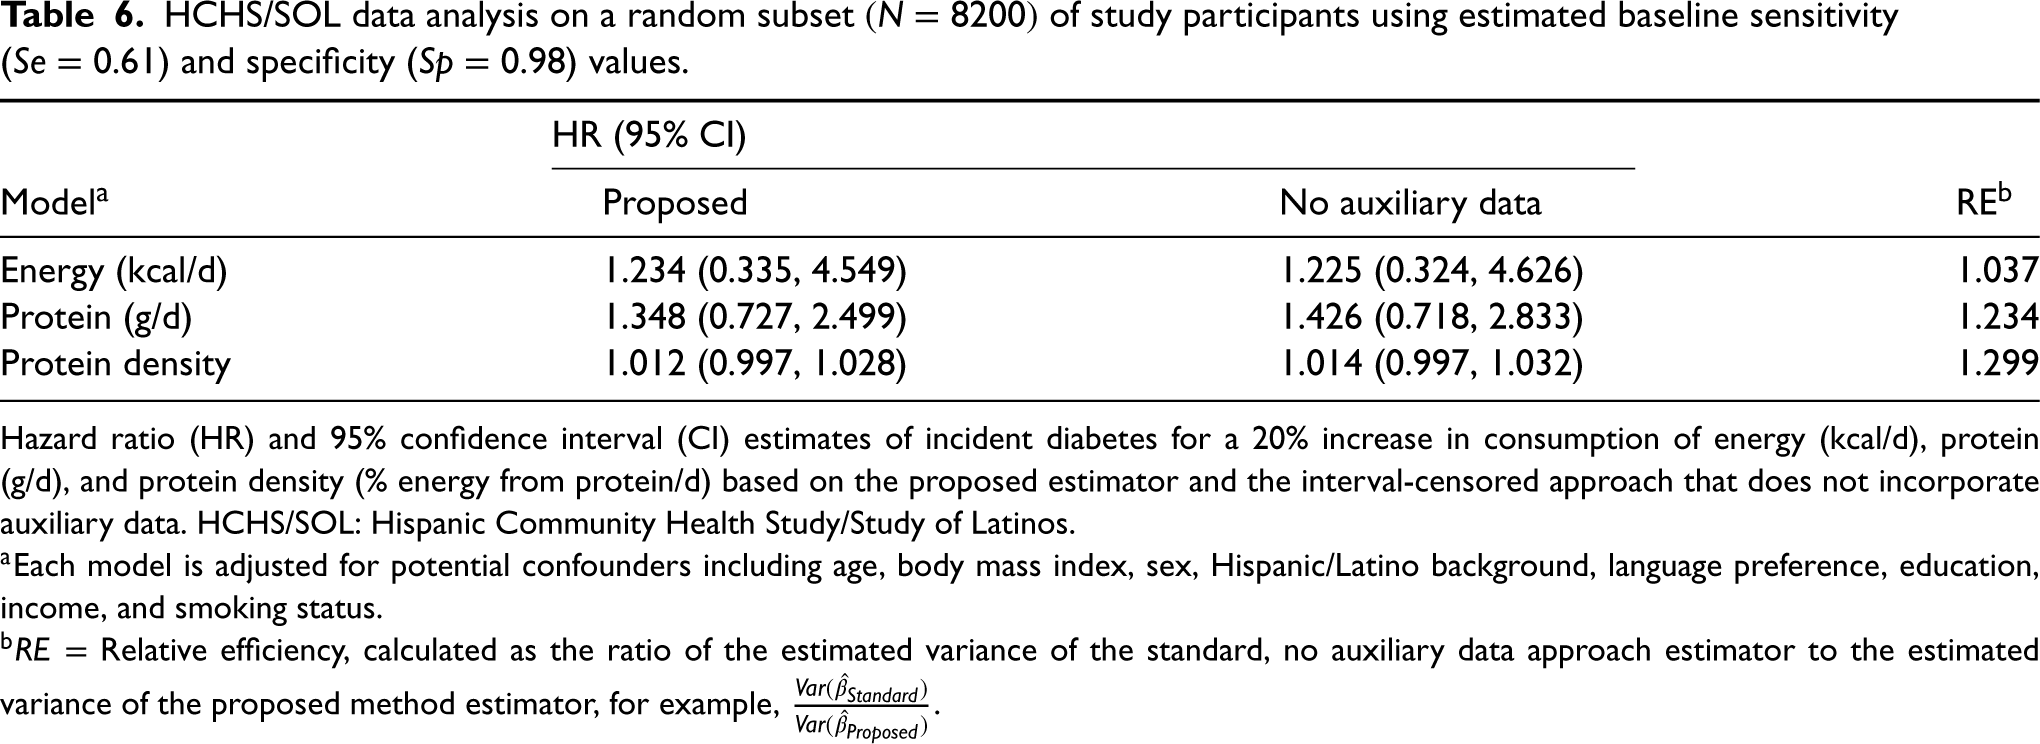
Table 6 shows the results from applying the proposed method and the standard, no auxiliary data method to the HCHS/SOL data. The HR (95% CI) for a 20% increase in energy intake was 1.234 (0.335, 4.549) for the proposed approach compared to 1.225 (0.324, 4.626) for the no auxiliary data method. For energy, we observe a relative efficiency gain of 3.7% by using the proposed method. In this case, the estimated standard error for the no auxiliary data approach is only slightly larger than that of the proposed method. Incident diabetes is not significantly associated with energy intake in either approach. For protein, the HR (95% CI) for a 20% increase in intake using the proposed method is estimated to be 1.348 (0.727, 2.499). Comparatively, we estimate an HR (95% CI) of 1.426 (0.718, 2.833) using the no auxiliary data approach. For protein, we estimate a relative efficiency gain of 23.4%. The HR for a 20% increase in protein density is estimated to be 1.012 (0.997, 1.028), compared to an HR of 1.014 (0.997, 1.032) for the no auxiliary data method. Our estimated relative efficiency gain using the proposed method over the standard approach is 29.9% when looking at protein density. We note that this large efficiency gain was from relatively small absolute changes on the log-hazard scale.
HCHS/SOL data analysis on a random subset
of study participants using estimated baseline sensitivity (
) and specificity (
) values.
HCHS/SOL data analysis on a random subset
Hazard ratio (HR) and 95% confidence interval (CI) estimates of incident diabetes for a 20% increase in consumption of energy (kcal/d), protein (g/d), and protein density (% energy from protein/d) based on the proposed estimator and the interval-censored approach that does not incorporate auxiliary data. HCHS/SOL: Hispanic Community Health Study/Study of Latinos.
In Supplemental Table S5, we present results from a sensitivity analysis that applies the proposed method using sensitivity and specificity values estimated at visit 2 (
In large cohort studies like HCHS/SOL, gold, or reference standard outcome variables may be less readily available than error-prone auxiliary outcomes. We have introduced a method that leverages all available data by incorporating error-prone auxiliary variables into the analysis of an interval-censored outcome. We developed methods for both a simple random sample and complex survey design for the case of time-independent covariates. Our results suggest that making use of auxiliary outcome data may often lead to a considerable improvement in the efficiency of parameter estimates, particularly when the gold standard outcome is missing for a subset of study participants. We illustrate the practical use of our approach in a complex survey design by applying the proposed method to the HCHS/SOL study to assess the association between energy, protein, and protein density intake and the risk of incident diabetes, while adjusting for error in the self-reported exposure. In HCHS/SOL, the reference standard diabetes outcome variable was not practical to obtain annually, while self-reported diabetes status was easily attainable. This data example served as a compelling setting for which our method could contribute. We note in this example, the sensitivity and specificity of the auxiliary outcome were unknown and had to be additionally estimated. Our proposed method still showed advantages in this case, reducing the estimated variance by 23.4% for protein and 29.9% for the protein density example; however, the relative gain for the energy exposure was less pronounced (3.7%). Our simulation that mimicked the HCHS/SOL data structure also indicated that relative efficiency gains of 38.9% are possible for a data structure of this type, even when the sensitivity and specificity of the auxiliary data were uncertain. In settings with substantial measurement error, where variance estimates can be quite large, relative efficiency improvements are extremely important and may inform cost reductions for future studies.
In the HCHS/SOL study, we observe a special case of interval-censored data in which the reference standard outcome is only observed at one time point. This type of data is often called current status data, or case I interval-censored data. 30 In our data example, the current status data arise due to the study design, as the reference standard outcome was scheduled to be recorded only once at a predetermined time point post-baseline. However, under this framework in which there is a common set of assessment times for all individuals, our method could be easily adapted to accommodate a reference standard status variable recorded at multiple time points. For the continuous time setting, future work is needed to consider how our estimation methods for interval-censored data could be extended. Several approaches have been applied for the analysis of continuous time interval-censored data, many of which have been shown to be computationally complex.31–33 These methods, however, have not yet been adapted to handle error-prone and validated outcomes. A further extension would be to consider approaches able to handle time-varying covariates.
The application of the proposed method required defining a set of common visit times across participants to avoid the curse of dimensionality. We used the assigned annual visit times to define the boundaries of the visit intervals, thus ignoring that the annual visit may not occur on the participant’s exact anniversary date. We deemed this appropriate because the observed visit times were generally quite close to the anniversary times. In other settings, where the fluctuations in visit times are more extreme, one might consider dividing time into smaller intervals. For this approach, the choice of intervals will require us to consider to what the extent the data can support estimating the increased number of nuisance parameters from a finer grid. With interval-censored data, we must often make a pragmatic compromise that balances the bias induced from rounding event times and the problems that may arise from a large number of parameters. Extending our methods in a way that does not restrict the number of possible visit times and allows for more parameters to be stably estimated need further investigation.
One potential limitation of our analysis of the HCHS/SOL data was the assumption of constant sensitivity and specificity across visit times, as there was some apparent difference between these measures of accuracy at baseline compared to visit 2. We hypothesize that this difference in agreement may have been a result of a larger lag time since the previous gold standard test at baseline compared to follow-up visits, but could also result from missing data in the reference measure at visit 2 that may impact the sensitivity and specificity values. We conducted a sensitivity analysis to explore how using visit 2 rather than baseline values of sensitivity and specificity may impact the results of our HCHS/SOL data analysis. In this example, incorporating slightly different measures of accuracy of the self-reported auxiliary outcome data did not substantially impact our results. However, we note that this may not always be the case, especially for more extreme changes in sensitivity and specificity. For many real data settings, it may be unreasonable to assume that the sensitivity and specificity of error-prone outcomes are time-invariant. Our simulation study also showed that the performance of the proposed method can depend on correct specification of sensitivity and specificity, although the resulting bias depends on the degrees to which these are misspecified. Thus, future methods might explore time-varying or even subject-specific values of sensitivity and specificity to help ensure that the most accurate measures are incorporated into the analysis. A second potential limitation was our assumption that the gold standard outcome was missing completely at random. Using our proposed method for the complex survey design, we anticipate an extension could be readily developed to handle the missing at random case with the use of inverse probability weighting.
In our numerical study, we noticed that the sandwich-form estimator for the design-based variance had some coverage issues in smaller sample settings using both the proposed method and the standard no auxiliary data approach. While this estimator performed better with a normally distributed covariate, we noticed some numerical challenges when the covariate of interest had a long-tailed distribution (e.g. the gamma distribution). The numerical limitations of the sandwich-form variance estimator for complex survey data in non-linear models have been discussed previously. Finite-sample bias in this estimator may be encountered with smaller sample sizes and rare outcomes, particularly for a covariate with a heavy-tailed distribution, since in these settings, the variability of regression parameters is underestimated.26,34 Despite these limitations, the sandwich-form estimator may be reasonable, as coverage remained above 89%, got closer to 95% in large samples, and it is very practical to implement.
Supplemental Material
sj-pdf-1-smm-10.1177_09622802231181233 - Supplemental material for An augmented likelihood approach for the Cox proportional hazards model with interval-censored auxiliary and validated outcome data—with application to the Hispanic Community Health Study/Study of Latinos
Supplemental material, sj-pdf-1-smm-10.1177_09622802231181233 for An augmented likelihood approach for the Cox proportional hazards model with interval-censored auxiliary and validated outcome data—with application to the Hispanic Community Health Study/Study of Latinos by Lillian A Boe and Pamela A Shaw in Statistical Methods in Medical Research
Footnotes
Acknowledgements
Data Availability
The data used in this article was obtained through submission and approval of a manuscript proposal to the Hispanic Community Health Study/Study of Latinos Publications Committee, as described on the HCHS/SOL website.
35
For more details, see ![]() .
.
Declaration of conflicting interests
The author(s) declared no potential conflicts of interest with respect to the research, authorship and/or publication of this article.
Funding
The author(s) received no financial support for the research, authorship and/or publication of this article: This work was supported in part by NIH grant R01-AI131771.
Supplemental material
Supplemental material for this article is available online. The Supplemental Materials corresponding to this article are available online. R code for our simulations and a sample data analysis that applies the proposed method to a simulated data set with similar features to the HCHS/SOL is available on GitHub at ![]() . Additionally, Supplemental Section S1 provides R code illustrating how to apply (1) the proposed method and (2) the standard, no auxiliary data method to a simulated data set.
. Additionally, Supplemental Section S1 provides R code illustrating how to apply (1) the proposed method and (2) the standard, no auxiliary data method to a simulated data set.
References
Supplementary Material
Please find the following supplemental material available below.
For Open Access articles published under a Creative Commons License, all supplemental material carries the same license as the article it is associated with.
For non-Open Access articles published, all supplemental material carries a non-exclusive license, and permission requests for re-use of supplemental material or any part of supplemental material shall be sent directly to the copyright owner as specified in the copyright notice associated with the article.