
Abstract
Master protocol designs allow for simultaneous comparison of multiple treatments or disease subgroups. Master protocols can also be designed as seamless studies, in which two or more clinical phases are considered within the same trial. They can be divided into two categories: operationally seamless, in which the two phases are separated into two independent studies, and inferentially seamless, in which the interim analysis is considered an adaptation of the study. Bayesian designs are scarcely studied. Our aim is to propose and compare Bayesian operationally seamless Phase II/III designs using a binary endpoint for the first stage and a time-to-event endpoint for the second stage. At the end of Phase II, arm selection is based on posterior (futility) and predictive (selection) probabilities. The results of the first phase are then incorporated into prior distributions of a time-to-event model. Simulation studies showed that Bayesian operationally seamless designs can approach the inferentially seamless counterpart, allowing for an increasing simulated power with respect to the operationally frequentist design.
Introduction
Master protocols, such as basket, umbrella and platform trials, have revolutionized the way clinical studies are conducted, especially in oncology. 1 A recent systematic review by Park et al. 2 identified 83 master protocols (49 basket, 18 umbrella, and 16 platform trials), and the number of master protocols has been increasing rapidly over the last 5 years. These studies provide an efficient and flexible methodology for the assessment of multiple interventions in one or more diseases or conditions in a single protocol, possibly in a continuous manner. The benefits of master protocols include the use of a common control, the pooling of resources, and a reduction of the investment required to evaluate additional interventions beyond those initially studied. They also maintain a high quality standard for ongoing evaluations through the establishment of a trial network and may positively impact patient recruitment, as the trials are performed on sites that are continuously learning and improving their performance. However, such studies also present a number of challenges; the upfront investment is large, meaning that the number of platform trials that can be conducted may be relatively limited, and more insight into the prerequisites for the design to become efficient and sustainable is needed. Renfro and Sargent 3 have also highlighted the “sample size” limitation versus “effect size,” where a small sample size is used for each study arm in order to maintain the overall trial feasibility. This implies that the targeted effect size could be larger than the expected effect size leading to lower power and/or higher type I error than usual Phase II or III trials.
Another interesting design class is composed of the so-called seamless design. Traditionally, separate Phase II and Phase III trials are carried out with specific objectives during clinical drug development. For example, a late Phase II trial may be used to estimate parameters to be used in sample size calculation for a confirmatory Phase III trial. In contrast to traditional clinical trials, seamless clinical trials allow for the combination of multiple trial phases inside a single protocol.
4
If trial phases are done sequentially but separately, they are called “operationally seamless.” Conversely, in the adaptive seamless design, the final analysis uses data from patients enrolled in all phases, before and after adaptation, in an “inferentially seamless” approach.
5
Decisions on how to “adapt” the study are made after taking planned interim views of the data. Inferentially seamless designs come with statistical challenges since multiple comparisons arise from both (possible) repeated interim looks at gathered data and the selection process (selected data will also be included in the final analysis).
6
This approach usually requires that the familywise error rate be controlled in the strong sense since pairwise tests are performed between the arms at the selection stage. To address these challenges, many of the methods proposed in the literature are based on group sequential approaches,6,7 on combination test approaches8,9 or on the conditional error function method.10,11 Selection procedures based on utility functions,
12
on benefit
Bayesian inference naturally fits seamless (and master) designs, permitting the inclusion of Phase II data into prior distributions for the Phase III model parameters, sharing information between trial phases in operationally seamless designs, or enabling frequentist multiplicity corrections but working on prior distributions 15 and/or on thresholds on posterior values 16 in inferentially seamless designs. Moreover, in Bayesian thinking, operationally seamless designs can mathematically approach inferentially seamless ones. The information, whether added in prior distributions, as in the operationally seamless, or in the likelihood function, as in the inferentially seamless, can have the same mathematical role in the Bayes formula. If the power prior approach 17 is used it is straightforward to incorporate Phase II data into Phase III analysis: if the power prior parameter is set to one, all information is gathered, and if the same outcome is used in both phases, the posterior distribution of an inferentially seamless and of an operationally seamless coincide. However, while Bayesian inference has been widely used in seamless Phase I/II, only a few attempts have been made to include Bayesian inference in the seamless design of Phase II/III. 18 For example, Bayesian tools were proposed to perform treatment(s)19,14 or subpopulation(s) 20 selection. In Kimani et al., 21 Bayesian estimation of the dose–response curve was adopted at the end of Phase II; however, frequentist analysis was then used to test the Phase III hypotheses on treatment superiority.
Another important feature of seamless studies is the use of a generally shorter term endpoint for the first stage of the study. Usually, this midterm endpoint can be considered as a surrogate endpoint for the Phase III study. A few works have studied the use of different but correlated endpoints in the two phases, under a frequentist paradigm.22,23
In this work, we propose and evaluate simple Bayesian operationally seamless Phase II/III designs for survival analysis. As in the master protocol, the design allows for several treatments to be compared to a single control arm. As in seamless design, selection rules are specified, and only the selected arm proceeds to Phase III. Moreover, our work focuses on the situation where two different, but related, endpoints are used in the two phases, that is, when a dichotomized survival outcome, such as a survival rate at a fixed time point, is used to make decision at the end of the Phase II. In this setting, we have developed two ways of incorporating Phase II information into the Phase III analysis when endpoints differ but are related as in the case study used for this paper. Indeed, we proposed to tune prior distributions based on the Effective Sample Size 24 or on a likelihood approach. Since seamless designs plan several phases in the same protocol that are usually done in similar populations and environmental settings, we expect prior distributions on the latest phase to include the maximum possible information from previous stages. Adding information into prior distribution is usual in Bayesian framework, even if still not explored in previous work on seamless design. We explore the performance of several Bayesian methods, that is, with weakly informative prior distributions, as well as with informative ones, in terms of frequentist operating characteristics through extensive simulation studies. The aim is also to understand how close Bayesian operationally seamless designs performances, in term of frequentist operating characteristics, can get to Bayesian inferentially seamless ones. Therefore, an inferentially seamless Bayesian design, that uses data from both phases and with the true survival time of Phase II patients not dichotomized for the Phase III analysis, is introduced for comparison only. A frequentist operationally design is also introduced for comparison only.
In the next section, the motivating example is introduced. In Section 3, the methods of each phase, selection rules and final claim rule are described. Simulation design setups and results are summarized in Section 4. A practical example and discussion are then shown in Sections 5 and 6, respectively.
Motivating study
This work was motivated by the Atalante-1 clinical trial (NCT02654587). This study on non-small-cell lung cancer was designed as an operationally seamless Phase II/III trial comparing the efficacy of an experimental treatment (Tedopi) against the best standard of care (Docetaxel or Pemetrexed). A frequentist approach was used with a Fleming single-arm design
25
for the Phase II stage, considering only the treatment arm. For the first stage, a binary endpoint, the survival at 12 months, was chosen. With a type I error rate of
Methods
Based on the Atalante-1 case study, our proposed Bayesian designs use the same endpoints, that is, binary outcomes at the Phase II stage and survival outcomes at the Phase III stage. However, we propose extending the design to allow for multiple treatment arms at the first stage, as shown in Figure 1. For the sake of simplicity, we assumed a 1:1 randomization ratio in both stages. In the following, notation is introduced along with the proposed mathematical models and statistical rules at each stage.
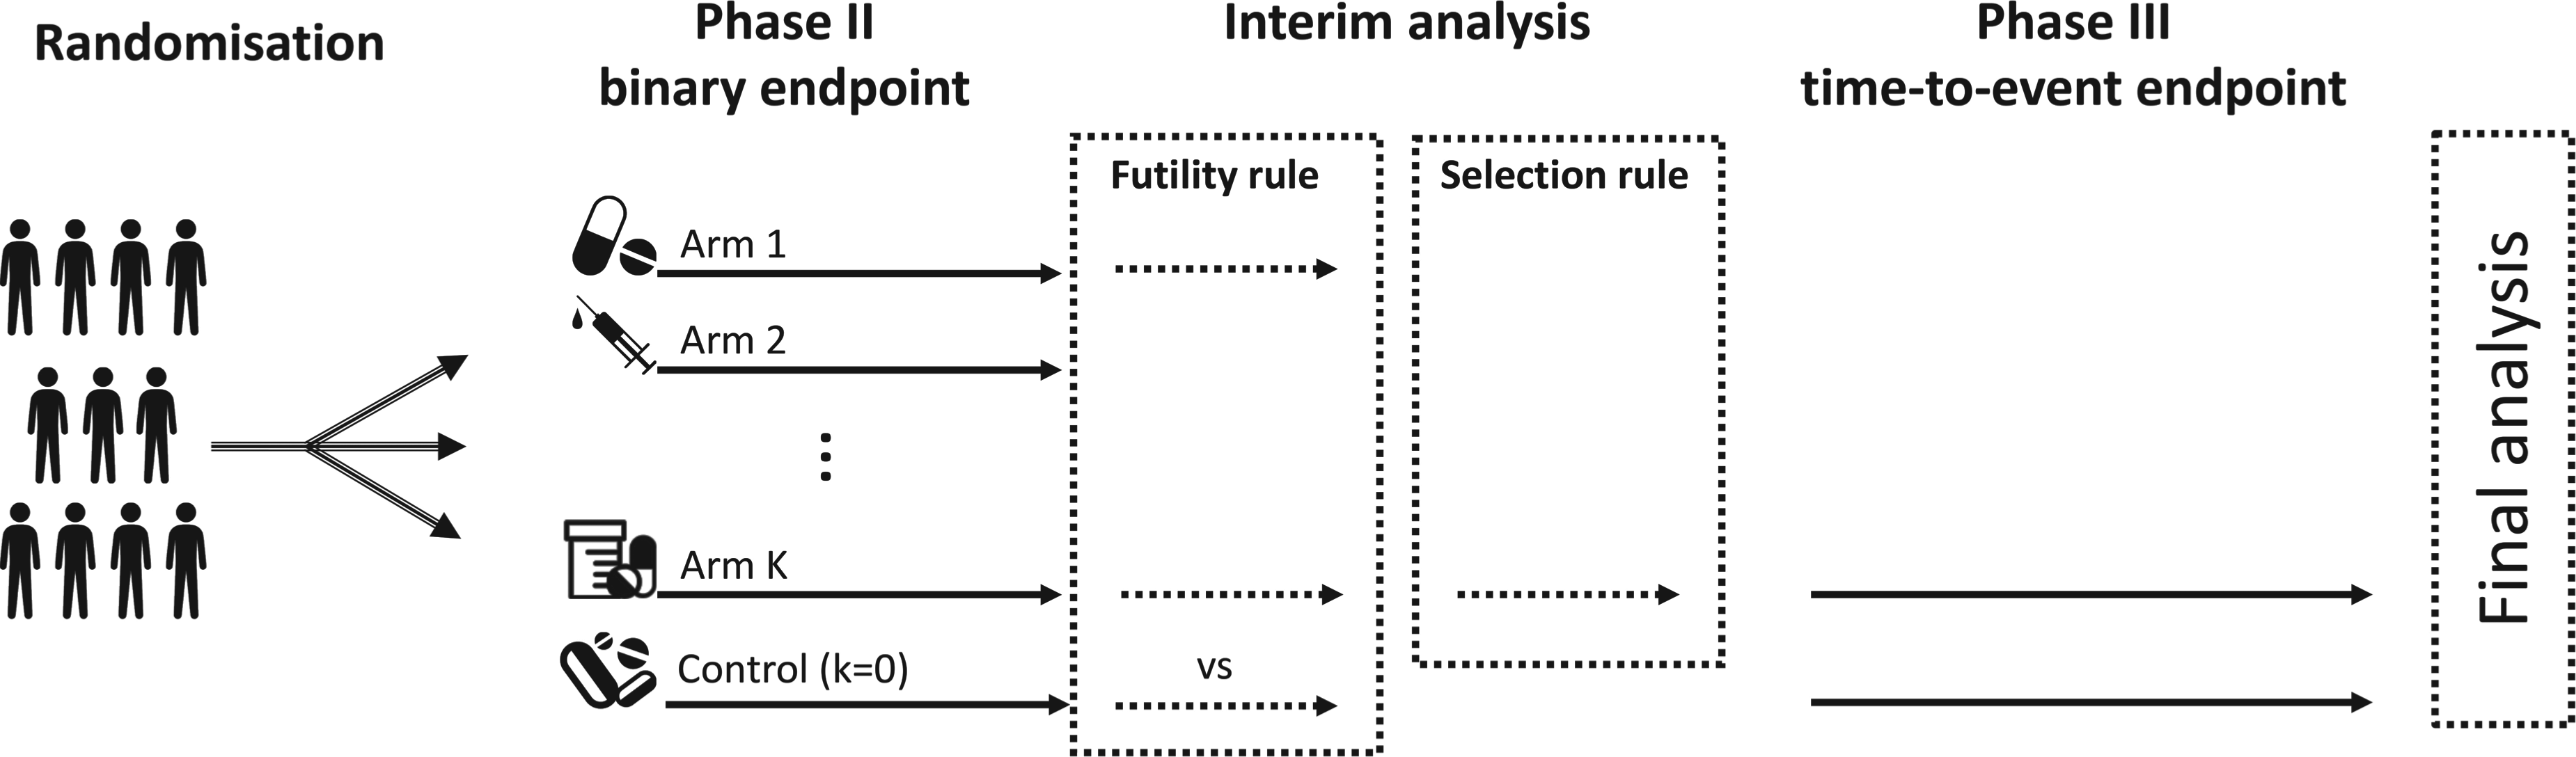
Scheme of the seamless design, with a Phase II involving binary outcomes, that is, mortality rate at a prespecified time, and a Phase III with a time-to-event endpoint.
Let
Similarly,
Stage 1—Phase II
A binary primary endpoint (the survival at
Phase II analysis is planned when
Let

Let
At the end of Phase II, we are interested in selecting the most promising arm among the treatment groups. We propose a two-step algorithm: (i) applying a futility rule and (ii) selecting the most promising arm among those retained in the previous step. In the first step, all arms that did not reach a threshold of
Stage 2—Phase III
After selection of the most promising arm, the study continues to Phase III with a survival endpoint. As an example, we use the Weibull distribution to model the survival time. Other parametric distributions could alternatively be used. For regression purposes, we adopted the shape

To complete the Bayesian model, prior distributions on
In the second approach, called the likelihood approach, the joint prior distribution on

The final claim is made considering the parameter associated with the treatment effect,

Simulation settings
We evaluated the operating characteristics of five designs via an extensive simulation study. A frequentist operationally seamless method (F-OP), that is, with two stages written in the same protocol, done sequentially but with only Phase III data used for the final claim (therefore, no type I error adjustment is planned), is considered the main reference method and is included for comparison. The F-OP method uses a similar decision process as the Bayesian ones. At the time of interim analysis, no test is planned, and treatments are selected based on observed survival rates using a threshold approach,
11
that is, the arm with the highest survival rate is selected to proceed to the phase III stage so long as the estimated difference to control is at least
The Bayesian operational counterpart, which uses a weakly informative prior at the second stage, with an ESS
Four main scenarios were selected and are presented in Figure 2 to evaluate the operating characteristics (simulated type I error and power), and 1000 trials per scenario were simulated. In the main simulation set, we simulated nine candidate therapies and the control group. Twenty patients per arm were simulated at the Phase II stage, that is, Survival probability function of all arms in each scenario. Only the control arm and the best arm (and the second-best arm for scenario 3) are highlighted. The corresponding survival probability at 12 months is indicated by horizontal lines.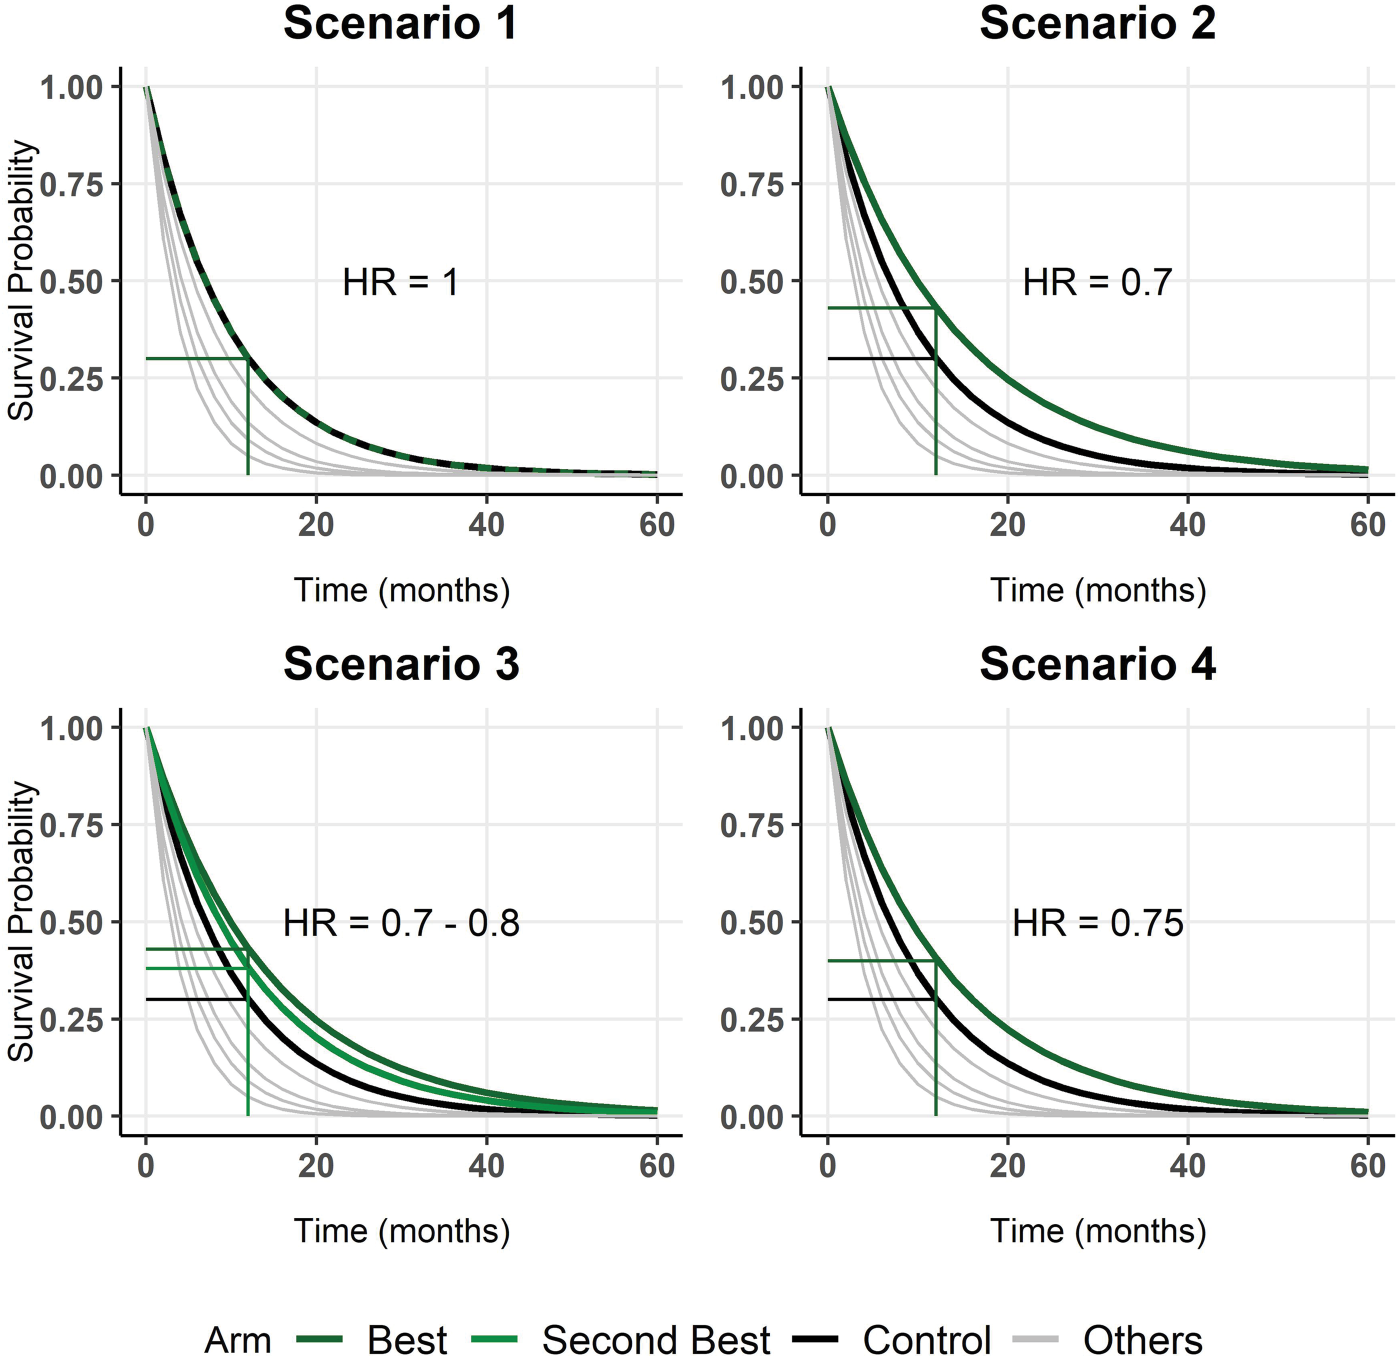
In the first scenario, no arm is better than the control arm; that is, for all treatment arms, the hazard ratio (HR) is higher than or equal to one (equality only for one arm). This scenario helped us to evaluate the simulated type I error. In scenario 2, only one arm is truly superior to the control group, with a HR of
Simulations are carried out using R software, and the Bayesian model is written using the Stan programming language.
33
chains are then computed using the
Figure 3 shows the results of the five designs in scenario 1. When a futility threshold Results in terms of simulated type one error. On the left-hand side, the percentage of trials that were stopped at the futility analysis at the end of Phase II in scenario 1 is shown. On the right-hand side, the percentage of trials where the treatment arm was erroneously claimed to be superior is shown. Straight lines refer to no futility rule applied, that is, 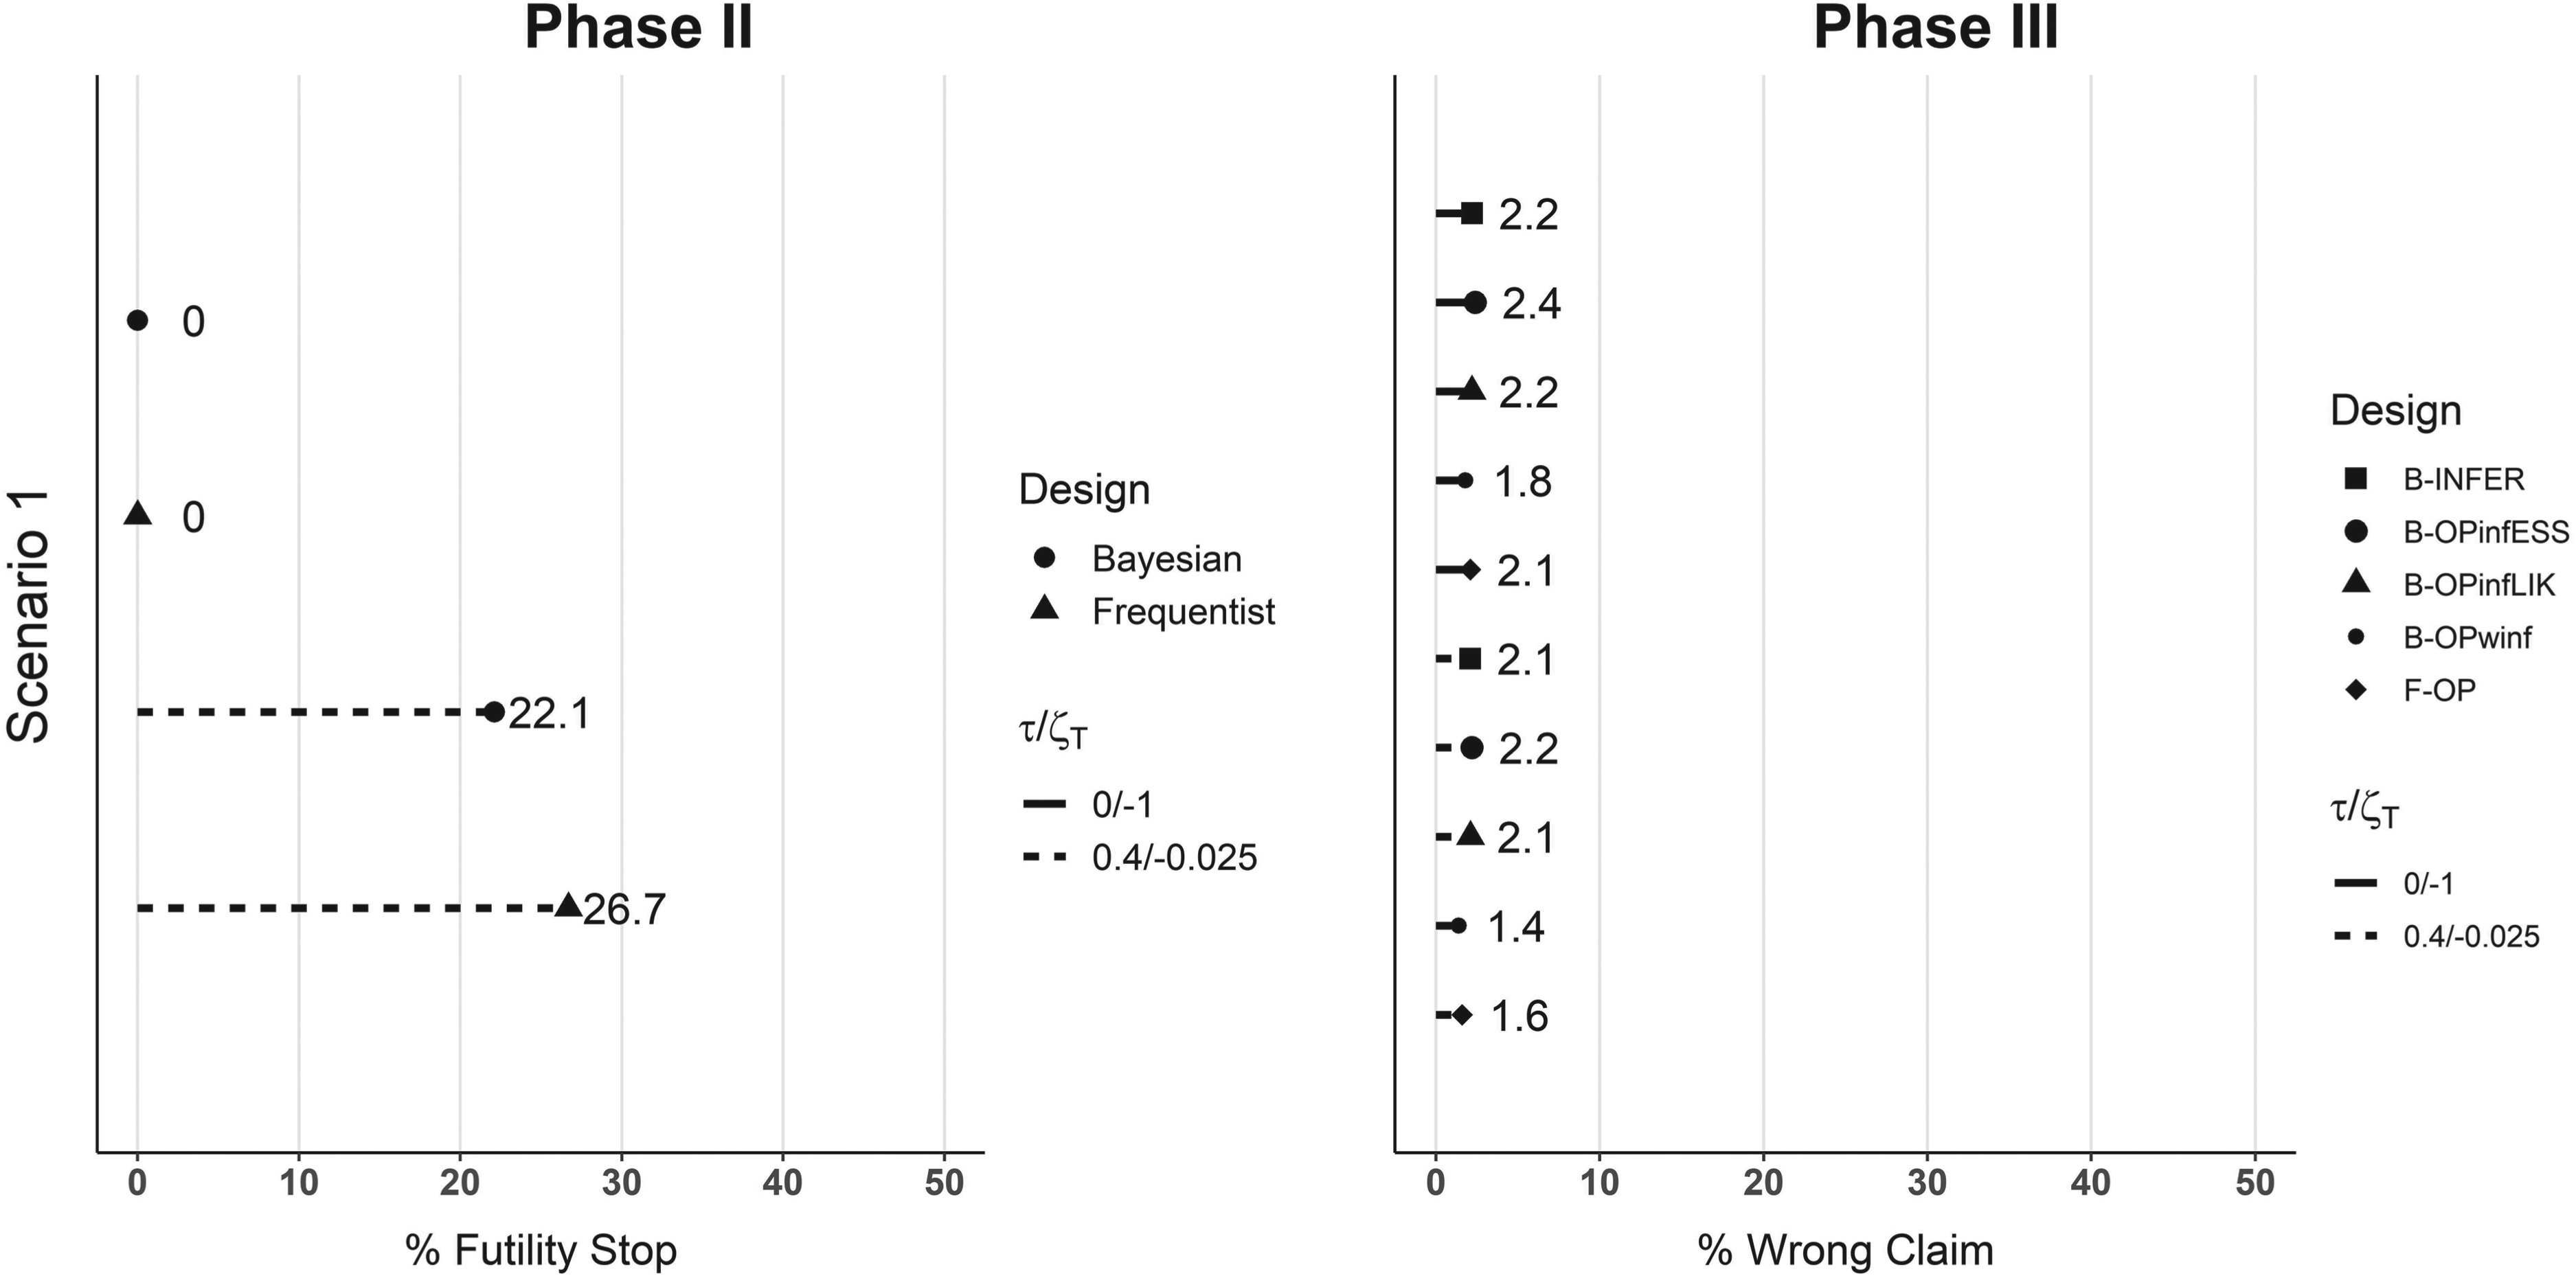
Regarding the simulated power, Figure 4 shows the results in scenarios 2, 3, and 4. In the first column, the percentage of simulations in which the correct arm is selected is given for the Bayesian and frequentist methods for the same two futility thresholds as in scenario 1. Generally, futility stopping reduces the percentage of correct claim with this reduction being of 5 points on average. This is linked to the percentage of early stopped trials. In scenario 2, of 1000 studies with a futility threshold Results in terms of simulated power. Each plot line represents one scenario. In the first column, the percentages of correct arm selection at the end of Phase II are shown for the Bayesian methods and the frequentist one. In the second column, the percentages of final Phase III correct claims associated with each design are given. Straight lines refer to no futility rule applied, that is, 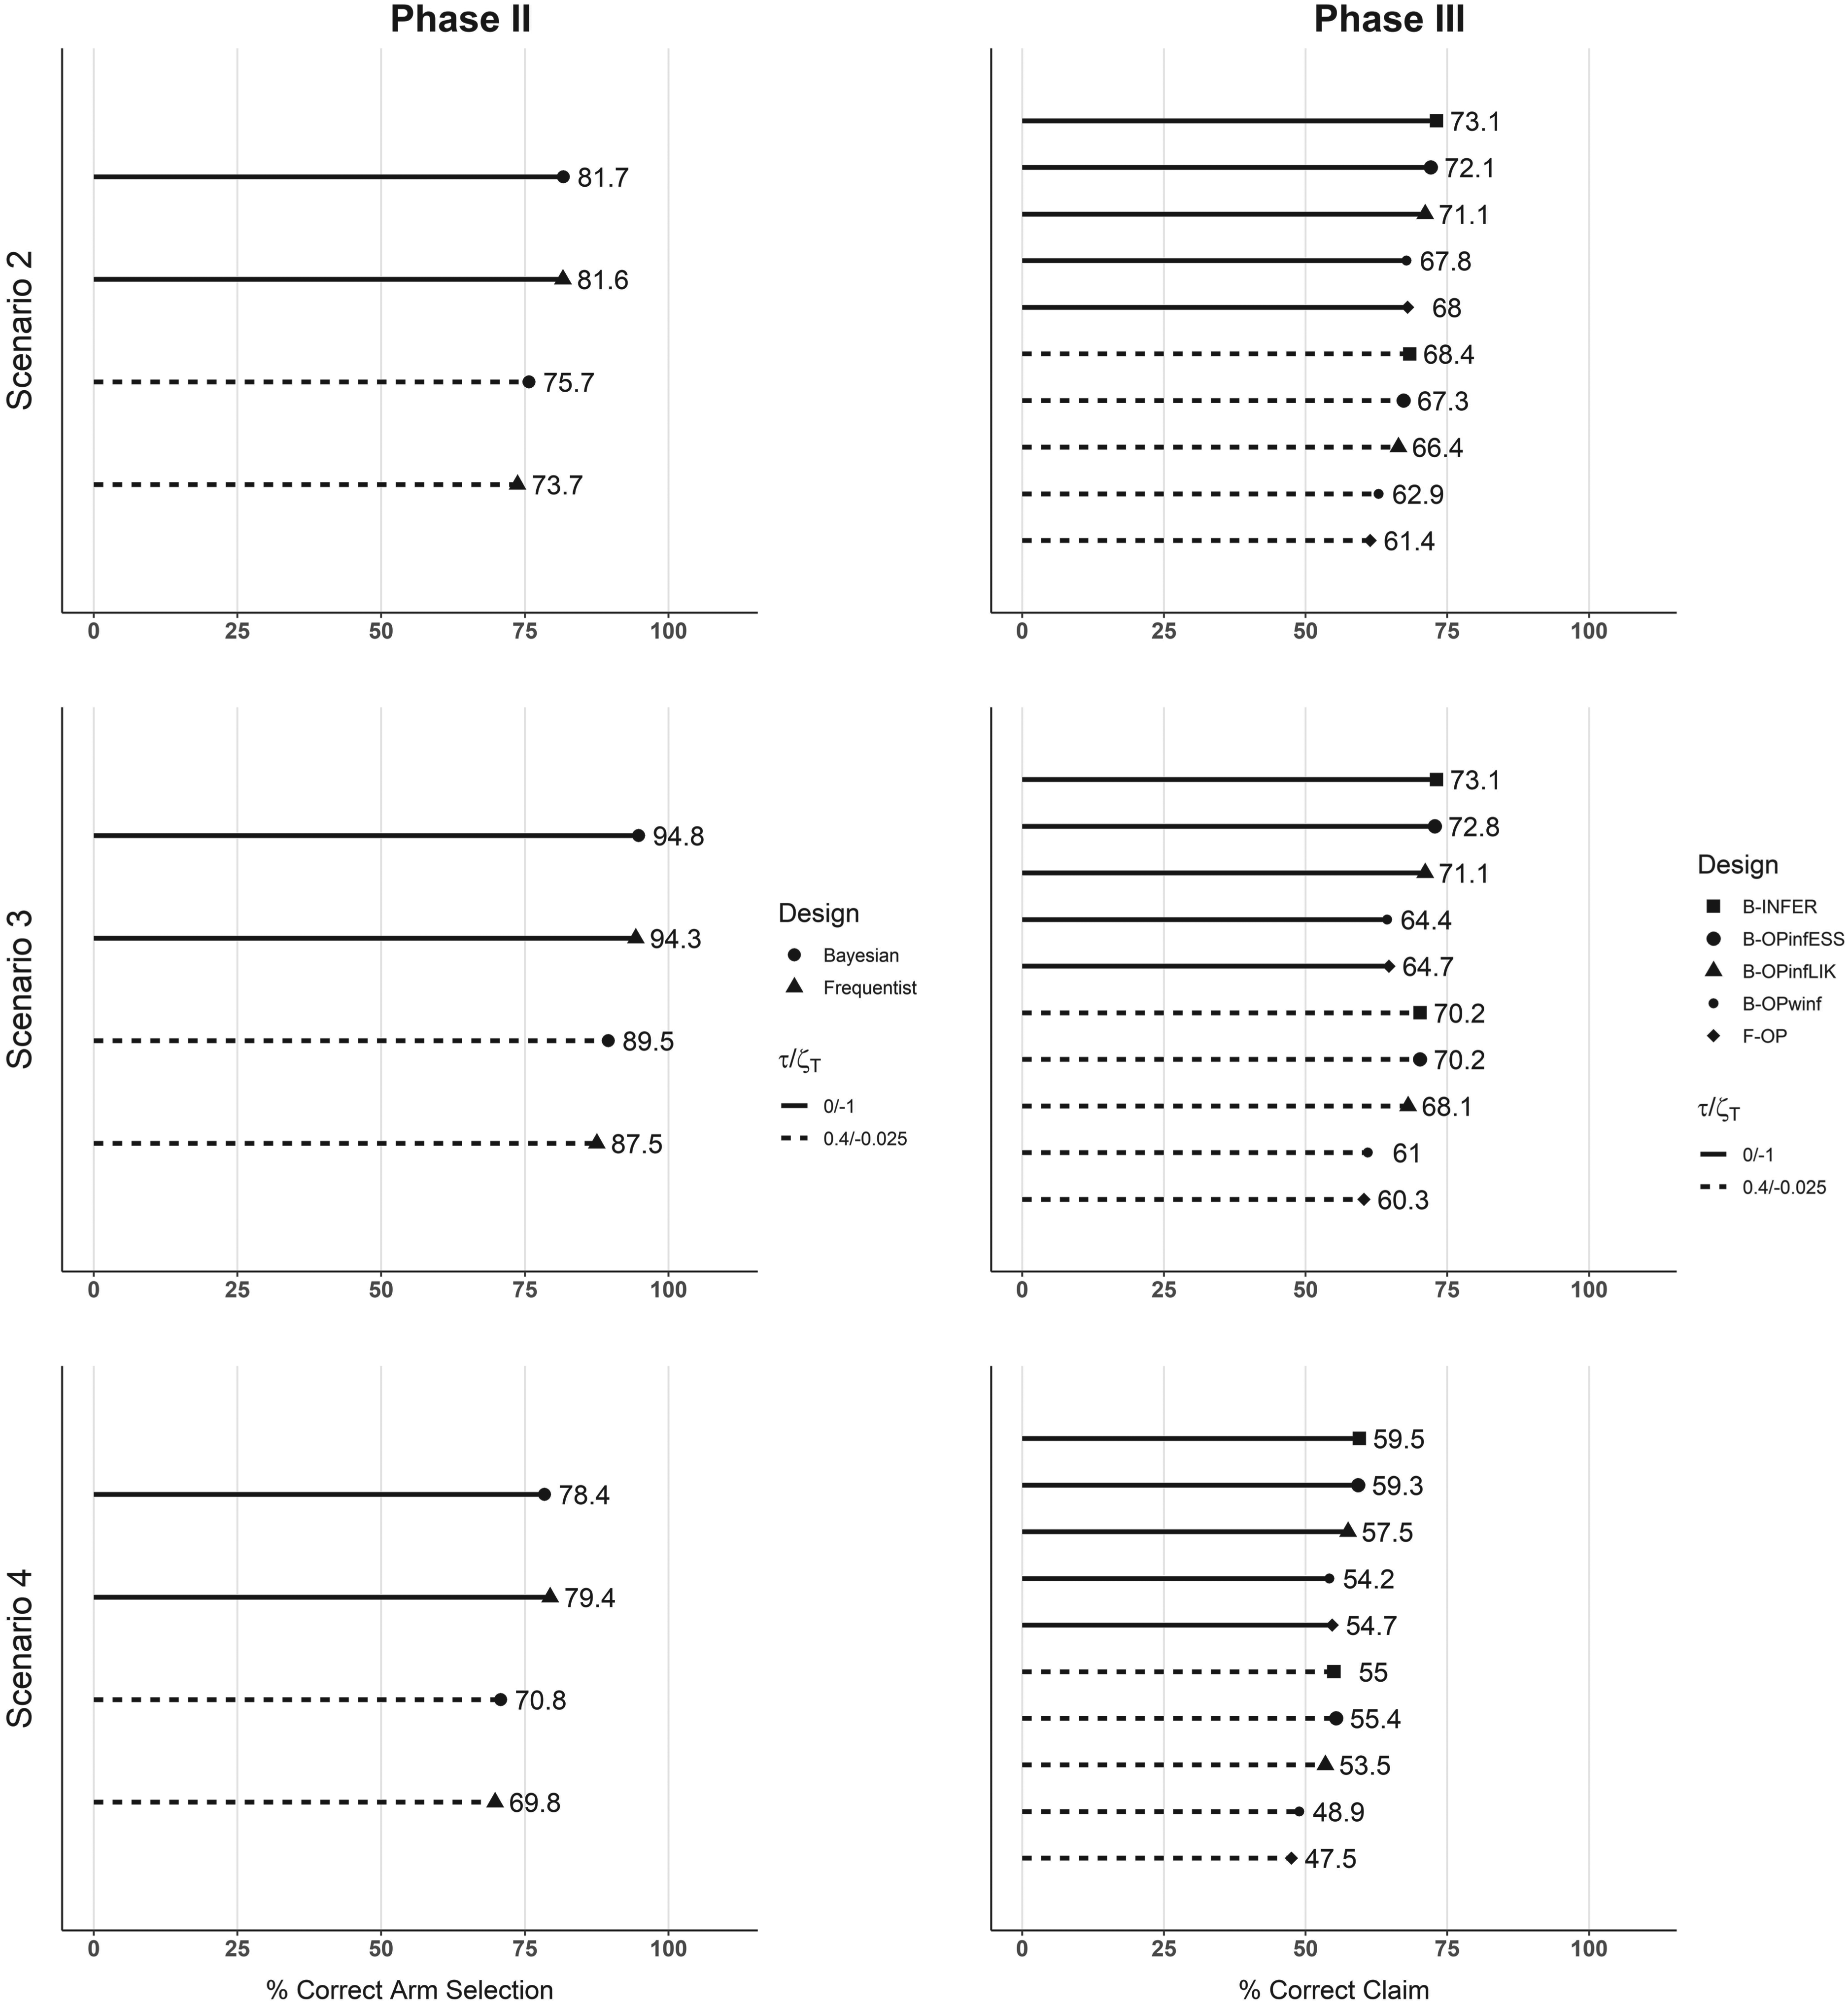
We then investigated the situation when the total sample size, that is, that of Phase II plus that of Phase III for the selected arms, was equal to 150. Figure 5 shows the results at the Phase III stage: the results at the first steps are identical to Figures 3 and 4 since the same sample size and setting are adopted. For all methods and scenarios, we observe a reduction of positive claims between Results in terms of simulated power and type I error for a total sample size of 150 patients with 20 used for Phase II. Each plot represents a scenario, and the percentages of final Phase III correct and incorrect claims associated with each design are shown. Straight lines refer to no futility rule applied, that is, 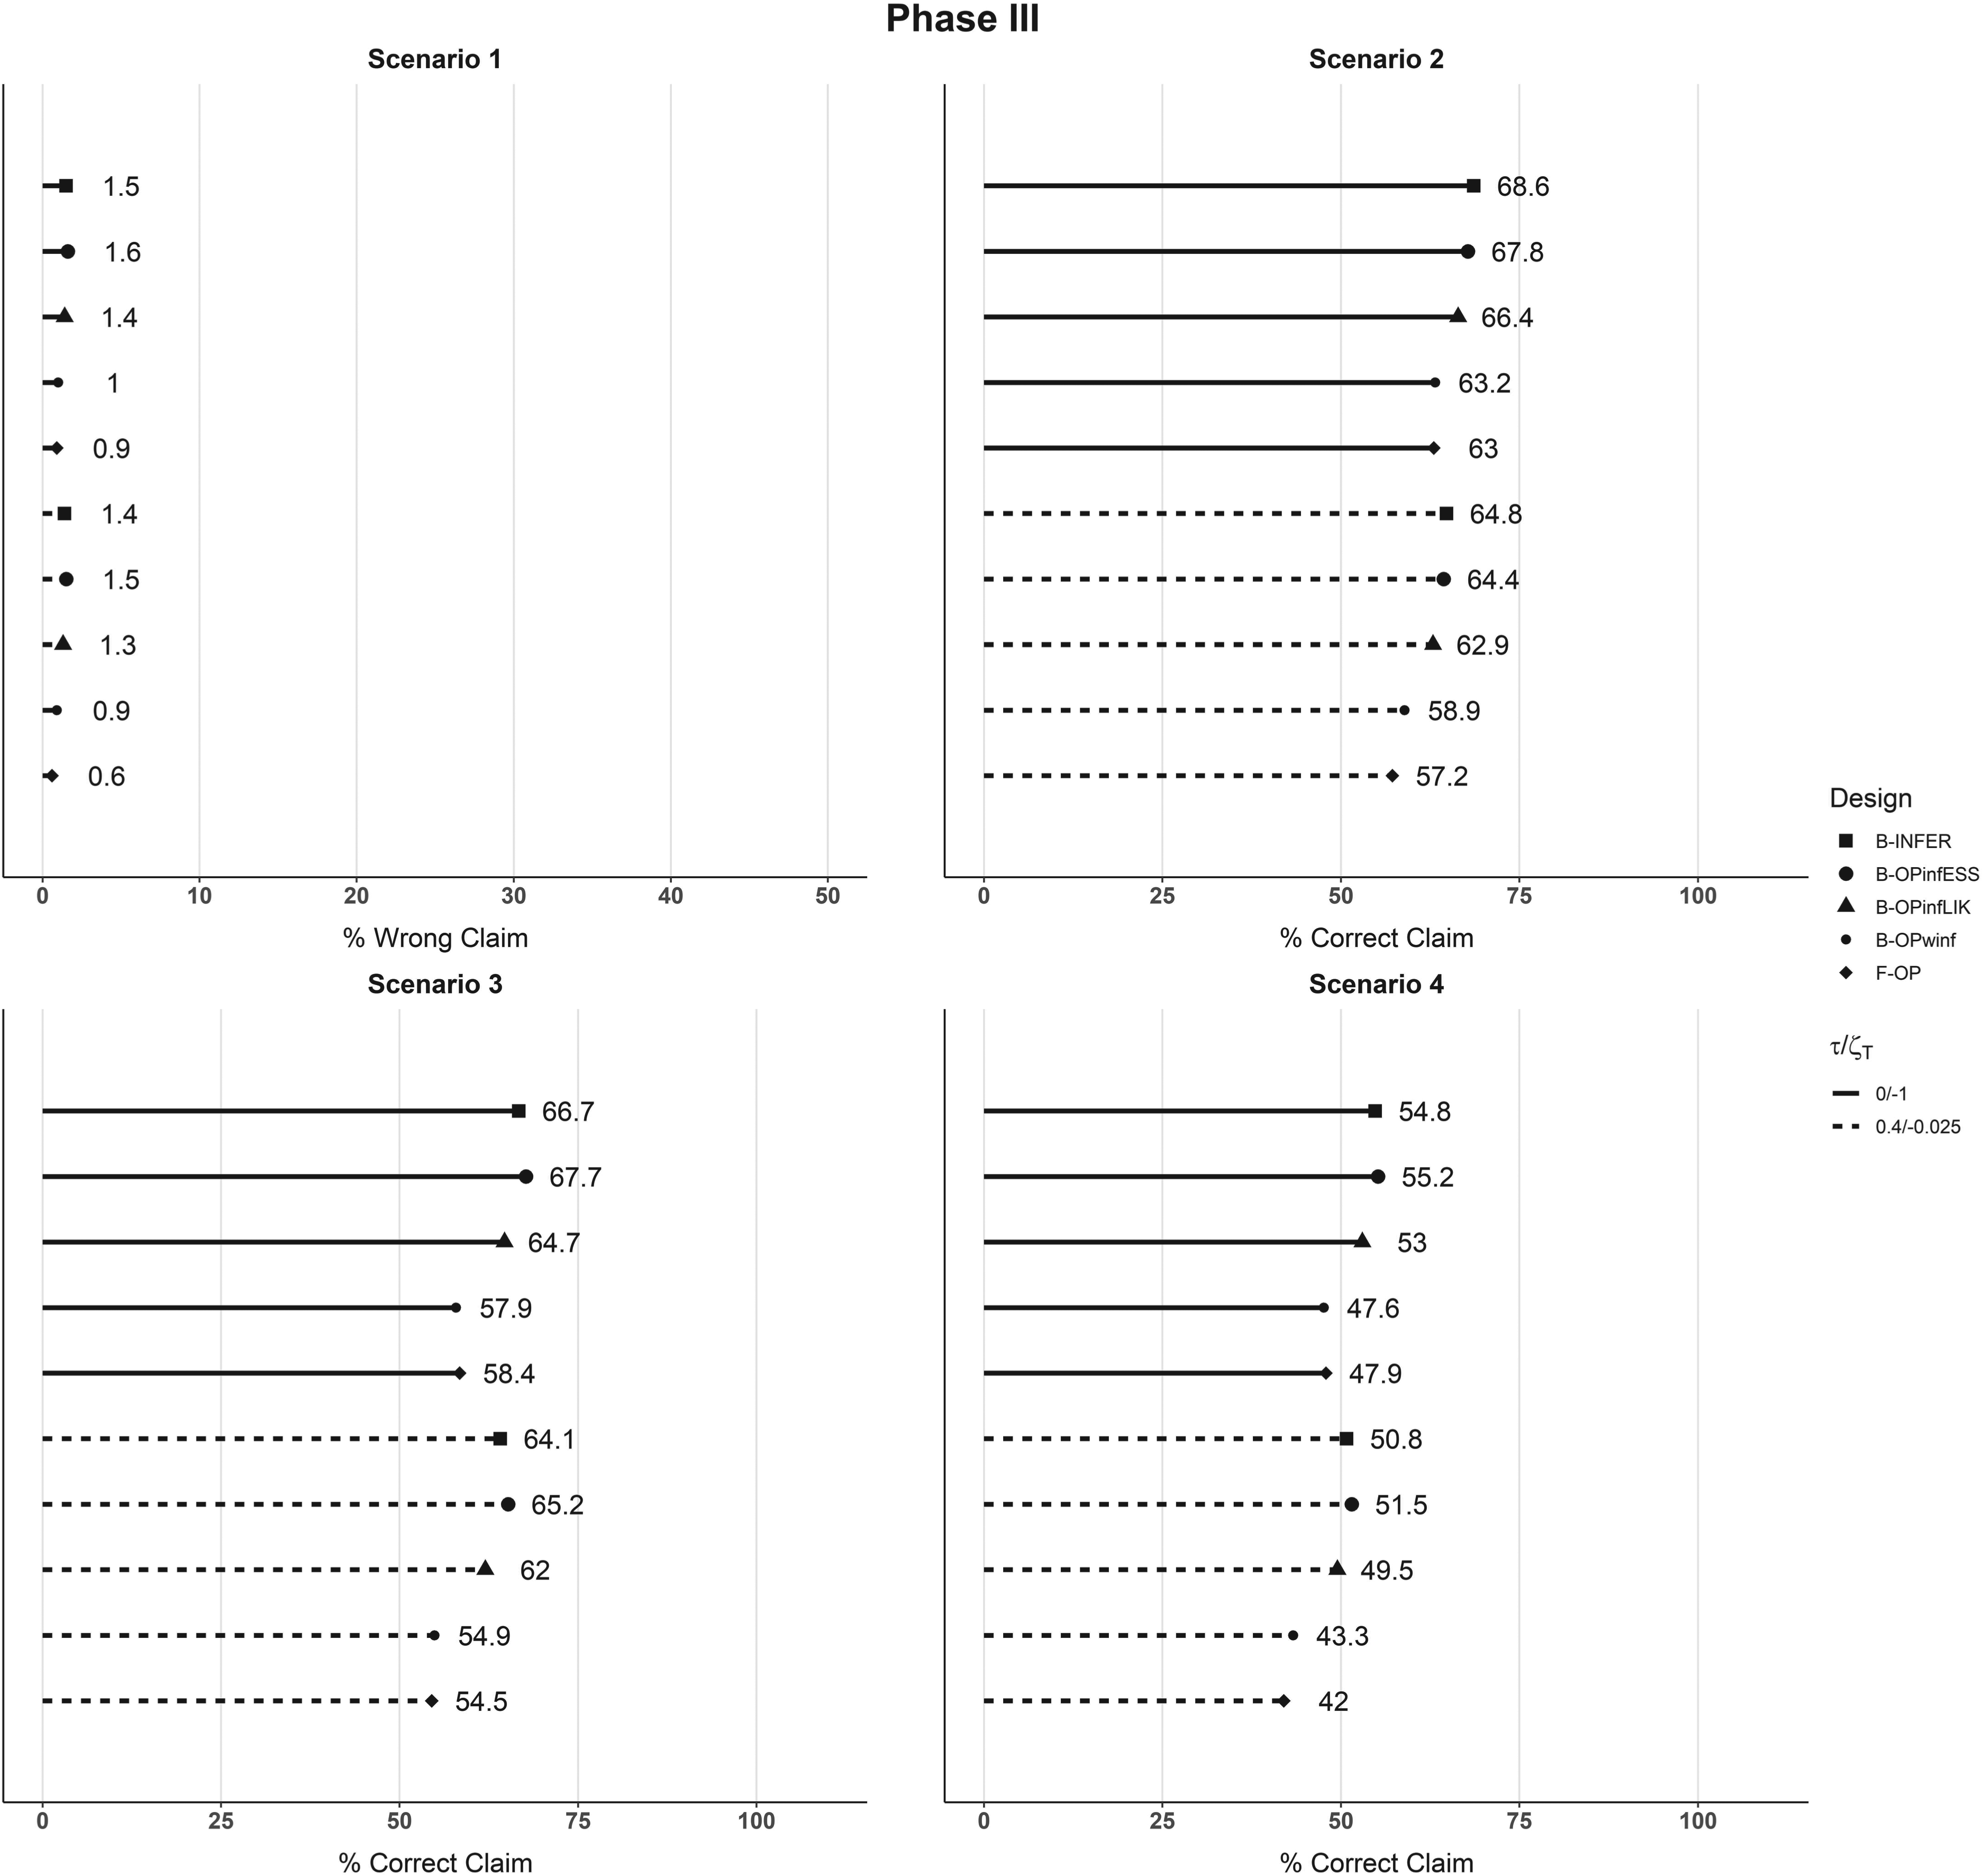
In the Supplemental Material, we have also evaluated and reported the methods—performance when the sample size at Phase II is increased up to 40 patients, when a higher censoring rate (20%) is considered, or with other futility thresholds.
Interim analysis results.
refers to the frequentist estimation of survival rate,
to the difference of frequentist point estimations
,
to the Bayesian posterior mean of survival rate,
to the Bayesian mean posterior difference of survival rates with respect to the control arm,
to the posterior probability that
is higher than 0. CI and CrI denote the confidence interval and the credible interval, respectively.
Interim analysis results.
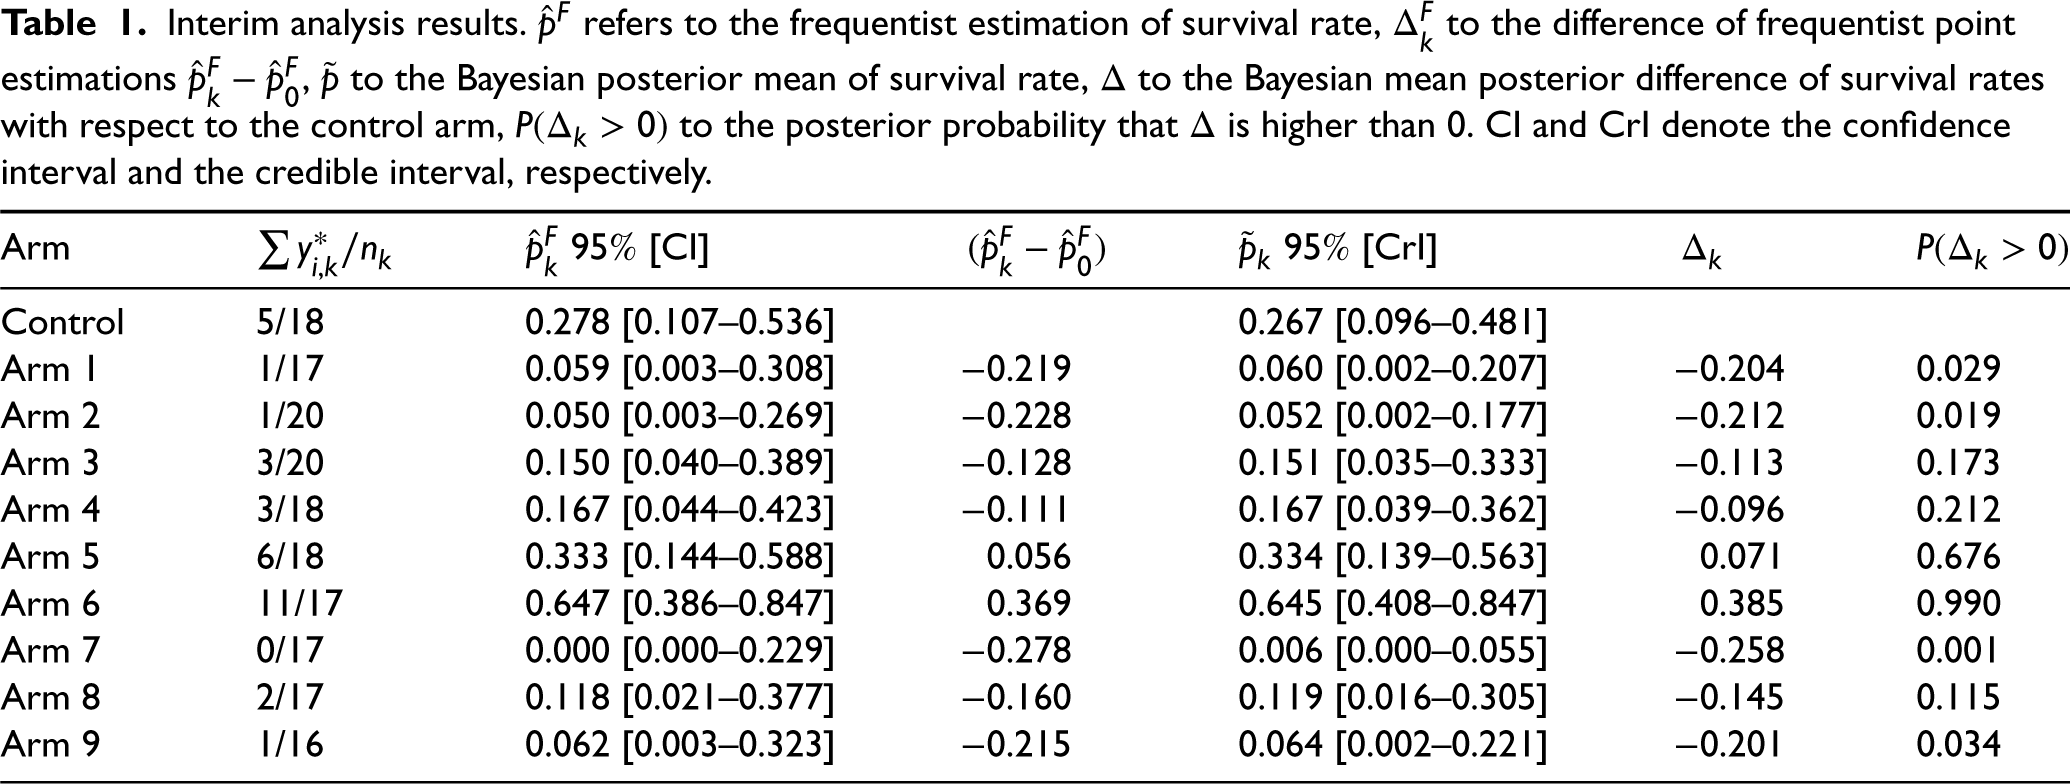
According to the frequentist design, if a futility step is added at the end of Phase II, only Arm 5 and Arm 6 would be considered for the selection (all arms with (
For Phase III, 150 patients were randomly allocated to the control arm and to Arm 6, called the treatment arm. The survival times of the patients are shown in a Kaplan–Meier plot, Figure 6.
Kaplan–Meier survival curves of the control and treatment arms for the illustrative example.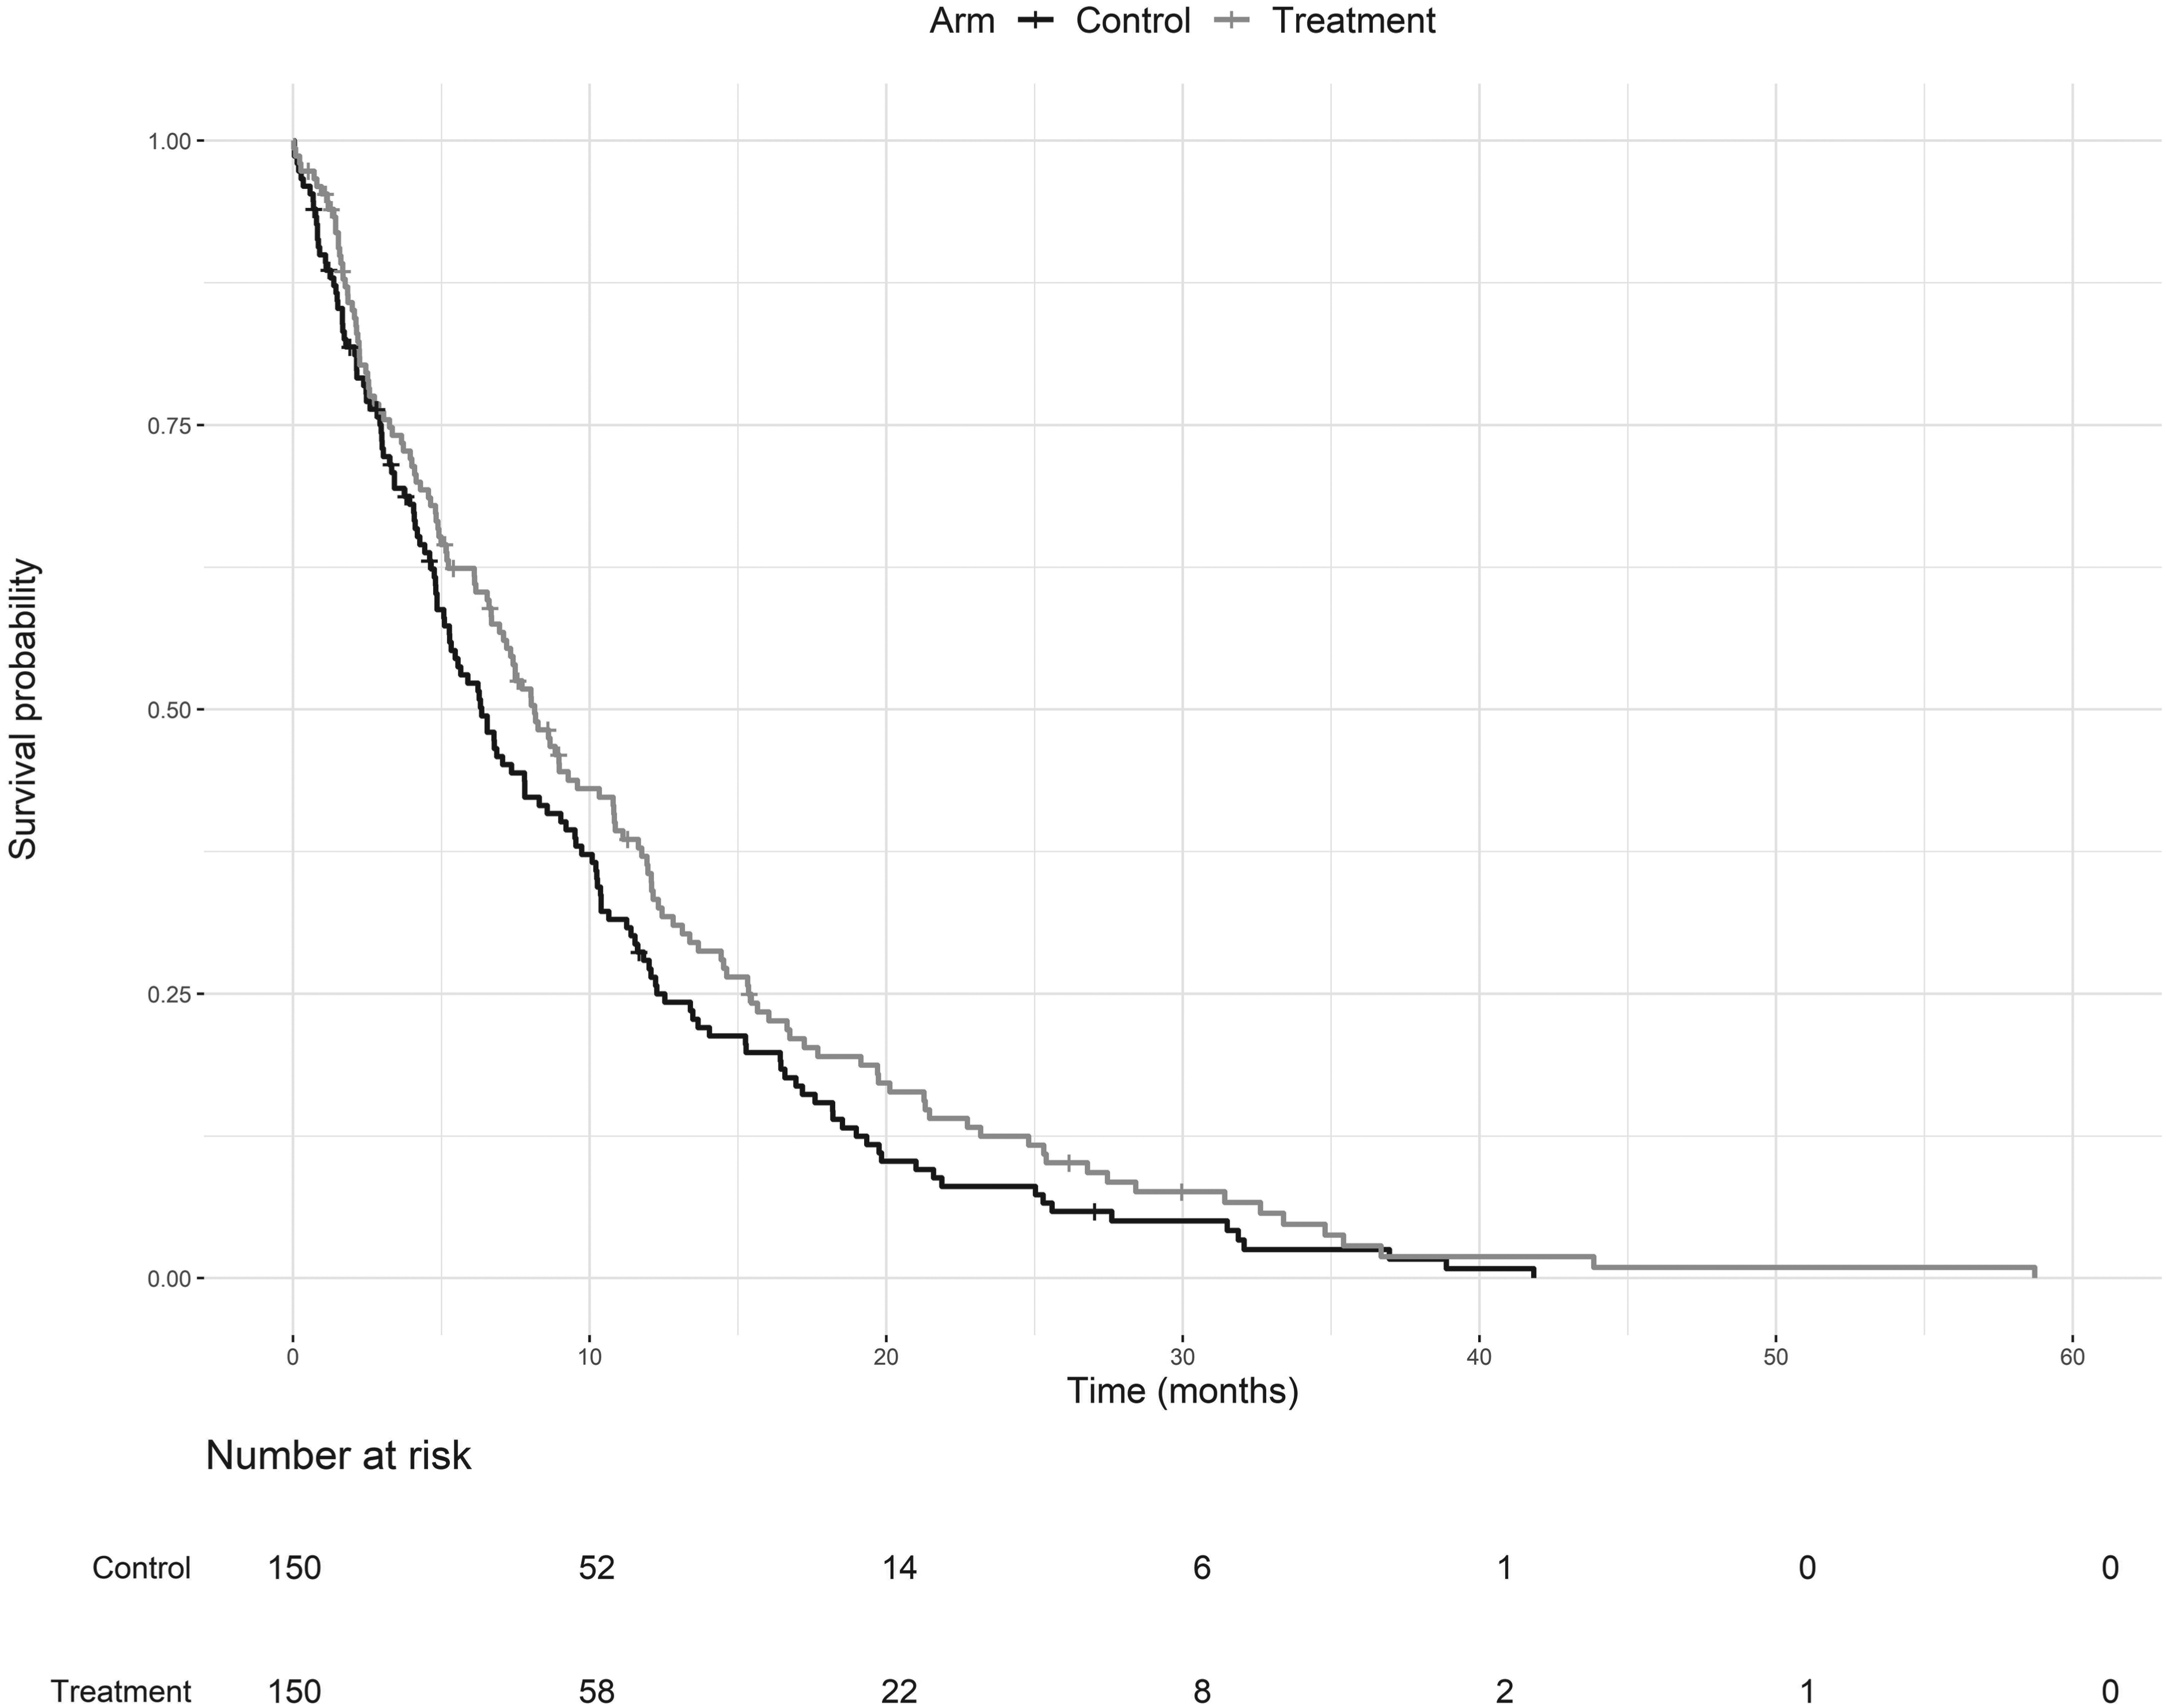
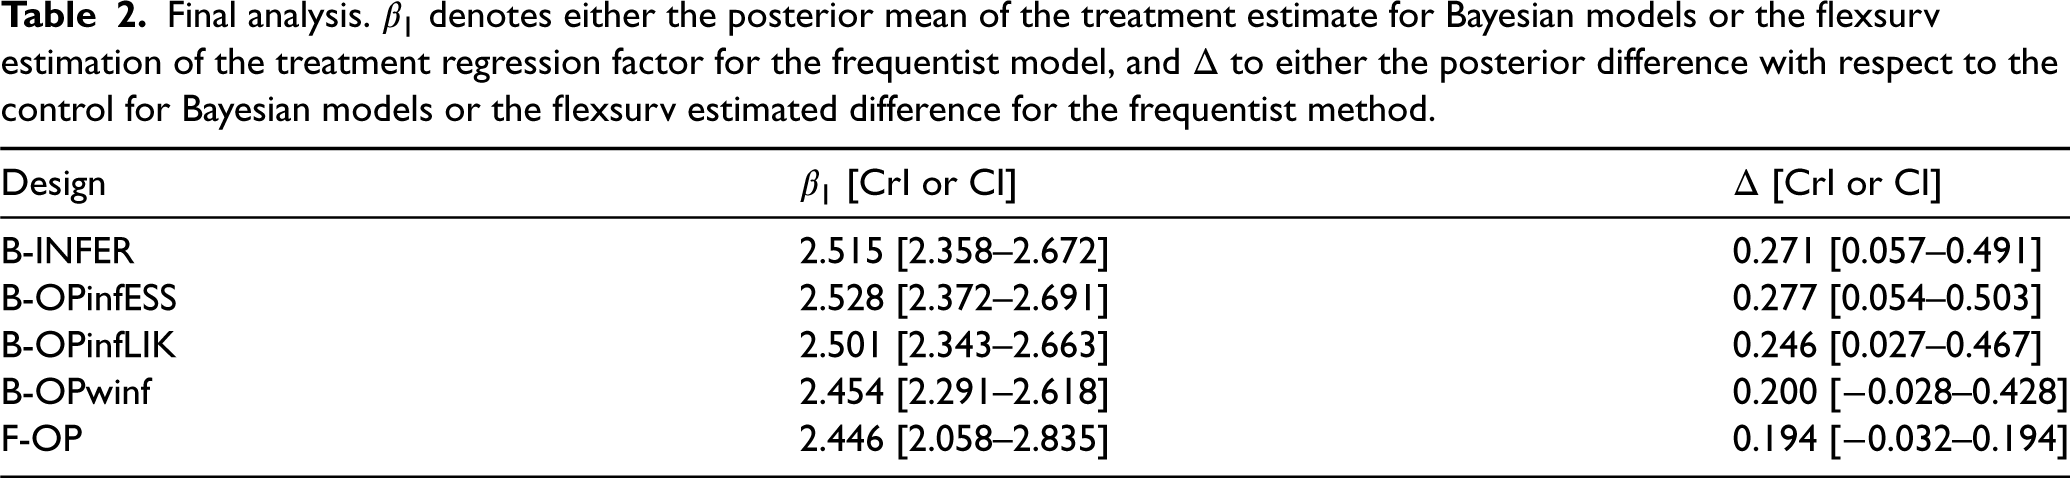
Figure 7 shows the informative and weakly informative (winf) distributions derived using the ESS approach (infESS) and the likelihood approach (infLIK) for the selected treatment arm. Table 2 summarizes the results for all designs: in the second column, either the posterior mean of the treatment estimate Marginal prior distributions obtained using Phase II data for the treatment arm in the illustrative example. The infESS was computed using Final analysis. 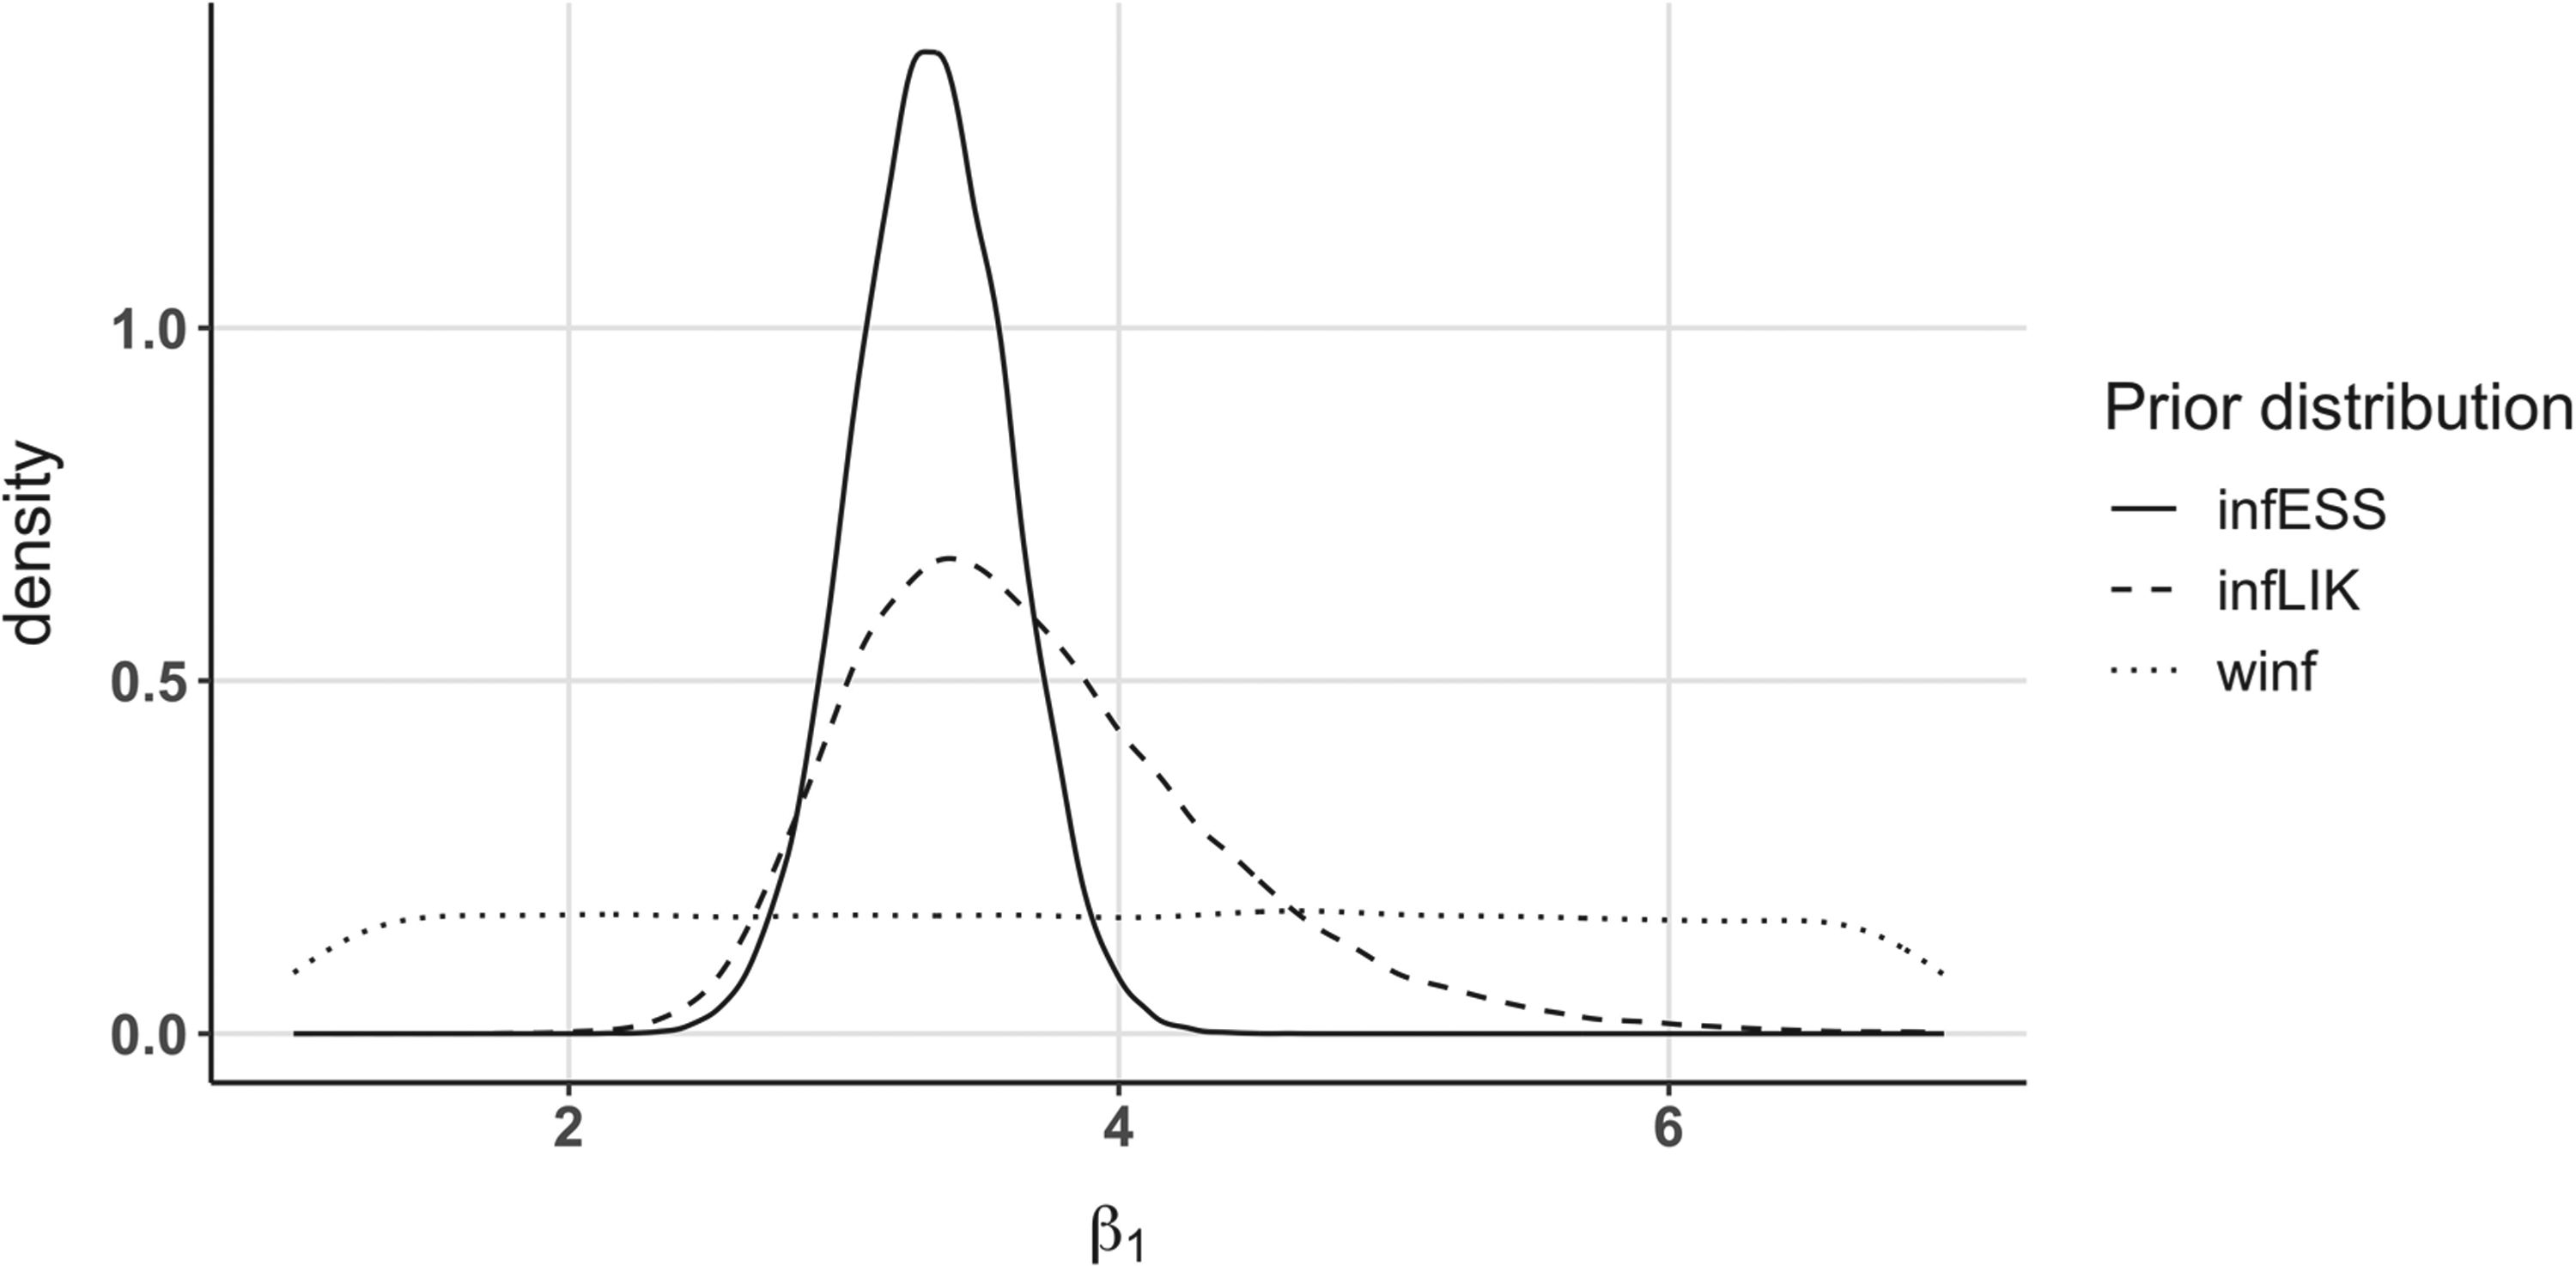
In this work, we explored the use of the Bayesian framework in seamless designs and how information could be transferred in the case of different but related endpoints, taking an example from the Atalante-1 case study.
As inferential seamless clinical trial is not always feasible in practice, we proposed two ways to set informative prior distributions (that can also be derived from external data in non seamless trials). In the first one, the ESS approach, we evaluated how much the unit information should be in a Weibull survival regression. In our case, a linear relationship was found, even if, in principle, the ESS could vary according to the survival rate in other models. In the second approach, the likelihood approach, we added the information at the binomial scale and not directly at the survival scale. As shown in Figure 7, using the informative ESS approach for the prior usually leads to less dispersed, and therefore more informative, prior distributions. Moreover, since possible loss to follow-up is only estimated using Phase III data, it can produce stronger information than the information brought by real Phase II patients, as in the 150 patients simulation setting. This is because a censored patient comes with less information than a patient who had the event in the survival likelihood. While it can be useful to increase the power, it could come with a possible type one error inflation with respect to the inferentially seamless designs. To be more conservative, a possible action consists in decreasing the number of patients
The likelihood approach can be seen as an intermediate method between the ESS informative and the ESS weakly informative approaches, which was expected since the information brought by a binary variable is known to be lower than that of a continuous variable. Notably, while the binary-Weibull likelihood could be seen as a nonwell-posed problem, it produces a proper prior when coupled with noninformative proper distributions, as done in our application. This prior can be seen as a power prior
17
where the power parameter is set to 1 and the likelihood of historical trial, here the Phase II data, and the actual trial, the Phase III, differs. When full data are available for Phase II, that is, the actual survival times are known rather than just whether they are less than or greater than
Obviously, using a similar survival endpoint, even if not completely identical if the follow-ups differ, for the two steps of the analysis benefits the prior construction, making it easier to create informative prior distributions. In this case, the posterior distributions of Phase II can be directly used as priors for Phase III parameters. For the frequentist F-OP design to control the type I error the phase III part needs to include no patients with data used in the phase II part even as censored observations. The advantage of the methods we proposed is that they can also be used when Phase II is external to the trial (and therefore not a seamless master protocol), and data can be found in the literature. In this case, if the trial conditions are not exactly the same between studies, we suggest decreasing the ESS of the prior distributions or checking for prior-data conflict.34,31
Increasing the sample size of the Phase II stage will increase, as expected, the probability of selecting the correct arm and, therefore, the power of the whole seamless study, as we can see in the Supplemental Material. If one wants to include the censored patients of the first stage in the survival rate computation, multiple imputations methods could be considered. However, we did not consider them relevant at this early stage of the trial. Another option, would be to consider patients censored before
Since Bayesian selection uses predictive probabilities via the MCMC approach, heavy tails impacting the posterior expected value could occur, leading to a different arm selection with respect to a simpler frequentist threshold approach.
A Phase II model was constructed to allow for possible modifications and extensions. We focused on a simple setting; however, several arms can be linked to each other if the same treatment but different doses or regimens are evaluated. In this case, if an efficacy-dose relation shape is expected, it can be added to the Phase II model. Moreover, if the arms do not represent different treatments but different populations or disease types, a correlation structure can be added as an additional model level.
In conclusion, the Bayesian framework provides a powerful tool to transfer information between trial phases, and it is particularly adapted to a seamless design. In our setting, where Phase II only aims at selecting the best treatment arm or stopping the trial, we showed how using Phase II data can increase the simulated power of the seamless design relative to an operationally seamless approach that uses only the phase III data in the final analysis, while still having acceptable simulated type I error, provided a binding futility threshold is used. In future work, the sample size needed to achieve a prespecified power while controlling the type I error should be evaluated in this Bayesian setting.
Supplemental Material
sj-pdf-1-smm-10.1177_09622802231160554 - Supplemental material for Using dichotomized survival data to construct a prior distribution for a Bayesian seamless Phase II/III clinical trial
Supplemental material, sj-pdf-1-smm-10.1177_09622802231160554 for Using dichotomized survival data to construct a prior distribution for a Bayesian seamless Phase II/III clinical trial by Benjamin Duputel, Nigel Stallard, François Montestruc, Sarah Zohar and Moreno Ursino in Statistical Methods in Medical Research
Footnotes
Acknowledgements
The work of the Benjamin Duputel was partially funded by a grant from the Association Nationale de la Recherche et de la Technologie, with eXYSTAT, Convention industrielle de formation par la recherche number 2019/1364. The authors would like to thank the anonymous reviewers, for their insightful comments and suggestions, Silvia Calderazzo, for the constructive exchange on the ESS topic, and Berangere Vasseur and OSE laboratories for the use and brainstorming on Atalante-1.
Declaration of conflicting interests
The author(s) declared no potential conflicts of interest with respect to the research, authorship, and/or publication of this article.
Funding
The author(s) received no financial support for the research, authorship and/or publication of this article.
Supplemental material
Supplemental material for this article is available online. All the codes will be available at the first author’s GitHub repository.
Appendix
References
Supplementary Material
Please find the following supplemental material available below.
For Open Access articles published under a Creative Commons License, all supplemental material carries the same license as the article it is associated with.
For non-Open Access articles published, all supplemental material carries a non-exclusive license, and permission requests for re-use of supplemental material or any part of supplemental material shall be sent directly to the copyright owner as specified in the copyright notice associated with the article.