
Abstract
Combination therapies are becoming increasingly used in a range of therapeutic areas such as oncology and infectious diseases, providing potential benefits such as minimising drug resistance and toxicity. Sets of combination studies may be related, for example, if they have at least one treatment in common and are used in the same indication. In this setting, value can be gained by sharing information between related combination studies. We present a framework that allows the study success probabilities of a set of related combination therapies to be updated based on the outcome of a single combination study. This allows us to incorporate both direct and indirect data on a combination therapy in the decision-making process for future studies. We also provide a robustification that accounts for the fact that the prior assumptions on the correlation structure of the set of combination therapies may be incorrect. We show how this framework can be used in practice and highlight the use of the study success probabilities in the planning of clinical studies.
Introduction
Combination therapies combine new molecular entities and existing drugs with an aim to produce a synergistic effect whilst also reducing side effects. A synergistic effect is considered to be a positive interaction between the individual components in the combination. Alongside reducing side effects, combination therapies are often able to minimise drug resistance whilst still achieving efficacy. 1 This is often realised by combining treatments that are similar in terms of the size of their therapeutic effect, but different in terms of their mode of action or toxicity.
There has been a recent rise in the popularity of combination therapies, especially in areas such as oncology. In 2017, there were over 10,000 clinical trials ongoing that contained combinations. 2 This rise in popularity has also brought with it several new questions and challenges. The question that we will aim to answer in this paper is associated with the potential relationships between the outcomes of combination studies. We may expect the outcome of two combination studies to be related when, for example, they have a particular treatment in common. We look at how we can use the information from related combination studies to inform the probability of success (PoS) of a particular combination study of interest. Typically, a combination therapy will consist of a well-established backbone therapy, such as chemotherapy in oncology, and one or more different add-on treatments. Hence, in this scenario, there would be clear groups of associated combinations, which correspond to the combination therapies that share a backbone treatment.
Therefore, there is much to be gained by considering related combinations. This gain is even more significant when there is little available information on the combination of interest, but a much greater quantity of available information on a related combination, such as the outcome of a Phase III study. This is because of the potential for correlations between the outcomes of related combination studies. Using the additional information from related combinations appropriately may improve the accuracy of the treatment effect estimates, which in turn may lead to improved decision-making in the planning of combination studies through the calculation of the study success probabilities. Improved decision-making may help to reduce the failure rates in the later clinical trial phases or optimise the portfolio.
One of the key estimates that may be used to assist decision-making regarding a potential study is the PoS. Existing methods for calculating the PoS are often based upon the expected power, (Bayesian) predictive power, or assurance. These terms are often used interchangeably in the literature and the assurance will be discussed further and defined in Section 2.1. O’Hagan et al. 3 presented the concept of the assurance and detailed how it may be used and interpreted. O’Hagan et al. 4 then provided further discussion of the assurance and how this can be used instead of the power in calculating the required sample size of a study.
The literature on the PoS also covers how this may be used to assist decision-making. Stallard et al. 5 present an approach that combines Bayesian and frequentist ideas. The decision-making process uses Bayesian methodology in the calculation of the PoS whereas it is assumed that the study design and analysis in Phase III will be frequentist. This approach may be used both at the end of Phase II and at any interim analyses. Sabin et al. 6 further discussed the use of the PoS in decision-making and presented a two-stage method that starts before Phase II and takes the user through to the end of Phase II decision.
Another area in the literature relevant to the problem that we are interested in relates to the planning of sequences of trials. Whitehead 7 discusses the problem of designing a series of Phase II studies when the aim is to identify the treatment that should be taken to Phase III. The methodology presented also provides the optimal number of treatments to be tested in Phase II. Existing literature regarding the planning of sequences of trials also includes platform trials 8 and multi-arm multi-stage trials. 9 In the setting that we are interested in, however, the related combination studies may not share the same target population or the same indication as is typical in the literature for planning sequences of studies, and the studies might not be available to begin simultaneously.
Bayesian modelling is used in a variety of different areas related to clinical trials such as adaptive designs, 10 meta-analyses 11 and assessing safety, 12 while we present a Bayesian framework that allows the probability distributions of the effect sizes of a group of related combination therapies to be updated based on the outcome of a single combination study. This allows the PoS of related combination studies to be updated. This procedure allows emerging information on related combination therapies to feed into and assist the planning and decision-making process for other potential combination programmes. In line with existing literature, we assume that the design and analysis of the studies are conducted using frequentist methods while the calculation of the PoS will use a Bayesian framework.
In order to provide further motivation and context to this problem, we will consider two historic Phase III trials, and use them to illustrate the methodology throughout the manuscript. We will consider the CLEOPATRA (NCT00567190) 13 and MARIANNE (NCT01120184) 14 trials, which both included similar combination therapies in the treatment of patients with HER2-positive breast cancer and used progression-free survival (PFS) as the primary endpoint. The purpose of our method is to capture the relationship between study outcomes, rather than considering the differences between the studies themselves, and to use this to help inform decision-making. Therefore, while the two studies do have several differences, they serve as an example of the type of situation in which the proposed method may be applied.
The CLEOPATRA study is a double-blind study that compared trastuzumab plus docetaxel plus pertuzumab to trastuzumab plus docetaxel plus placebo with a 1:1 allocation ratio. 13 The MARIANNE study is a multi-arm study that compared trastuzumab emtansine plus placebo and trastuzumab emtansine plus pertuzumab to trastuzumab plus taxane. 14 The trastuzumab plus taxane arm in the MARIANNE study was open label, whereas the two experimental arms were blinded with respect to pertuzumab or placebo and the allocation ratio was 1:1:1.
Both studies have a control arm that contains trastuzumab and a taxane (the CLEOPATRA study also contains placebo) and an experimental arm that includes pertuzumab. We will therefore aim to use the CLEOPATRA study to draw inference upon the outcome of a modified hypothetical two-arm version of the MARIANNE study that compares trastuzumab plus taxane to trastuzumab emtansine plus pertuzumab; we will not consider the trastuzumab emtansine plus placebo arm. From now on, we will refer to this hypothetical study as the modified MARIANNE (mod-MARIANNE) study.
It is clear that there are several differences between the two studies, such as the blinding and the number of arms. Irrespective of this, we believe that the outcome of one study could be informative for the other and hence these studies will be used for illustration of the methodology.
In Section 2, we present the framework and methodology for updating the PoS of related combination studies. We also provide an extension that accounts for the fact that the treatment effects, hence study success probabilities, of the combinations may not be correlated. In Section 3, we present the results of a simulation study. We provide a discussion of the approach in Section 4.
Methods
In this section, we build the framework that allows the PoS of a combination study to be updated based on the outcome of a related combination study with the aim to assist decision-making.
First, we update the distributions of related combination therapies based on the outcome of a single combination study using a Bayesian framework. Then, using the updated marginal distributions, we can find the PoS for all remaining studies. We also provide an extension that allows us to consider the fact that the assumption of related combination studies being positively correlated might not always hold and account for this in our PoS calculations.
Framework
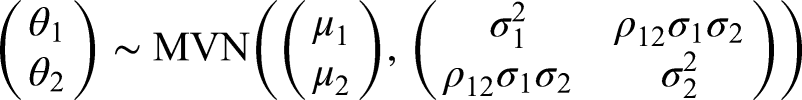
For illustrative purposes, let us first consider a pair of related combinations, for example
We are interested in calculating the PoS for one combination study based on the study results of a related combination. In order to calculate the PoS we will follow the method presented by O’Hagan et al.
4
to calculate the assurance, which is defined by


In order to calculate the PoS and update it using related combination study data, we need to consider the treatment effects of the combinations of interest. For the simple example of combinations
Before a clinical trial begins, the study team will have some idea as to how the therapy may be expected to perform based on historical data and expert opinion. In order to capture these beliefs we can specify a prior distribution on the parameter of interest. This prior distribution is able to capture the expected value of the treatment effect and also the level of uncertainty in this value. There is extensive literature on prior elicitation in the setting of a clinical trial, with one of the most commonly discussed methods being the SHELF framework. 18
We will represent the prior beliefs for the treatment effects of the two combination therapies,
When determining an appropriate value for
It should be noted that this model does not aim to capture synergism or antagonism within the components of the combinations, instead, it aims to capture similarities across the combinations, which will allow us to learn across the combinations.
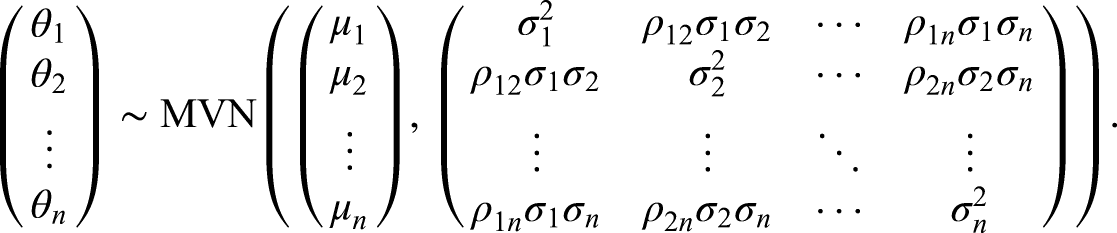
In the case where there are
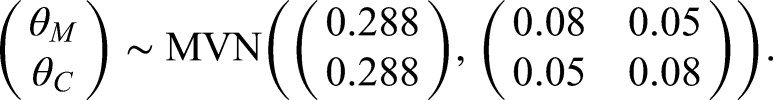
In order to specify the prior distribution for our illustrative example we will let
We will specify the prior means of both
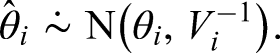
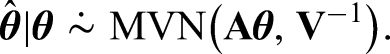
As we observe further clinical studies on the combinations, we want to update this distribution to reflect the information gained from these new studies. We assume that these studies will be designed and analysed using frequentist methodology using a test based upon a likelihood function. Therefore, to summarise the outcome of study
The score statistic can be considered as a measure of the benefit of the experimental treatment, based on what was observed in the study, and the Fisher information is a measure of how much information on
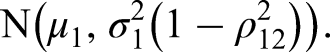
If we only consider the marginal prior distribution of
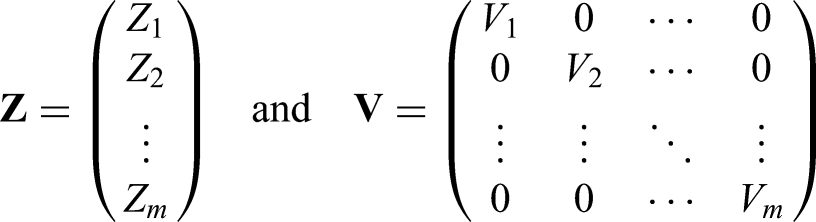
In our setting, however, we consider these parameters in a vector represented by
In our illustrative example, the CLEOPATRA study was the first of the two studies to be conducted therefore we will use the information from the CLEOPATRA study to update our beliefs about the PoS of the mod-MARIANNE study. The CLEOPATRA study observed 604 PFS events, 320 in the control arm and 284 in the experimental arm, and the observed HR was 0.68.
20
We are able to find

In this section, we will consider the case where there are
Let
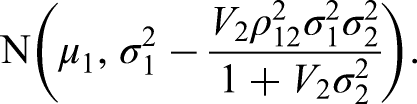
In order to consider the distribution of

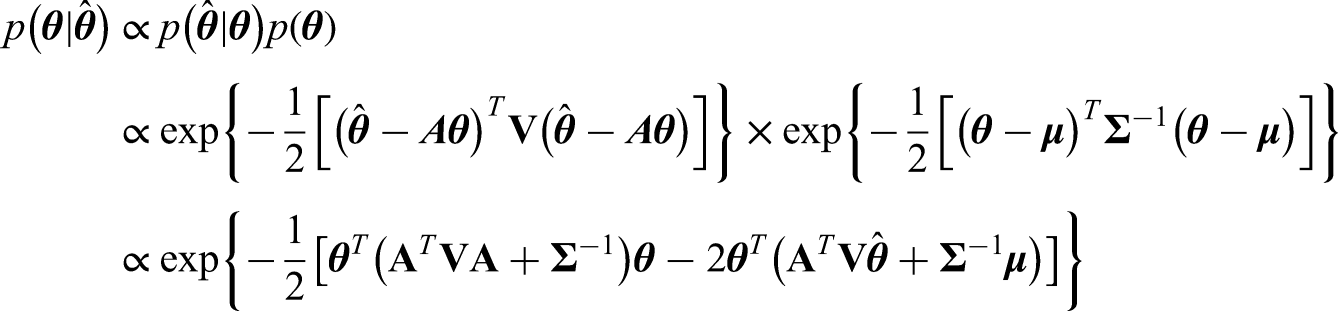

Note that interestingly we can also use the Kalman Filter 22 and Gaussian Markov Random Fields 23 to tackle the problem presented here, which lead to the same posterior distribution. Details of this can be found in Appendix A.
We can then find the updated PoS for a study on
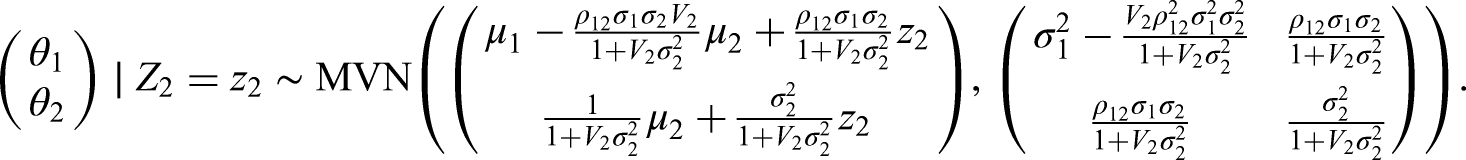
Following the above approach, the posterior distribution for our illustrative example is given by

If we use a prior correlation of 0.4, instead of 0.6 as above, then we would have a posterior distribution of

The three-arm MARIANNE study
14
was completed with study parameters as described previously and
Note that, in this illustrative example, there were several differences between the two studies, yet our method is still able to add benefit in this case. This is because our method allows the user to consider how the beliefs regarding a treatment effect change based on related study outcomes and the effect that this has on the probability of study success. The method does not require a high level of correlation between the treatment effects, nor does it require specific information on the similarities between the studies, it simply requires a parameter for the level of borrowing across the studies. This means that it may be applicable in a wide range of settings and may also be used to help inform and assist decision-making.
If there is doubt regarding the relationship between the study outcomes, the user might prefer the amount of borrowing to be dependent on the observed data. This would allow for a small amount of borrowing when the observed data suggests little correlation between study outcomes and a higher level of borrowing when the data suggests a relationship between outcomes. We present a robustification in the next section that aims to capture this requirement.
Robustification
In Section 2.3, we outlined the method that can be used to update the distribution of a set of related combination therapies based on the outcome of a single combination study. Updating a distribution given relevant observations allows us to improve the accuracy of our estimates. However, thus far, we have assumed that all of the therapies in our set of ‘related’ combinations are truly correlated and that there is something to be gained from sharing information across the different combinations, but this might not always be the case.
In this section, we will consider an extension to the method that allows us to take into account the fact that the outcomes of two ‘related’ combination studies may not actually be correlated, despite initial beliefs, and robustify our procedure against this. Since we are only observing the outcome of one combination study at a time, we do not have the opportunity to learn from pairs of outcomes. Therefore, we cannot learn about the correlation and hence update our model using this. Instead, we will consider how emerging data aligns with our prior beliefs, which is similar to recent work on extrapolation. 24
If we observe a study for combination
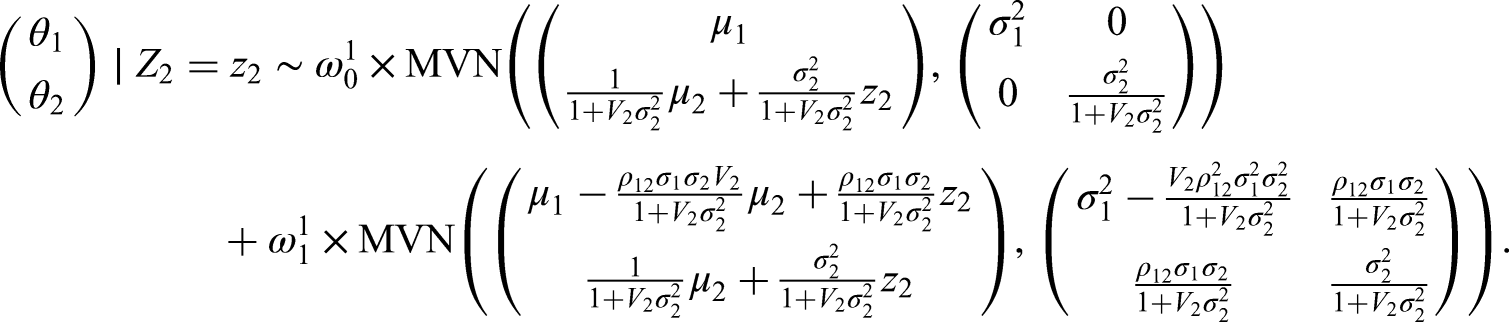
First, we will consider a mixture prior on

If we were to update this mixture in the standard way then the weights would remain unchanged despite the gain in information. Therefore, we will develop some further methodology in order to update the weights and use the methodology from Section 2.3 to update the separate components.
Let us first consider the properties that we will want this procedure to have. Firstly, we want it to consider the amount that the distribution has shifted and to assign a higher weight to the uncorrelated distribution if this shift is too large, i.e. moves ‘too far’ from what we initially thought was realistic. Conversely, if the shift in the marginal posterior mean is small and the study size is large, we would want to assign a higher weight to the correlated distribution. Furthermore, if the observed study is small, then we only want the weights to shift a small amount compared to how much they would have shifted given equivalent results from a large study.
We want to update the weights by combining the prior weights,

For the hypothetical posterior approach, we construct a hypothetical normally distributed posterior for
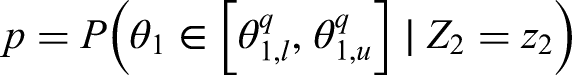
We then want to compare these quartiles with the posterior that we find using the original procedure given the observed value of

An example of what the hypothetical and limiting posterior distributions may look like can be found in Figure 1. In this example, our posterior beliefs do not align with our prior beliefs as we see a shift in the mean. However, there still seems to be quite a large amount of overlap between the posterior distribution and the hypothetical posterior distribution, while there is less so with the limiting posterior distribution. This figure also serves to illustrate why we consider the truncated posterior rather than the original posterior. Recall that the posterior distribution here is based only on ‘related’ data, and not on direct data. Therefore, considering the truncated distribution allows us to reduce the overlap in cases such as this one where the means are far enough apart for us to consider it to be a potential reason not to borrow from the ‘related’ combination.
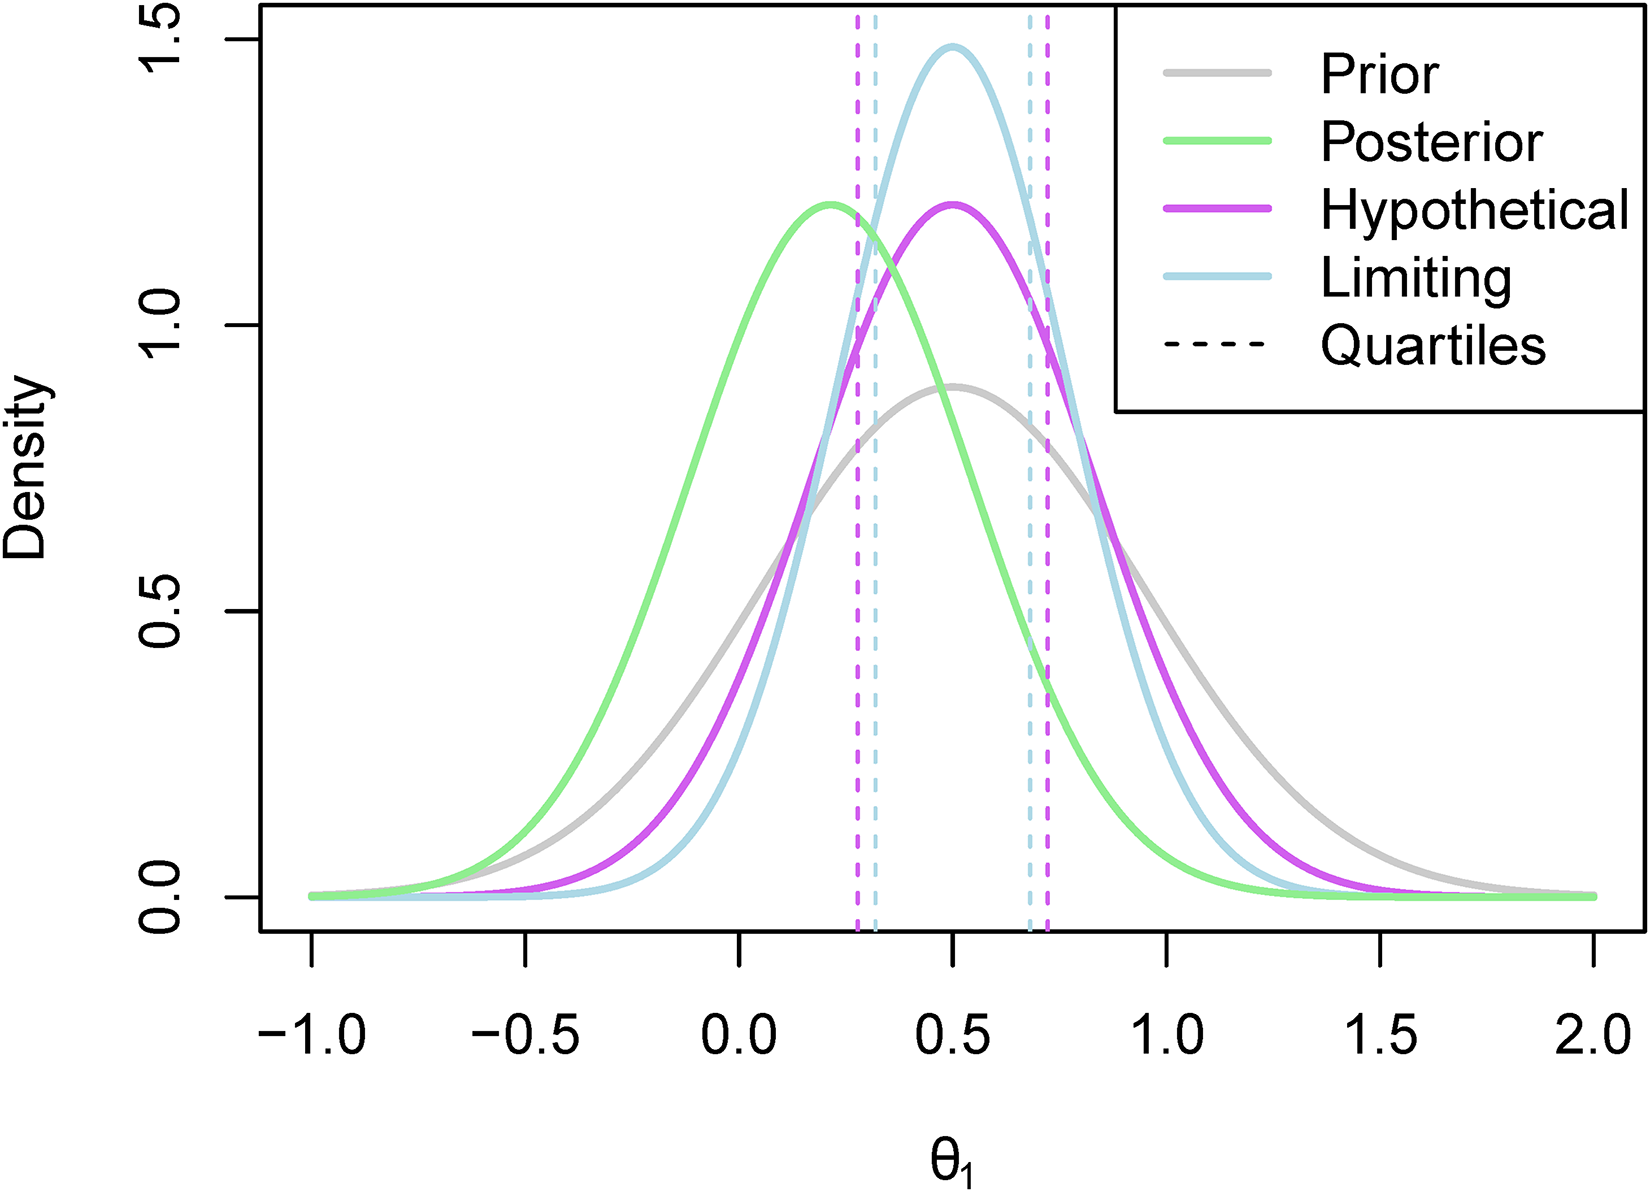
The hypothetical and limiting posterior distributions for an illustrative example.
Once we have found our chosen value of
Following the same approach outlined in Section 2.3, this posterior can be used to calculate the success probability of a combination study of interest by using the assurance as presented by O’Hagan et al. 4
If we applied this approach to our illustrative example then we would have a posterior distribution of
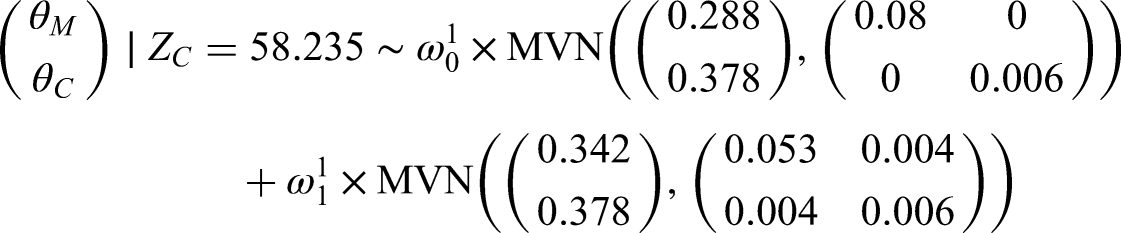
If we set
The marginal posterior distributions of
If we wished to use this extension for more than two combinations, we would simply need to split our vector of random variables,
In this section, we will illustrate the performance of these methods by looking at the posterior distributions and the success probabilities that these methods lead to in a simulation study. We will compare the results of the proposed multivariate methods to the results of only marginal updating i.e. the univariate alternative. We will also include the standard mixture approach as mentioned in Section 2.4, which is the approach where the weights are not updated, in the simulation study for comparison to the hypothetical and limiting posterior mixture approaches. We will use the assurance to calculate the study success probabilities in the simulation study, as in previous sections, but it should be noted that other methods for calculating the PoS may also be used.
In order to provide a complete picture of the way these multivariate methods perform compared to the univariate alternative, we will consider different sets of prior distributions that may have arisen from historical data such as the results of a small study. We will take the true value of
We will assume that the prior information on both of these parameters is equivalent to having a prior variance of 0.2. This is approximately equal to having an uninformative ‘pre-prior’ and updating based on the outcome of a study involving 20 patients with normally distributed responses.
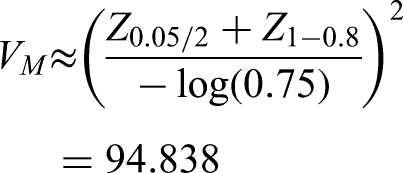
We will assume that we observe the outcome of a study on
Effect of the sample size on the PoS
In order to illustrate what might happen to the PoS for different sample sizes, we can consider a fixed study outcome and find the PoS using this outcome with different sample sizes. Figure 3 shows how the PoS for a study on
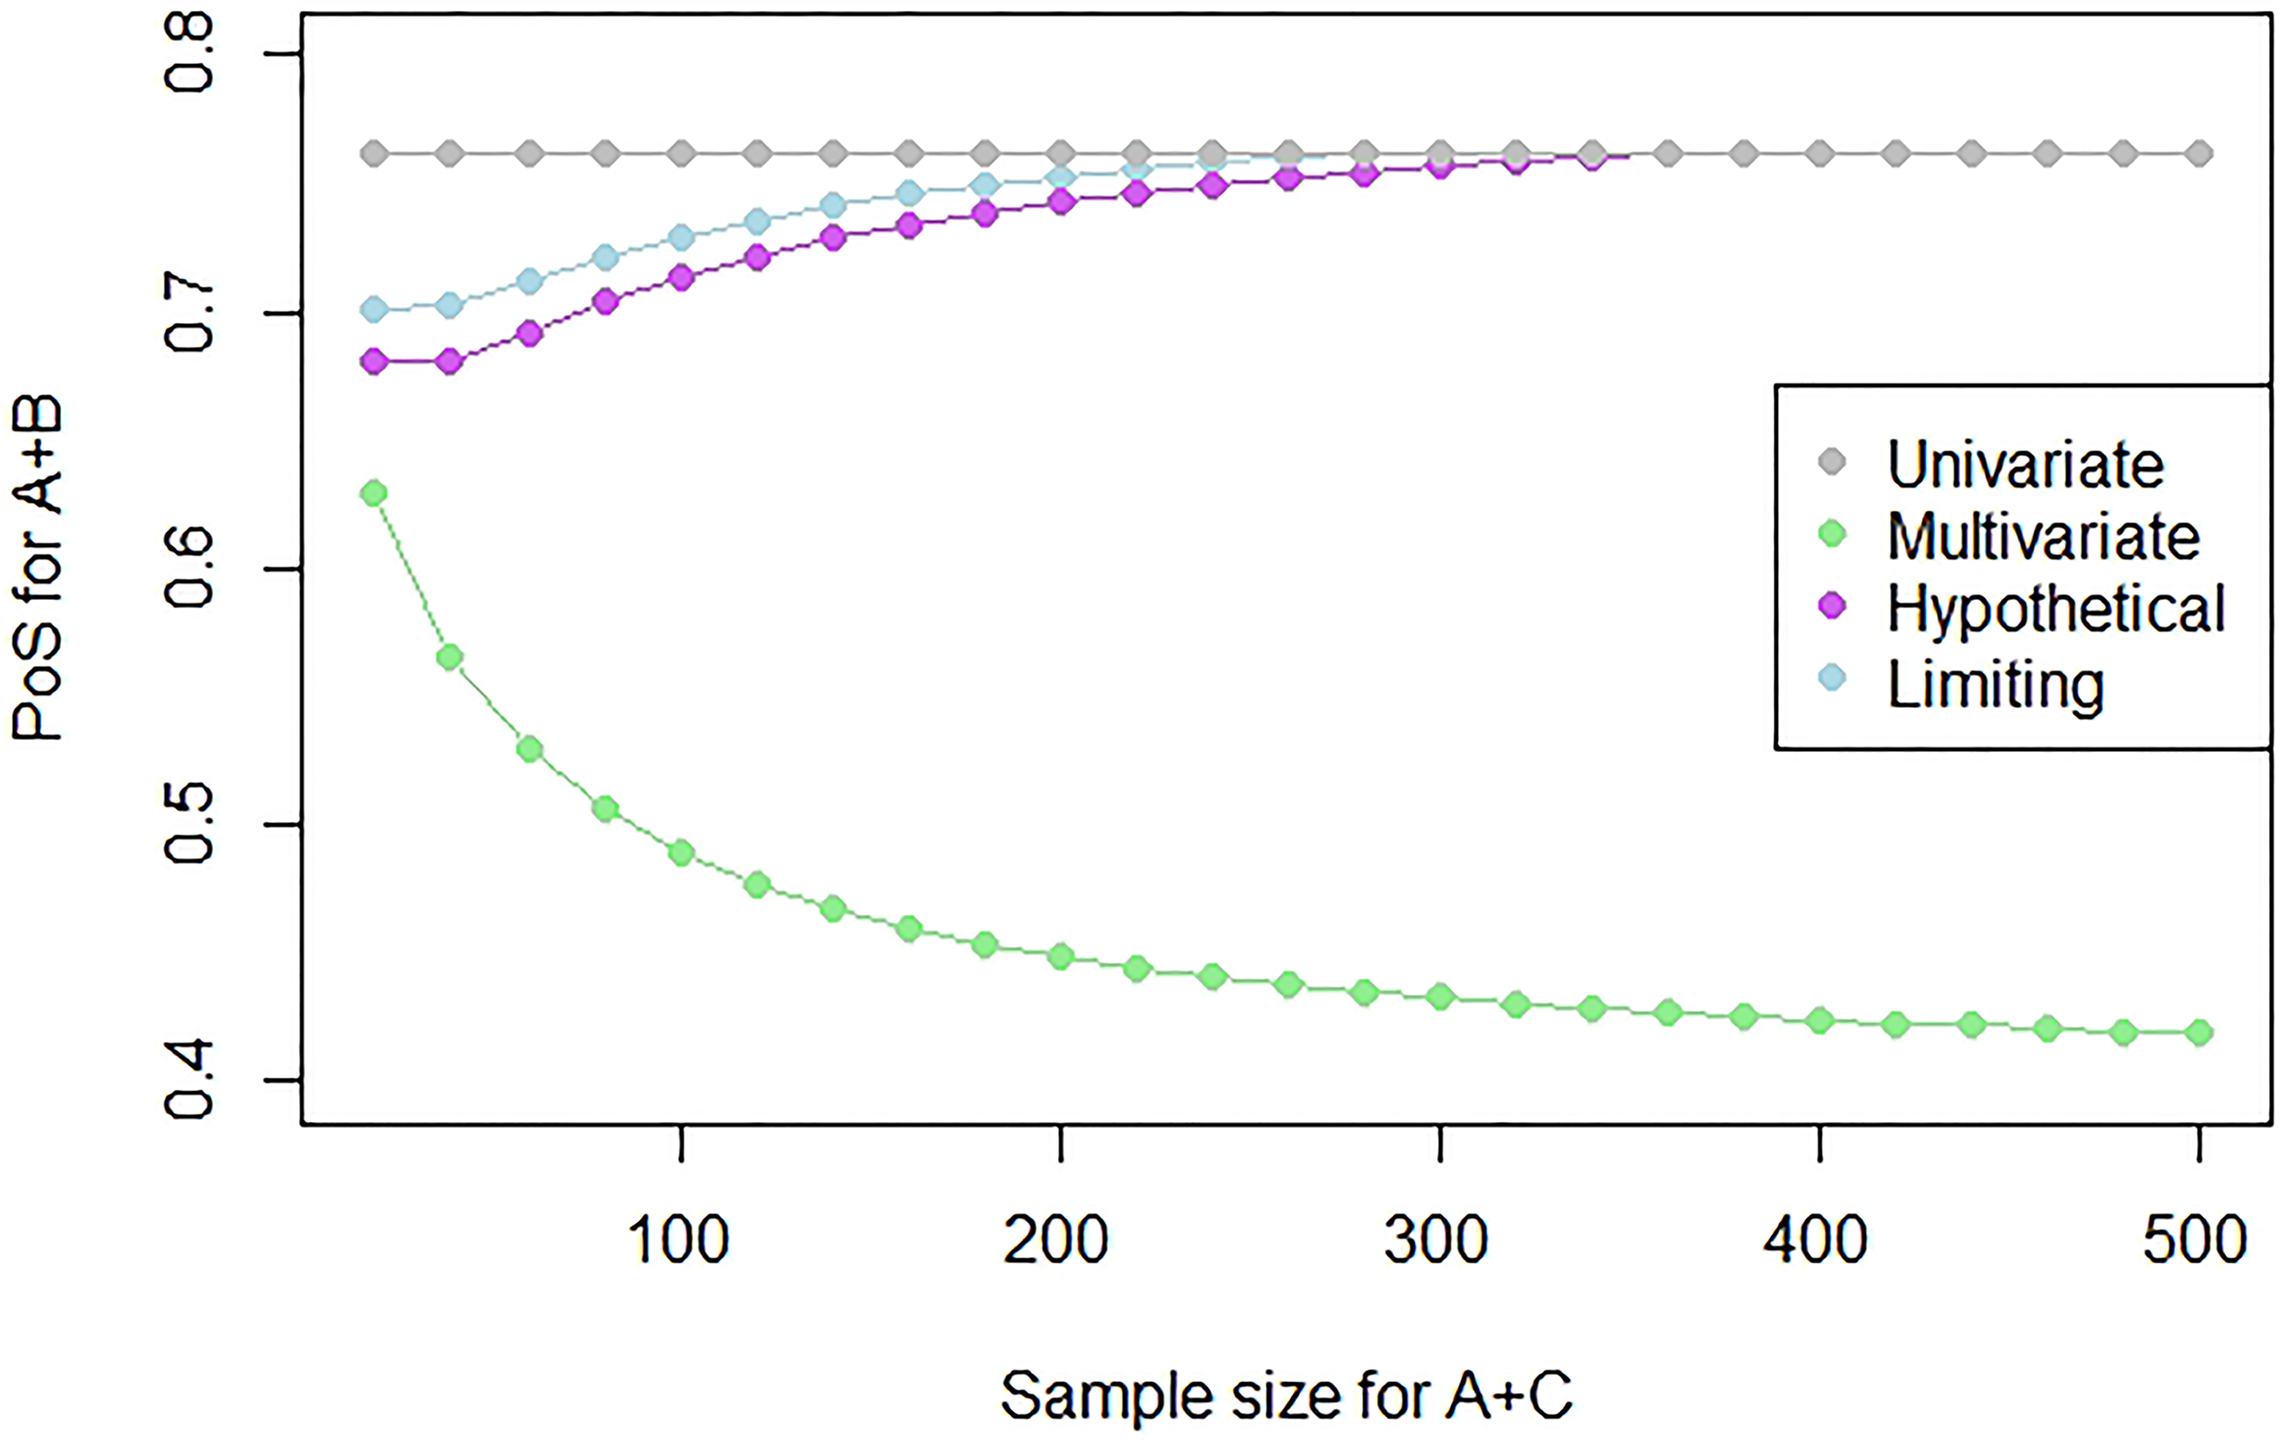
Plot showing the PoS for a study on
We see that as the sample size increases, the PoS of the multivariate approach decreases as there is more evidence to suggest that
We will consider the sample size of the study of A + C to be equal to 500 as we would be most interested in borrowing information and using this methodology when we observe the outcome of a relatively large (e.g. Phase III) study.
In order to account for the variability in the treatment effect estimate that we would have based on a small prior study, we will consider three different prior means for
We set up the different prior distributions and we simulate 10,000 replications of
As before, we considered the definition of the PoS for a future study on
Results
The results of the simulation study are provided in Table 1. For the univariate approach, we do not need to consider multiple replications of a study on combination
Table showing the results for combination
of the simulation study where the true values of
and
are given by 0.5 and
and
represent the prior means for each combination.
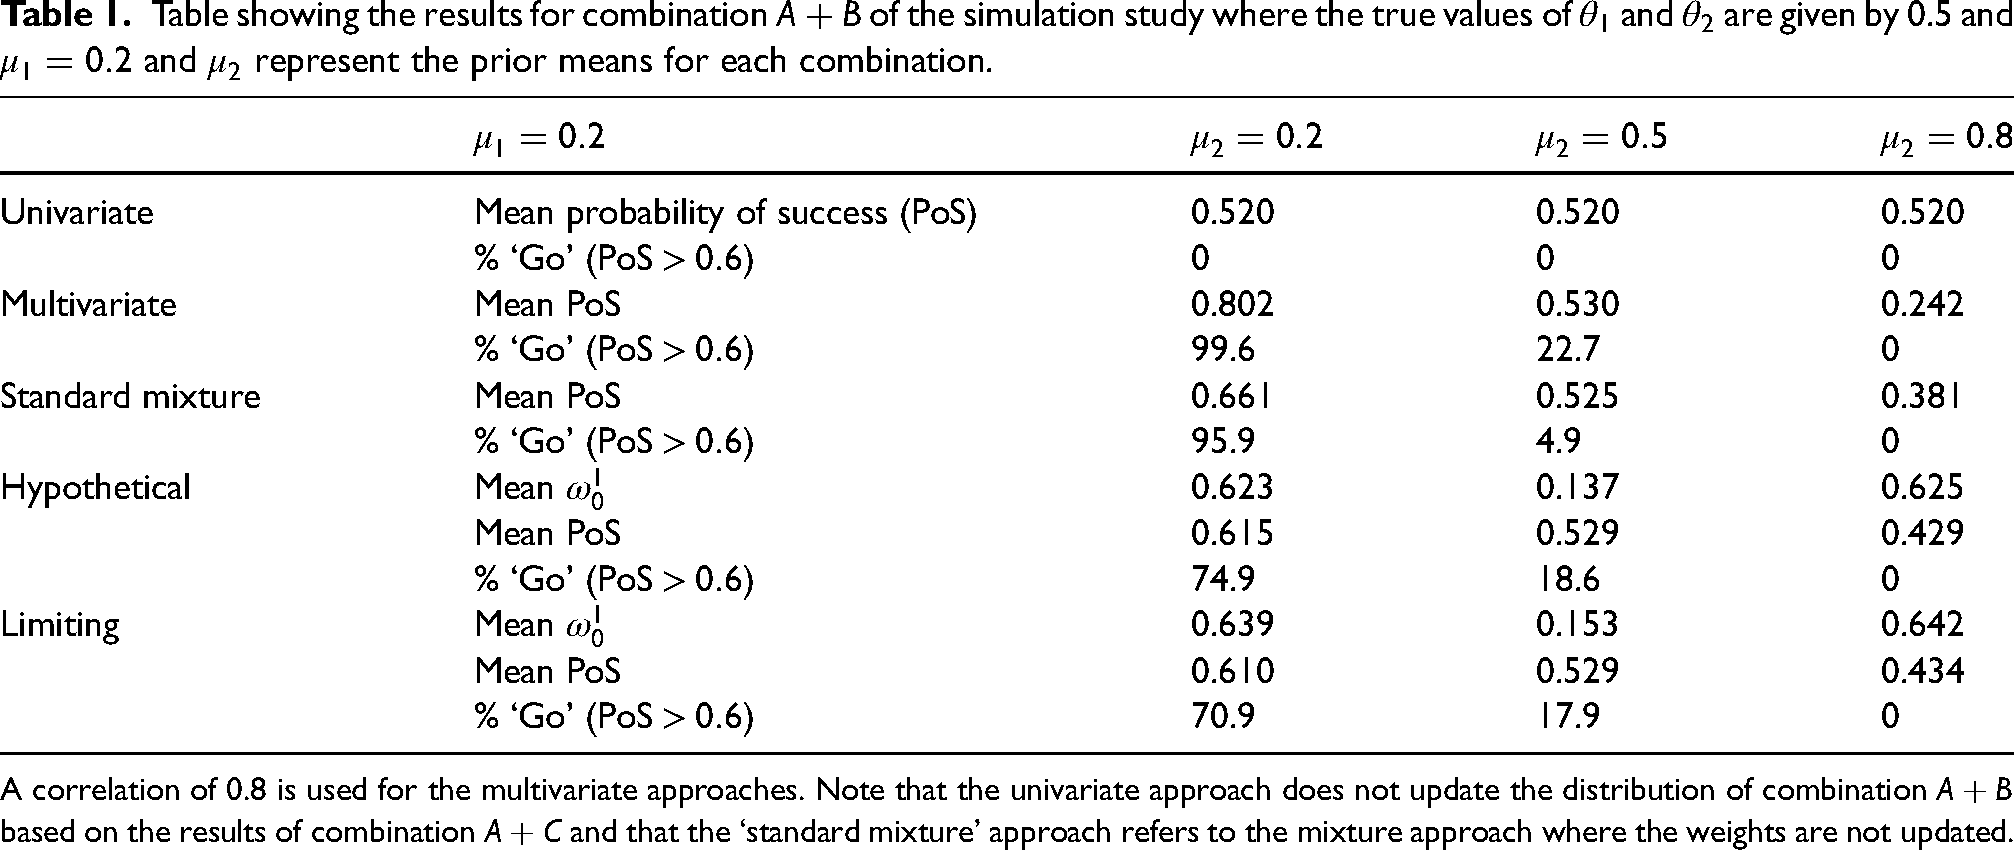
Table showing the results for combination
A correlation of 0.8 is used for the multivariate approaches. Note that the univariate approach does not update the distribution of combination
In Figure 4, 50 posterior distributions under the multivariate approach are plotted for fifty replications with the prior means given by
Marginal posterior distributions of
We see that when we have a prior mean of
However, when we do include the indirect data, we make many more ‘go’ decisions. This, however, is also dependent on what the prior mean for combination
Histograms of the PoS for a study on
When
However, when our prior means for
These results are also highlighted in the plots provided in Figure 4. In Figure 4(a), we see that when
These patterns will hold for other values of
In this simulation study, we considered both
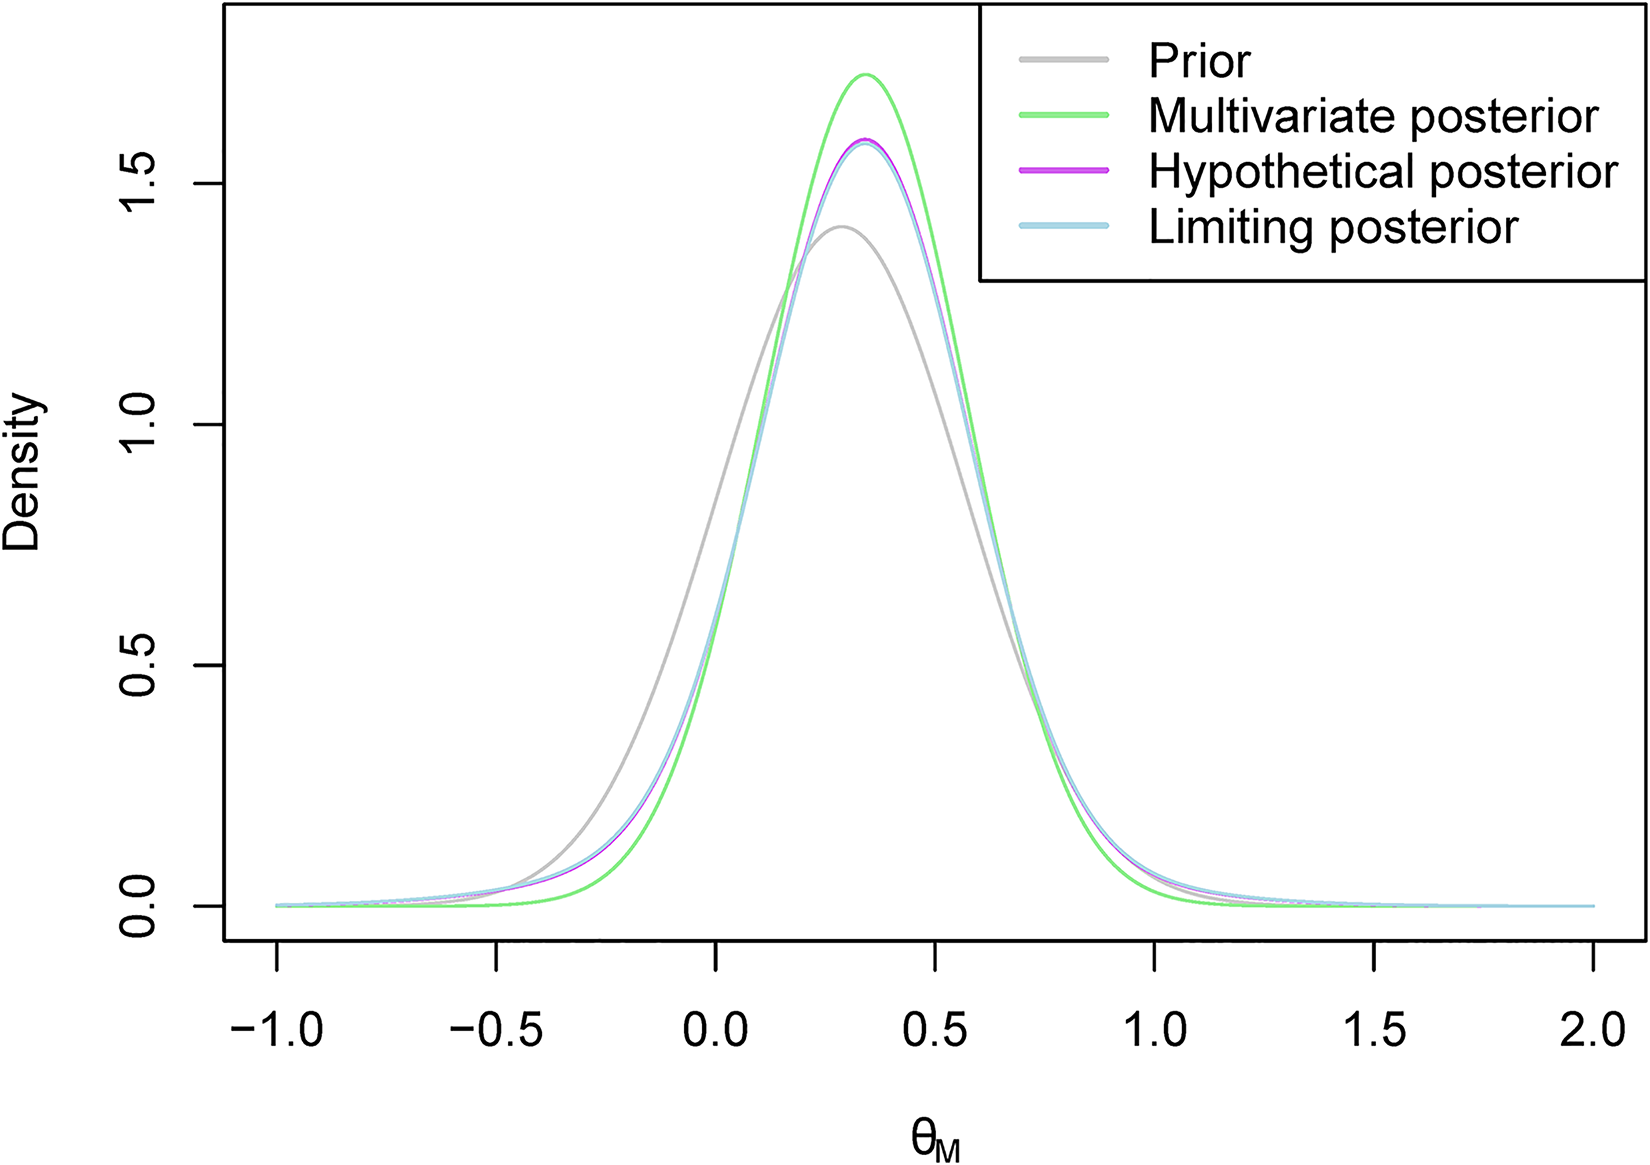
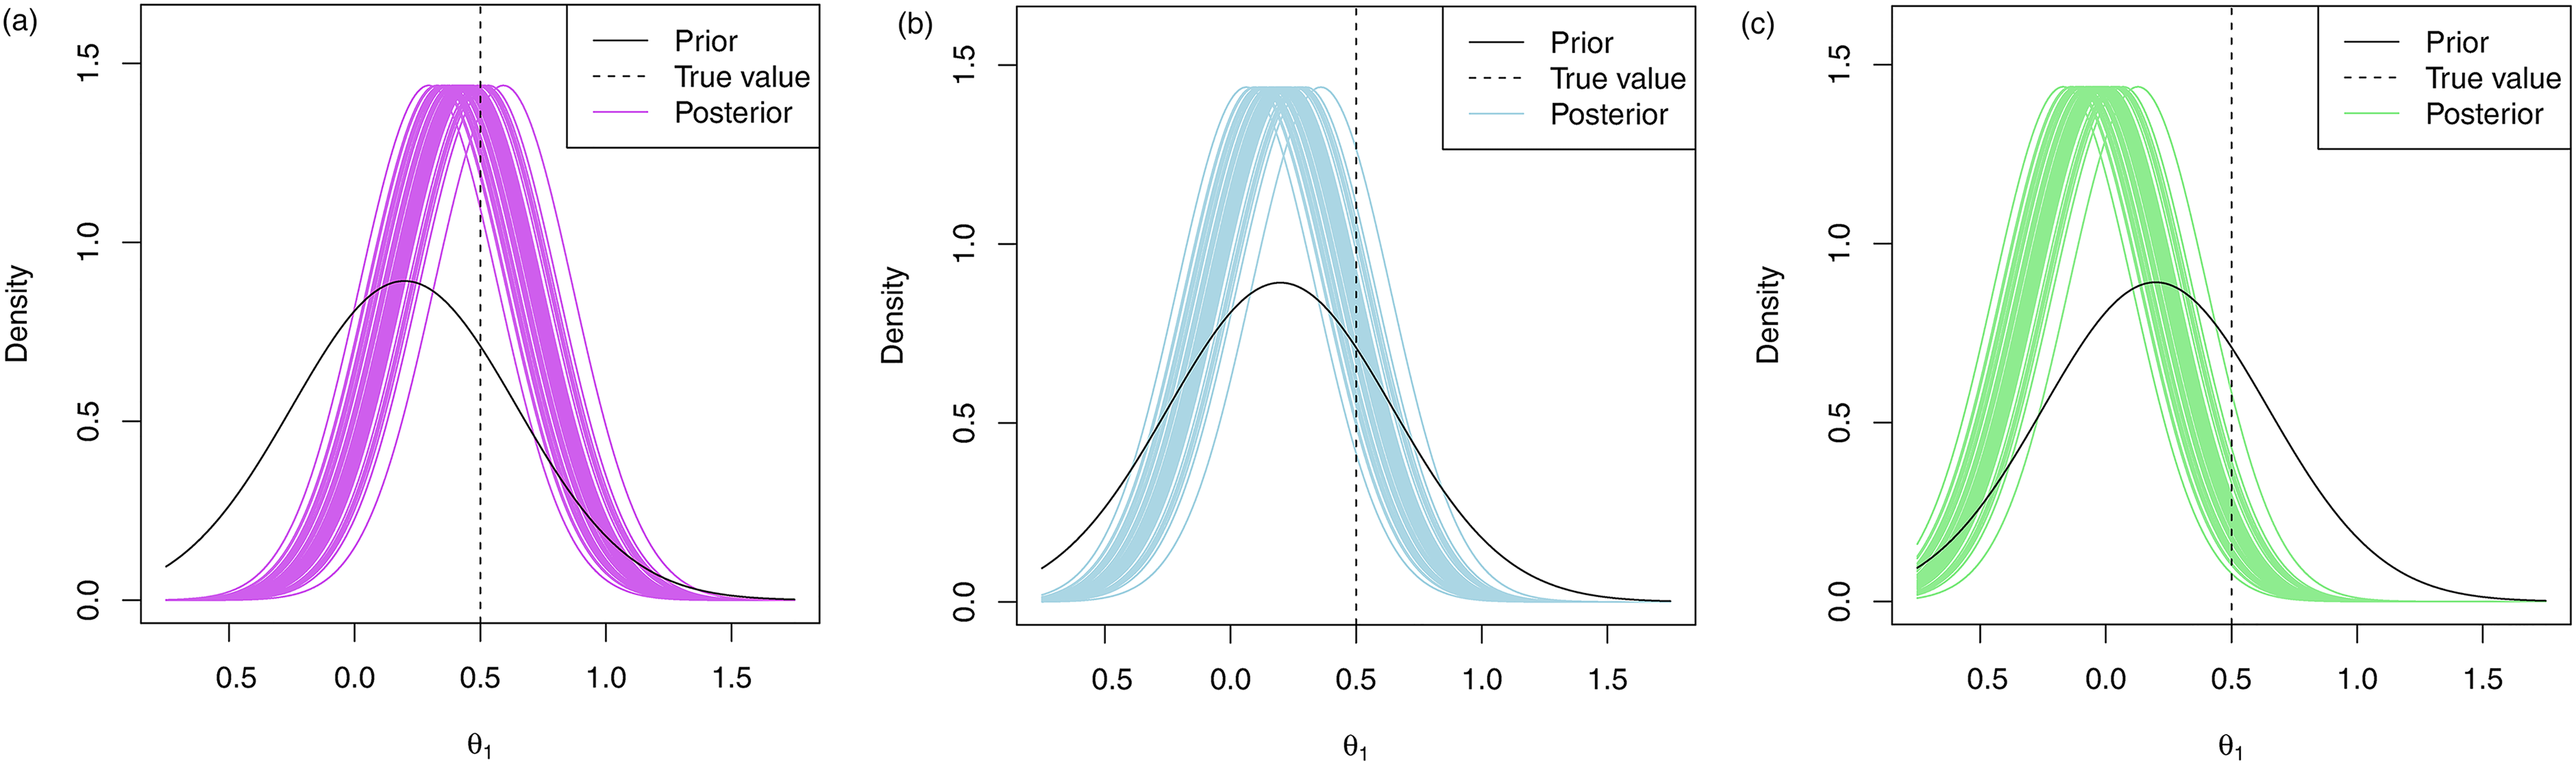
We also considered the performance of the hypothetical and limiting mixture posterior approaches that were presented in Section 2.4, along with the standard mixture approach in the simulation study and the results are presented in Table 1. The posterior distributions for the hypothetical and limiting posterior approaches are given in Figure 6 and the histograms of the success probabilities are given in Figure 7. We used prior weights of 0.5 for the correlated and uncorrelated components in each of the mixture approaches.
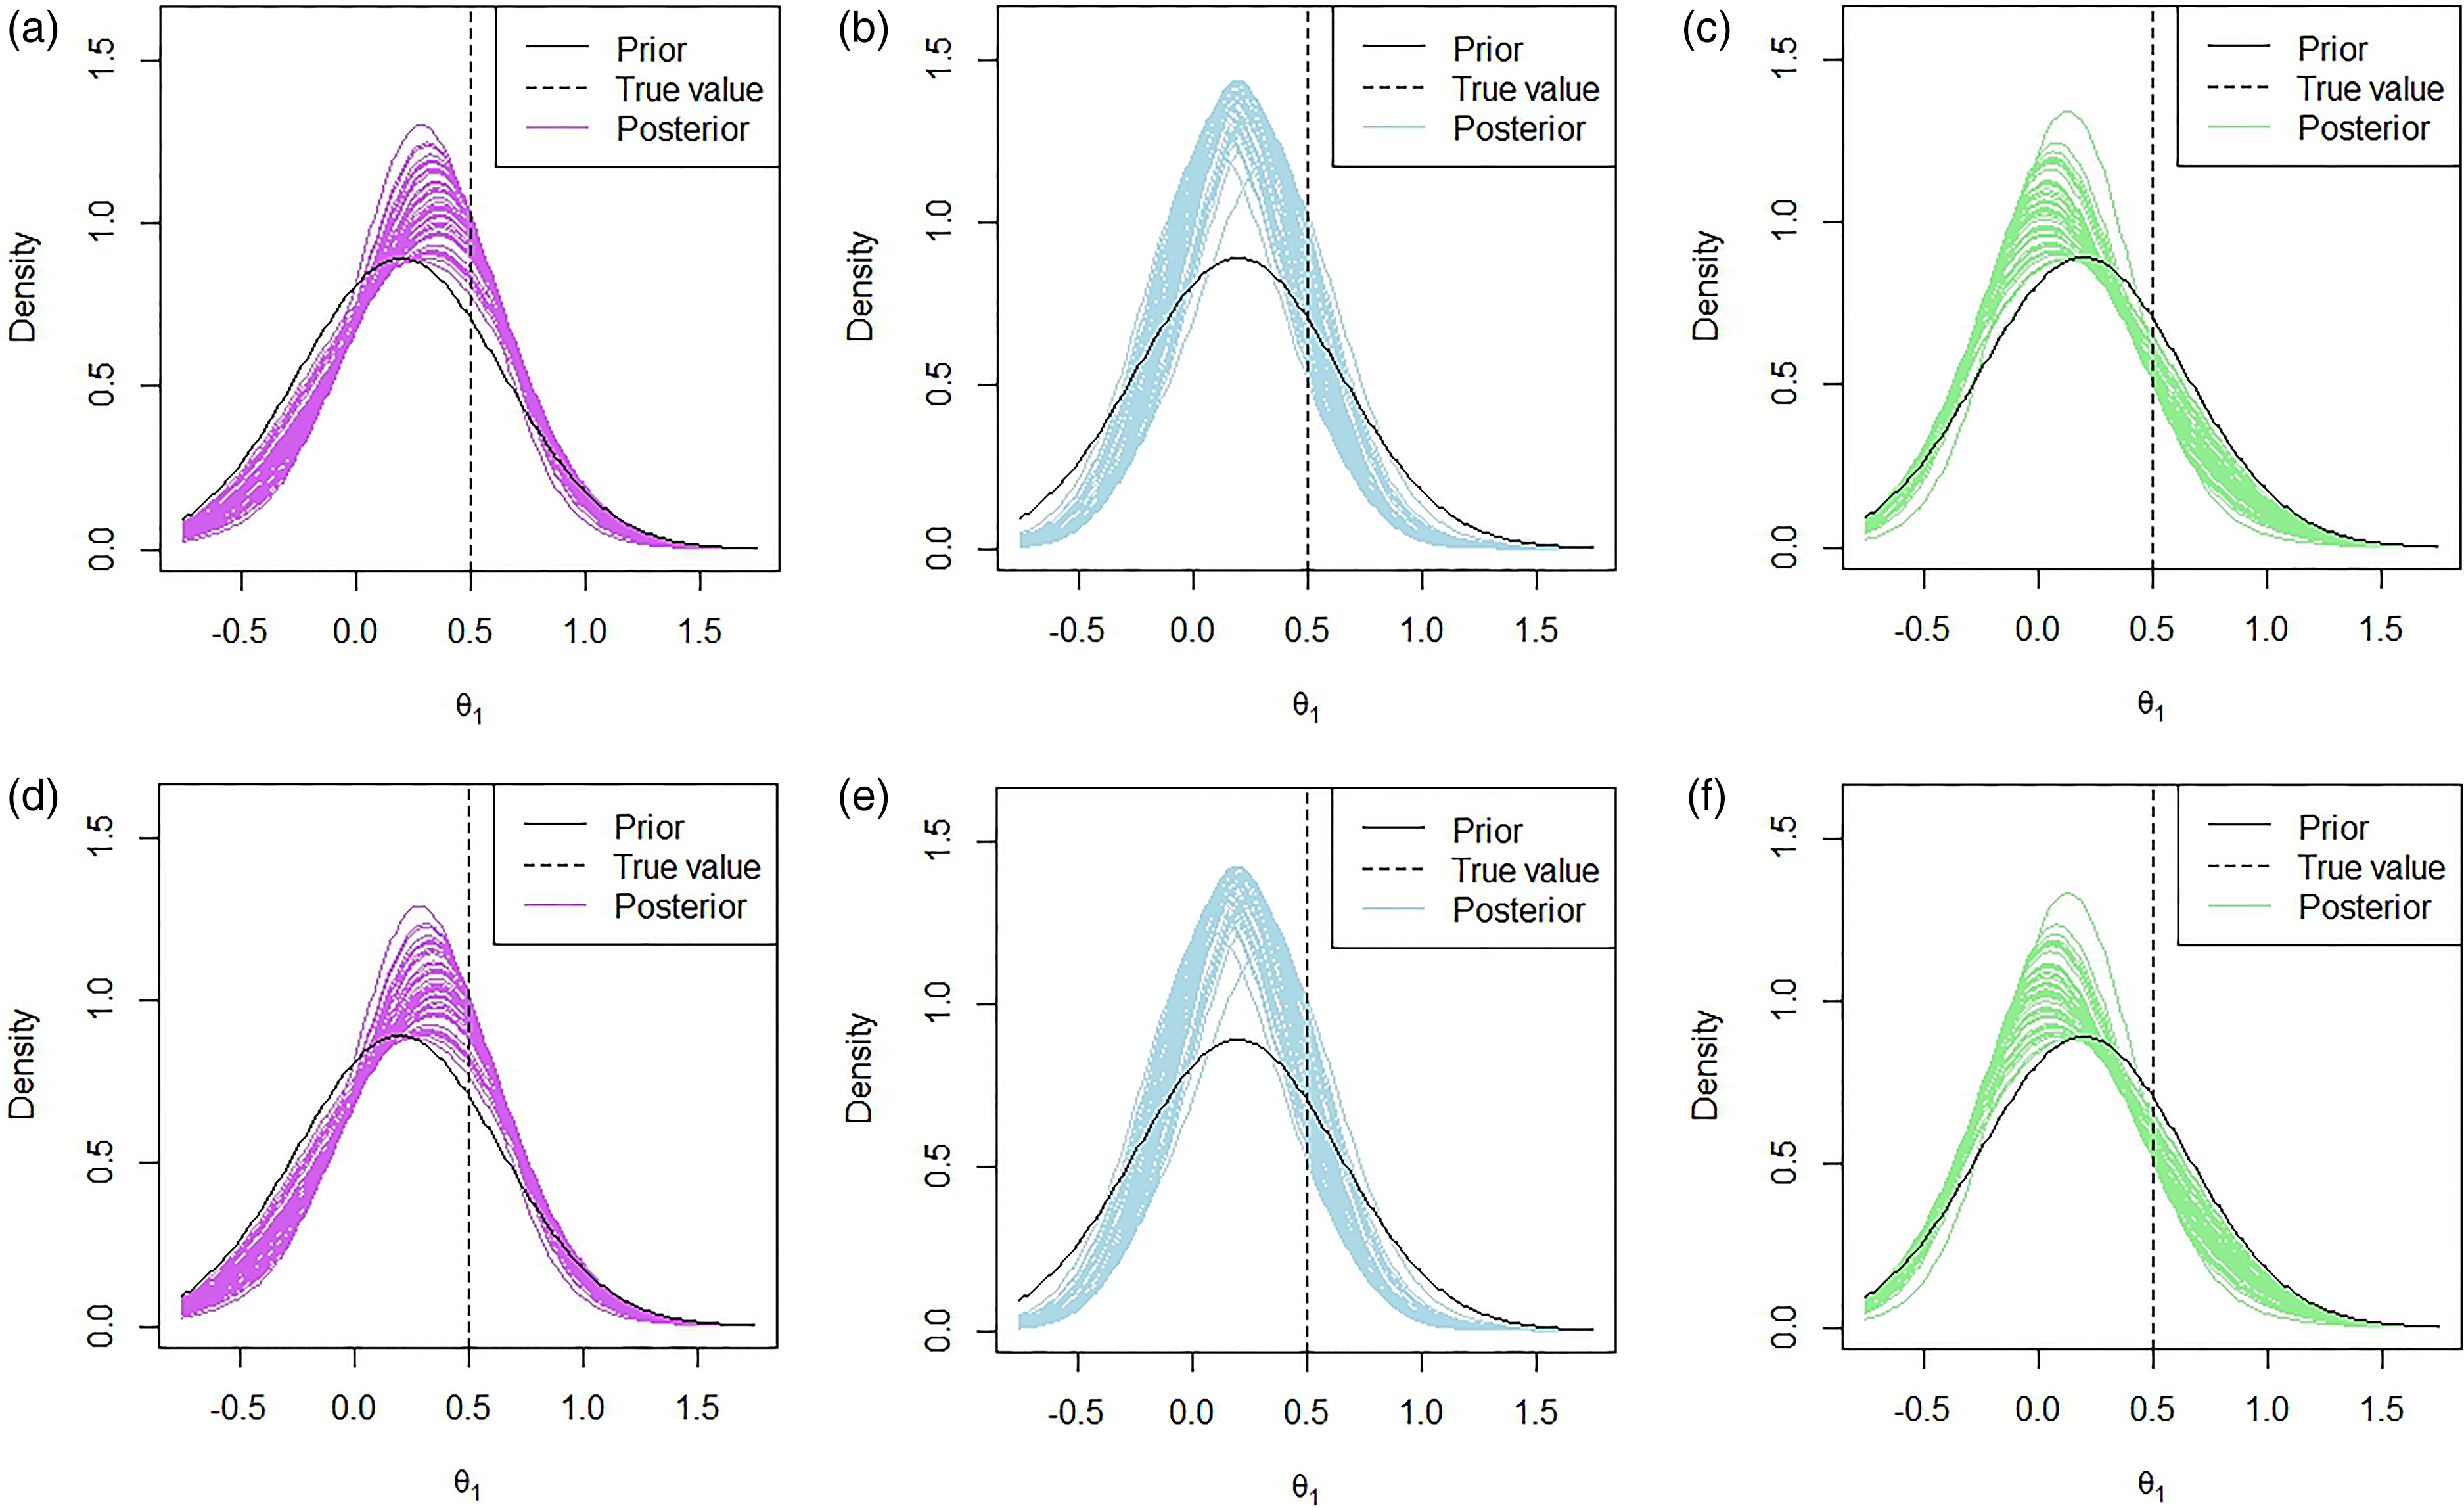
Marginal posterior distributions of
Since the mixture prior approach was introduced to account for the fact that two combinations may not be correlated and to borrow less when this is the case, the results that we see for the mixture approaches are not as extreme as in the multivariate approach in most cases. That is, the mean PoS and the proportion of ‘go’ decisions are lower in the mixture approach than in the multivariate approach when the indirect data causes an increase in mean, i.e.
In Figure 6, we see very similar patterns in terms of the posterior distributions under the hypothetical and limiting posterior mixture approaches. One of the key observations from these posteriors is that the peak of the distributions is much closer to the prior means than in Figure 4, which showed the posteriors under the multivariate approach. This is due to the way in which we specified the weightings in Section 2.4.
One of the places where the effect of the mixture approaches is the most apparent is when
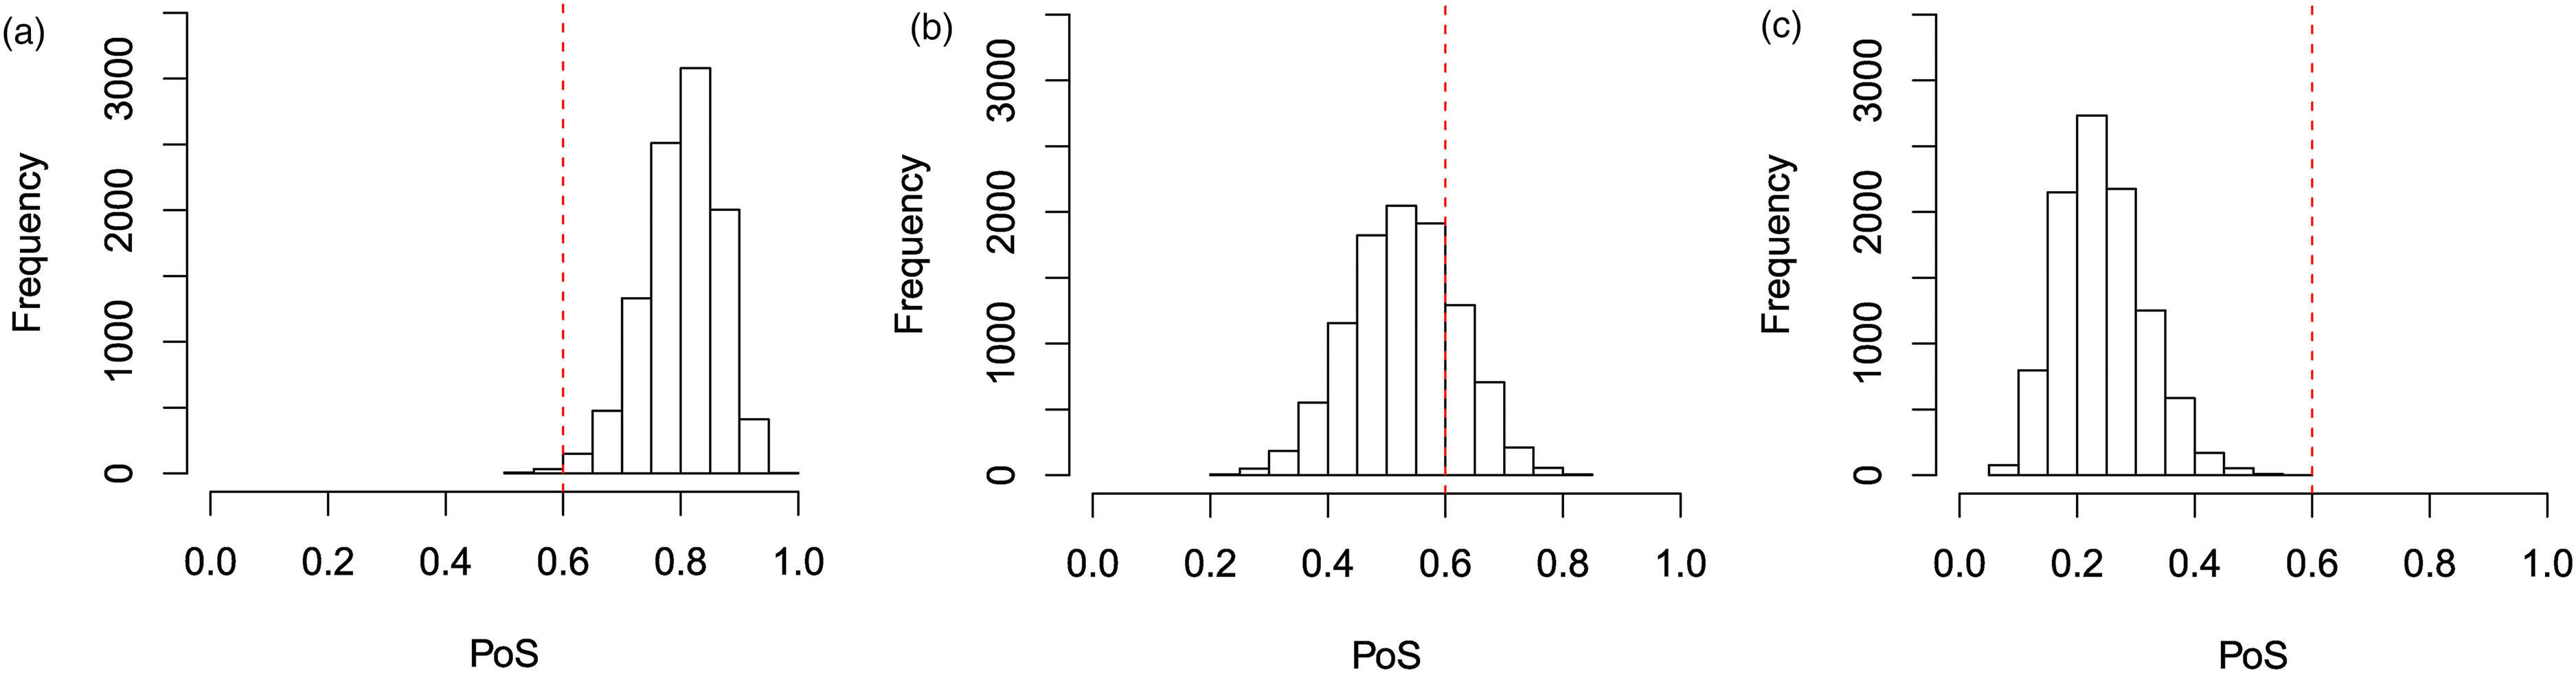
The difference in the performance of the hypothetical posterior approach as compared to the limiting posterior approach is less obvious in Table 1. To learn more about the differences, we look at the histograms presented in Figure 7. In the histograms presented, we see that the limiting posterior approach is less likely to assign more extreme values of the PoS than the hypothetical posterior approach. In Figure 7(d), the final bar on the histogram is much smaller than those that precede it, despite an overall upwards trend until that point. This contrasts with what we see in Figure 7(a). Similarly, in Figure 7(c), we see that the first bar in the histogram is quite an amount higher than the first bar in the histogram in Figure 7(f). This is also reflected in Table 1 where we see that, in the simulation study, the limiting posterior approach assigns a higher posterior weight on average to the uncorrelated component of the model than the hypothetical posterior approach in all three cases.
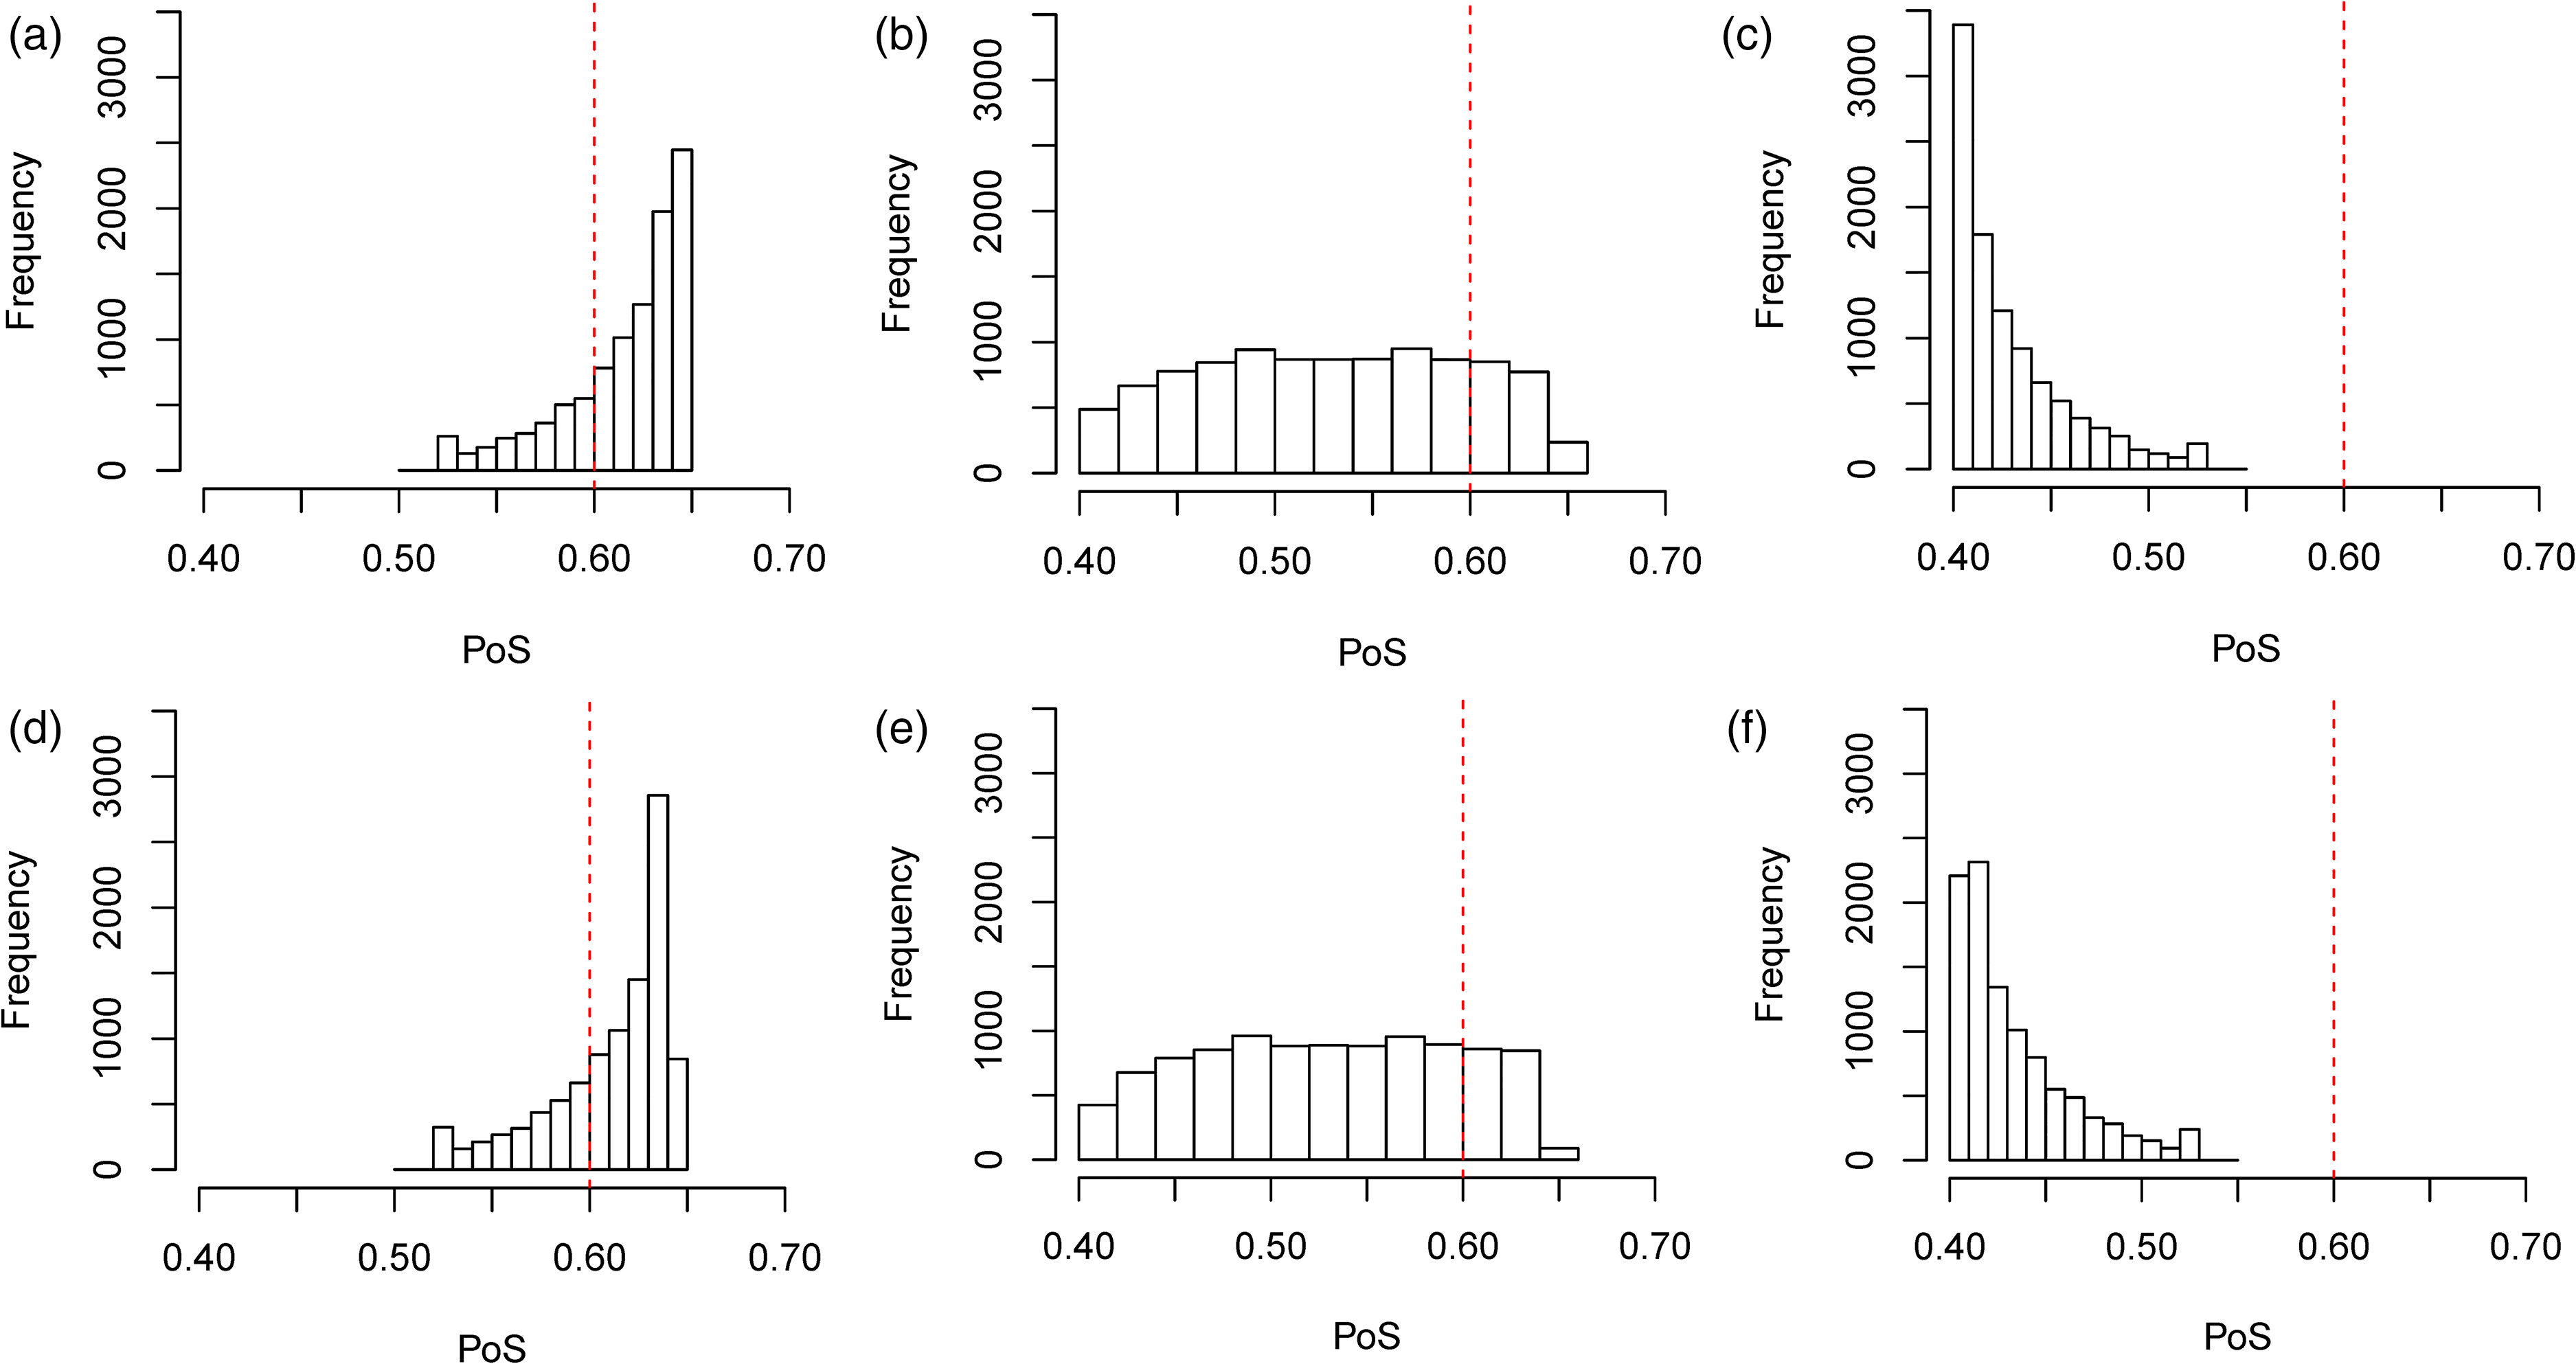
Histograms of the PoS for a study on
The reason that the limiting posterior approach is less likely to assign these more extreme values is related to the way that the weights are assigned. In both the hypothetical and limiting posterior approaches, a value of
In this paper, we have presented a method that allows the estimates of a set of related combination studies to be updated based on a single observation. This allows us to include both direct and indirect data in the treatment effect estimates, which allows us to reduce the variance and potentially improve the accuracy of these estimates. The probability distributions representing our beliefs about a particular therapy may often be used to gain an insight into the expected performance of a new therapy, but they are also often used to calculate the PoS of an upcoming study through the calculation of the assurance 4 or other distribution based definitions of the probability of study success. One such framework would be the methodology presented by Ibrahim et al., 16 which uses a Bayesian approach to calculate the PoS for a trial based on current data and allows for the inclusion of covariates and patient characteristics in the calculation of the PoS. The PoS is often used to assist decision-making regarding the study. Improving the accuracy of treatment effect estimates may allow decision-making to improve by providing the decision-makers with the ability to recognise beneficial, or ineffective, treatments sooner.
The CLEOPATRA and MARIANNE studies were used to build an example that illustrates how the proposed methodology can be used in the real world. Identical marginal priors were used for both studies and the results of the CLEOPATRA study were used to update the joint distribution.
The methods presented provide an overall advantage over traditional univariate approaches due to the fact that they are able to use all available data. The scenario where these methods may not perform as well as the traditional methods are when the prior means of the treatment effects are incorrect by quite a substantial distance in opposite directions. However, we presented an extension to our method in Section 2.4 that allows this to be accounted for and limits the shift from the prior mean to the posterior mean when indirect data has caused the shift. It should be noted that, in some situations, such as if the observed treatment effect is much smaller than expected, it may be more conservative to update the treatment effect based on this indirect data than to decide not to consider the indirect data. Therefore, expert opinion should also be taken into account when considering the level of borrowing and whether the original multivariate approach or the robustification is most appropriate for the decision-makers.
In order to use the presented methods to calculate the PoS of an upcoming study based on the results of a related study, three types of information are required. The first is the significance level and the planned sample size of the upcoming study, both of which should be readily available if we are considering whether or not to run the study. The second is the score statistic and the Fisher information of the completed study, which should also be available at the conclusion of the study. The final type of information relates to the prior parameters for the distribution of treatment effects. The prior mean and variance for a treatment effect is a standard requirement when calculating the PoS. Rufibach et al. 26 provided a discussion of the choice of prior when calculating the assurance and provides some recommendations. However, the prior correlation is an additional requirement of our approach over standard approaches. Rather than trying to quantify the correlation between treatments, one may instead consider this parameter as the amount of indirect information they would like to use (i.e. the strength of borrowing) when calculating the updated PoS as shown in Section 2.3. A potential area for further work is in the specification of the parameter and the potential to elicit this from the available data. We also presented a robustification that allows the alignment of our prior beliefs with the data to guide the degree of borrowing across combinations. The value of the PoS will always be dependent upon the prior parameters when we use methods such as the assurance 4 to calculate it. Therefore, our method will naturally have some sensitivity towards the choices of these prior parameters and users should explore this when specifying prior parameters. However, since our method allows the user to incorporate relevant study data in this calculation, the PoS calculated under this approach will be less reliant upon the prior mean and variance than traditional univariate approaches.
We highlighted the performance of the multivariate method in Section 3 and showed that, compared to the univariate approach for calculating the PoS, it leads to improved decision-making regarding whether or not a particular combination study should be run.
A summary table of the approaches presented can be found in Table 2.
Summary of the conclusions and recommendations of when to use each approach.
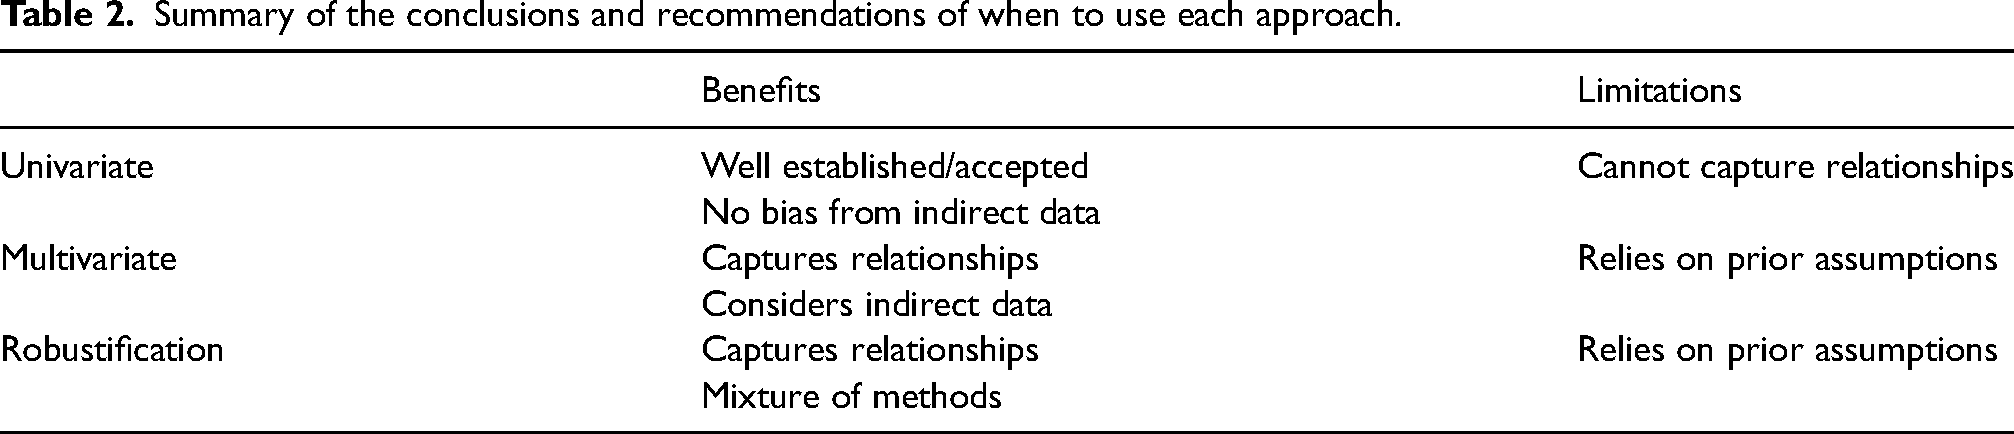
While most of the examples discussed and results presented were for a pair of combinations, it should be noted that the method can be used for any number of combinations. The method could also be used to assist internal decision-making based on external data. For example, multiple companies have developed PD-1/PD-L1 inhibitors, which are often combined with chemotherapies to treat different cancers. Companies could use the results of an external study to update the PoS of a study of their PD-1/PD-L1 inhibitor combination in the same indication. Furthermore, these methods could be applied not only in the setting of related combination studies but in different settings where there is potential to share information across studies. Some potential settings that could benefit from these methods include the same combination but in different indications and programmes in different regions.
Supplemental Material
sj-R-1-smm-10.1177_09622802231151218 - Supplemental material for Updating the probability of study success for combination therapies using related combination study data
Supplemental material, sj-R-1-smm-10.1177_09622802231151218 for Updating the probability of study success for combination therapies using related combination study data by Emily Graham, Chris Harbron and Thomas Jaki in Statistical Methods in Medical Research
Footnotes
Declaration of conflicting interests
The author(s) declared no potential conflicts of interest with respect to the research, authorship, and/or publication of this article.
Funding
The author(s) disclosed receipt of the following financial support for the research, authorship, and/or publication of this article: This work was supported by the Engineering and Physical Sciences Research Council through the STOR-i Centre for Doctoral Training [grant reference EP/L015692/1]; and Roche Pharmaceuticals. Thomas Jaki is funded by a National Institute for Health Research (NIHR) Senior Research Fellowship (NIHR-SRF-2015-08-001) for this research project. This paper presents independent research. The views expressed are those of the author(s) and not necessarily those of the NHS, the NIHR or the Department of Health and Social Care. Thomas Jaki also received funding from the UK Medical Research Council (MC_UU_00002/14). For the purpose of open access, the author has applied a Creative Commons Attribution (CC BY) licence to any Author Accepted Manuscript version arising.
Supplemental material
R code to update the distributions is provided in the supplemental materials.
Appendix A: methodology
References
Supplementary Material
Please find the following supplemental material available below.
For Open Access articles published under a Creative Commons License, all supplemental material carries the same license as the article it is associated with.
For non-Open Access articles published, all supplemental material carries a non-exclusive license, and permission requests for re-use of supplemental material or any part of supplemental material shall be sent directly to the copyright owner as specified in the copyright notice associated with the article.