
Abstract
Covariate adjustment via a regression approach is known to increase the precision of statistical inference when fixed trial designs are employed in randomized controlled studies. When an adaptive multi-arm design is employed with the ability to select treatments, it is unclear how covariate adjustment affects various aspects of the study. Consider the design framework that relies on pre-specified treatment selection rule(s) and a combination test approach for hypothesis testing. It is our primary goal to evaluate the impact of covariate adjustment on adaptive multi-arm designs with treatment selection. Our secondary goal is to show how the Uniformly Minimum Variance Conditionally Unbiased Estimator can be extended to account for covariate adjustment analytically. We find that adjustment with different sets of covariates can lead to different treatment selection outcomes and hence probabilities of rejecting hypotheses. Nevertheless, we do not see any negative impact on the control of the familywise error rate when covariates are included in the analysis model. When adjusting for covariates that are moderately or highly correlated with the outcome, we see various benefits to the analysis of the design. Conversely, there is negligible impact when including covariates that are uncorrelated with the outcome. Overall, pre-specification of covariate adjustment is recommended for the analysis of adaptive multi-arm design with treatment selection. Having the statistical analysis plan in place prior to the interim and final analyses is crucial, especially when a non-collapsible measure of treatment effect is considered in the trial.
Introduction
For some clinical areas, such as mental health and infectious diseases, there are many candidate interventions available. A key goal of an evaluation programme is to identify interventions that are beneficial to patients from the set of candidates. One way to achieve this goal is to conduct experiments through the different phases of clinical trials. A multi-arm design with many-to-one comparisons, i.e., comparing each candidate intervention with a control treatment, is one option for phase II and III studies. It is more efficient than conducting separate two-arm parallel trials on the same set of candidate interventions, since only a single control arm is recruited in a multi-arm trial.
Design adaptations have been proposed to further improve the efficiency of a multi-arm design based on accruing data collected during a study. The idea is known as an adaptive multi-arm design, which has at least one interim analysis, and the design structure can be considered as having multiple stages that are defined by the timing of interim analyses.1,2 For example, the features of adding and dropping arms reduce the duration of the evaluation process,3,4 and adaptive randomization can optimise a utility function that is of interest to stakeholders.5–7 The focus of this work is on the adaptation that achieves the “screening” (or treatment selection) goal with randomization probabilities being fixed in advance by design. Hereafter we use ‘adaptive multi-arm design’ (AMAD) to denote a multi-arm design that contains the pre-planned opportunity for such an adaptation.
Broadly, there are different types of design and inferential frameworks for AMADs.8,9 One framework is an extension of two-arm group-sequential designs where the rejection boundaries for early stopping (via hypothesis tests) are computed at the study planning stage.10–13 Another framework requires the pre-specification of rule(s) for treatment selection at the planning stage, and utilises a flexible testing approach for the final inference, such as the combination test approach14–17 or the error spending approach. 18 Depending on the study context, AMADs have been known as drop-the-loser designs, pick the winner designs, multi-arm screening trials and adaptive seamless phase II/III designs.8,19–22 In any case, data collected from each stage is used in the final inference about the selected intervention(s); the inferential approach under each framework ensures that the family-wise error rate (FWER) is controlled at the desired level. The FWER is defined as the probability of falsely rejecting at least one null hypothesis, which is a generalisation of the type I error rate that is often controlled in two-arm designs.
Most of the existing literature about AMADs focuses on the operating characteristics of the design when different testing procedures are used.23,24 Some have also focused on the estimation of treatment effects 25–31 and confidence intervals, 32 respectively, in the absence of covariates. This is because the standard estimation procedures that have been used in fixed designs may fail to have good properties (e.g. in terms of bias or coverage) when an AMAD is implemented.
One key feature of AMADs that has not been explored in the literature is the role of covariates in the design and analysis of such trials. In studies using fixed designs, i.e., non-adaptive designs, it is well-known that covariate adjustment increases the precision of the inference.33–37 To the best of our knowledge, only the work by Jaki and Magirr 38 has briefly touched on the topic of covariate adjustment in the context of AMADs, but the work is based on the framework of group sequential designs. There are some publications that consider the role of covariates when other types of adaptation are implemented, such as the blinded sample size re-estimation method,39,40 the standard group-sequential design, 41 and adaptive randomization. 42 In this paper, we aim to fill this gap in the literature and explore the impact of covariate adjustment in AMADs with treatment selection. We show how covariate adjustment affects treatment selection rules, hypothesis testing and power, as well as the estimation of the treatment effects. For the latter, we derive the Uniformly Minimum Variance Conditionally Unbiased Estimator to account for covariate adjustment analytically. In addition, when the interest is in the odds ratios for binary endpoint, or the hazard ratios for time-to-event endpoint, it is often overlooked by researchers that covariate adjustment plays an important role in the definition of the estimand of interest. We evaluate the impact of covariate adjustments by simulation when a collapsible measure of treatment effect is considered for a continuous endpoint and revisit the concept of non-collapsiblity, emphasising the importance of considering conditional or unconditional treatment effects in the context of AMADs.
This paper is organised as follows. In Section 2, we present the design and the analysis of AMADs. In Section 3, we illustrate the treatment effect estimates following a linear regression model. In Section 4, we present a simulation study to examine the role of covariate adjustment in treatment selection and in the final inference. A case illustration based on the INHANCE study 43 is then provided to depict the application of an AMAD framework. In Section 5, we discuss the issue when the odds ratio and hazard ratio are considered as the primary descriptive statistics in AMADs. In Section 6, we emphasise the practical aspects of implementing AMADs and give some concluding remarks.
Design and inference
Consider a two stage setting, i.e., where there is one interim analysis for treatment selection in an AMAD. We describe the treatment selection rule, hypothesis testing approach and the procedure for identifying the required total sample size. We present the standard estimators for a treatment effect as well as confidence intervals, noting that both of these may not be compatible with the testing framework due to the complexity in combining the stage-wise data in the testing framework.
Treatment selection rule of AMAD
In general, an AMAD has
Hypothesis testing and sample size
When there are more than one primary research comparisons, the control of FWER is often required by regulators.45–47 A statistical framework to control for the FWER is required for an AMAD, since it is designed to screen multiple interventions at stage one (in a pre-defined way) and to test many-to-one comparisons at the end of the study (when more than one intervention is selected). Here we describe the combination test approach briefly. It is a flexible approach in the sense that other adaptations are allowed at interim analysis. For example, when the threshold rule is considered the number of selected interventions given stage one data is not known in advance; resources can be reallocated accordingly without inflating the FWER when the combination test approach is used in the final inference. This is the approach considered in the asd R package, 44 which can be used to conduct simulation studies for AMADs, but in the absence of covariates.
Let
For superiority studies, the global null hypothesis in a multi-arm setting is
When the design of a study is modified at interim analyses, a combination test can be applied to ensure that the FWER is controlled at the required level by combining the stage-wise p-values via a pre-specified function.
14
For example, a Fisher’s combination test considers the product of the stage-wise p-values, whereas the weighted inverse normal method considers the summation of the weighted stage-wise p-values. When there is only one research comparison in a study, the stage-wise p-values from the standard Z-test or t-test are computed using the corresponding stage-wise data. The combined value is then compared with the
In AMADs, some of the interventions do not continue to stage two of the study. For the comparison involving these interventions, only stage one data is available for the corresponding hypothesis test. In this context, the control of the FWER in the strong sense might be desirable, i.e., ensure that the probability of falsely rejecting at least one null hypothesis is less than the
More specifically, the combination test is used to test
For the power of an AMAD, different definitions can be considered when more than one intervention can be selected to continue to stage two. 49 For example, conjunctive power is the probability of detecting all effective interventions whereas disjunctive power is the probability of detecting at least one effective intervention. Having specified the power, the choice of the combination test function and the testing procedures, one can conduct a simulation study to identify the required sample size under the (global) alternative hypothesis in an iterative manner.
One approach is to vary the sample size per arm per stage, while another is to vary the overall sample size until the required power is obtained. Note that when the number of interventions to be selected to continue is not specified by the selection rule, the overall sample size of the former approach varies considerably across the trial replications. This may create uncertainty in costing if one does not plan to cover the maximum overall sample size. When the latter approach is considered, one needs to specify the total sample size per-stage in the simulation setting. In this case, when the stage-one total sample size is small (relative to the stage-two total sample size), the chance of selecting the truly effective interventions might be lower than the setting where the stage-one total sample size is larger. However, the latter setting can mean more subjects are unnecessarily exposed to the ineffective interventions when only a small subset of interventions are truly effective.
Having identified the required sample size for a given (global) alternative hypothesis, one can conduct a sensitivity analysis to examine the operating characteristics of an AMAD at the design stage. For example, one can vary the parameter configurations of treatment effects in the data generating mechanism (DGM) of the simulation to mimic other plausible scenarios. This will indicate how much power is gained or lost when the global alternative hypothesis does not hold.
Point estimation and confidence intervals
Estimating the treatment effects for AMADs is an additional important consideration, and one that has received relatively little attention in the literature compared with error rate control in hypothesis testing.
31
A standard approach is to fit a regression model for the outcome/endpoint on the treatment group as well as the covariates of interest. The conventional point estimate of the treatment effect
In general, given a selection rule based on the stage one data, the estimators
As for the construction of confidence intervals at the end of the trial, for many commonly-used regression models, the joint distribution of the estimated regression coefficients
Normal endpoint with baseline covariate adjustment
We illustrate the estimators and their properties when baseline covariate adjustment is made in AMADs.
Regression models
Consider a normally distributed endpoint,
To analyse the data at the end of the trial, one can fit the following linear regression model
Note that setting

The conventional point estimator at the end of the trial for the mean treatment effect of intervention
To derive an alternative unbiased estimator that utilises all of the trial data, the distributions of the stage-wise estimators

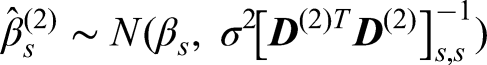
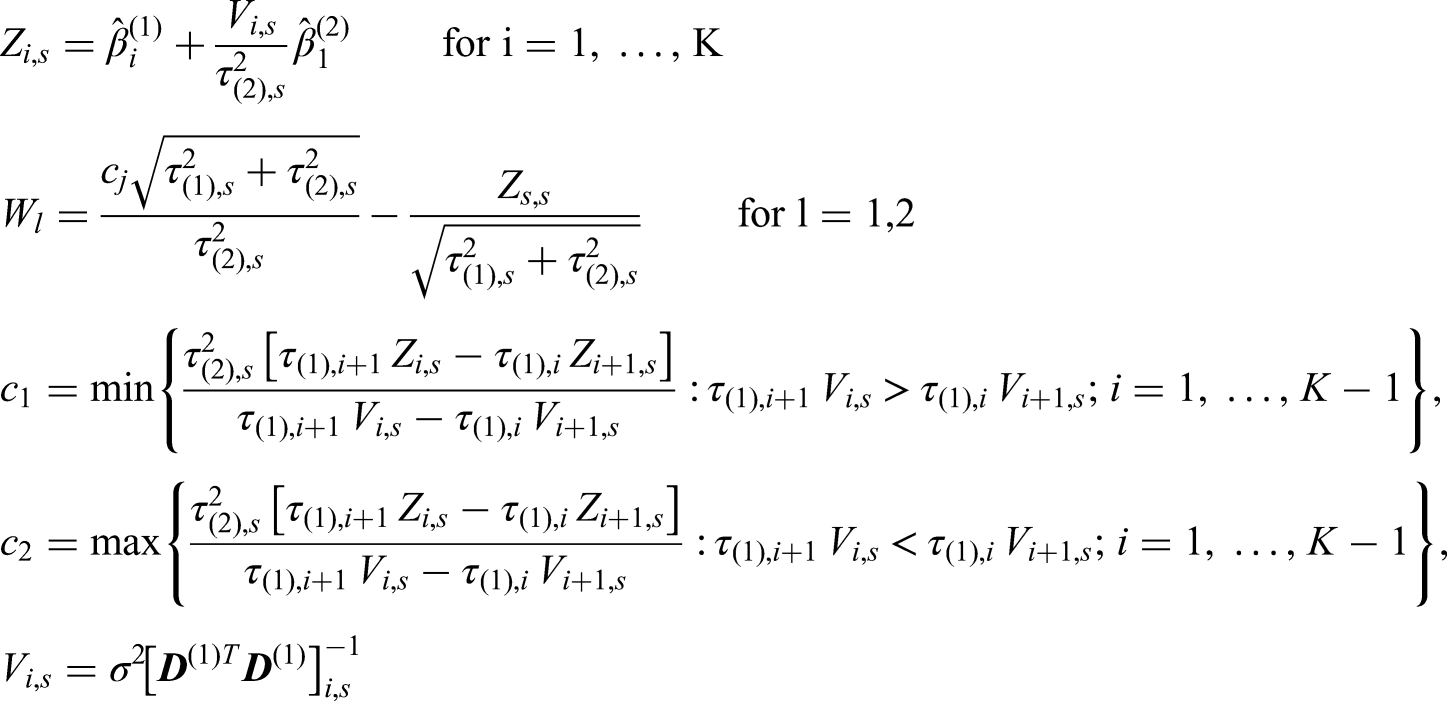
The UMVCUE for a treatment effect
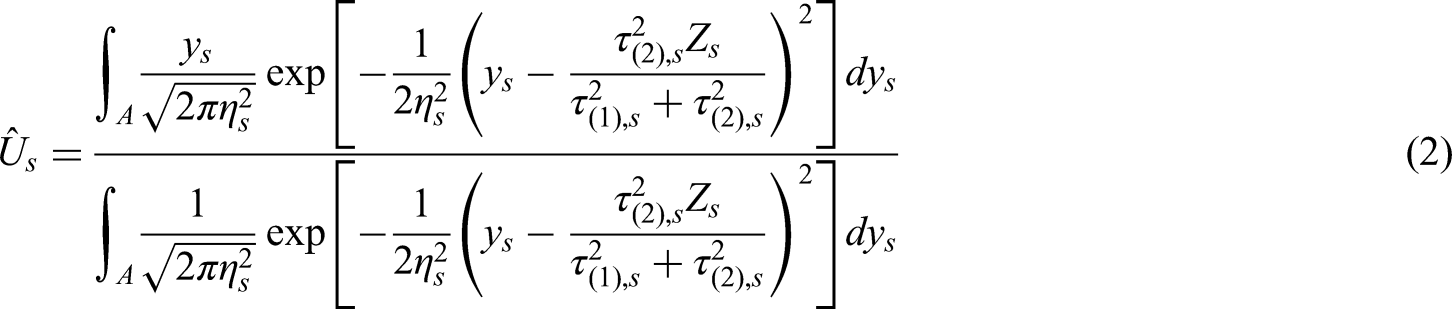
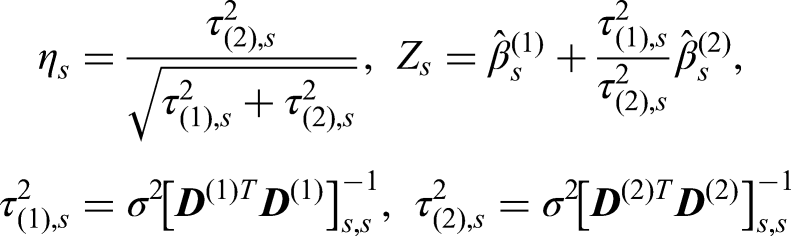
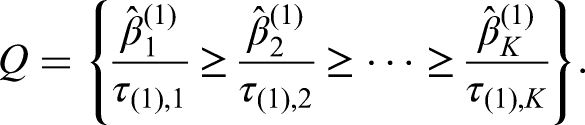
As an explicit example, consider selection rules based on ranking the treatments by their

Following the above example of a selection rule where the seemingly best intervention is selected at interim analysis, we explore the impact of covariate adjustment on several aspects of an AMAD with a simulation study. Note that the total number of patients in this two-stage AMAD is
We describe the background of our simulation study and some performance measures. We look at the simulation results that cover the treatment selection characteristics of AMADs and the analysis perspective when different sets of covariates are considered in the modelling approach. For each simulation scenario, which consists of a data generating mechanism (DGM) under a specific parameter configuration for the treatment effects, we conducted 100,000 trial replications using R version 4.0.5. 54 An example R script is available in the supplemental material.
Simulation settings and performance measures
Consider a simple example where there is a total of
In terms of the treatment selection rule used, we assume that one intervention
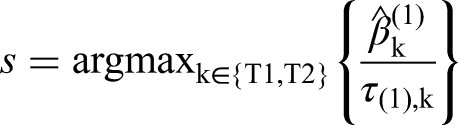
In the simulation, we set
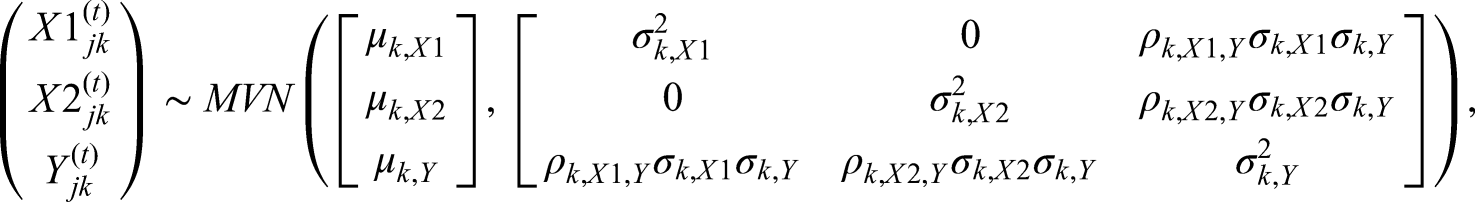
Data generating mechanisms and parameter configuration for treatment effects
Each of the following DGMs are considered in our simulation study:
DGM1: no correlation between the covariates and the outcome, i.e., DGM2: DGM3: both DGM4: Null: the global null configuration that has LFC50: a least-favourable-configuration that has LFC80: a least-favourable-configuration that has STEP50: a stepwise-configuration that has STEP80: a stepwise-configuration that has
For each DGM, we run simulations for scenarios that are defined by the following parameter configuration for
The above numerical examples of effect sizes have been chosen as follows. Since we want to explore the impact of covariate adjustment on the operating characteristics of an AMAD, we fix the total sample size and identify the effect sizes required for a level of power under an alternative hypothesis. More specifically, consider
Comparators: modelling approaches
Since there are two covariates considered in the simulation study, we consider the following modelling approaches for both the interim and final analyses, using the linear model defined by equation (1) in Section 3.1.:
Unadjusted: a linear model for the outcome on the treatment variable only, ignoring the covariate information, i.e., setting Adjusted Adjusted Adjusted
Performance measures
To illustrate the role of covariate adjustment in AMADs, we examine the following performance measures to make comparisons between the analysis approaches under different scenarios in the simulation study.
Regarding the treatment selection operating characteristics of the AMAD, we consider the frequency when one specific treatment is selected over trial replications and the frequency when an adjusted approach selects a different treatment to the unadjusted approach. The former reflects if the AMAD is selecting the truly effective arm(s) correctly based on the interim analysis; a higher frequency of selecting the truly effective arm(s) is desirable. The latter reflects how often an adjusted modelling approach could lead to a different treatment selection outcome to the unadjusted analysis approach. This indicates the disparity of the treatment selection outcome when covariate adjustment is considered in the framework of an AMAD.
For the inferential properties of the AMAD, we evaluate the probability of rejecting (any) one hypothesis and the marginal probability of rejecting a specific hypothesis under the above described scenarios. We look at the standard properties of different estimators following different modelling approaches in terms of the bias and mean squared error (MSE). In what follows, the bias of an estimator
Simulation results
We describe the simulation results by part: i) Frequency of selecting a specific treatment, ii) Probability of rejecting a hypothesis, and iii) Properties of different estimators of the treatment effect.
Frequency of selecting a specific treatment
First consider the treatment selection operating characteristics of the AMAD. For the LFC parameter configurations, it is desirable to select T2 as frequently as possible. When the interim data is such that T1 is selected, that means an incorrect selection has been made and the study will fail to detect a truly effective treatment. For the stepwise-configurations, selecting T1 is not an incorrect selection but it is less desirable than selecting T2 as T2 is more effective than T1. For the null scenario where the interventions have the same effectiveness to the control treatment, it does not matter which intervention is selected when the DGMs have such a parameter configurations. For this reason we exclude the null scenario in this part of the results.
Figure 1 shows the result from our simulation study under some DGMs (column wise) with different parameter configurations for the mean responses (x-axis). The first row of plots shows that when adjusting for correlated covariates, the result of treatment selection can be different to that from the unadjusted approach; this can be as high as 14% of the times when DGM4 with STEP50 is the true scenario, i.e., see Adjusted
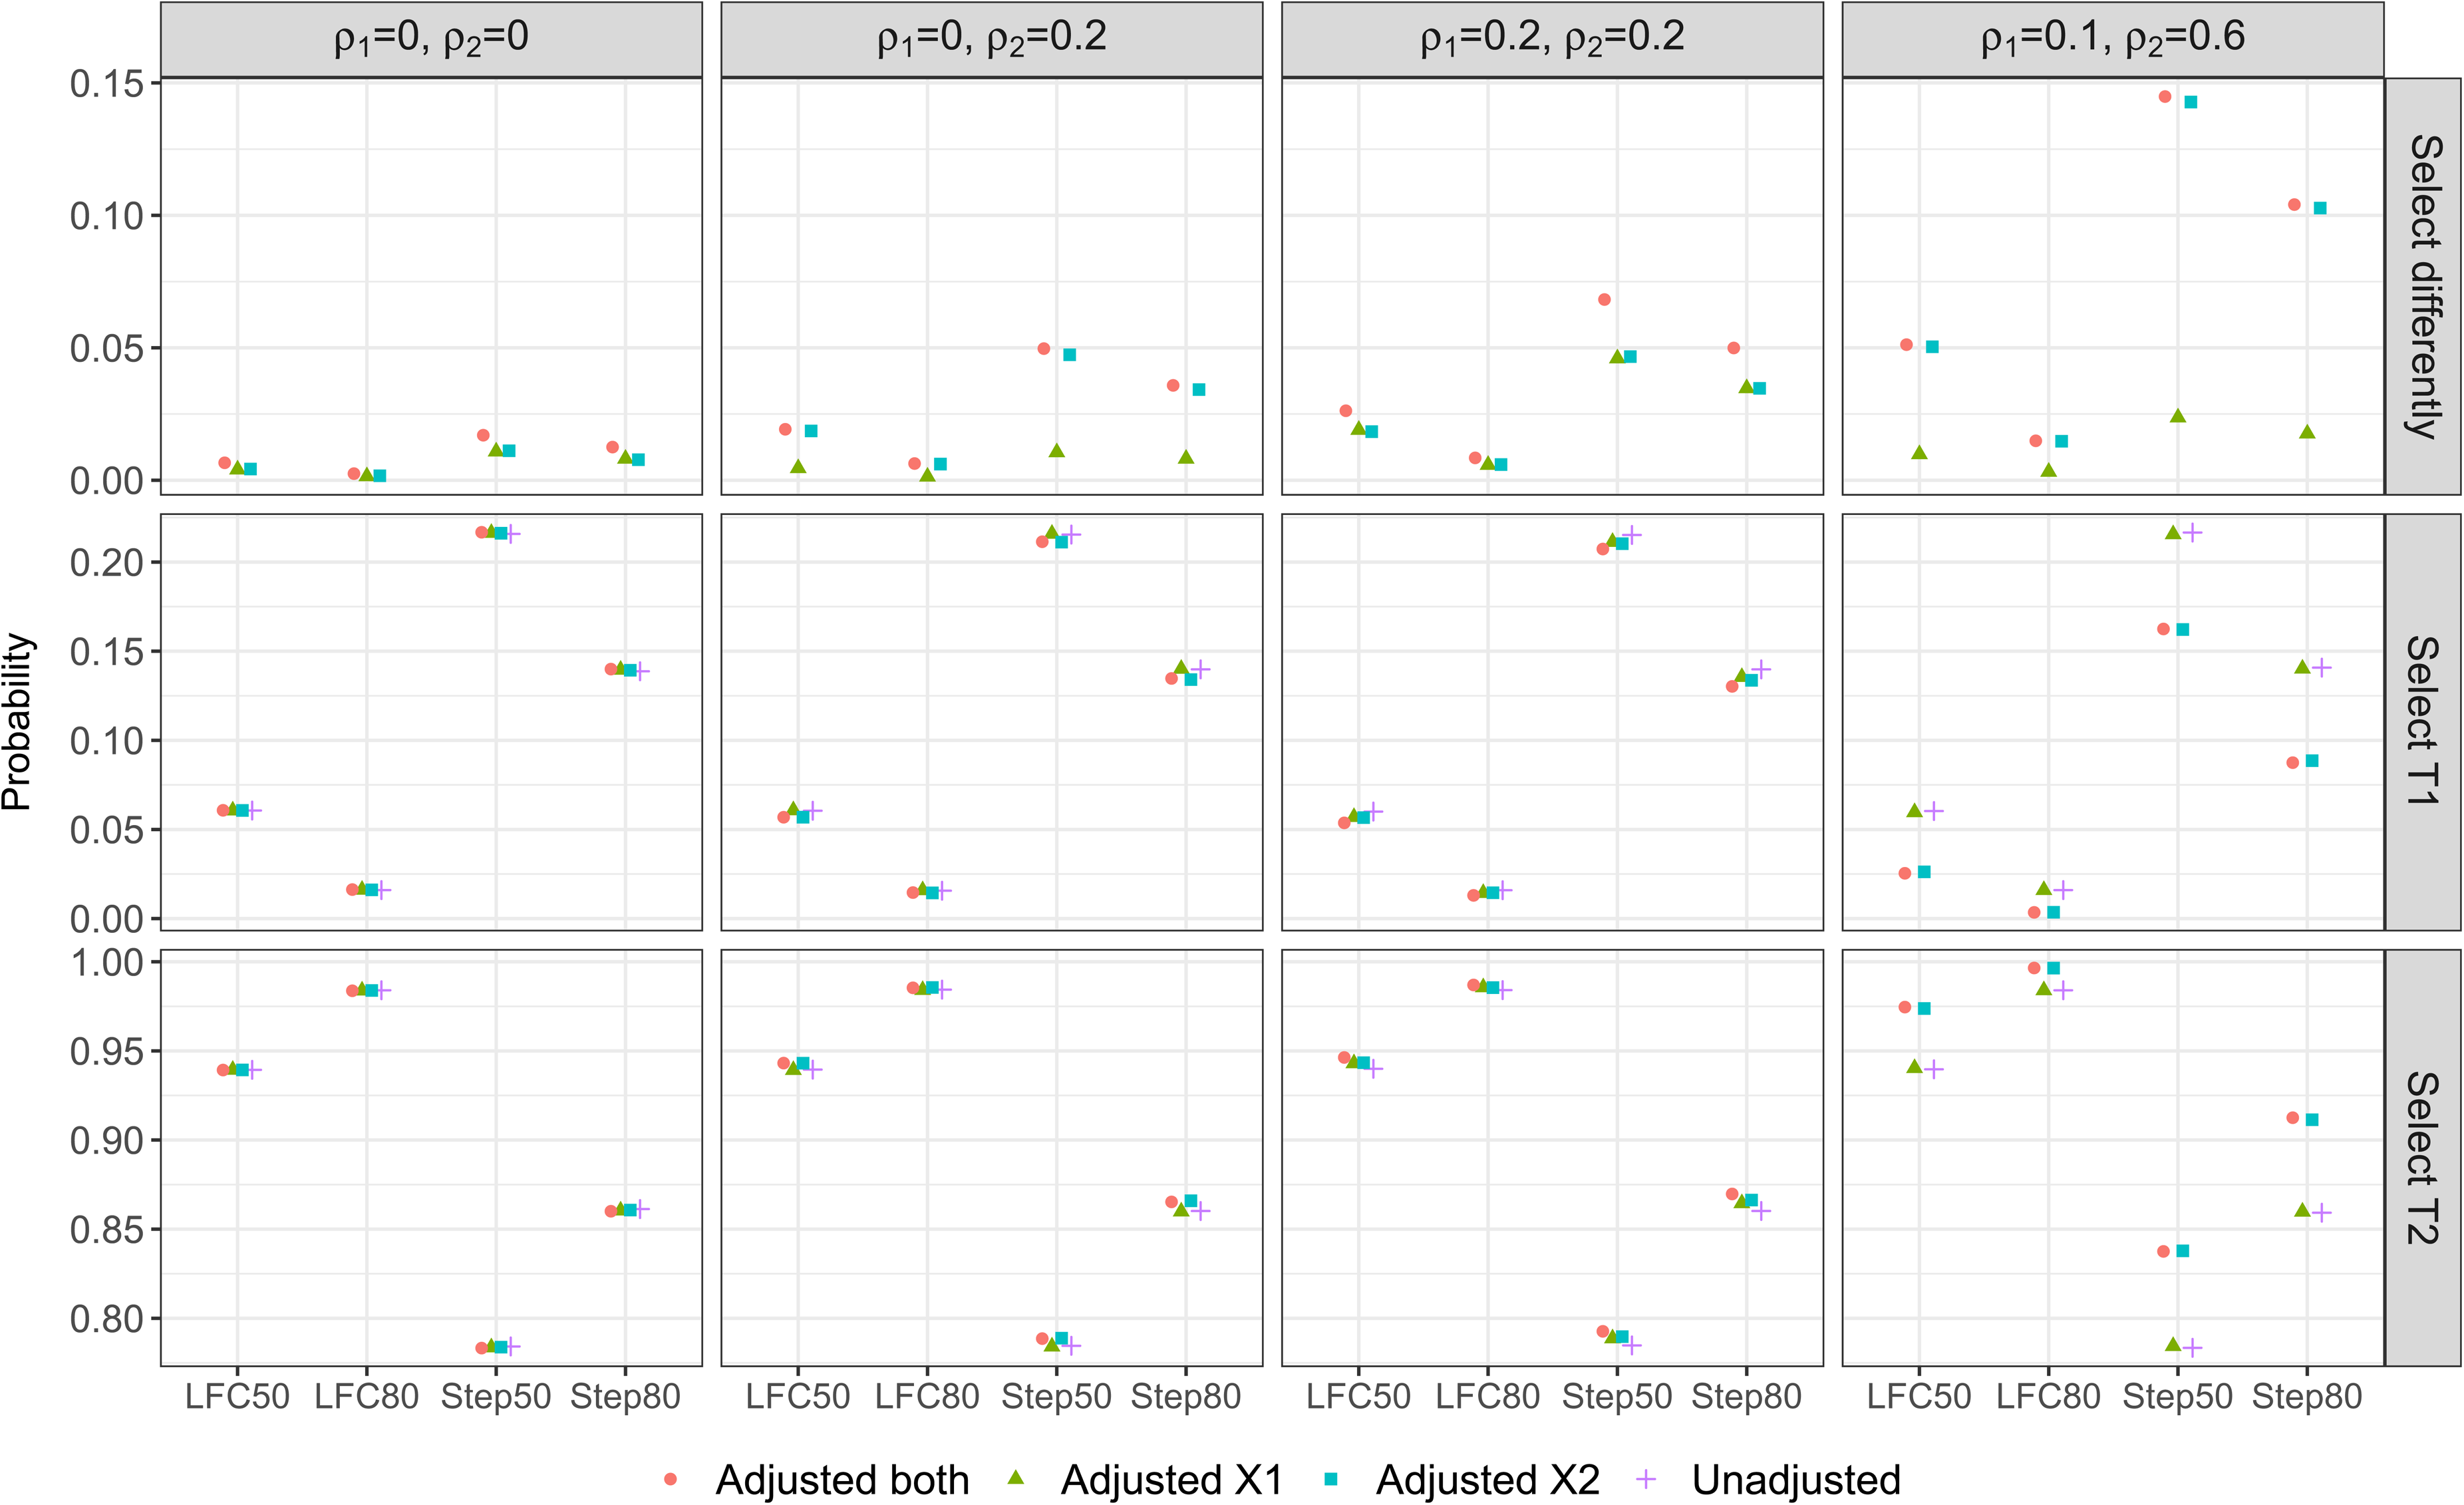
Treatment selection frequency/ probability: when an adjusted approach has a different selection result to the unadjusted approach (first panel), when both an adjusted approach and the unadjusted approach select T1 (second panel), and when both an adjusted approach and the unadjusted approach select T2 (third panel).
The second and third row of plots shows the probability that T1 and T2 are selected, respectively, to continue with the control treatment to the second stage of the study. (The third row is the complement of the second row as probability sums to one.) In general, we find that adjusting for covariates that are truly correlated with the outcome can reduce the probability that T1 is selected and increase the probability that T2 is selected under all the considered non-null scenarios, from the probabilities that are obtained by the unadjusted approach. This is desirable as T2 is the most effective treatment among the three options across the scenarios on the x-axis of Figure 1. See for example Step 80 in the third column of plots for DGM3 where Adjusted
Moreover, we find that adjusting for a highly correlated covariate can lead to a better treatment selection result even when the weakly correlated covariate has been omitted. This is reflected by Adjusted
When the correlations of the covariates are weak, failing to include the covariates in the modelling approaches has little impact on the probability of treatment selection when compared with the desirable approach. This is observed from the unadjusted approach and Adjusted
On the other hand when uncorrelated covariates are mistakenly being included in the model, the probability of one treatment being selected is similar to the approach that has the correct adjustment. For example, the desirable approach for DGM1 is the unadjusted approach, both the plots in column one of Figure 1 show that all the other three approaches have similar performance to the unadjusted approach. Similar finding is observed for Adjusted
In summary, adjusting for covariates that are highly correlated with the outcome leads to a higher chance of selecting the truly best treatment in AMADs, whereas including uncorrelated covariates or omitting weakly correlated covariates has little impact on the selection result when compared with the unadjusted approach. The maximum and minimum of the probabilities of treatment selection and their differences are presented in Table S1 in the supplemental material.
We focus on the results of hypothesis tests for AMADs. Recall that we have two elementary null hypotheses,
Table 1 shows the probability of hypothesis rejections under the null scenario for each combination of DGM and the analysis approaches. Overall we find that covariate adjustment has negligible impact on FWER if there is any: we observed values that are close to 2.5% from our simulation across the analysis approaches, and they lie within the expected 95% confidence interval of the true FWER. The marginal probability of rejecting
Probability of hypothesis rejections under the null scenario for each DGM when each analysis approach is implemented. The Monte-Carlo simulation error for the nominal FWER is
and the 95% confidence interval for the nominal FWER is
.
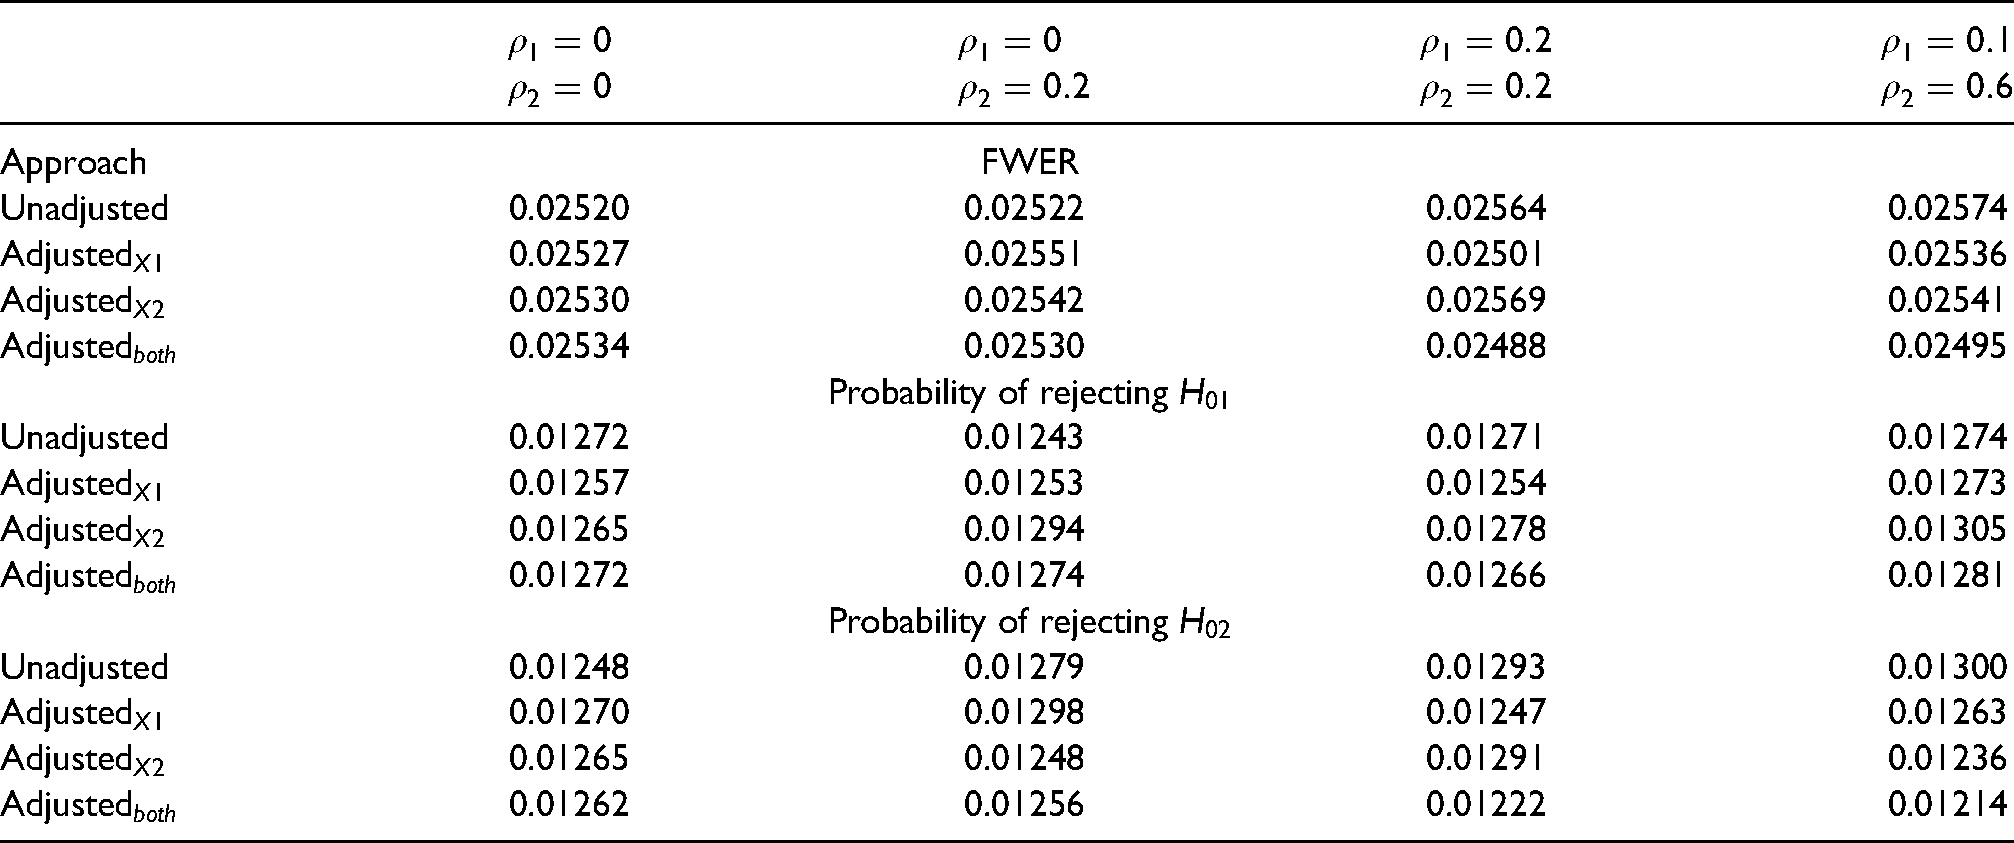
Probability of hypothesis rejections under the null scenario for each DGM when each analysis approach is implemented. The Monte-Carlo simulation error for the nominal FWER is
For the non-null scanarios, Figure 2 shows the unconditional probabilities of hypothesis rejections from our simulation study. First consider the probability of rejecting any one of the hypotheses, i.e., the overall power under the non-null scenarios. We find that accounting for uncorrelated covariates in the final analysis has a negligible impact on the overall power when compared with the unadjusted approach. For example all three adjustment approaches have similar level of power to that of the unadjusted method in the first plot of column one under DGM 1; Adjusted
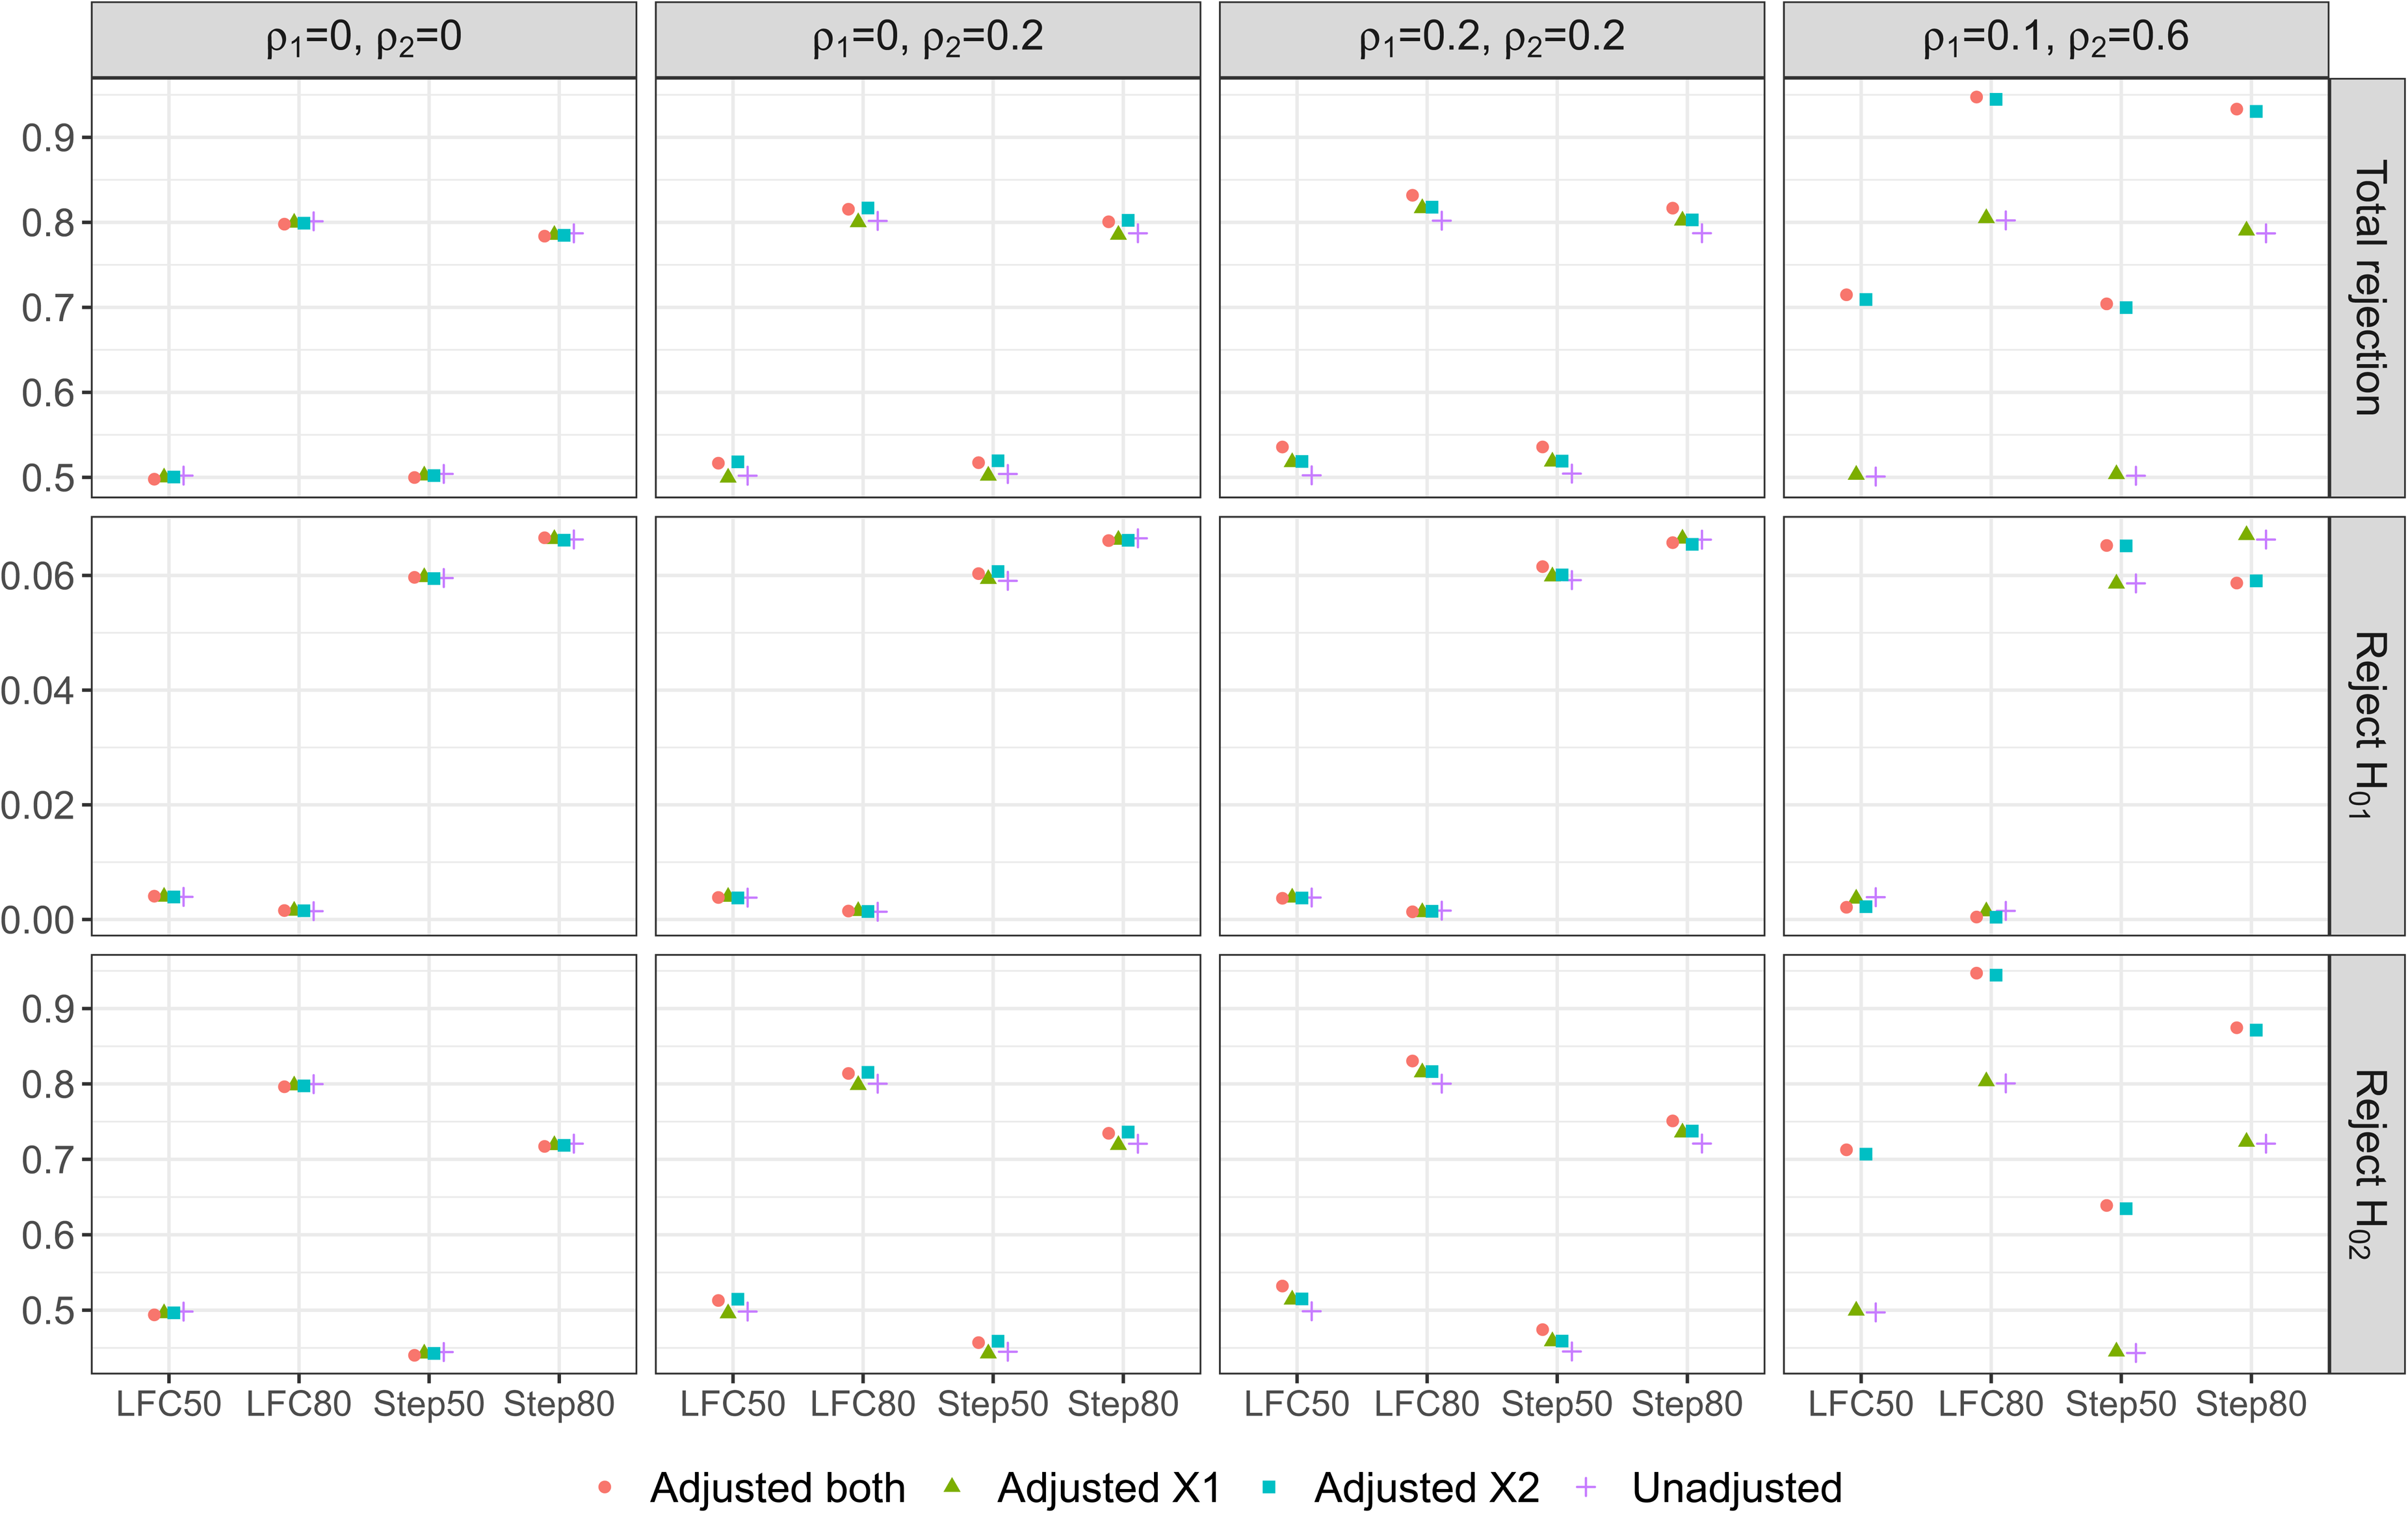
Unconditional rejection probabilities from the two-stage AMAD: when any one hypothesis is rejected (first panel), when
When adjusting for at least one covariate that is correlated with the outcome, we find that the overall power becomes higher than that achieved by the unadjusted approach. This is true even when an approach includes an uncorrelated covariate (to the outcome) in addition to the covariate that is correlated with the outcome; for example, see the first plot in column two of Figure 2 where Adjusted
This highlights the benefit of covariate adjustments on the overall power of AMAD. The increases in the overall power can be as high as 21% under DGM 4 when either Adjusted
Now focus on the probability of rejecting
For Step50 and Step80, the probability of rejecting
Lastly for the marginal probability of rejecting
We consider the properties of the treatment effect estimators described in Section 3.2.. First we focus on the bias and then the MSE of these estimators, as defined in Section 4.1.3.. Figure 3 shows the bias of the stage one and Overall estimators of the treatment effect under the different scenarios for
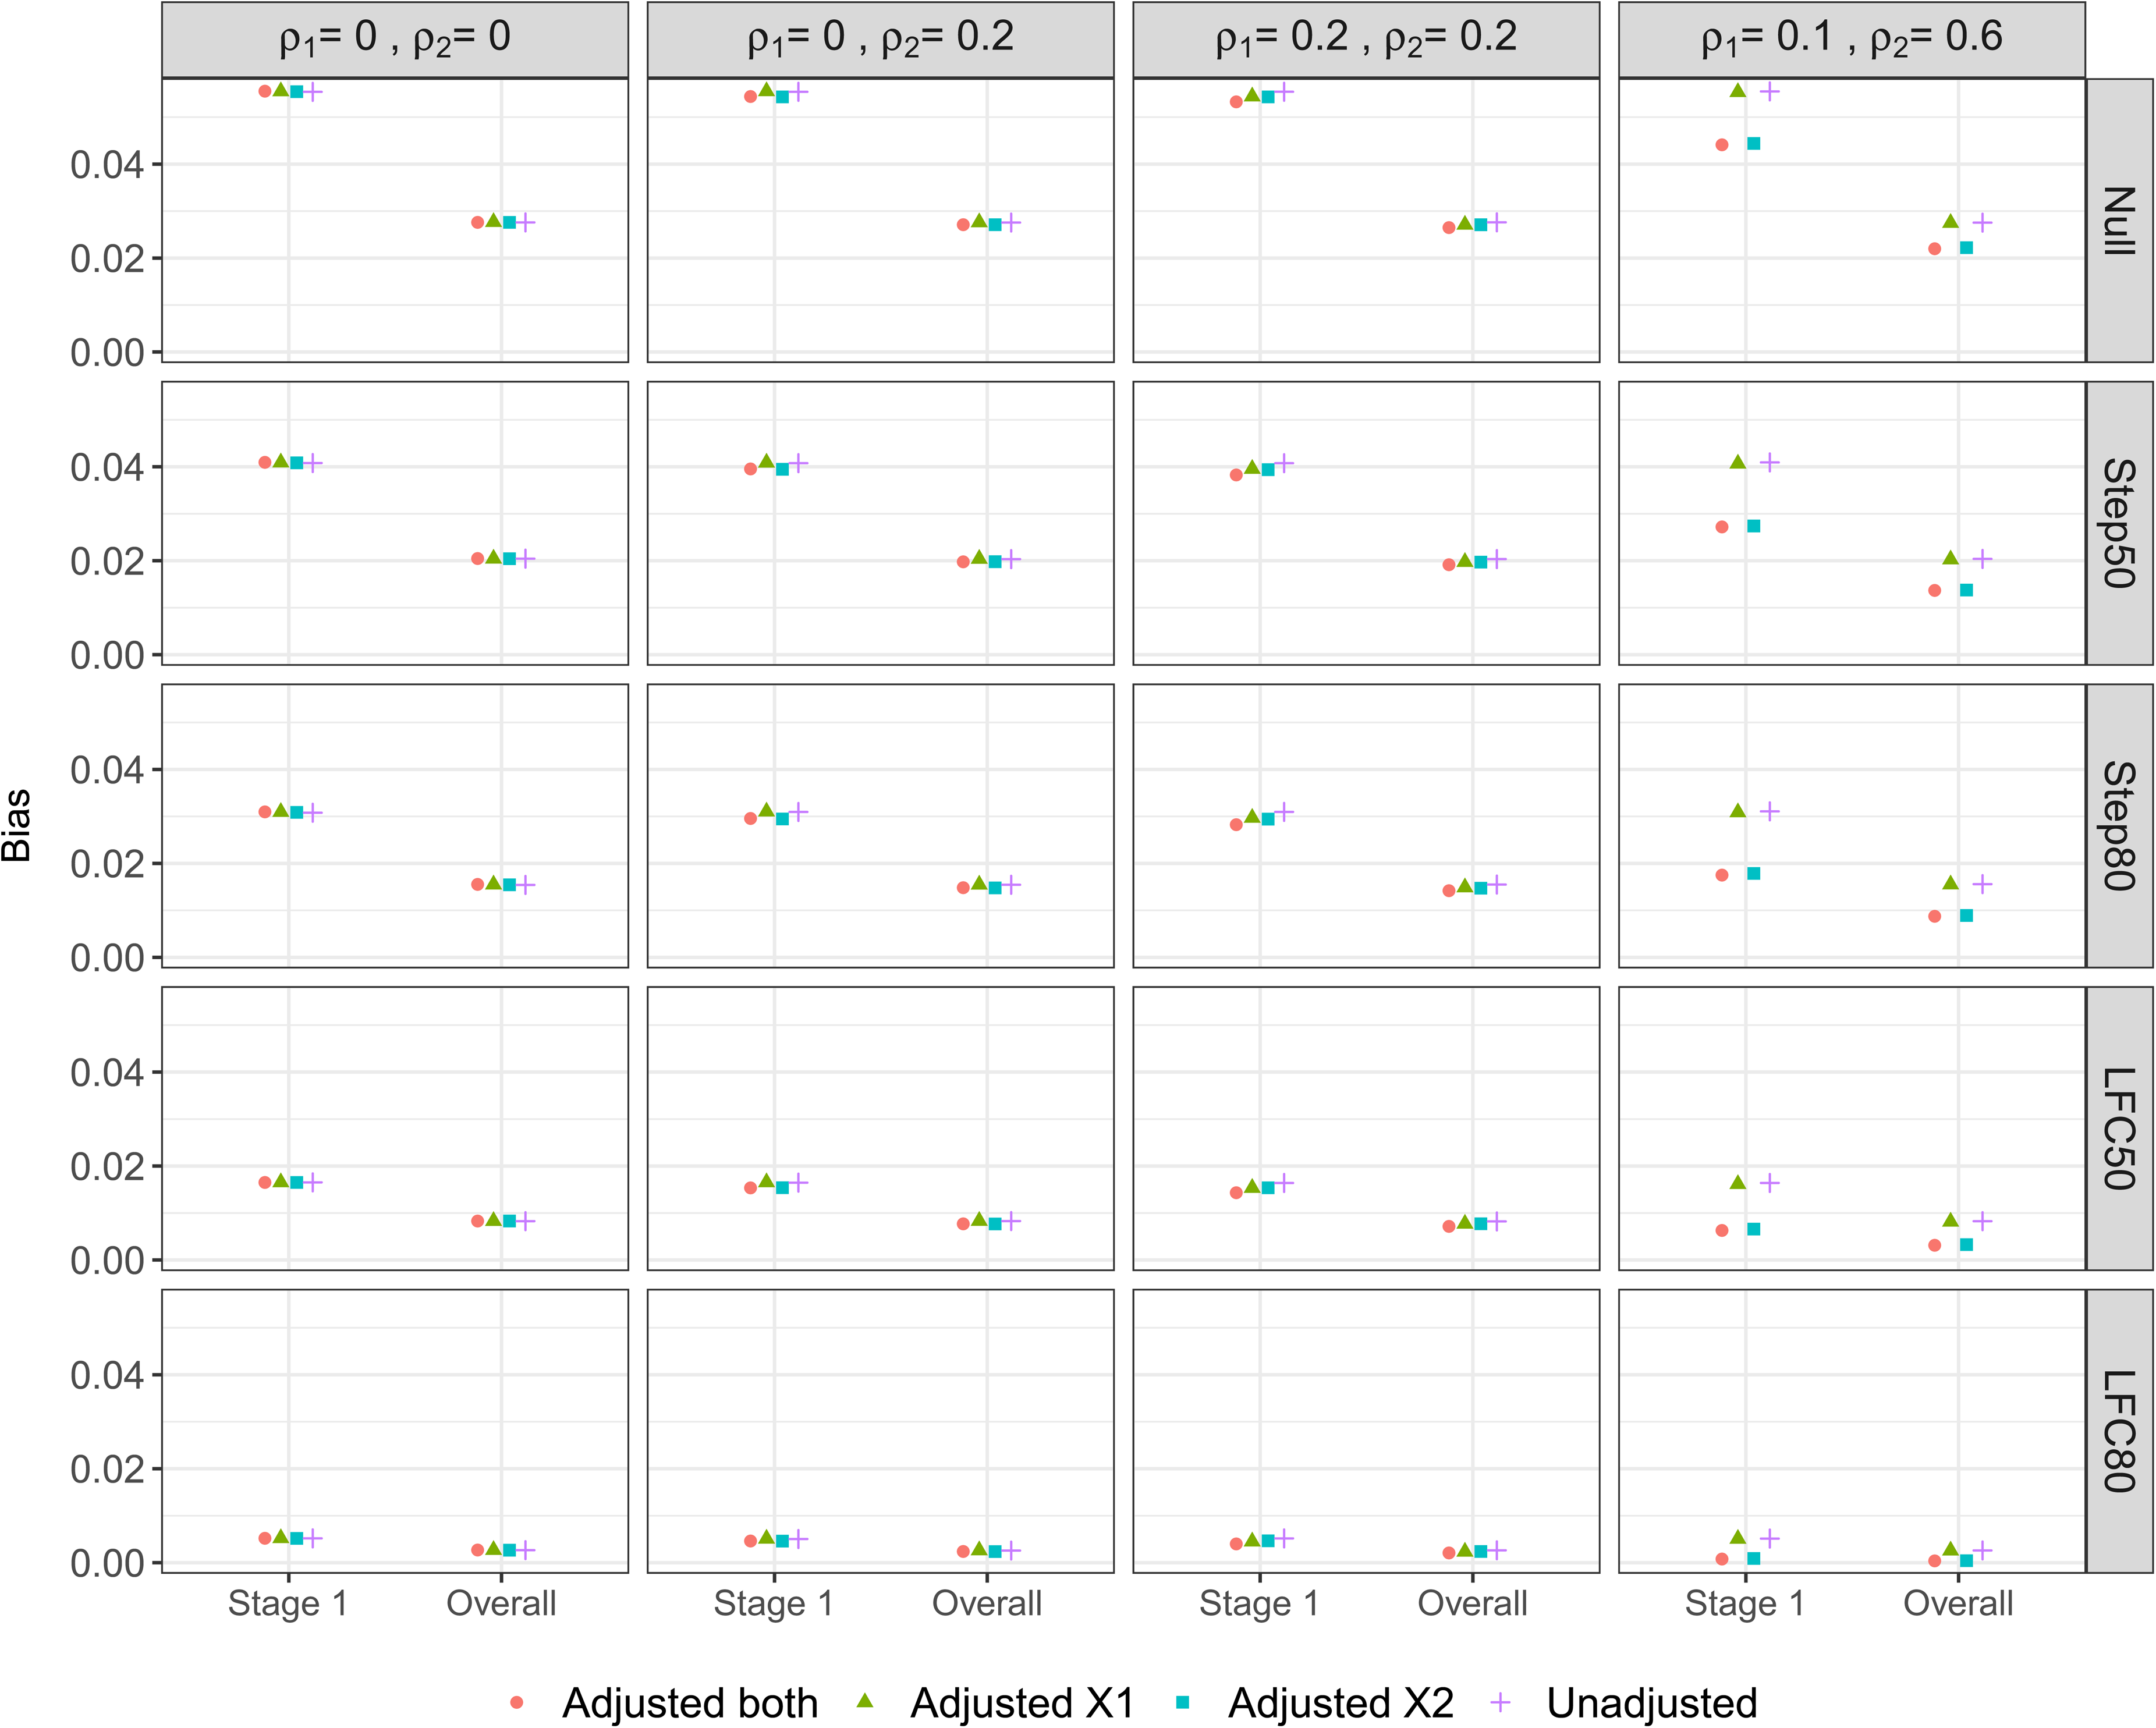
Bias of the Stage one and Overall estimators of the treatment effect.
Looking across the different scenarios, both the Stage one and Overall estimators exhibit a positive bias and the magnitude of this bias has the following ordering (for any given adjustment method): Null > Step50 > Step80 > LFC50 > LFC80. This reflects how the upwards selection pressure is greatest for the Null scenario (since all the treatment effects are identical), which then decreases as the treatment effects become more distinct, i.e. as the difference
Looking now at the different adjustment approaches, when the correlation between the covariates and outcome is zero or low (i.e. under DGMs 1-3), there is minimal difference in the bias of either the Stage one or Overall estimators. In particular, there is no loss in terms of increased bias when adjusting for covariates that are uncorrelated with the outcome (i.e. DGM 1). When there is a moderate correlation between covariate X2 and the outcome (DGM 4), there is a noticeable decrease in the bias when adjusting for X2 (i.e. Adjusted
Figure 4 shows the MSE of the Stage one, Stage two and Overall estimators as well as the UMVCUE. Note that since the Stage two estimator and the UMVCUE are unbiased, the MSE is equal to the mean variance of these estimators. For any given adjustment approach, the MSE of the Stage one and Stage two estimators are virtually identical, and double the MSE of the Overall estimator. As well, the MSE of the Stage one, Stage two and Overall estimators remain virtually identical across the different scenarios for
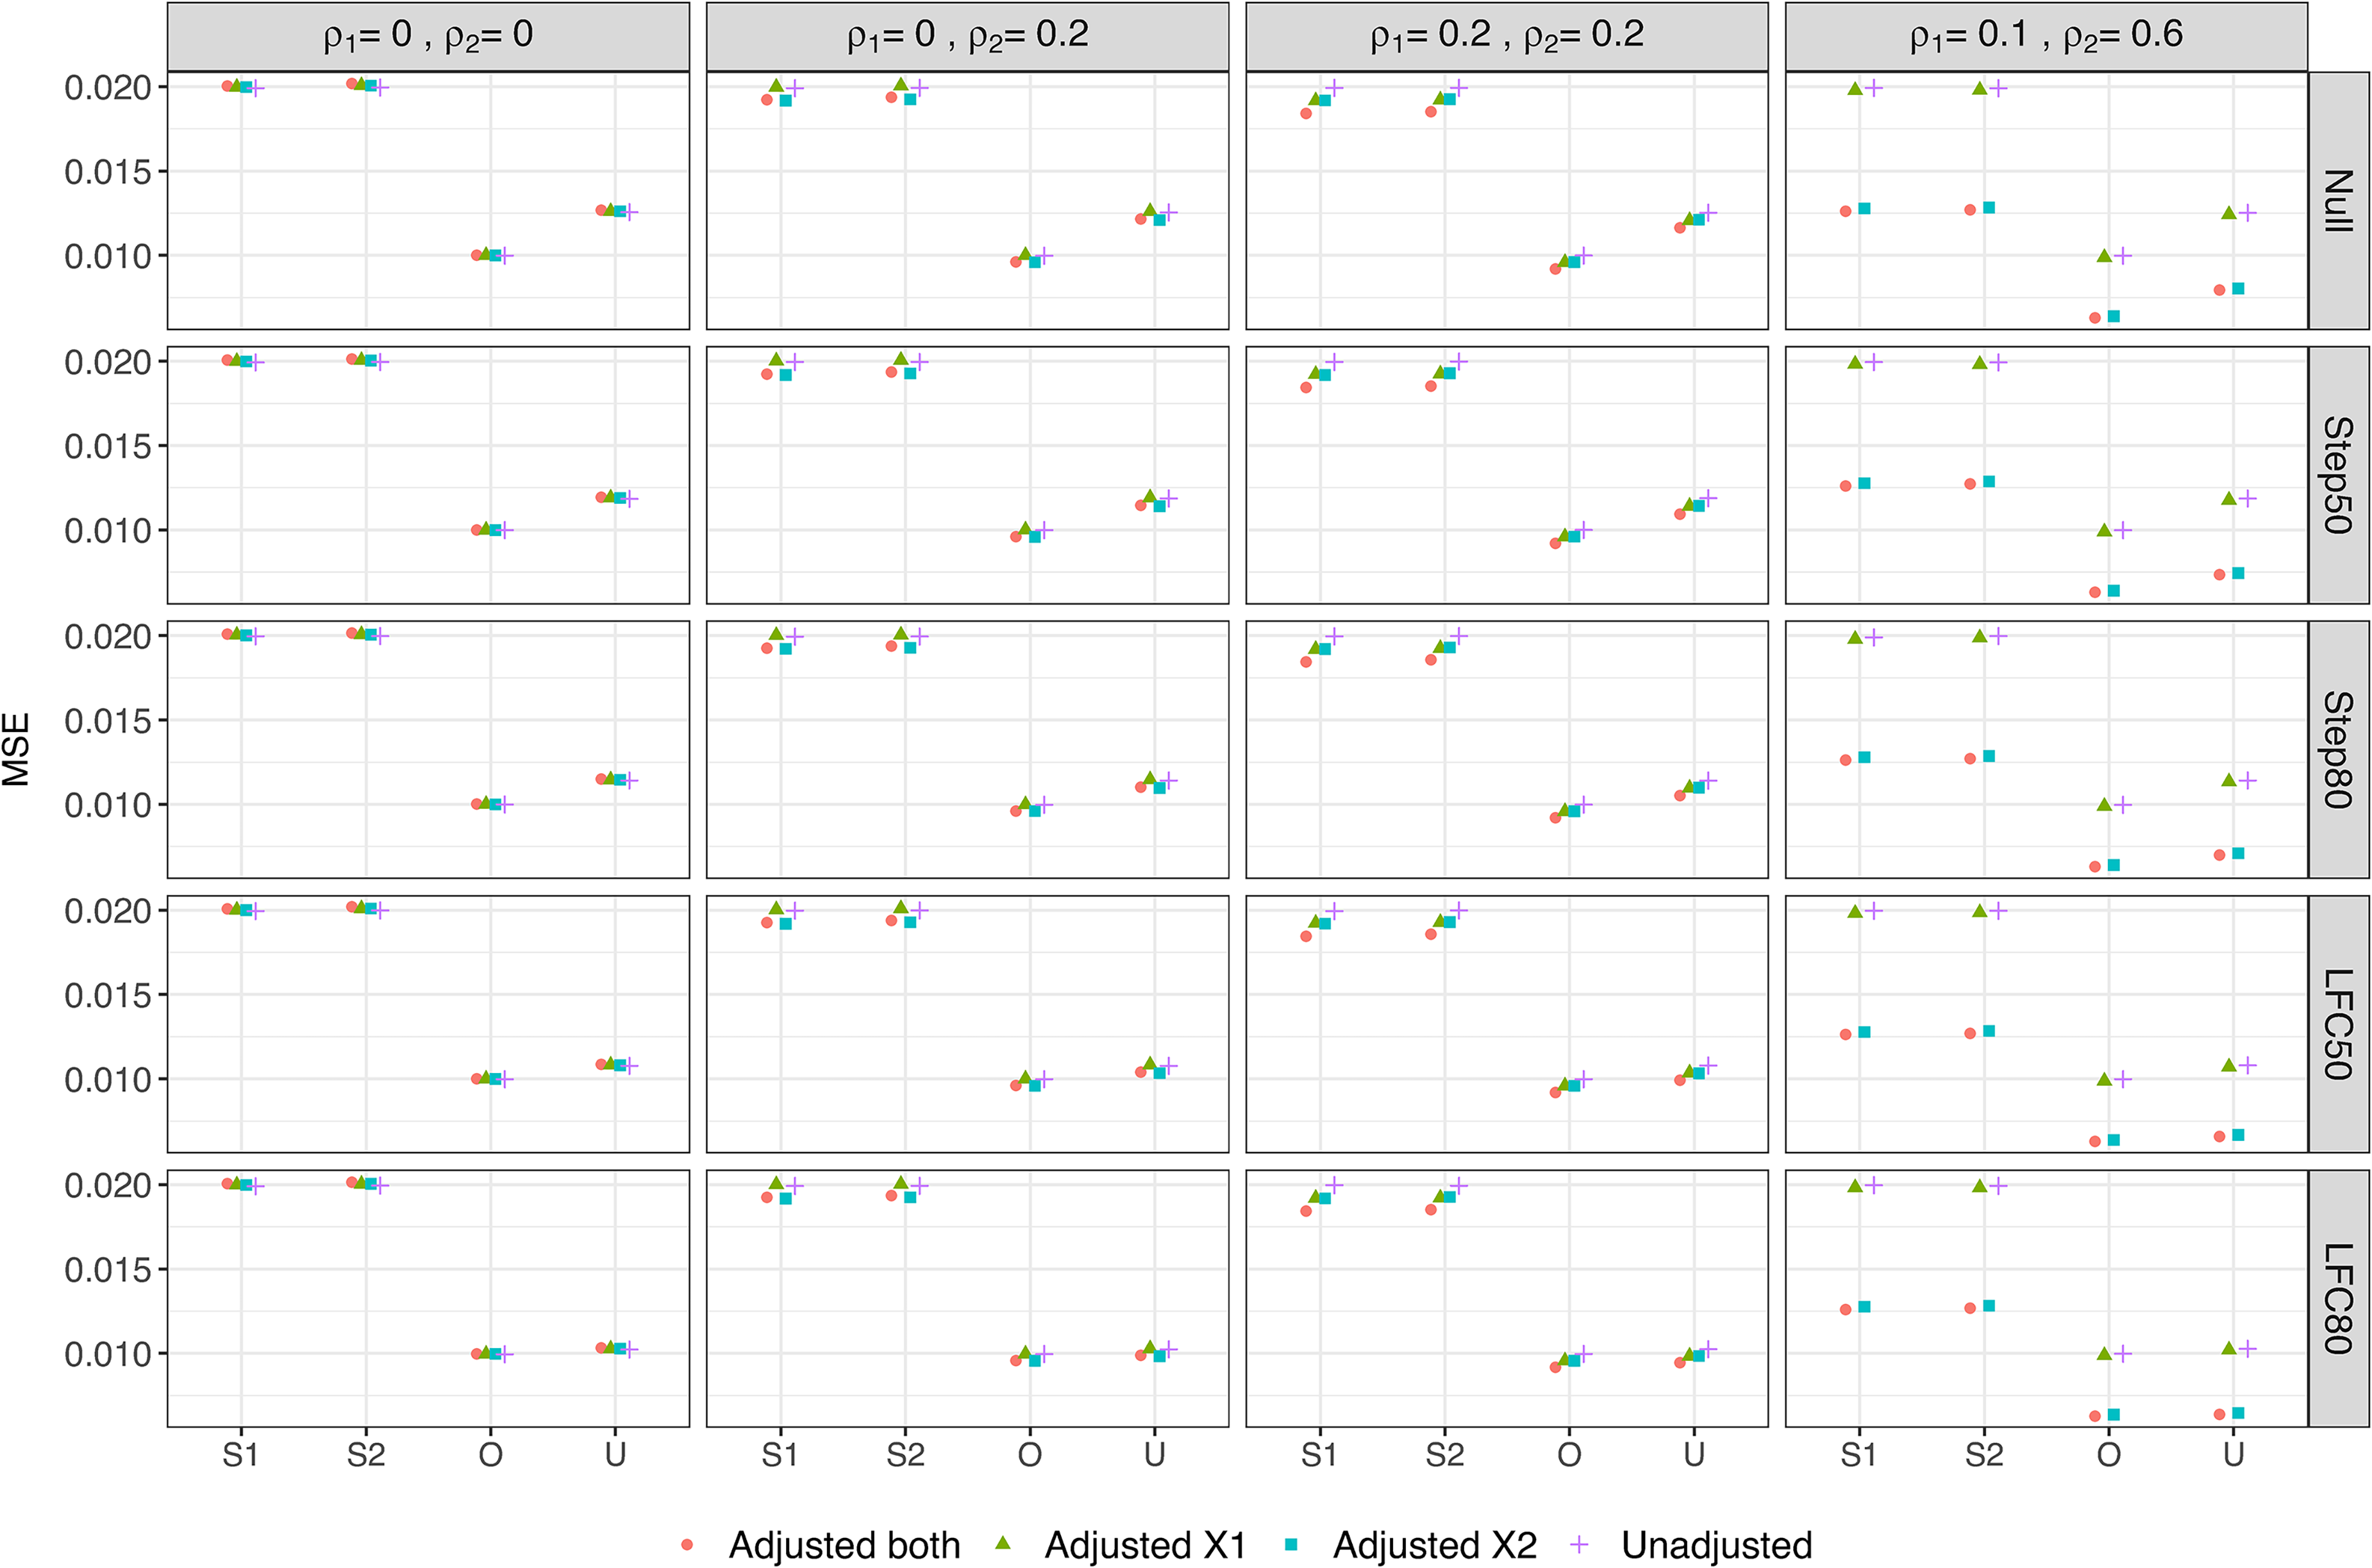
Mean Square Error of various estimators of the treatment effect. S1 = Stage one, S2 = Stage two, O = Overall, U = UMVCUE.
For the UMVCUE, the MSE has the same ordering (for any given adjustment approach) as the ordering for the bias of the Stage one and Overall estimators, i.e. Null > Step50 > Step80 > LFC50 > LFC80. This reflects how the larger adjustments made by the UMVUCE to the Overall estimator in scenarios with a larger bias results in a larger variance and hence MSE. The UMVCUE has a larger MSE than the Overall estimator (up to a maximum increase of 25%, under the null scenario), with the magnitude of this difference having the same ordering as above. Hence the UMVCUE pays the largest price in terms of MSE precisely in the scenarios where the Overall estimator pays the largest price in terms of bias. Reassuringly, when there is little bias in the Overall estimator (e.g. in the LFC80 scenario) then the MSE of the Overall estimator and UMVCUE are virtually identical.
Finally, looking at the different adjustment approaches, when there is no or low correlation between the covariates and outcome, there is little difference in the MSE for a given estimator. In particular, there is no increase in MSE when adjusting for covariates that are uncorrelated with the outcome. When there is a moderate correlation between covariate X2 and the outcome (DGM 4), we observe a noticeable decrease in the MSE when adjusting for X2. For example, the MSE of the Overall estimator decreases by 39% when comparing the Unadjusted analysis with Adjusted
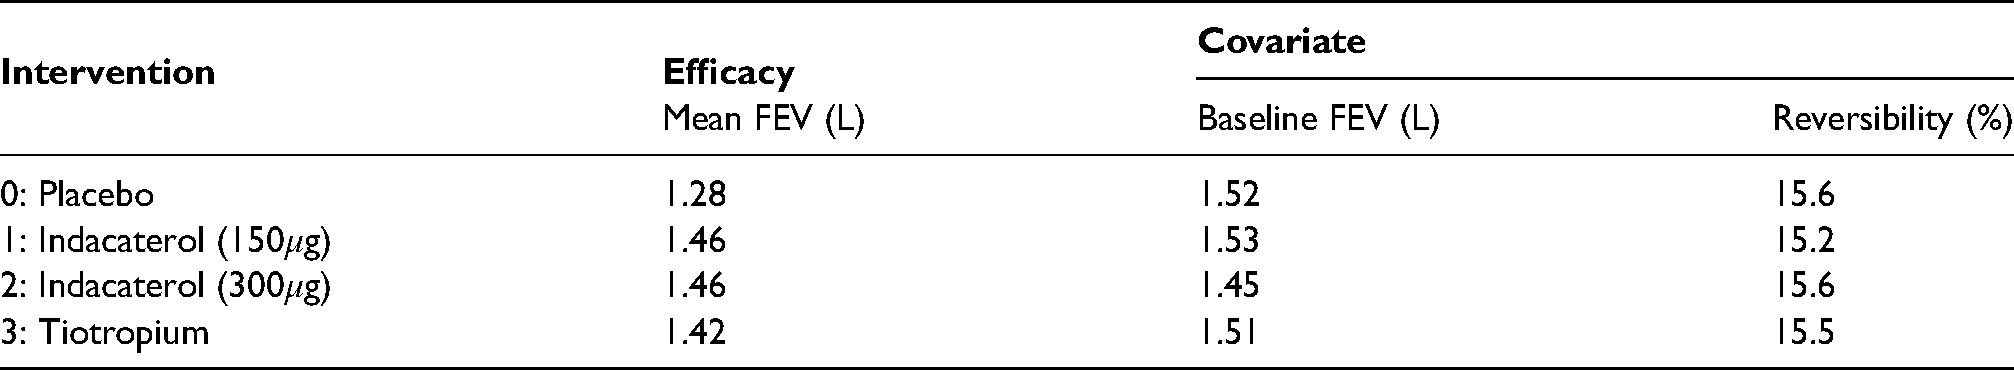
One of the objectives of the INHANCE study was to demonstrate the efficacy of indacaterol (intervention) versus placebo on patients with moderate-to-severe chronic obstructive pulmonary disease.
43
An adaptive seamless phase IIb/ IIIa study design was used to screen six interventions at stage one (with 376 patients randomized to seven arms including the placebo group), and select three interventions to be continued with the placebo group to stage two based on 2-week efficacy and safety data. A total of 1683 patients were randomised to four arms at the second stage of the study: placebo, double-blind indacaterol 150
To illustrate what might happen using the AMAD framework, consider a hypothetical scenario where the placebo and three interventions mentioned above are to be evaluated again using a similar design, but with only two of them selected to continue (together with the placebo) in the subsequent stage. This can be considered as a confirmatory two-stage multi-arm design where a strict control of the FWER is required when one intervention arm is closed at the end of stage one. Here we focus on using the treatment selection rule where the best two interventions would be selected, as opposed to using some pre-defined progression criteria based on the safety and efficacy data. We use the observed efficacy and covariate information (in terms of the means and standard deviations) from the INHANCE study, as given in Table 2 to simulate a realisation of this trial design. For all interventions, the assumed standard deviations of the efficacy endpoint (FEV), baseline FEV and reversibility were 0.375 L, 0.504 L and 16.63%, respectively. For illustration, we used a sample size of
Observed results from the INHANCE study.
Observed results from the INHANCE study.
Table 3 shows the selected interventions and rejected hypotheses under different adjustment methods. We see that under Unadjusted, Adjusted
Selected interventions and rejected hypotheses under different adjusted methods.
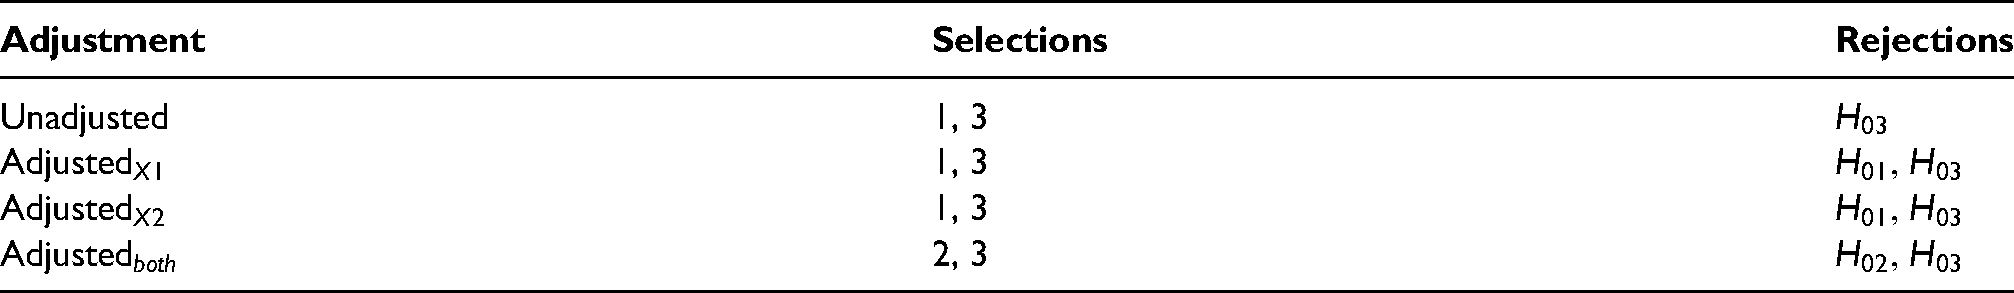
Table 4 gives the values of the various estimators (Stage one, Stage two, Overall and UMVCUE) as well as the standard confidence intervals (Stage one, Stage two, Overall) for the treatment difference of the two selected interventions for each adjustment method. We see that the Overall estimate for intervention 3 is very similar regardless of the adjustment method used. In contrast, the Stage one estimate and UMVCUE are noticeably larger under Unadjusted and Adjusted
Estimates (and standard confidence intervals) for the treatment difference with placebo for the selected interventions under different adjustment methods.
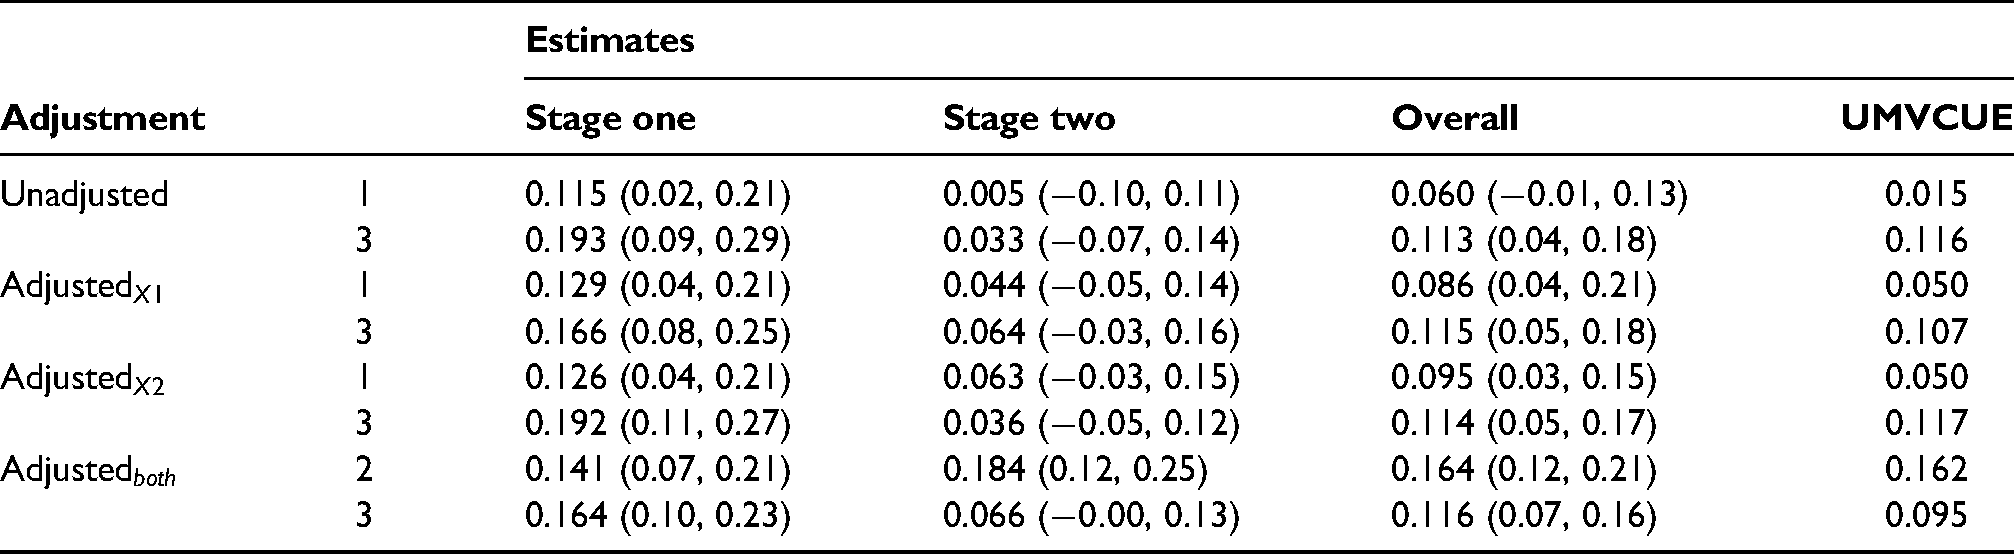
Across all the adjustment methods, the Stage one estimate is substantially larger than the Stage two estimate for interventions 1 and 3, which is particularly noticeable for intervention 3. This reflects the upward selection pressure on the top and second-ranked interventions in Stage one. For interventions 1 and 3, the Overall estimate is approximately halfway between the Stage one and Stage two estimates, while the UMVCUE corrects the Overall estimate towards the unbiased Stage two estimate. Interestingly, this correction is minimal when not adjusting for X1 (i.e under an Unadjusted and Adjusted
For a continuous outcome where the treatment effect measures are normally distributed, we have illustrated that adjusting for covariates can improve the trial operating characteristics and the precision of the estimated treatment effects. For binary and survival outcomes, covariate adjustment requires extra considerations when the main interest is usually in the odds ratio and the hazard ratio. The problem arises because the odds ratio and the hazard ratio are non-collapsible, meaning that the conditional estimand is not equivalent to the marginal estimand of these treatment effect measures. 55 In this section, we briefly revisit the concept of non-collapsibility and highlight the role of covariate adjustment in the context of AMADs.
Recall that a conditional odds ratio (or hazard ratio) describes the effect on the outcome of an individual patient when taking an intervention instead of the control treatment; the marginal odds ratio (or hazard ratio) describes the effect on the outcome of the samples of a target population when they were given the intervention instead of the control treatment. The conditional estimand accounts for the individual patient characteristics or background via the incorporation of the associated covariates in the regression models. On the other hand, the marginal estimand depends on the distribution of the associated covariates implicitly, meaning that the estimate of a marginal odds ratio (or hazard ratio) obtained from a study may not be applicable to other populations that have different characteristics, see for example the illustration in Figure 1 of Groenwold et al. 56 .
The subtlety in the interpretation of the marginal versus conditional odds ratio (or hazard ratio) make them non-comparable with respect to the benefits of covariate adjustment. This is not the case for continuous outcome where the conditional and the marginal estimand are equivalent in nature (but not numerically as obtained from different regression models). Other measures that are collapsible include the absolute risk difference, the relative risk difference, the log odds ratio and the hazard difference in the additive hazards models. The interested reader is referred to Daniel et al. 55 and the references therein for more details about non-collapsibility.
We emphasise that when the odds ratio (or hazard ratio) is used as a measure of treatment effect in a trial, the pre-specification in the statistical analysis plan of which covariates to be included in the analyses (both interim and final) is paramount. One should not make comparisons of treatment effect estimates from analyses with different sets of covariates because the resulting conditional treatment effects convey different information. In the context of AMADs, the same set of covariates should be included in both the treatment selection and the final analyses for the same reason.
The consideration of marginal odds ratio (or hazard ratio) is less useful since the focus of early phase clinical studies often is on the average treatment effect on individual patients, and not the average treatment benefits for the target population. For AMADs, a caveat to using the marginal odds ratio or the marginal hazard ratio for both the treatment selection and the final analyses is that the patient composition may vary across stages. Consequently the stage wise parameter estimates may not be congruent in terms of the applicability of the results to the target population when the distribution of the characteristics of patients recruited in stage one is different to that in stage two.
Nevertheless, one may produce a marginalised-covariate-adjusted odds ratio (or hazard ratio) as supplemental information following the procedure in Daniel et al. 55 . However, it might be less straightforward to produce the UMVCUE for these treatment effect measures using the procedure as the standard deviation of the stage-wise parameters requires approximation by using either the Delta method or bootstrapping.
Discussion
Within a two-stage design, we have evaluated the impact of covariate adjustments on the operating characteristics of AMADs and the properties of treatment effect estimators. More simulation results on trial operating characteristics in the presence of additional six covariates that are uncorrelated with the outcome are presented in the supplemental material. In general, we find that including covariates that are uncorrelated with the outcome has a negligible impact on the treatment selection outcome and the final inference. On the contrary, including covariates that are moderately or highly correlated with the outcome can increase the chance of selecting the truly effective intervention to continue to the second stage of AMADs, increase the study power, and reduce the bias and MSE of estimators of the treatment effect. Moreover, the FWER is controlled at the nominal level when covariates are adjusted via the regression approach. The UMVCUE also has good properties in terms of being unbiased with only a relatively small increase in the MSE compared to the standard overall estimator of the treatment effect.
Our simulation study and the discussion in Section 5 also emphasise the importance of specifying the covariates in advance of the analyses. More specifically, adjusting for different sets of covariates in a single trial replication may lead to different treatment selection outcomes and different results of hypothesis testing. For treatment effect measures that have the inherit property of non-collapsibility, comparing adjusted results of different sets of covariates requires care. This is because extra analysis steps to marginalise the treatment effect estimates are necessary to ensure that the estimates are comparable. To avoid data dredging, having a statistical analysis plan in place prior to any of the data analyses is crucial. Such a practice also maintains the integrity of randomised studies.
Like any other randomized control trials, the sample size calculation of AMADs assuming the absence of covariates at the design stage is an approximation. The gain in power is maximised with covariate adjustment when all other assumptions made in the sample size calculation hold, e.g., dropout rate, the values of the nuisance parameter and the treatment effect under the (global) alternative hypothesis. Alternatively, one may perform simulation studies to identify an appropriate sample size given the information about the distribution of the covariates. This is still an approximation as there are uncertainties in the distributional assumptions.
We note that the benefits from implementing AMADs is affected by the recruitment rate and the length to observe the data that is used for treatment selection. In some health problems where the primary outcome is not available immediately, a surrogate (or a short-term) endpoint that is correlated with the long-term endpoint might be used for treatment selection. This has been one of the active research areas about AMADs.17,57–60 In this case, the probability of selecting the truly effective interventions can vary according to the correlation between the surrogate endpoint and the primary endpoint. When an uncorrelated (or weakly correlated) surrogate endpoint is used, there is a higher chance of selecting the truly ineffective interventions compared to the ideal case where the main outcome on all recruited patients is available for the interim analysis. We have not explored this but hypothesise that the role of covariates adjustment is similar in such a context.
We also have not incorporated randomization procedures in our simulation set-up but have assumed the ideal scenario where patients in each arm are comparable with respect to the baseline characteristics and other unmeasured factors. In practice, covariate imbalance can happen in a randomised trial due to the random nature in treatment allocation. 61 A common practice is to adjust for the variables used in the randomisation procedures, e.g., minimisation, in the final analysis. This can improve the statistical power when the variables are predictive of the outcome. 62 We believe chance imbalance has little impact on our general findings especially when a covariate-adaptive randomization procedure 63 is in place, the stage one sample size of AMADs is not small, and that the analyses adjust for the covariates used in the randomization procedure.
Another limitation of our investigation is that we have considered treatment selection without other adaptations, such as sample size re-estimation and adaptive randomization. We note that when an intervention is not selected to continue to stage two, there is no formal claim about its inference until a formal testing is conducted at the end of the study. The AMAD framework that is based on the group-sequential design accounts for this adaptation in a more direct sense and can include covariate adjusted for some of the commonly used models as shown by Jennison and Turnbull 41 . We have also assumed that there is no missing data in our simulation study. Future work can explore how the missing data approaches may impact on AMADs when some of the covariates and responses are missing at random or missing not at random. Another direction could be exploring the sensitivity of some estimators in the presence of a population drift, especially when there are more than two stages. Note that we also have not provided the confidence interval for the UMVCUE in the case illustration in Section 4.3. This is because there are no established methods to construct valid confidence intervals based on the UMVCUE. More investigation is required to explore the construction of confidence intervals in the presence of covariates.
Supplemental Material
sj-r-1-smm-10.1177_09622802221114544 - Supplemental material for The benefits of covariate adjustment for adaptive multi-arm designs
Supplemental material, sj-R-1-smm-10.1177_09622802221114544 for The benefits of covariate adjustment for adaptive multi-arm designs by Kim May Lee, David S. Robertson, Thomas Jaki and Richard Emsley in Statistical Methods in Medical Research
Supplemental Material
sj-r-2-smm-10.1177_09622802221114544 - Supplemental material for The benefits of covariate adjustment for adaptive multi-arm designs
Supplemental material, sj-R-2-smm-10.1177_09622802221114544 for The benefits of covariate adjustment for adaptive multi-arm designs by Kim May Lee, David S. Robertson, Thomas Jaki and Richard Emsley in Statistical Methods in Medical Research
Footnotes
Acknowledgements
The views expressed are those of the authors and not necessarily those of the NIHR or the Department of Health and Social Care (DHSC).
Author's Note
Thomas Jaki, Faculty of Informatics and Data Science, University of Regensburg, Regensburg, Germany.
Declaration of conflicting interests
The author(s) declared no potential conflicts of interest with respect to the research, authorship, and/or publication of this article.
Funding
This research was supported by the NIHR Maudsley Biomedical Research Centre at South London and Maudsley NHS Foundation Trust and King’s College London, and the NIHR Cambridge Biomedical Research Centre (BRC-1215-20014). RE and KML are supported by the National Institute for Health Research (NIHR Research Professorship, Professor Richard Emsley, NIHR300051). TJ and DSR received funding from the Medical Research Council (MC_UU_00002/14) and DSR also was funded by the Biometrika Trust. For the purpose of open access, the author has applied a Creative Commons Attribution (CC BY) licence to any Author Accepted Manuscript version arising.
Data availability
Code to simulate data and reproduce the results in this paper can be found in the supplemental materials.
Supplemental material
Supplementary material for this article is available online.
References
Supplementary Material
Please find the following supplemental material available below.
For Open Access articles published under a Creative Commons License, all supplemental material carries the same license as the article it is associated with.
For non-Open Access articles published, all supplemental material carries a non-exclusive license, and permission requests for re-use of supplemental material or any part of supplemental material shall be sent directly to the copyright owner as specified in the copyright notice associated with the article.