
Abstract
Inverse probability of censoring weighting is a popular approach to handling dropout in longitudinal studies. However, inverse probability-of-censoring weighted estimators (IPCWEs) can be inefficient and unstable if the weights are estimated by maximum likelihood. To alleviate these problems, calibrated IPCWEs have been proposed, which use calibrated weights that directly optimize covariate balance in finite samples rather than the weights from maximum likelihood. However, the existing calibrated IPCWEs are all based on the unverifiable assumption of sequential ignorability and sensitivity analysis strategies under non-ignorable dropout are lacking. In this paper, we fill this gap by developing an approach to sensitivity analysis for calibrated IPCWEs under non-ignorable dropout. A simple technique is proposed to speed up the computation of bootstrap and jackknife confidence intervals and thus facilitate sensitivity analyses. We evaluate the finite-sample performance of the proposed methods using simulations and apply our methods to data from an international inception cohort study of systemic lupus erythematosus. An R Markdown tutorial to demonstrate the implementation of the proposed methods is provided.
Keywords
1 Introduction
1.1 Inverse probability-of-censoring weighting and covariate balancing weights
Inverse probability-of-censoring weighting (IPCW) is a popular approach to handling the dropout that is ubiquitous in longitudinal studies.1,2 Under the assumption of sequential ignorability, inverse probability-of-censoring weights are usually obtained by specifying a parametric model for the dropout process and estimating its parameters using maximum likelihood estimation (MLE). However, it is well known that inverse probability-of-censoring weighted estimators (IPCWEs) using weights estimated by MLE can be inefficient and unstable, especially when the dropout model is misspecified.3–5
Covariate balancing weight (CBW) methods have been proposed as a way of improving the performance of inverse probability weighted estimators in the setting where the aim is to estimate the causal effect of a binary point treatment (e.g.6–10). Empirical and theoretical studies have shown that CBW methods reduce the mean squared errors (MSEs) of the inverse probability weighted estimators under both correct and incorrect model specifications. 11 Recently, CBW methods have been developed to improve IPCWEs. Han 12 proposes a calibration approach for IPCWEs when the aim is to estimate the mean of an outcome measured at the end of a longitudinal study. The calibration restrictions proposed by him aim to balance, at each follow-up visit, the predicted outcome from each of a set of models for the expected outcome given the history of a set of time-varying covariates. If one of the models for predicting the outcome is correctly specified, the IPCWE using calibrated weights is consistent. To improve the inverse probability weighted estimators in marginal structural models, 1 Yiu and Su proposed to jointly calibrate inverse probability of treatment and censoring weights. 13 They extended the ‘covariate association eliminating weights’ method in Yiu and Su 14 to the ignorable dropout setting and provided a coherent framework for deriving calibration restrictions in longitudinal studies. Unlike the approach of Han 12 , that of Yiu and Su 13 can handle repeatedly measured outcomes.
A limitation of the existing calibrated IPCWEs is that they are based on the unverifiable assumption of sequential ignorability, that is, the assumption that the probability of dropout between any two consecutive visits (say visit
To address the aforementioned limitation, in this paper, we propose a sensitivity analysis approach for calibrated IPCWEs under non-ignorable dropout. Building upon the calibration approach of Yiu and Su, 13 we incorporate a selection function with sensitivity parameters into the model used for estimating an initial set of inverse probability-of-censoring weights before calibration. Then we calibrate these initial weights by balancing the distributions of observed covariates after weighting with the observed covariate distributions in the target population in the absence of dropout. Although confidence intervals (CIs) for our calibrated IPCWEs can be based on nonparametric bootstrap (or jackknife if the sample size is small), it is time-consuming to repeat the whole process for each value of the sensitivity parameter(s) and each bootstrap sample. We therefore propose a simple technique to speed up the computation of the bootstrap/jackknife CIs and evaluate its performance using simulations.
1.2 Motivating example: Cerebrovascular events and health-related quality of life in patients with systemic lupus erythematosus
This work was motivated by a study of the impact of cerebrovascular events (CerVEs) on health-related quality of life (HRQoL) in patients with systemic lupus erythematosus (SLE). 19 Neuropsychiatric (NP) events are frequent in patients with SLE, a chronic autoimmune disease that affects multiple organ systems. CerVEs (e.g. stroke and transient ischaemia) are the fourth most frequent NP event in SLE and are usually attributable to SLE. Regardless of attribution, NP events are associated with a negative impact on HRQoL in both cross-sectional and longitudinal studies. In a recent study conducted by the Systemic Lupus International Collaborating Clinics (SLICC) group, it was found that CerVEs were associated with a significant and sustained reduction in patient self-reported HRQoL even after adjusting for other factors predicting HRQoL. 19 This finding was based on data from the SLICC inception cohort, where 1826 SLE patients were enrolled within 15 months of their SLE diagnosis between October 1999 and December 2011 and followed up annually thereafter at 36 academic medical centres from 12 countries.
The analysis reported in Hanly et al. 19 was based on the generalized estimating equation (GEE) approach with the AR(1) working correlation structure, and the variation in the length of follow-up in the SLICC cohort was not taken into account. In fact, by the study cut-off date of 10 December 2015, the number of annual assessments per patient varied from 1 to 18; the mean follow-up time was 6.6 years and the standard deviation was 4.1 years. Specifically, 46% of the SLICC patients had their latest annual assessment visit more than 2 years before the study cut-off date. These patients may have dropped out of the study. Since the current HRQoL of a patient is likely to be associated with his/her probability of dropping out of the study, there could be non-ignorable missingness in the longitudinal HRQoL data of the SLICC cohort. This motivates us to re-analyze the SLICC HRQoL data, taking into account possibly non-ignorable dropout in this cohort.
2 Methods
2.1 Notation, setting and assumptions
We consider a study in which
Let
For simplicity, in this paper, we focus on linear models for

2.2 Inverse probability-of-censoring weighting under non-ignorable dropout
The first step in our method is to specify the model that will be used to estimate an initial set of inverse probability-of-censoring weights under non-ignorable dropout. In Section 2.3, we shall describe how these initial weights are calibrated.
Let


If

In the SLICC data example, we use
The Newton-Raphson algorithm can be applied to solve (4). Let

2.3 Calibrating inverse probability-of-censoring weights under non-ignorable dropout
The purpose of IPCW is to create a representative sample of the target population (i.e. the study population at baseline) in the absence of dropout. As an alternative to the MLE approach, the calibration approach12,13 aims to create a representative sample of the target population by balancing the distributions of observed covariates after weighting with those in the target population. Specifically, weights are obtained by calibrating/adjusting the initial set of inverse probability-of-censoring weights (i.e. the MLE weights) such that moment conditions of observed covariates (i.e. calibration restrictions) are satisfied in the finite sample.
2.3.1 Calibration restrictions
Let

The restrictions in (6) are equivalent to

Imposing calibration restrictions of baseline and time-varying covariates separately at each follow-up visit will ensure that covariate distributions are exactly balanced such that a representative sample of the target population is created at each follow-up visit. This is important since the parameters of interest are the regression coefficients of time-varying covariates in the outcome model (1). However, the number of restrictions will then be proportional to the number of follow-up visits, which will result in a large number of restrictions if there are many baseline and time-varying covariates. In this case, we recommend including the interactions between
In this paper, we consider calibrated weights of the form

It is easy to see that if we replace

2.3.2 Implementation
The calibrated weights

2.4 Confidence intervals
2.4.1 Bootstrap and jackknife confidence intervals
Whether using the MLE weights or calibrated weights, CIs can be obtained by nonparametric bootstrap. Specifically,
For small samples, jackknife is an alternative to bootstrap for obtaining the variance of the IPCWE and constructing CIs. In particular, jackknife can be useful when there are convergence issues for estimating the MLE weights because the Newton–Raphson algorithm for solving (4) breaks down due to ill-conditioned matrices in a particular bootstrap sample. Specifically, we will leave out the
The procedures for constructing bootstrap and jackknife CIs are straightforward. However, because the MLE weights need to be estimated and then calibrated for each bootstrap/jackknife sample, repeating this whole process is time-consuming. On top of this, in sensitivity analyses, we need to vary the values of the sensitivity parameter
In this paper, we propose to use the MLE weights estimated from the original data as the initial weights and then to implement the calibration using the restrictions based on the bootstrap/jackknife sample. This avoids calculating the MLE weights for every bootstrap/jackknife sample. Optimizing covariate balance in finite samples helps to eliminate chance imbalances24,25 and thus reduce the estimation error and variance of inverse probability weighted estimators of treatment effects, as shown in many empirical studies.7,8,14 Similarly, calibration by covariate balancing can improve the efficiency of the IPCWEs.9,12 Since calibration will eliminate chance imbalances in bootstrap/jackknife samples regardless of the initial weights, fixing the initial weights at those estimated from the original data should have minimal impact on the variance and bootstrap/jackknife CIs. In the next section, we will conduct simulation studies to investigate whether re-estimating the initial weights affects the performance of the bootstrap and jackknife CIs with calibrated weights.
2.4.2 Confidence intervals based on sandwich variance estimators
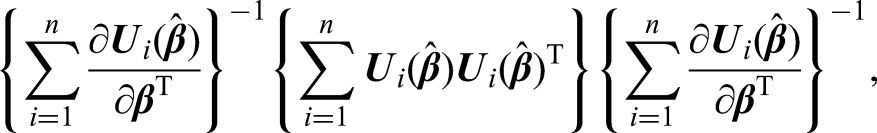
CIs could also be obtained by using a sandwich estimator of the variance of the regression parameters given the estimated weights, that is
3 Simulation
In this section, we conduct two simulation studies to assess the performance of the proposed methods in finite samples. In the first simulation study, we assess the performance of the IPCWEs using calibrated weights when dropout is non-ignorable and compare this with the performance of IPCWEs using the MLE weights. In the second simulation study, we evaluate the performance of 95% CIs calculated using non-parametric bootstrap, jackknife or the sandwich variance estimators, when either the MLE weights or calibrated weights are used.
3.1 Data generating mechanism
The design of the simulation studies is adapted from the simulation settings in Kang and Schafer.
3
The data generating mechanism for a patient is summarized in Table 1. Note that
Data generating mechanism for the simulations.
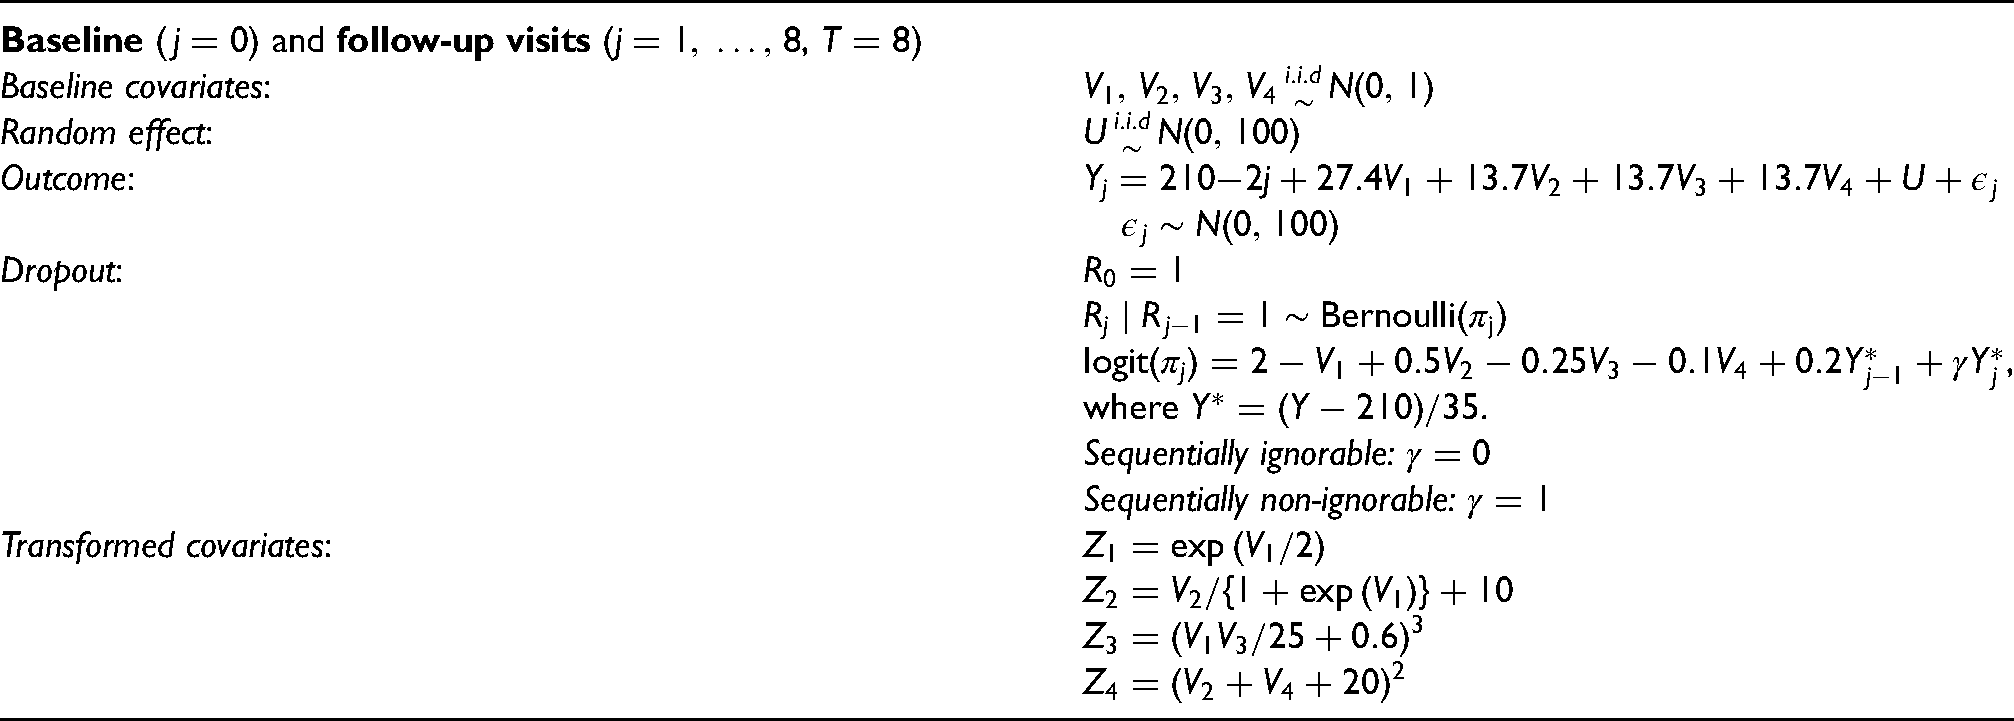
In this set-up, there are four baseline covariates
3.2 Performance of the IPCWEs under non-ignorable dropout
3.2.1 Setup
In this section, we evaluate the performance of the IPCWEs using the MLE weights and calibrated weights under both correct and incorrect model specifications when the dropout process is non-ignorable (i.e.
We will investigate the impact of combinations of both types of misspecification in the simulations. When
When
In total, we will evaluate the performance of the IPCWEs for Selection function Selection function Selection function Selection function
For covariates in calibrated restrictions, we include the visit number
3.2.2 Results
Table 2 summarizes the results of the first simulation study. When
Bias, empirical standard deviation (SD) and root mean squared error (MSE) for IPCWEs of
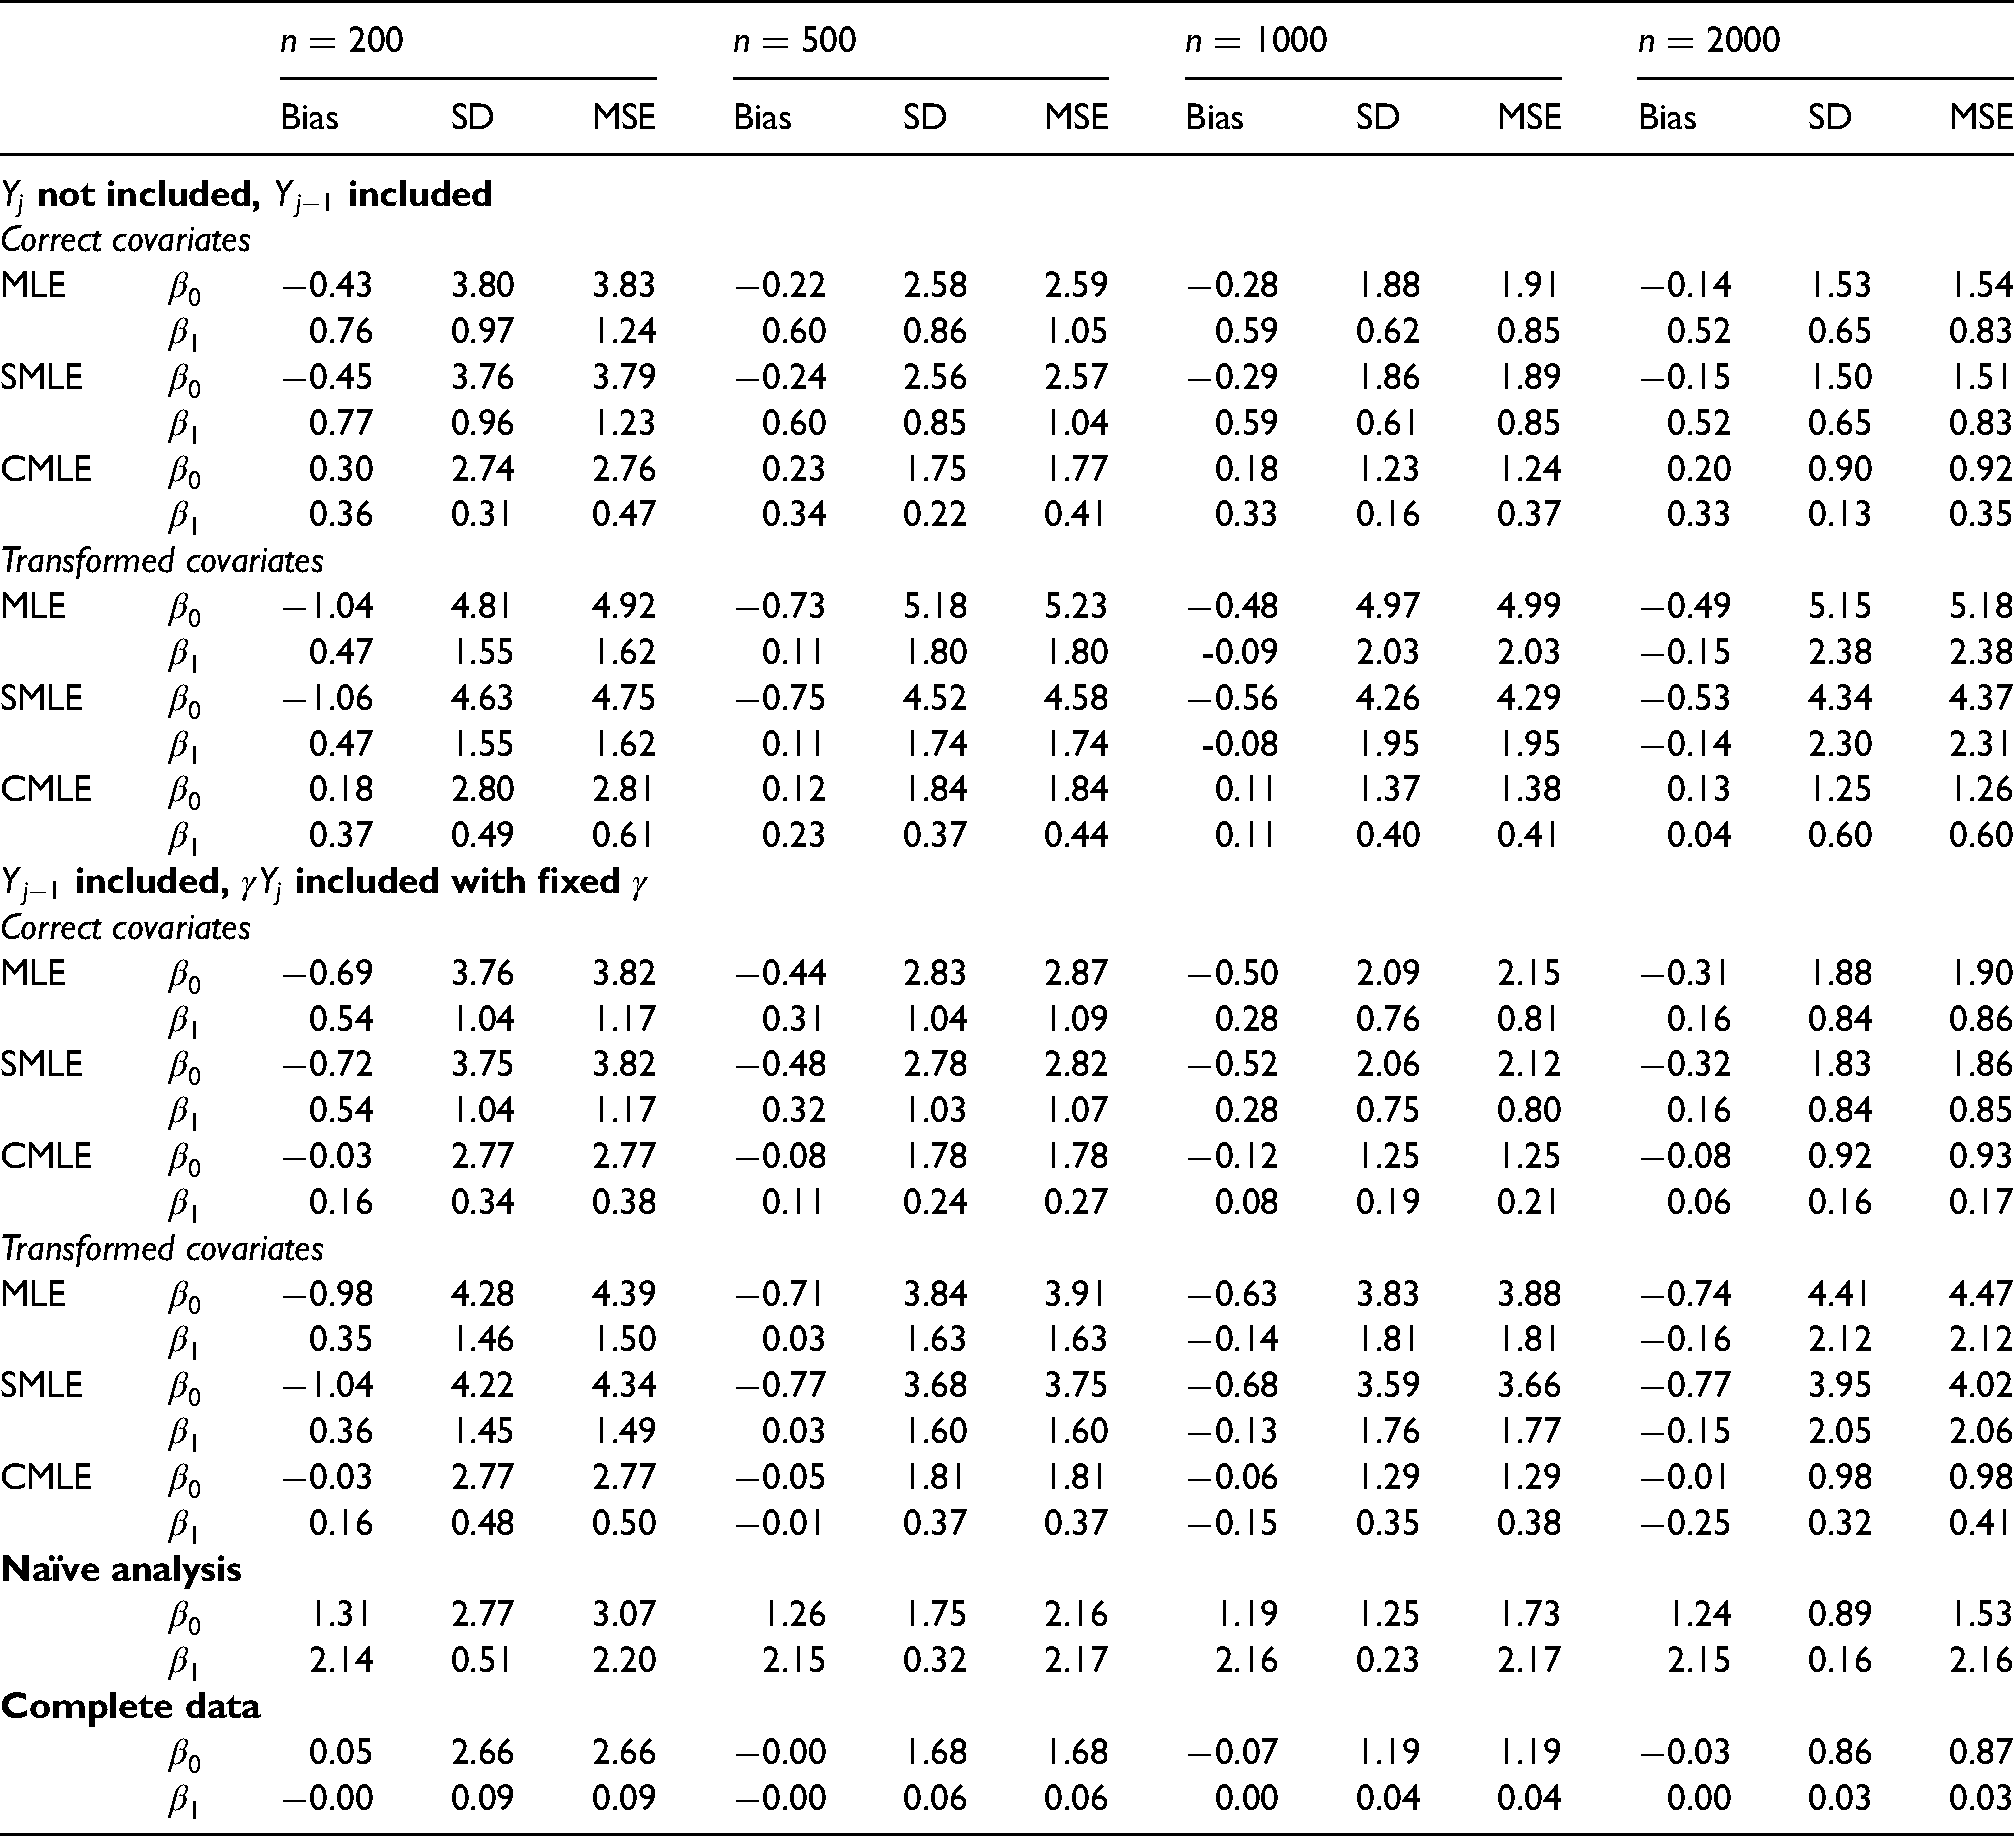
When the selection function
3.2.3 Summary
In all scenarios of the first simulation study, the IPCWEs with calibrated weights perform uniformly better in terms of MSEs than the IPCWEs with the MLE weights. When the rate of missingness is high (
3.3 Coverage of 95% confidence intervals based on bootstrap, jackknife or sandwich variance estimator when the dropout process is sequentially ignorable
3.3.1 Setup
Since the first simulation study has demonstrated the better performance of the IPCWEs with calibrated weights under non-ignorable dropout when the selection function and correct covariates are used, for simplicity, in the second simulation study, we focus on the setting where the dropout process is sequentially ignorable (i.e.
We will compare the empirical coverage probabilities of the following CIs:
Bootstrap CIs with calibrated weights, fixing the initial weights at those estimated from the original data. Bootstrap CIs with calibrated weights, re-estimating the initial weights for each bootstrap sample. Bootstrap CIs with unscaled MLE weights. Bootstrap CIs with scaled (to sum to For For For For CIs based on sandwich variance estimator and unscaled MLE weights. CIs based on sandwich variance estimator and scaled MLE weights. CIs based on sandwich variance estimator and calibrated weights.
The MLE weights were calculated by fitting a standard logistic regression model for the dropout hazard given the correct baseline covariates
3.3.2 Results
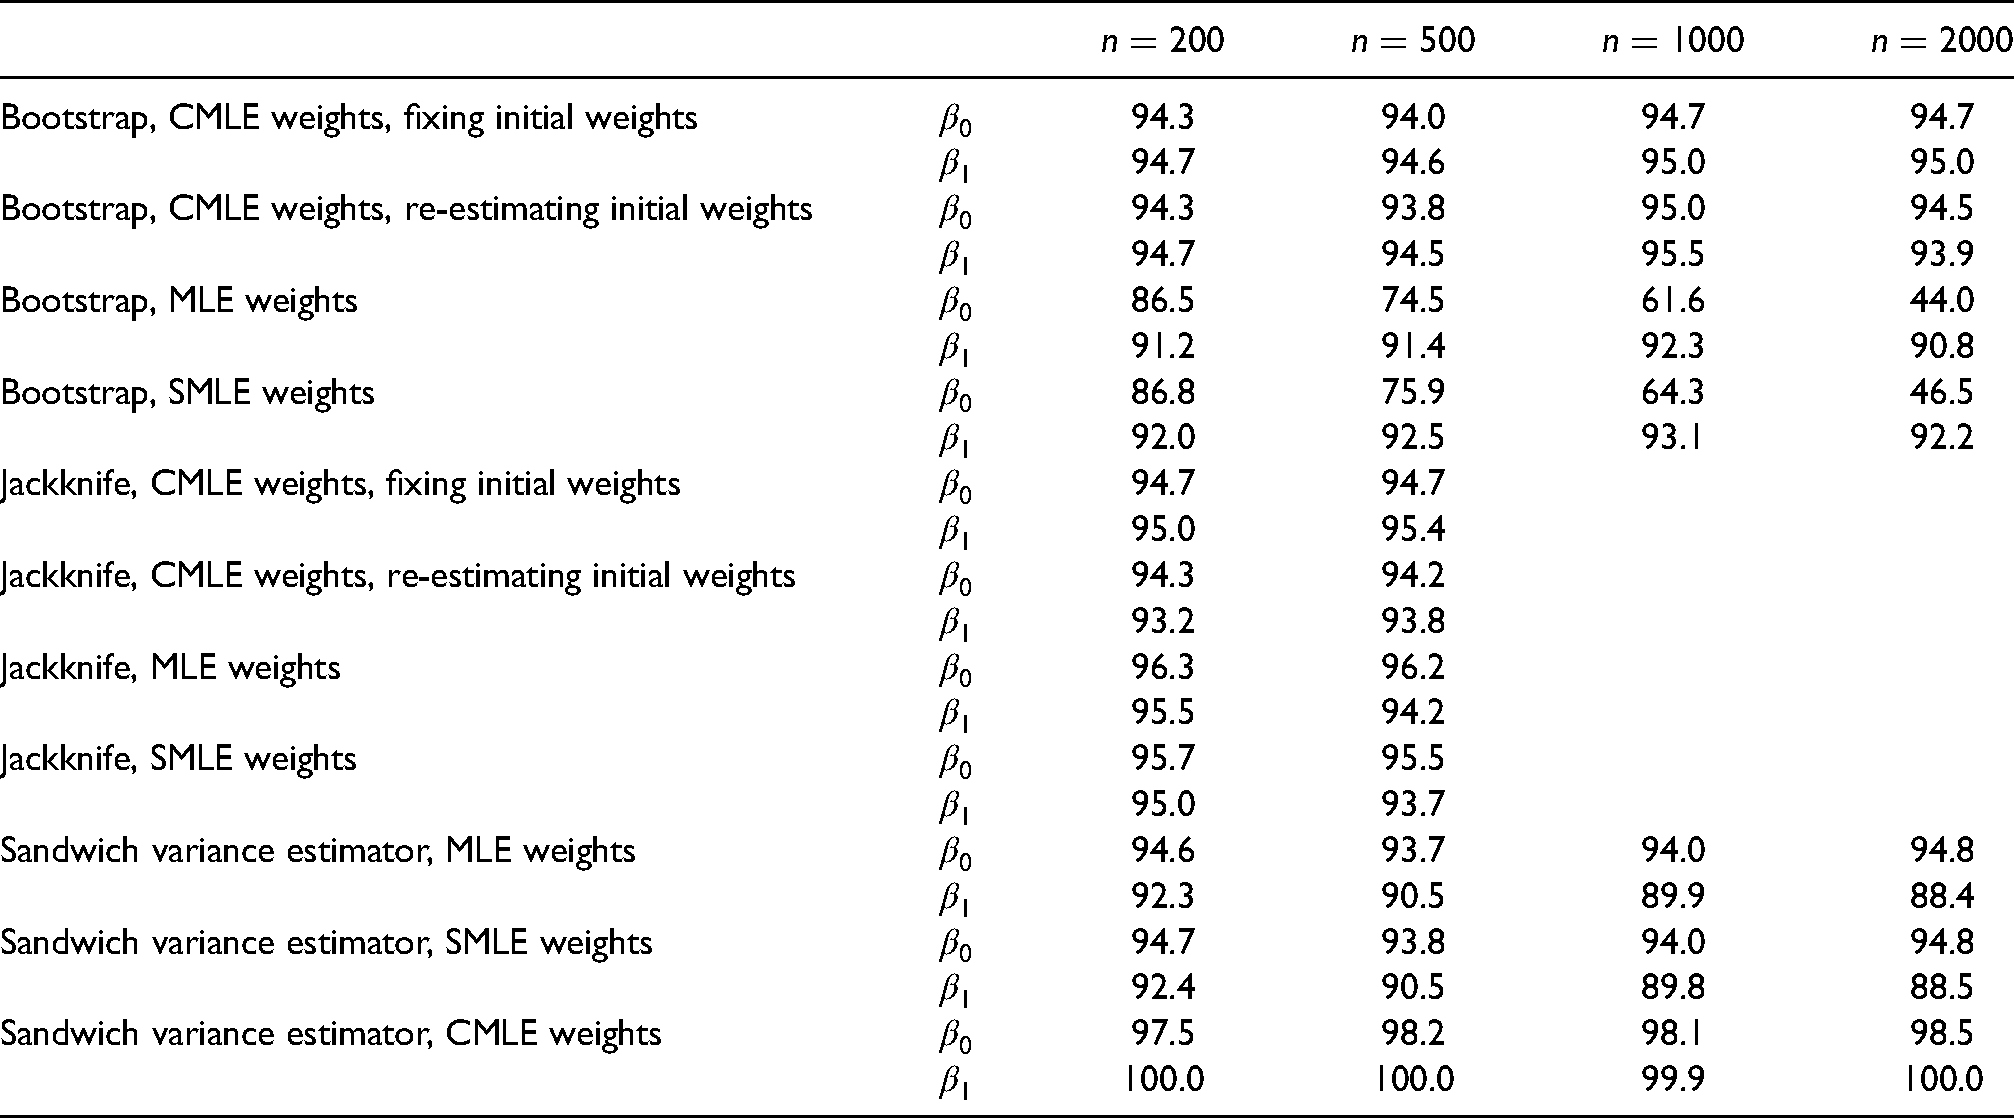
Table 3 presents the coverage probabilities of the 95% CIs based on non-parametric bootstrap, jackknife and sandwich estimator. The bootstrap CIs with calibrated weights all achieved better coverage than their counterparts with the MLE weights, and their coverage is close to the 95% nominal level. This is regardless of whether or not the initial weights were re-estimated for each bootstrap sample. This finding confirms that fixing the initial weights has minimal impact on the coverage of the bootstrap CIs with calibrated weights. Overall, the bootstrap CIs with the scaled MLE weights have slightly better coverage than their counterparts with unscaled weights, but the improvement is minimal.
Coverage probabilities (%) of 95% confidence intervals (CIs) based on non-parametric bootstrap, jackknife (only for
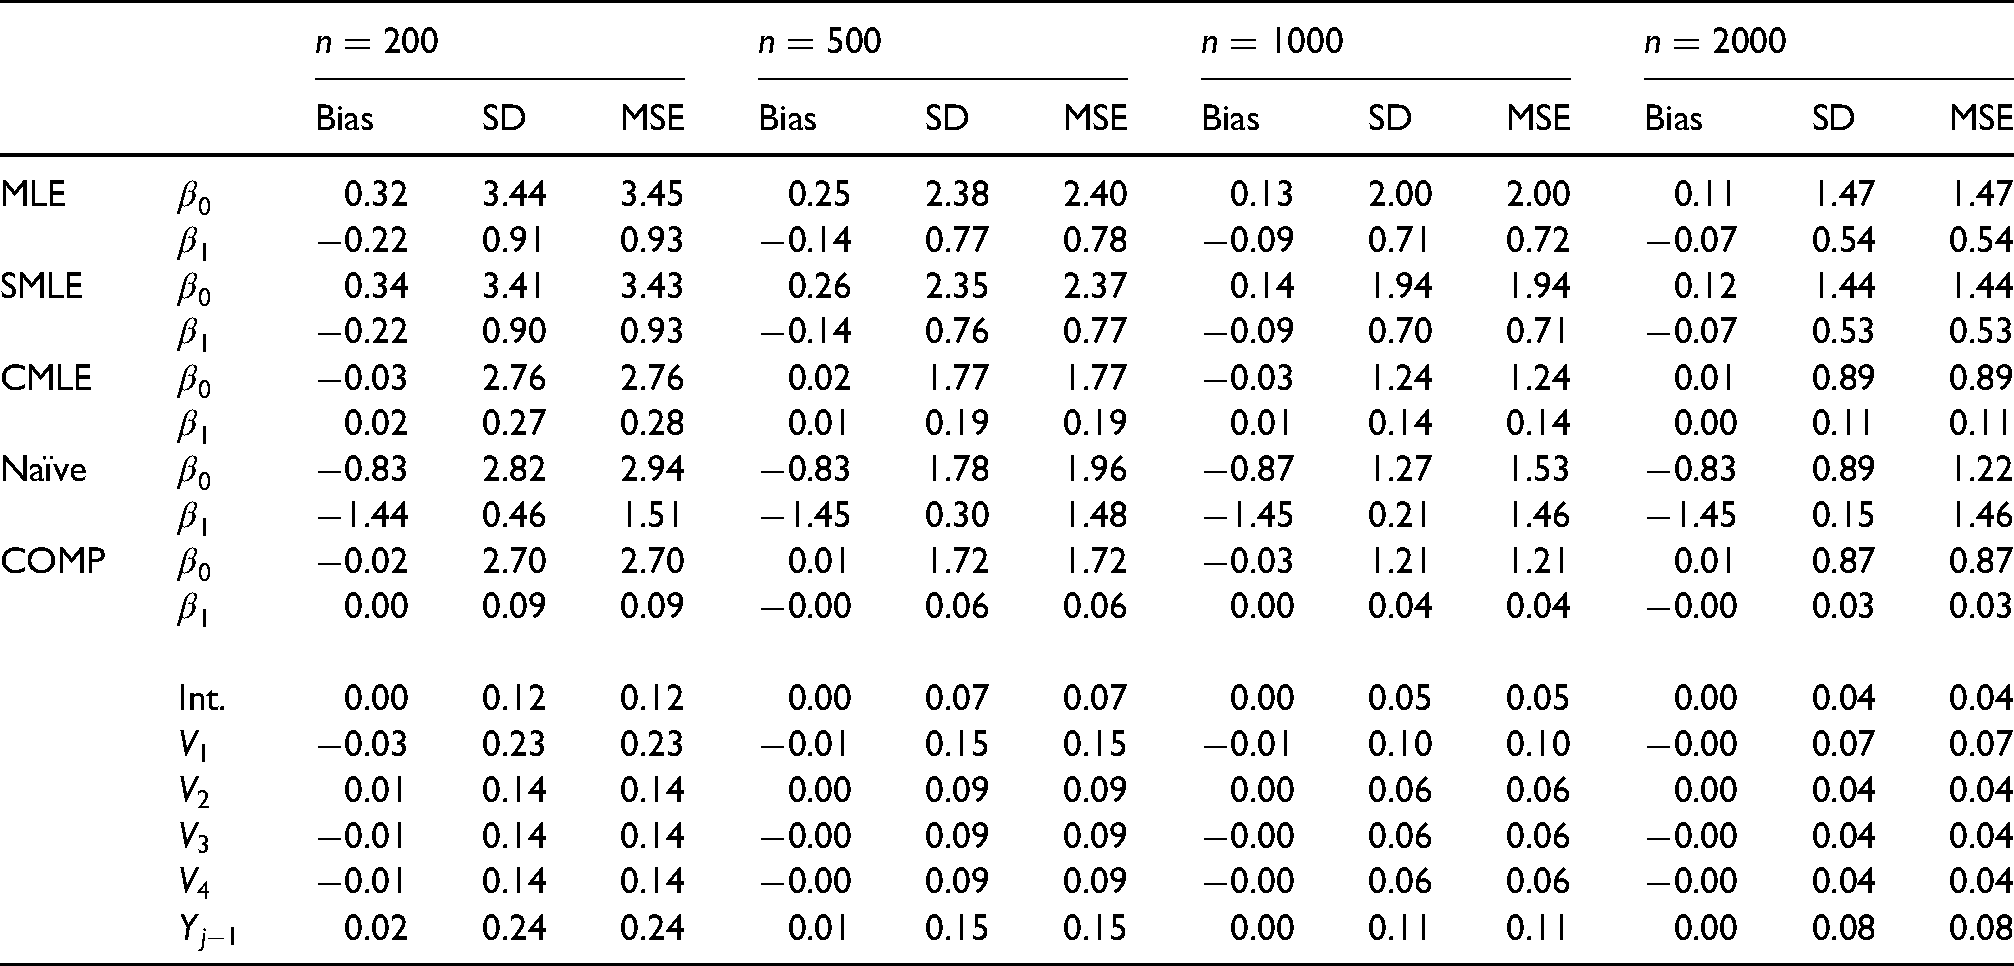
The poor coverage of the bootstrap CIs with the MLE weights might be explained by the moderate amount of finite sample bias of the IPCWEs with the MLE weights. For example, as shown in the top part of Table 4, the IPCWEs with the MLE weights showed a moderate amount of empirical bias, especially for
The coverage of the jackknife CIs is similar with different sets of weights. This might be because extreme MLE weights are less likely to occur in jackknife samples, as only one patient’s data are removed in each jackknife sample.
For
3.3.3 Summary
The bootstrap CIs using the MLE weights performed poorly in this simulation study, while the jackknife CIs and CIs based on sandwich variance estimator using the MLE weights performed better, possibly because they were less likely to be impacted by extreme MLE weights generated during re-sampling. Bootstrap and jackknife CIs using calibrated weights performed well, but CIs based on the sandwich estimator using calibrated weights were conservative. There was essentially no difference in terms of coverage when the initial weights were re-estimated or not re-estimated for each bootstrap/jackknife sample. Therefore, for computational efficiency, it is reasonable to fix the initial weights when constructing bootstrap/jackknife CIs with calibrated weights, especially if the model for estimating the initial weights is complex and slow to fit.
4 Analysis of the SLICC cohort data
4.1 The longitudinal outcome, covariates and secondary sources of missing data
The outcome of interest in our analysis is the physical component summary (PCS) score from the SF-36 questionnaire completed by the SLICC patients at their study assessment visits. The PCS includes four subscales of physical functioning (10 items), role-physical (4 items), bodily pain (2 items), and general health (5 items), and is standardized to range between 0 and 100. Following Hanly et al., 19 we treat the PCS as a continuous variable. The main covariate of interest is patient’s time-varying NP status at annual study assessments. This is a categorical variable with three levels, which are, in order of increasing severity: (i) patient has not yet had an NP event; (ii) patient has had an NP event, but not yet a CerVE attributable to SLE; and (iii) patient has had a CerVE attributable to SLE. See Hanly et al. 19 for the definition of CerVEs attributable to SLE. We used (iii) as the reference category. Following Hanly et al., 19 other covariates for the outcome model include: assessment visit number (including linear and quadratic terms); sex; age at SLE diagnosis; groups defined by race/ethnicity/location; post-secondary education; the SLE Disease Activity Index 2000 (SLEDAI-2K) at the current assessment; SLICC/ACR Damage Index (SDI) excluding the NP component at the current assessment; corticosteroids, antimalarials and immuno-suppressant use since last assessment visit.
Besides the loss to follow-up, there were secondary sources of missing data which resulted in intermittent missing data in the PCS and missing data in other covariates such as education, SLEDAI-2K and SDI. It was not uncommon for patients to miss more than one annual assessment visit and then came back for later assessments, which resulted in a moderate amount of intermittent missing data in the PCS (19.4% out of 12,889 assessment visits). When there was one intermittent missing PCS value, the last observed value was carried forward; otherwise the patient was treated as having dropped out immediately before the first of the two or more consecutive missed visits, and any subsequent visits were ignored. Missing PCS and SLEDAI-2K values at enrolment (visit 0) were imputed as the patient’s values at the first follow-up visit (visit 1), if these values were available; patients with missing PCS and SLEDAI-2K values at visits 0 and 1 were excluded from the analysis. Other intermittent missing SLEDAI-2K values were imputed by ‘last observation carry forward’. In addition, we categorized SDI values as 0, 1, 2, 3 and
4.2 The dropout model and estimated weights
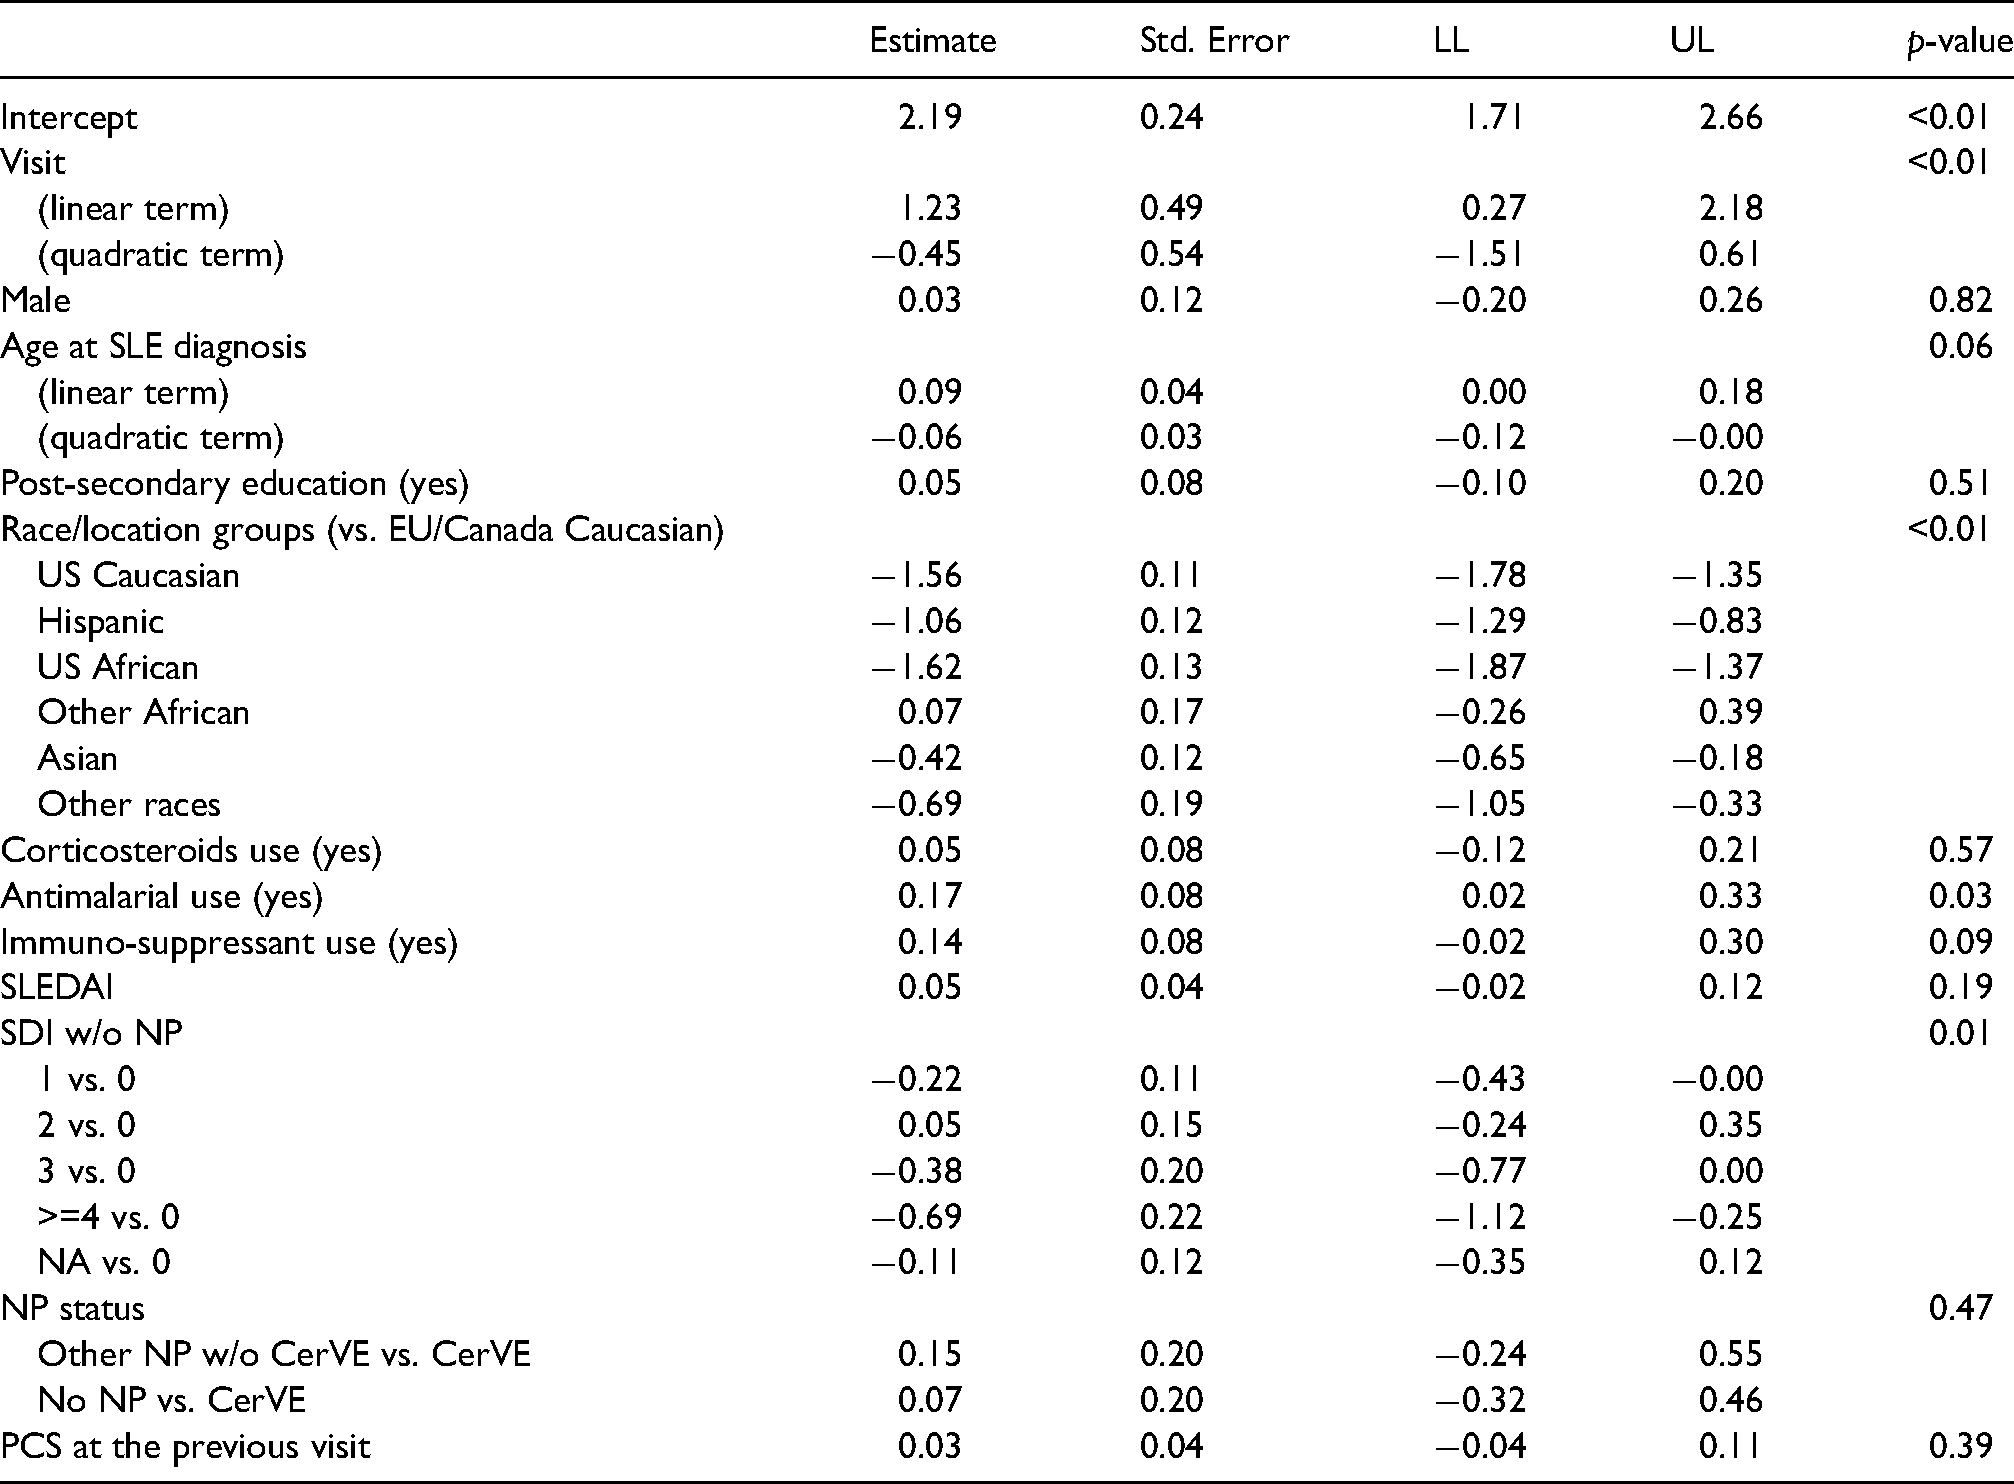
We first fit the dropout model of (3) using MLE and assuming that the dropout process is sequentially ignorable, that is,
Fitted model for the dropout process in the SLICC data. LL: lower limit of 95% CI; UL: upper limit of 95% CI.
We used the fitted dropout model to obtain the initial weights and then applied the calibration procedure in Section 2.3. To accommodate the administrative censoring due to staggered entry to the SLICC cohort, we slightly modify the calibration restrictions in (6) and (7) by replacing
Figure 1 presents the violin plots of the unscaled MLE weights, scaled MLE weights and calibrated weights for the follow-up visits, as well as the scatterplot of the scaled MLE weights and calibrated weights. The minimum/maximum values of the unscaled MLE weights, scaled MLE weights and calibrated weights are 1.058/19.663, 0.942/17.508 and 0.616/11.514, respectively. It is clear from Figure 1 that the calibrated weights are less variable than the MLE weights. Overall, these weights appear to be not very extreme, which suggests that the positivity assumption is likely to hold.
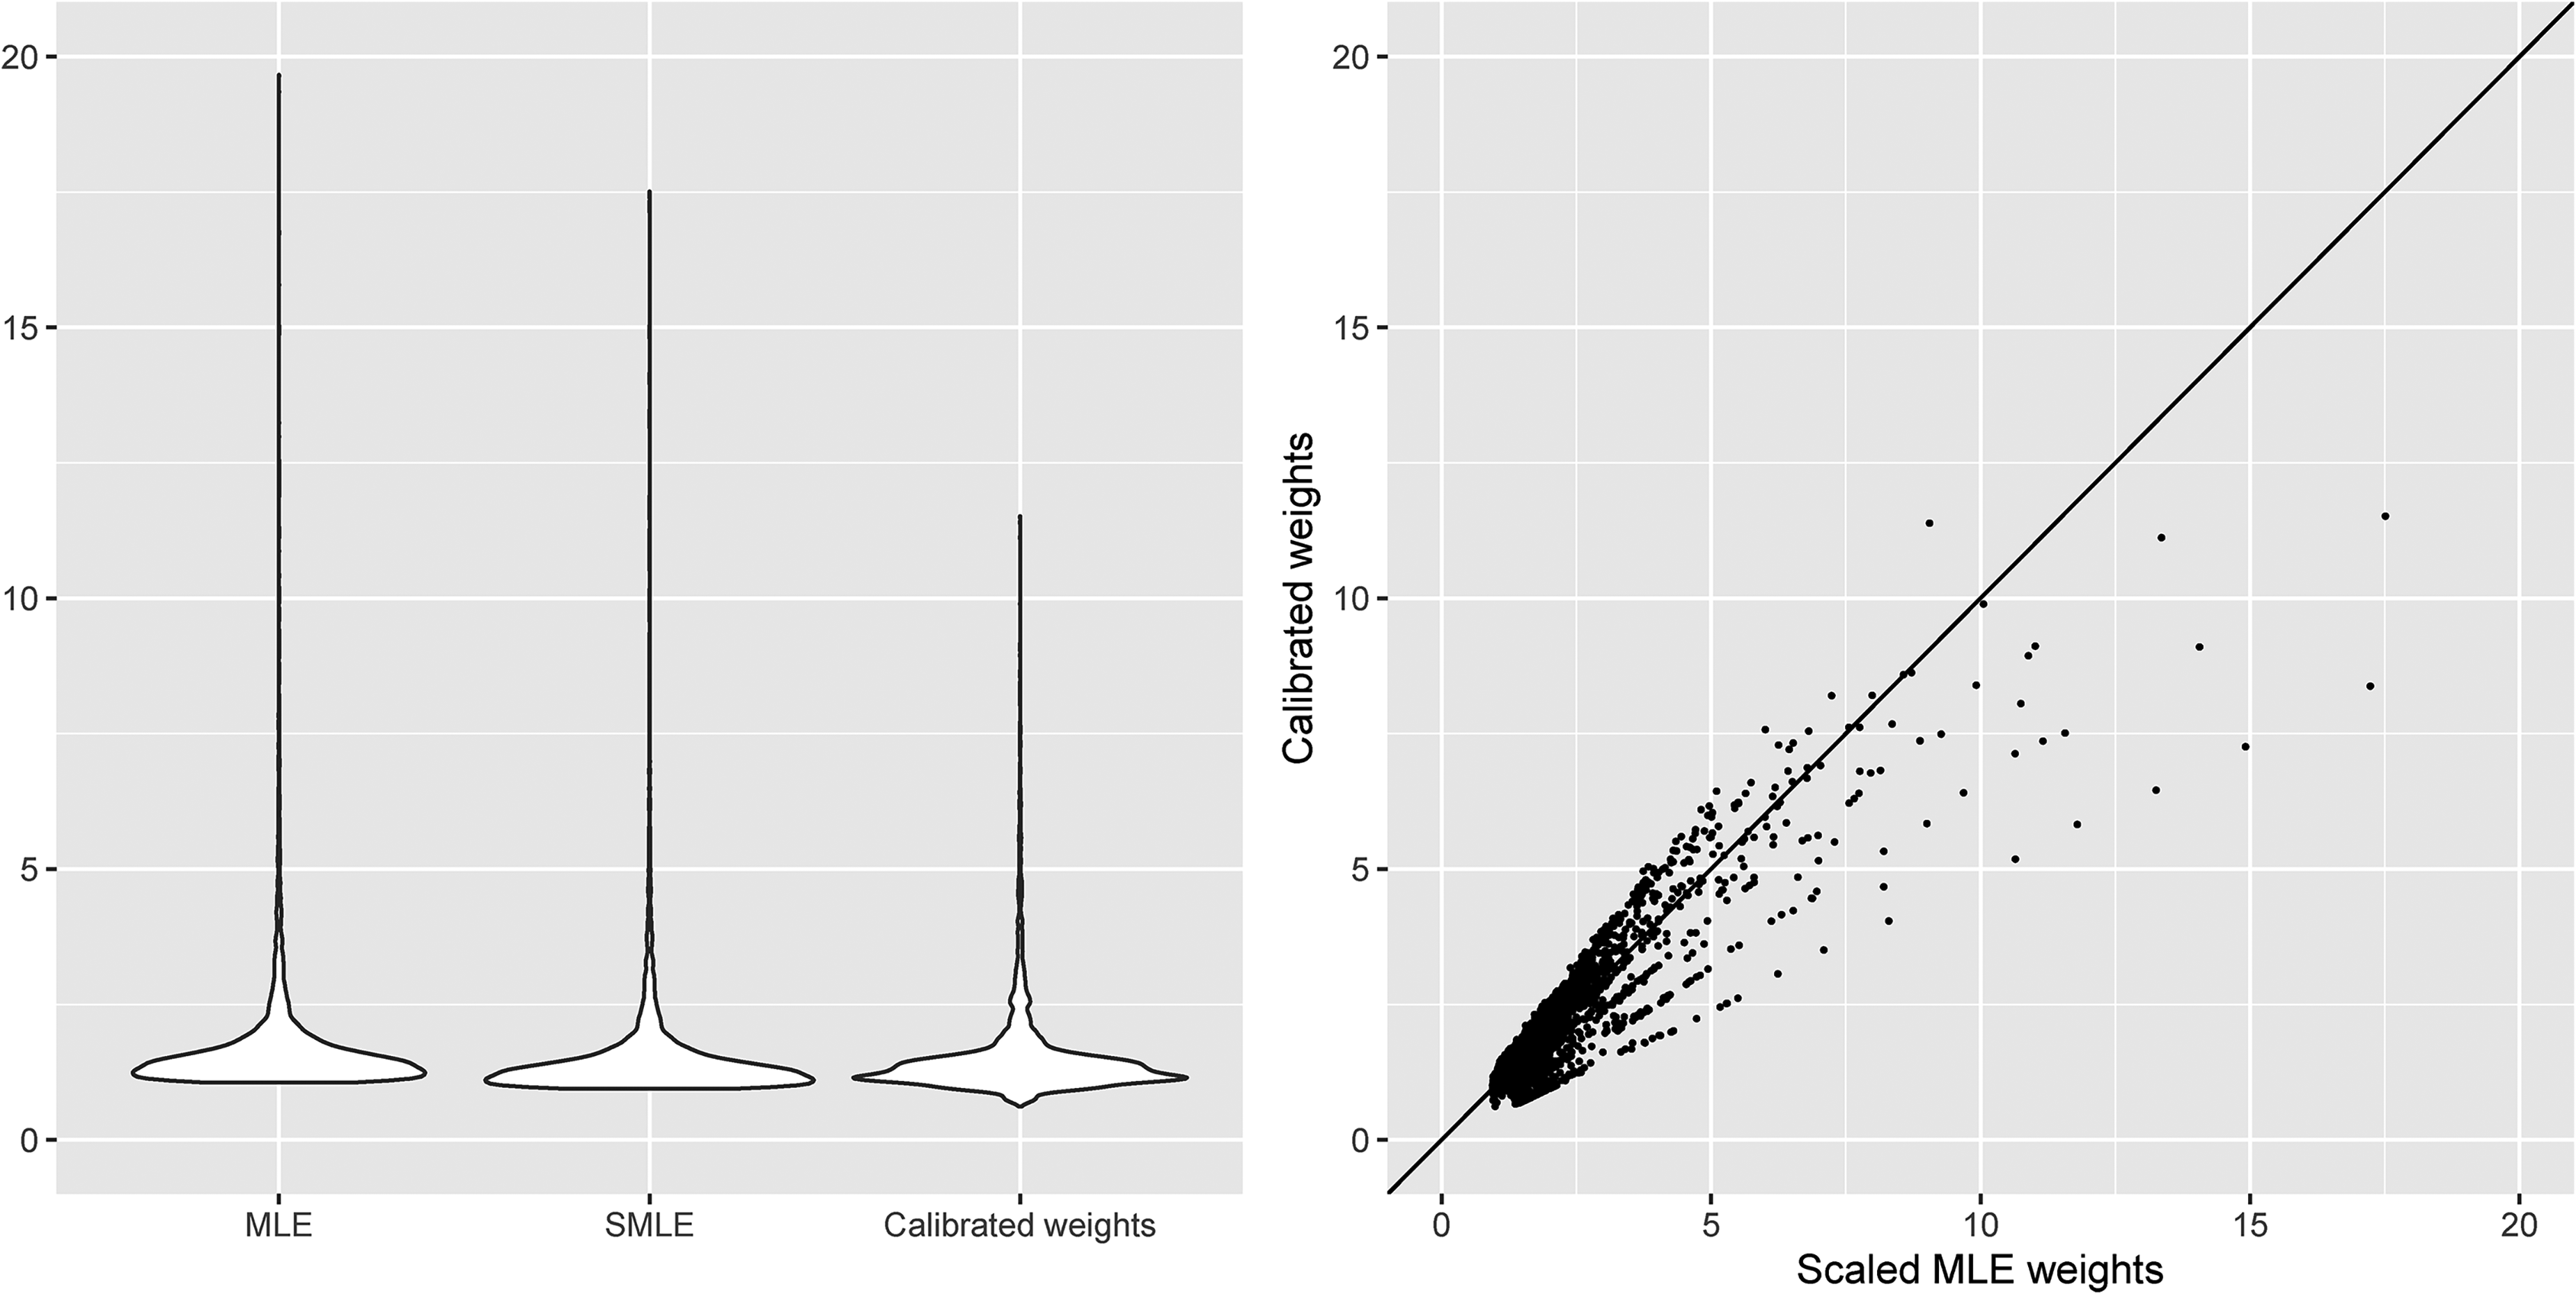
Violin plots and scatterplot of the MLE weights (MLE: unscaled MLE weights; SMLE: scaled MLE weights) and calibrated weights assuming sequential ignorability of the dropout process in the SLICC data.
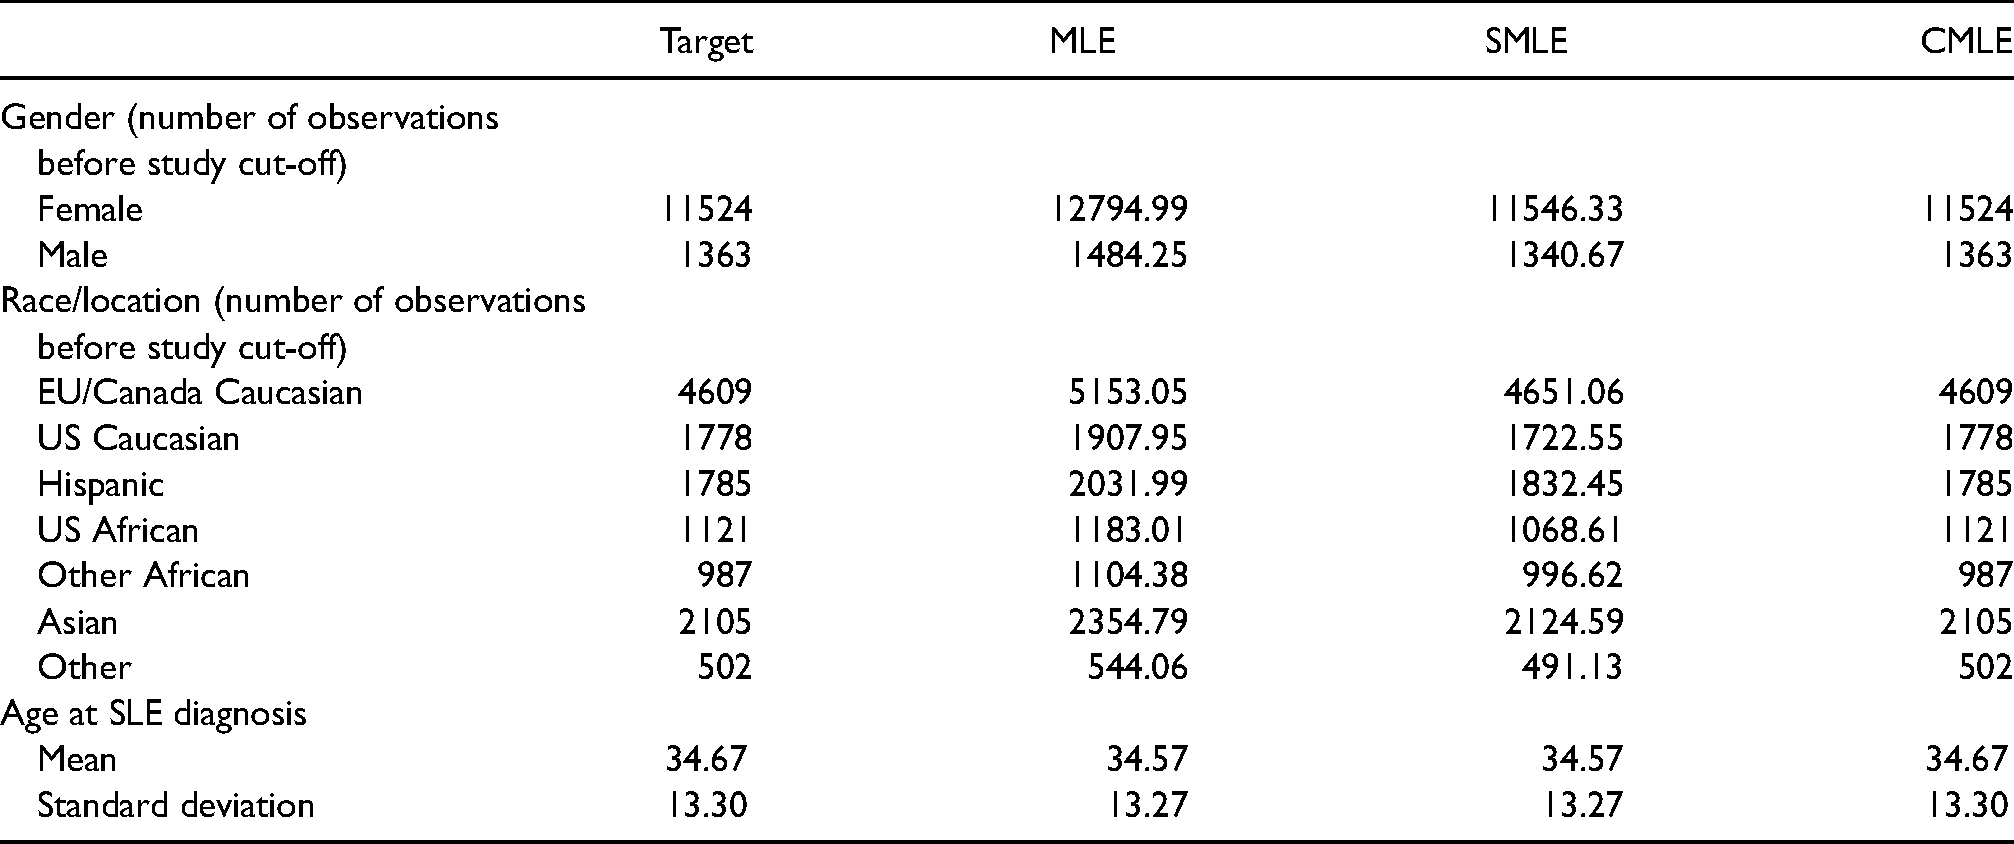
Table 6 presents the summaries of the demographic variables in the target population and the weighted samples using the unscaled MLE weights, scaled MLE weights and calibrated weights. It is apparent that calibrated weights exactly balance the distributions of all the demographic variables in the target population and the weighted samples, but the MLE weights only seem to balance age at SLE diagnosis well.
Demographics summaries in the target population (Target) and the weighted samples using the unscaled MLE weights (MLE), scaled MLE weights (SMLE) and calibrated weights (CMLE) in the SLICC data analysis.
4.3 Results for the outcome model
Columns 1–9 in Table 7 present the point estimates and bootstrap SEs of regression coefficients for the naïve analysis without weighting, and IPCWEs using the MLE weights and calibrated weights assuming sequential ignorability. For estimators with calibrated weights we note that the bootstrap SEs with and without recalculating the initial weights are almost identical.
Point estimates (EST) and bootstrap standard errors (SE) of regression coefficients from the naïve analysis without weighting and IPCWEs with the MLE weights and calibrated weights. MLE (unscaled and scaled): weights based on maximum likelihood; CMLE: calibrated weights. SE1: bootstrap standard errors by recalculating the initial weights for calibrating weights; SE2: bootstrap standard errors by fixing the initial weights for calibrating weights.
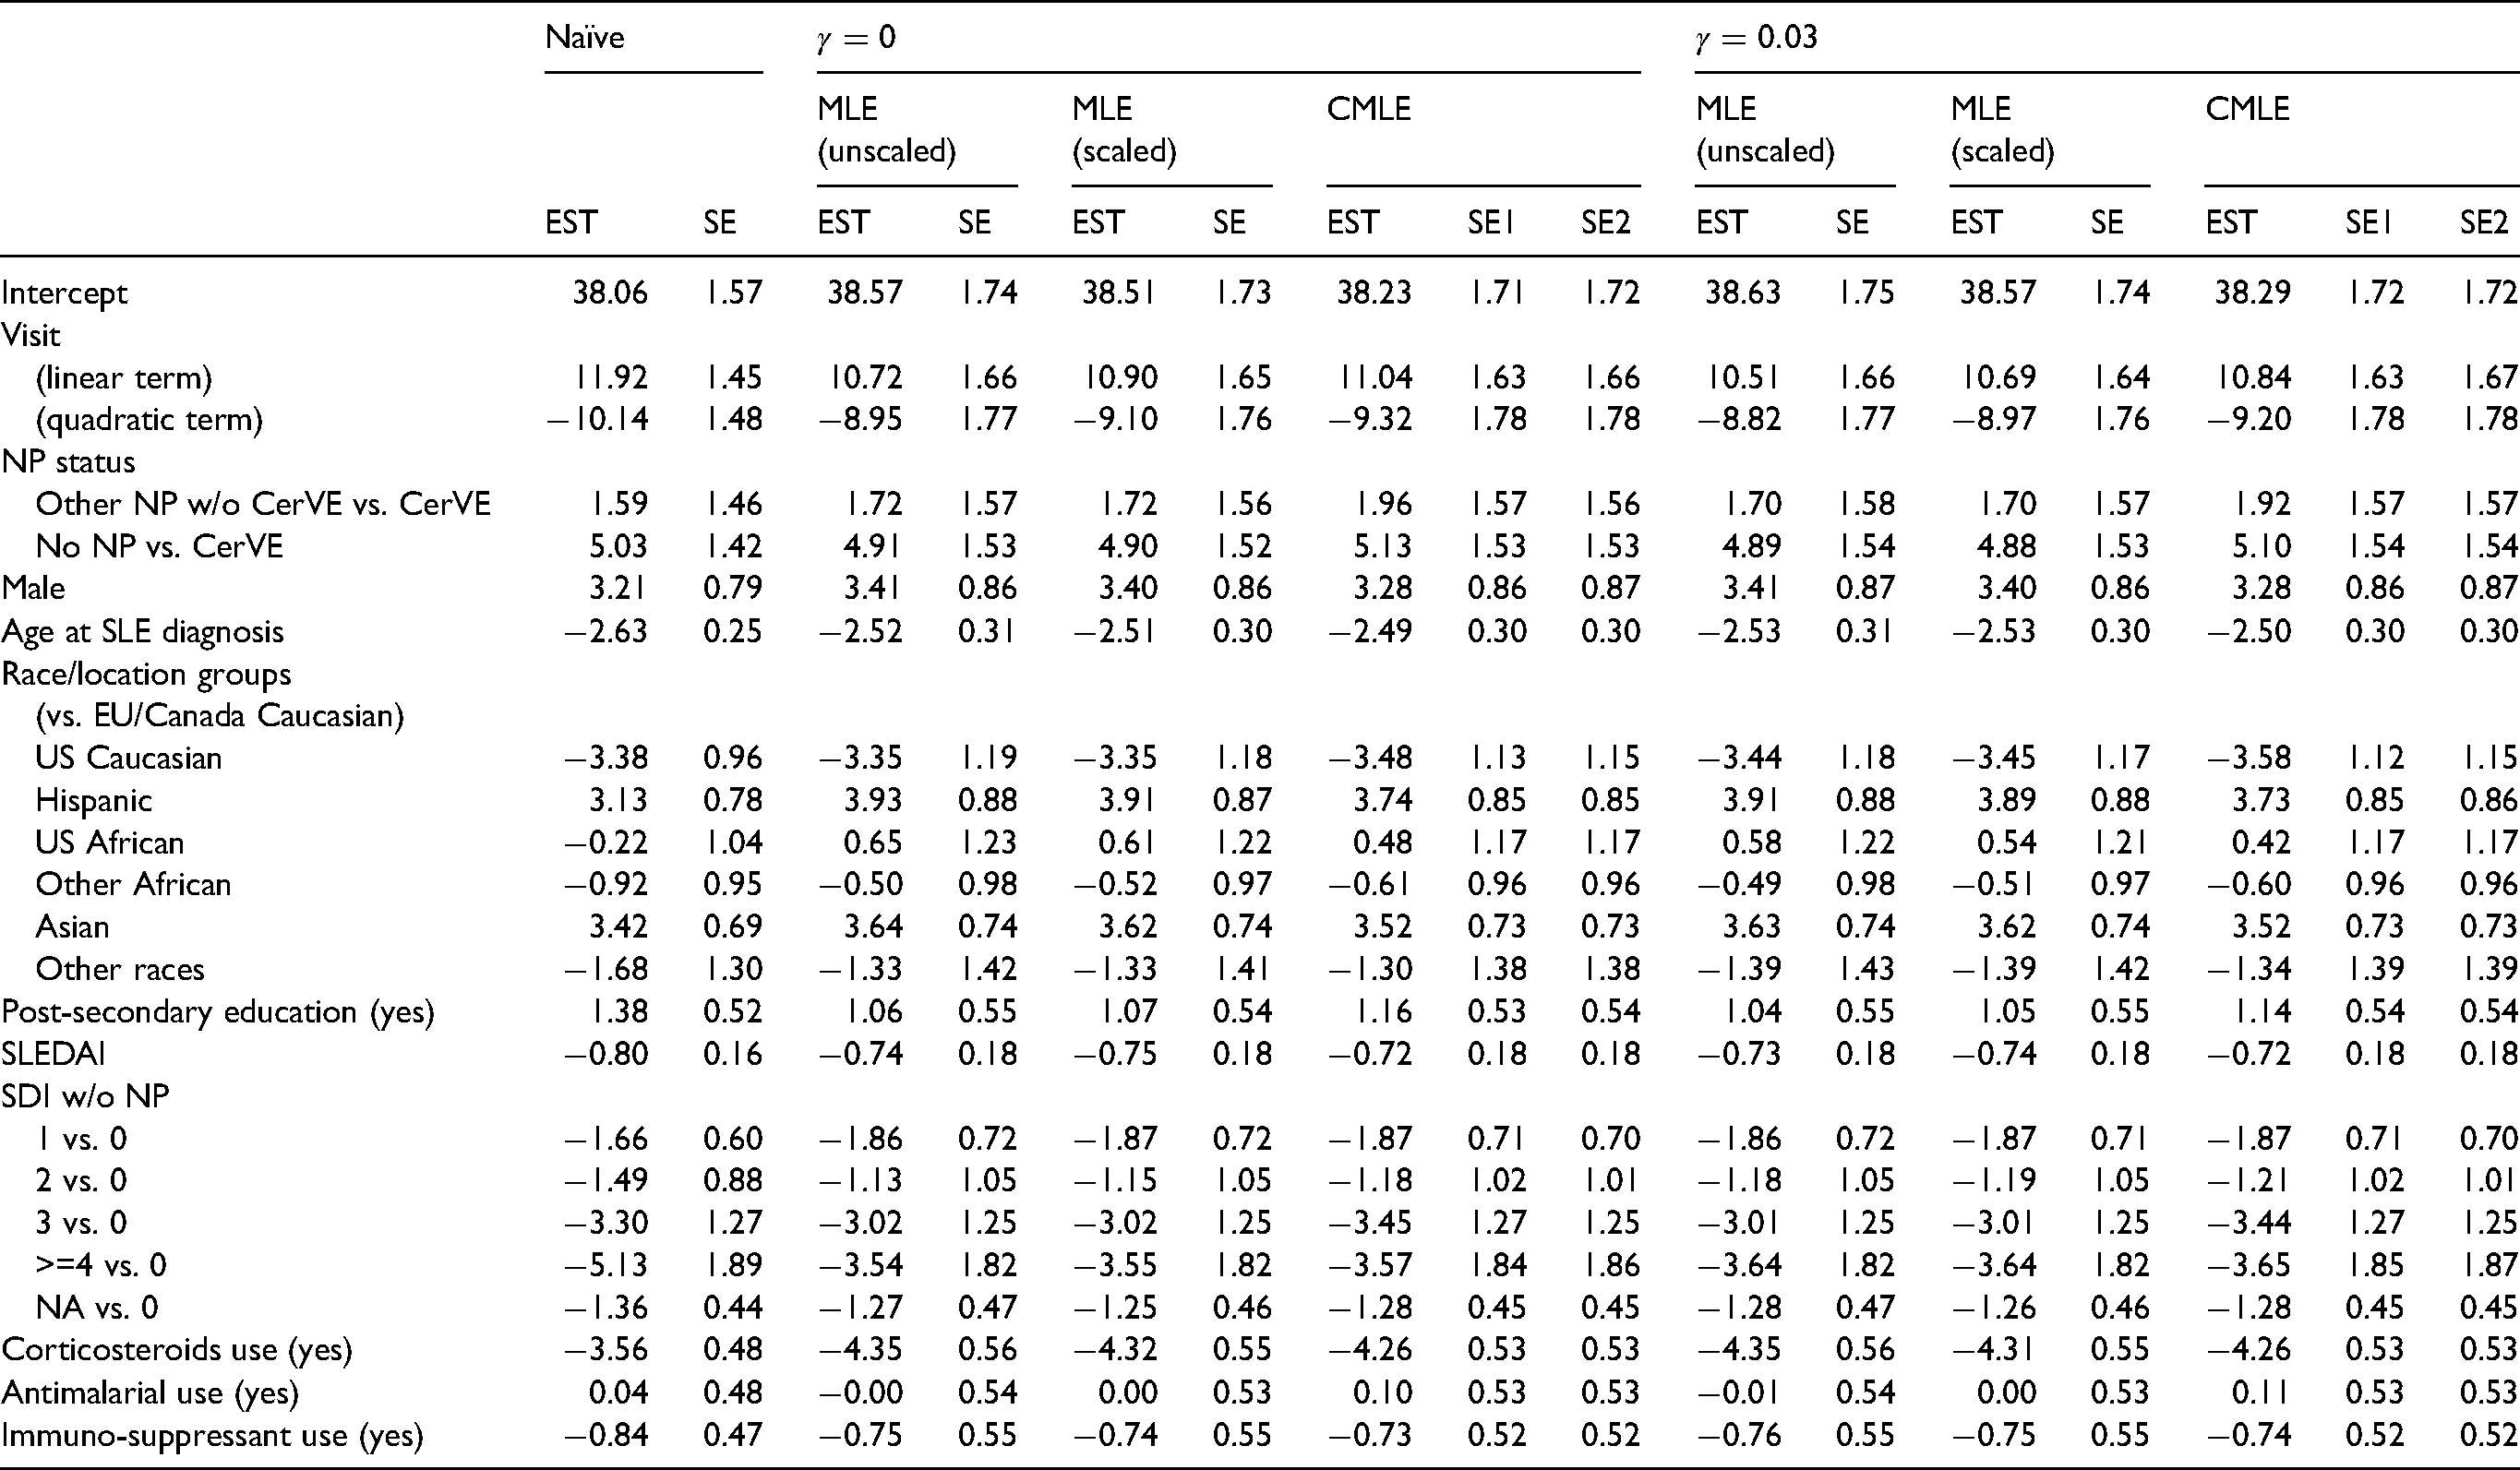
We focus on the main effect of interest, the ‘NP status’ effect. The effect of ‘other NP events without CerVEs’ vs. ‘CerVEs’ was increased when IPCW was applied, compared with the naïve analysis. This increase was most prominent when IPCW with calibrated weights was used. The effect of ‘No NP’ vs. ‘CerVEs’ was similar across different estimators. Nevertheless, the overall conclusions about the effects of ‘NP status’ remain the same: patients who had any previous NP events had lower PCS scores on average than patients who did not have any previous NP events. There is no evidence that the PCS scores differed between patients with any SLE-attributable CerVEs and patients with other NP events but without SLE-attributable CerVEs. In addition, there were fairly large changes in estimates of the effects of visit, race/location groups and corticosteroids use. For example, the negative effect of corticosteroids use on PCS was increased by one SE more when IPCW with calibrated weights was applied compared with the naïve analysis, which suggests stronger evidence for the negative association between corticosteroids use and patients’ HRQoL.
4.4 Sensitivity analysis
For sensitivity analysis, we let
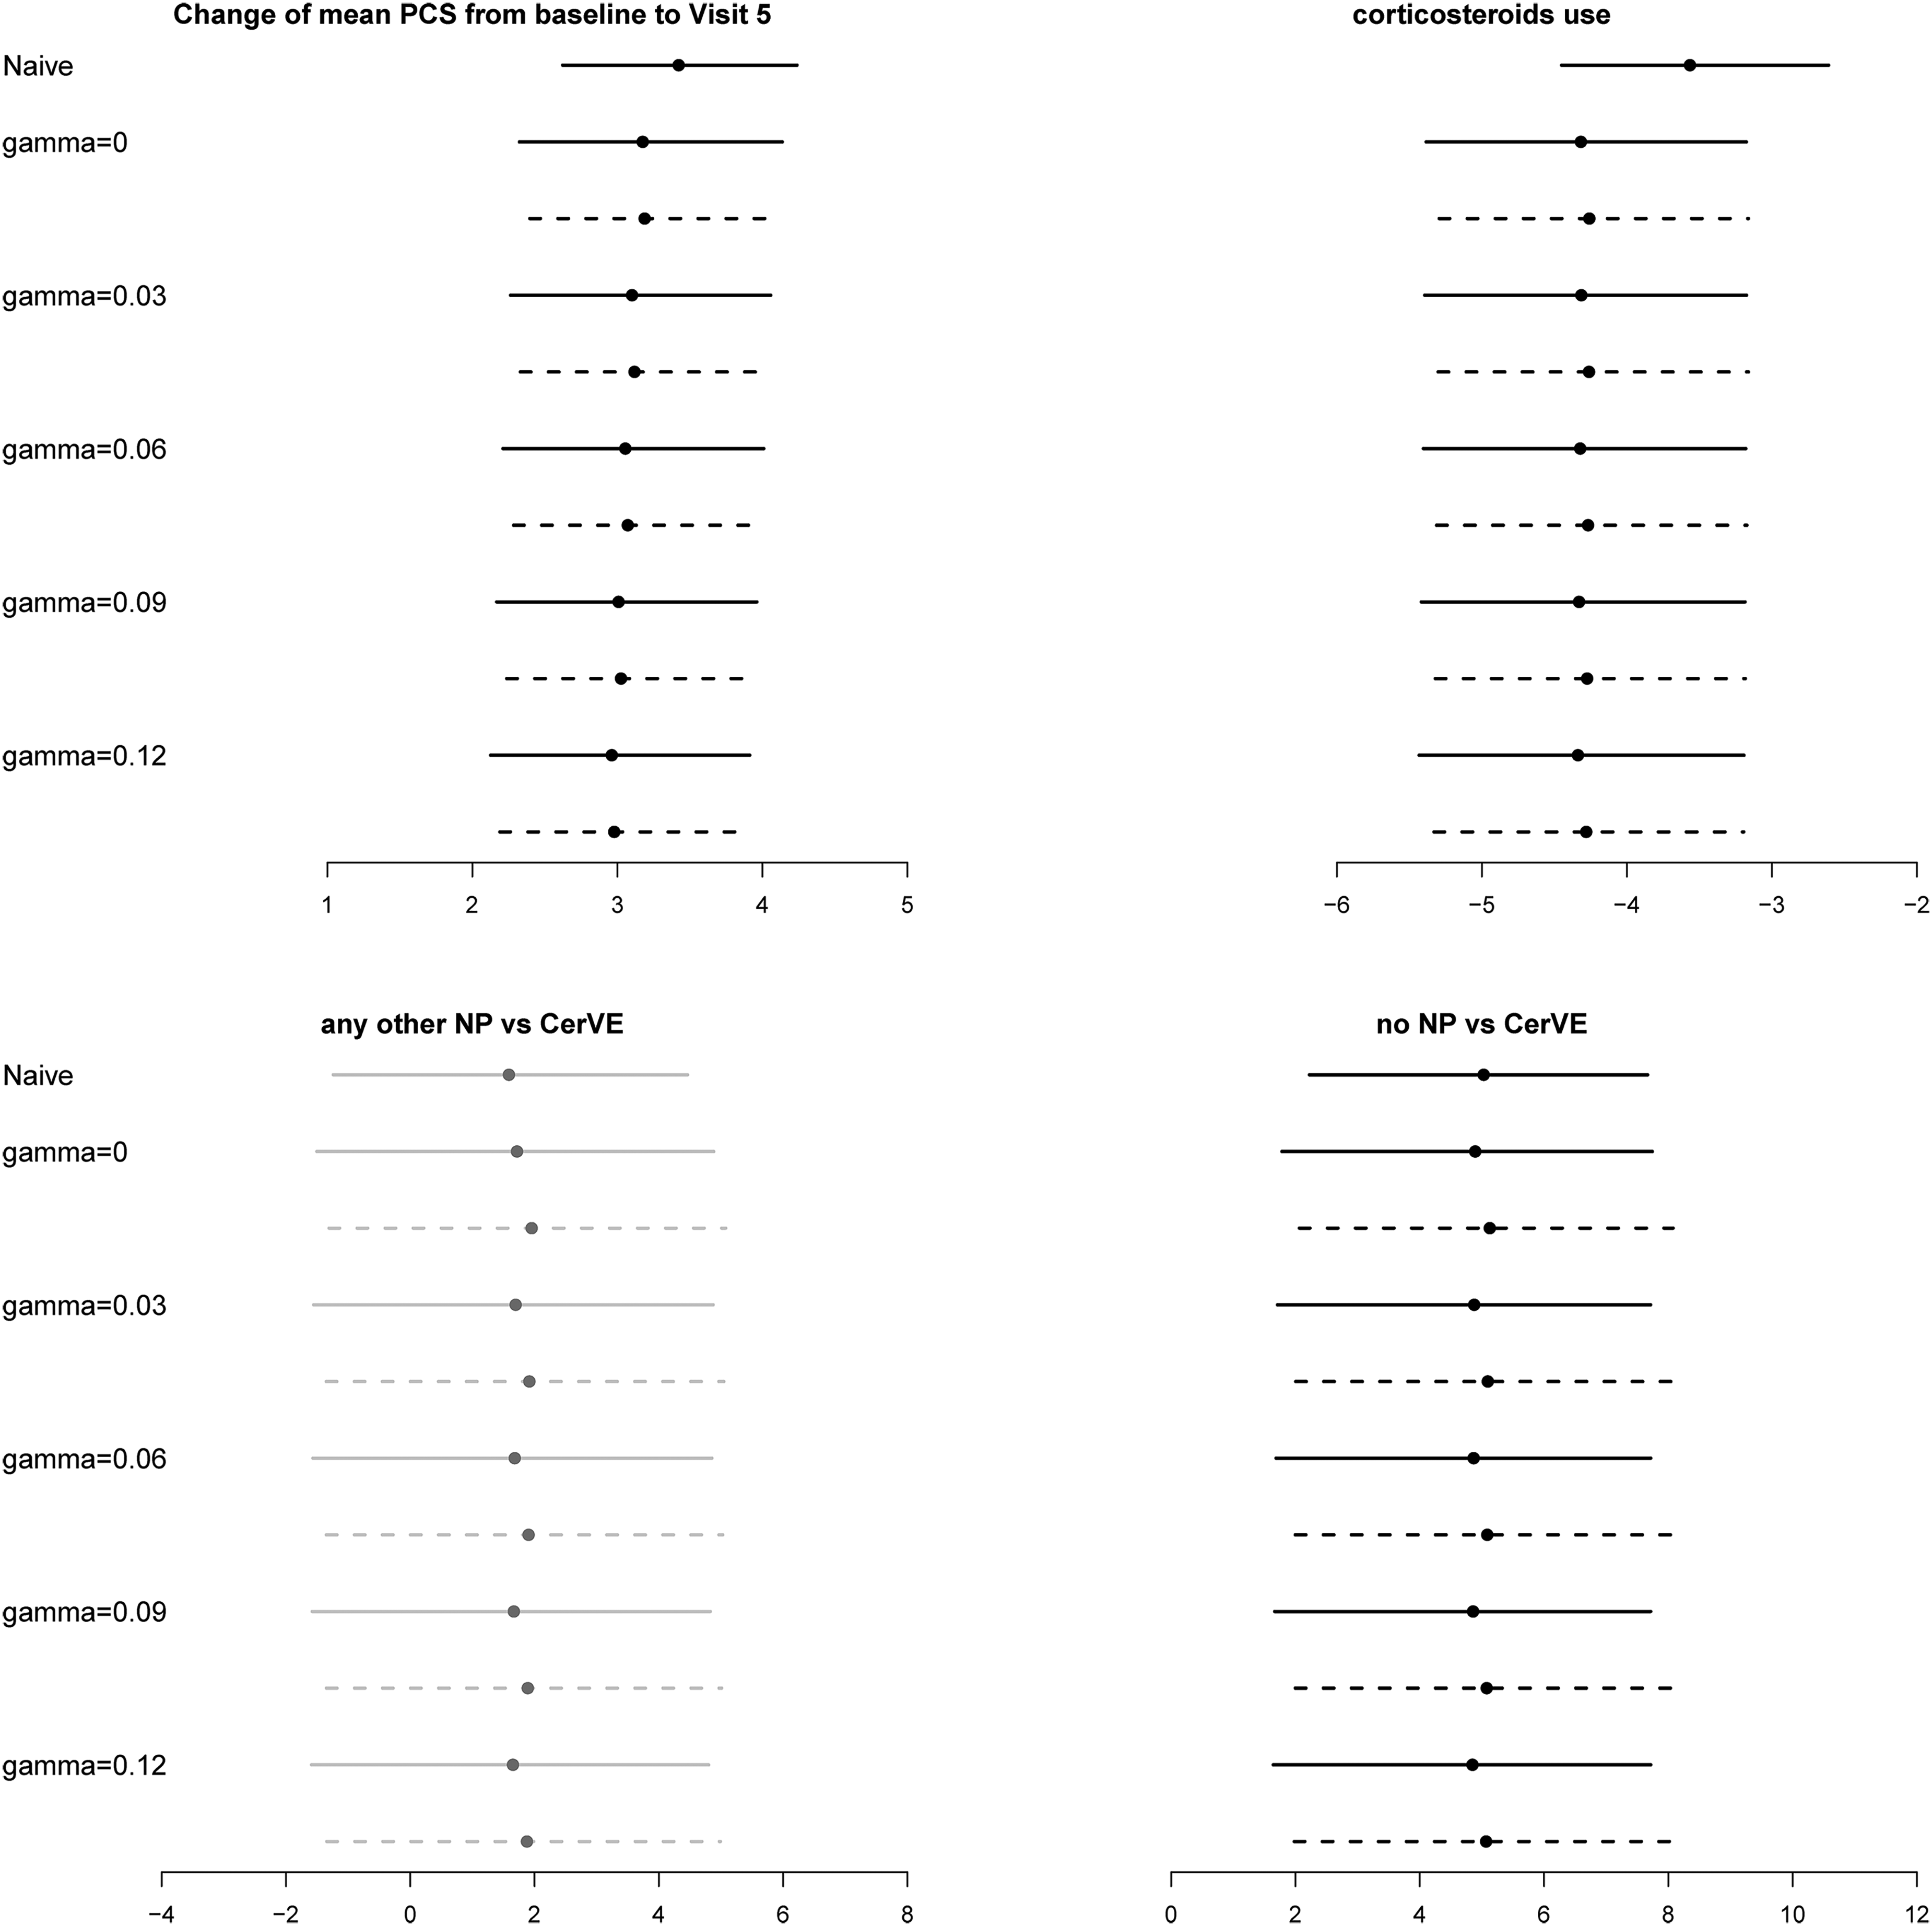
Estimated regression coefficients and 95% bootstrap confidence intervals for the SLICC data. Top left panel: changes of mean physical summary score (PCS) from baseline to visit 5. Top right panel: effect of corticosteroids use on PCS. Bottom panels: the long-term effect of the occurrence of cerebrovascular (CerVE) events or any other neuropsychiatric (NP) events on PCS. Dotted line: results from calibrated weights; solid lines: results from scaled MLE weights. The estimated effects with 95% CI covering zero and not covering zero are in grey and black, respectively.
The reduced visit effect in the analyses with IPCW is obvious compared with the naïve analysis. This is expected because patients with higher PCS are more likely to remain in the study. As discussed above, there are slight differences between estimated NP status effects from the IPCWEs using MLE weights and those using the calibrated weights. However, the main conclusions about the effect of NP status on PCS are similar across different analyses with IPCW and consistent with the findings in Hanly et al. 19
5 Conclusion and discussion
In this paper, we have proposed a sensitivity analysis approach for IPCWEs with calibrated weights under non-ignorable dropout. Simulation studies showed that IPCWEs using calibrated weights performed uniformly better than IPCWEs using weights estimated by maximum likelihood, including in settings with model misspecification. It was also shown that bootstrap and jackknife CIs based on calibrated weights performed well, but CIs based on the sandwich variance estimator and calibrated weights were conservative. Using the simple technique of fixing the initial set of weights before calibration to those from the original data made no difference to the coverage of bootstrap/jackknife CIs. This is particularly useful to speed up the computation when conducting sensitivity analyses since the analysis needs to be repeated for each set of values considered for the sensitivity parameters. The computational efficiency of the proposed sensitivity analysis approach, together with the better performance of the calibrated IPCWEs, will hopefully promote more widespread use of IPCW in practice.
The proposed methods can be extended to handle intermittent missingness. Vansteelandt et al.
17
and Wen and Seaman
18
have described sensitivity analysis approaches for non-monotone missingness using inverse probability weights without calibration. Their models can be used to estimate the initial weights before calibration. Then the calibration restriction in equation (6) can be modified to
In our simulation studies, we have demonstrated the better performance of the IPCWEs with calibrated weights than the IPCWEs with the MLE weights when the dropout model is misspecified. However, it would be interesting to investigate whether steps to reduce the risk of model misspecification when estimating the initial weights might improve the calibrated IPCWEs. Data adaptive methods are useful for this purpose. In addition, they might help to stabilize the calibrated weights, in light of the recently established connection between minimum dispersion approximate balance weights and penalized estimation of propensity scores using LASSO.
28
In future research, we will explore the method of sieves
29
for estimating the initial weights because it allows flexible data-adaptive estimation but retains the usual root-
Supplemental Material
sj-zip-2-smm-10.1177_09622802221090763 - Supplemental material for Sensitivity analysis for calibrated inverse probability-of-censoring weighted estimators under non-ignorable dropout
Supplemental material, sj-zip-2-smm-10.1177_09622802221090763 for Sensitivity analysis for calibrated inverse probability-of-censoring weighted estimators under non-ignorable dropout by Li Su, Shaun R Seaman and Sean Yiu in Statistical Methods in Medical Research
Supplemental Material
sj-zip-3-smm-10.1177_09622802221090763 - Supplemental material for Sensitivity analysis for calibrated inverse probability-of-censoring weighted estimators under non-ignorable dropout
Supplemental material, sj-zip-3-smm-10.1177_09622802221090763 for Sensitivity analysis for calibrated inverse probability-of-censoring weighted estimators under non-ignorable dropout by Li Su, Shaun R Seaman and Sean Yiu in Statistical Methods in Medical Research
Footnotes
Acknowledgements
The authors thank Dr. John Hanly and the SLICC group for providing the SLICC inception cohort data.
Declaration of conflicting interests
The authors declare no potential conflicts of interest with respect to the research, authorship, and publication of this article.
Funding
This research was funded by UKRI Medical Research Council [Unit programme numbers: MC_UU_00002/8 and MC_UU_00002/10].
Supplemental material
Supplemental materials include the R code for the simulation studies in Section 3 and the R Markdown files for a tutorial of implementing the proposed methods to a simulated dataset.
References
Supplementary Material
Please find the following supplemental material available below.
For Open Access articles published under a Creative Commons License, all supplemental material carries the same license as the article it is associated with.
For non-Open Access articles published, all supplemental material carries a non-exclusive license, and permission requests for re-use of supplemental material or any part of supplemental material shall be sent directly to the copyright owner as specified in the copyright notice associated with the article.