
Abstract
Multi-state models provide an extension of the usual survival/event-history analysis setting. In the medical domain, multi-state models give the possibility of further investigating intermediate events such as relapse and remission. In this work, a further extension is proposed using relative survival, where mortality due to population causes (i.e. non-disease-related mortality) is evaluated. The objective is to split all mortality in disease and non-disease-related mortality, with and without intermediate events, in datasets where cause of death is not recorded or is uncertain. To this end, population mortality tables are integrated into the estimation process, while using the basic relative survival idea that the overall mortality hazard can be written as a sum of a population and an excess part. Hence, we propose an upgraded non-parametric approach to estimation, where population mortality is taken into account. Precise definitions and suitable estimators are given for both the transition hazards and probabilities. Variance estimating techniques and confidence intervals are introduced and the behaviour of the new method is investigated through simulations. The newly developed methodology is illustrated by the analysis of a cohort of patients followed after an allogeneic hematopoietic stem cell transplantation. The work has been implemented in the
1 Introduction
Multi-state models provide a framework for simultaneously analyzing competing events and sequences of events. In the medical field, these models help to study the impact of intermediate events on the prognosis of patients, and allow to estimate separate probabilities of death with and without the intermediate event at multiple time horizons. Interest can also be in distinguishing between deaths due to the studied disease and its treatment (excess mortality) and deaths due to other (population) causes. This is of particular interest in an older patient population where the risk of dying due to other causes is high and may considerably contribute to the overall proportion of deaths. However, cause of death is often not reported, 1 unreliable2,3 or cannot unequivocally be attributed to the disease or other causes.
Our motivating example comes from the study of outcomes for patients after an allogeneic hematopoietic stem cell transplantation (alloHCT) for myelodysplastic syndromes (MDSs) or secondary acute myeloid leukemia (sAML). 4 Patients with these indications represent the oldest major patient population referred to alloHCT with a median age of 58 years at alloHCT (registry data from 2012). These patients are at significant risk for two competing failures: relapse of the underlying disease and non-relapse mortality (NRM), which for a large part is due to the transplantation and pre-treatment. The occurence of relapse leads to a very poor prognosis. We investigated the contribution of population mortality to both death after relapse (DaR) and NRM. This enabled us to estimate the probability of excess NRM, which especially for older patients and for long-term outcomes may provide a better estimate for treatment-related mortality than all NRM. The current paper discusses and extends the model introduced in that paper.
When reliable information on causes of death is not available in the medical data, one needs to address this issue using external data. This is the core idea of the relative survival field
5
: the observed data is merged with general population mortality tables
6
to indirectly enable the estimation of cause-specific hazards and probabilities.7,8 In this work, we extend the ideas of the relative survival methodology to a Markov time-inhomogeneous multi-state model where we focus on non-parametric estimation of transition hazards and probabilities. We provide a theoretical foundation, a study of behaviour of the methods under different scenarios and a software implementation in
These measures have also been the focus of the relative survival field, which has seen considerable development in the last decade.5,9,10 With the generalisation to multi-state models, a new level of complexity is added. The main contribution of this paper is to discuss which measures may be of main interest in this setting and how to estimate them. We propose estimators for cumulative hazards and transition probabilities and study their properties, including their (asymptotic) variances. To the best of our knowledge, this is the first extension of relative survival to non-parametric estimation in a Markov multi-state model, whereas other semi-parametric11–13 or parametric14,15 approaches have already been proposed. An extensive simulation study of properties of the estimators in terms of bias, standard error and coverage probability for confidence intervals (CIs) has thus been performed. The simulation study is also the first (as to our knowledge) to extensively investigate the behaviour of different confidence interval methods for non-parametric multi-state models.
The article is structured as follows: in Section 2, we present the main theoretical grounds of our work. In Section 3, we present simulation results by which this new approach is evaluated. In Section 4, we will reanalyze the motivating dataset to illustrate the behaviour and interpretation of the new model. This also serves as a step-by-step overview of how such an analysis can be performed in
2 Extended multi-state model integrating relative survival
We start by introducing the theoretical background of multi-state models and relative survival needed for our work in Sections 2.1 and 2.2. We then present our proposed extension in Section 2.3.
2.1 General multi-state model
A multi-state model is a stochastic process
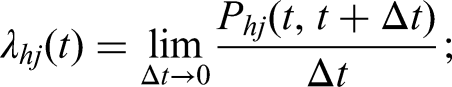
Transition probabilities are defined in the following way


From this, we can define transition hazards (or transition intensities) as the derivative of
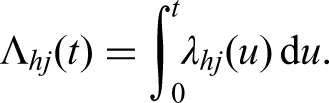

Both transition hazards and probabilities are of key interest for our work. In Figure 1, we introduce the multi-state model which will be used as the leading example in the article. In this model, all patients with a certain disease are alive at time zero and have no change of their underlying disease status (e.g. relapse). From the starting state they can then experience two competing risks: relapse (an intermediate event) or death (i.e. non-relapse mortality, NRM; an absorbing state). Death can also occur after relapse. We call this state death after relapse (DaR) which is also an absorbing state. Thus, the model in Figure 1 is the usual illness-death model where the death state is split into two different states in order to distinguish the probabilities of dying before or after relapse (NRM and DaR, respectively). The two probabilities sum up to the total probability of dying. Although the intermediate event considered is relapse, any other relevant event could be considered, for example, recurrence, progression, adverse event, additional treatment, or recovery. In the following, we assume that each individual has the same censoring time for the different events for which they are at risk (which will typically differ between individuals), that all relapses before the individual censoring times are recorded in the dataset, and that the event times are observed exactly.
Transition diagram for the basic multi-state model.
This model contains the key features of a multi-state model: combinations of competing risks and series of events. All theory and the implementation in software discussed below are also valid when the model is extended with additional states. They also hold when individuals start in different states or are only observed after a certain timepoint (left-truncated observations).
We now turn to estimation. The Nelson-Aalen estimator is the common non-parametric estimator used for the cumulative transition hazard

For estimating the variance of the Nelson-Aalen estimator the Greenwood estimator is used, as commonly suggested in the literature16–19:


We point out that both the Nelson-Aalen and Aalen-Johansen estimator are consistent when the multi-state model is Markov. For a non-Markov process, the Nelson-Aalen estimator is also consistent.
20
We also note that by using the landmark Aalen-Johansen estimator, each
For estimating the variance of transition probabilities we can again use the Greenwood estimator. We denote it as
Here we have provided only the basic tools from multi-state models that are needed for this work; a more thorough and theoretical introduction can be found in previous work.23–25
2.2 Relative survival
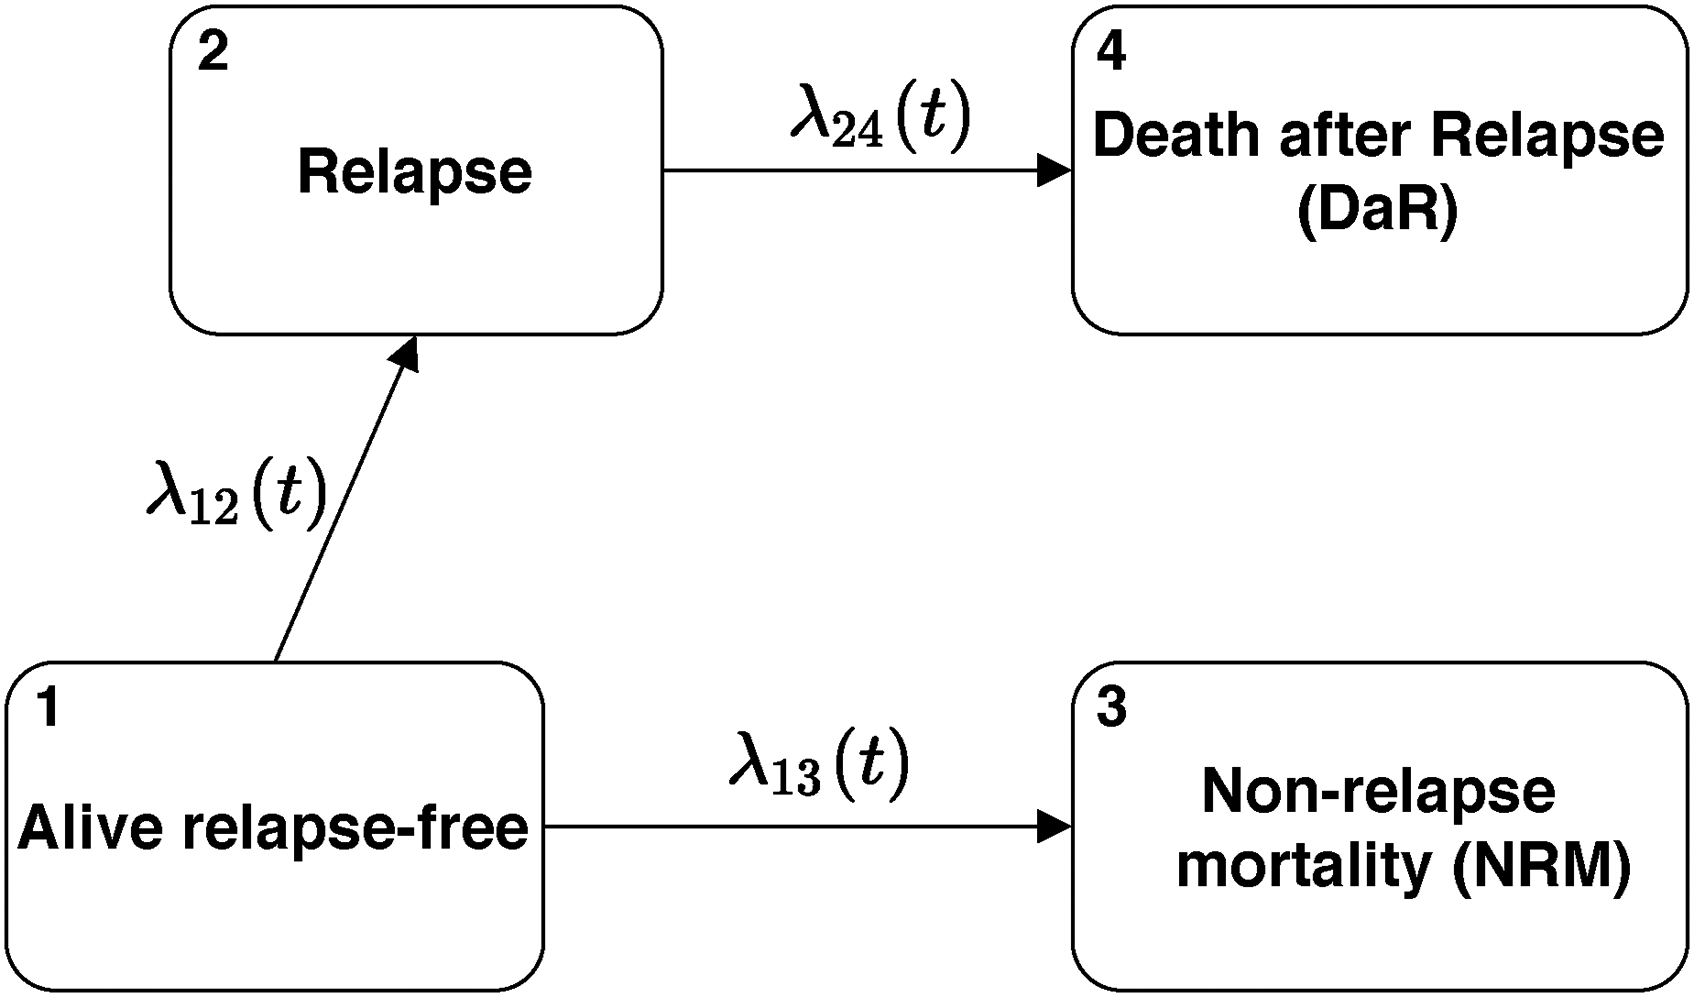
We will now introduce the main ideas of relative survival which are relevant for this work, using the basic survival setting where only one event (death) is reported in the data. Suppose we are interested in distinguishing between two causes of death—death due to the disease and its treatment and due to other (population) causes. To make this distinction we use population mortality tables as an additional source of information. Such mortality tables give hazards for every individual based on demographic covariates which have to be present both in the dataset and in the mortality tables (e.g. age, sex, year, country) to allow for proper matching. This enables us to evaluate the amount of deaths due to other (population) causes in the diseased population.
This information has to be appropriately incorporated in a model. We assume that the (observed) hazard of dying


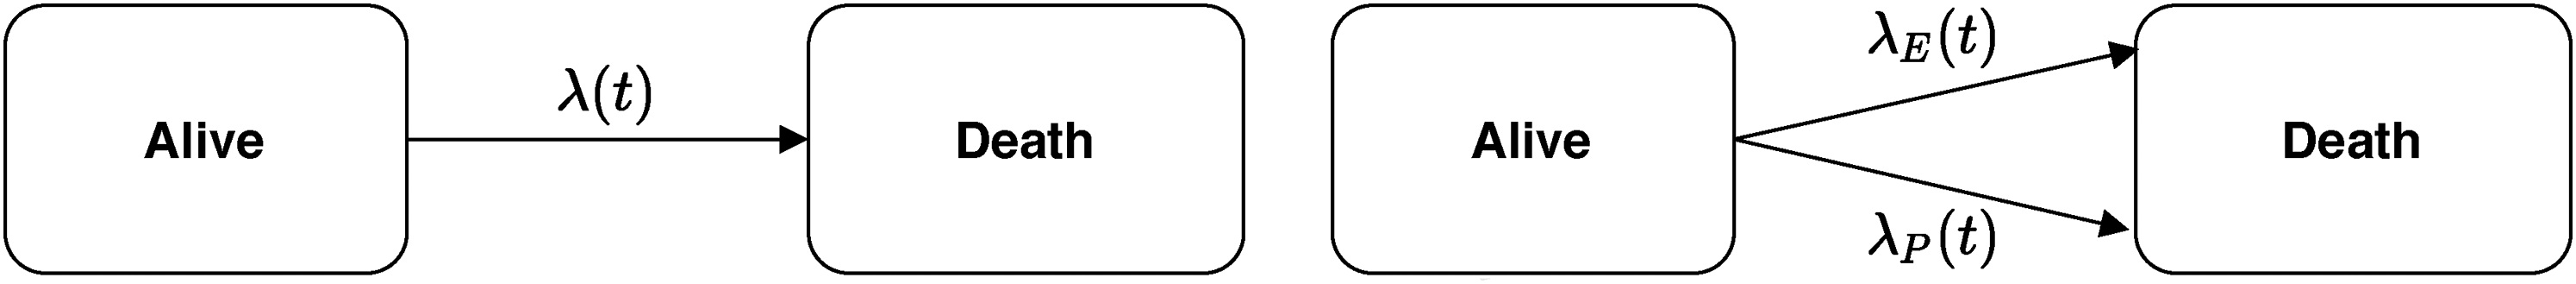
Illustration of the additive model given in formula (6).
The two hazards
It is important to note that in the definition of
The cumulative hazard

The estimator for the cumulative excess hazard

2.3 Extended multi-state model integrating relative survival
2.3.1 Estimation of hazards and probabilities
We will now extend this basic multi-state model presented in Section 2.1 with the relative survival approach introduced in Section 2.2. Thus, we will split death states in a multi-state model into excess and population counterparts. To better illustrate the idea, we will extend the example given in Figure 1. By matching the observed data with population mortality data, we would like to estimate the amount of population and excess deaths, both before and after the intermediate event. Such a model is illustrated in Figure 3—although the exact cause of death is not present in the dataset (the observed data are the same as before), we show two arrows and two additional death states by which we differentiate between excess and population death.
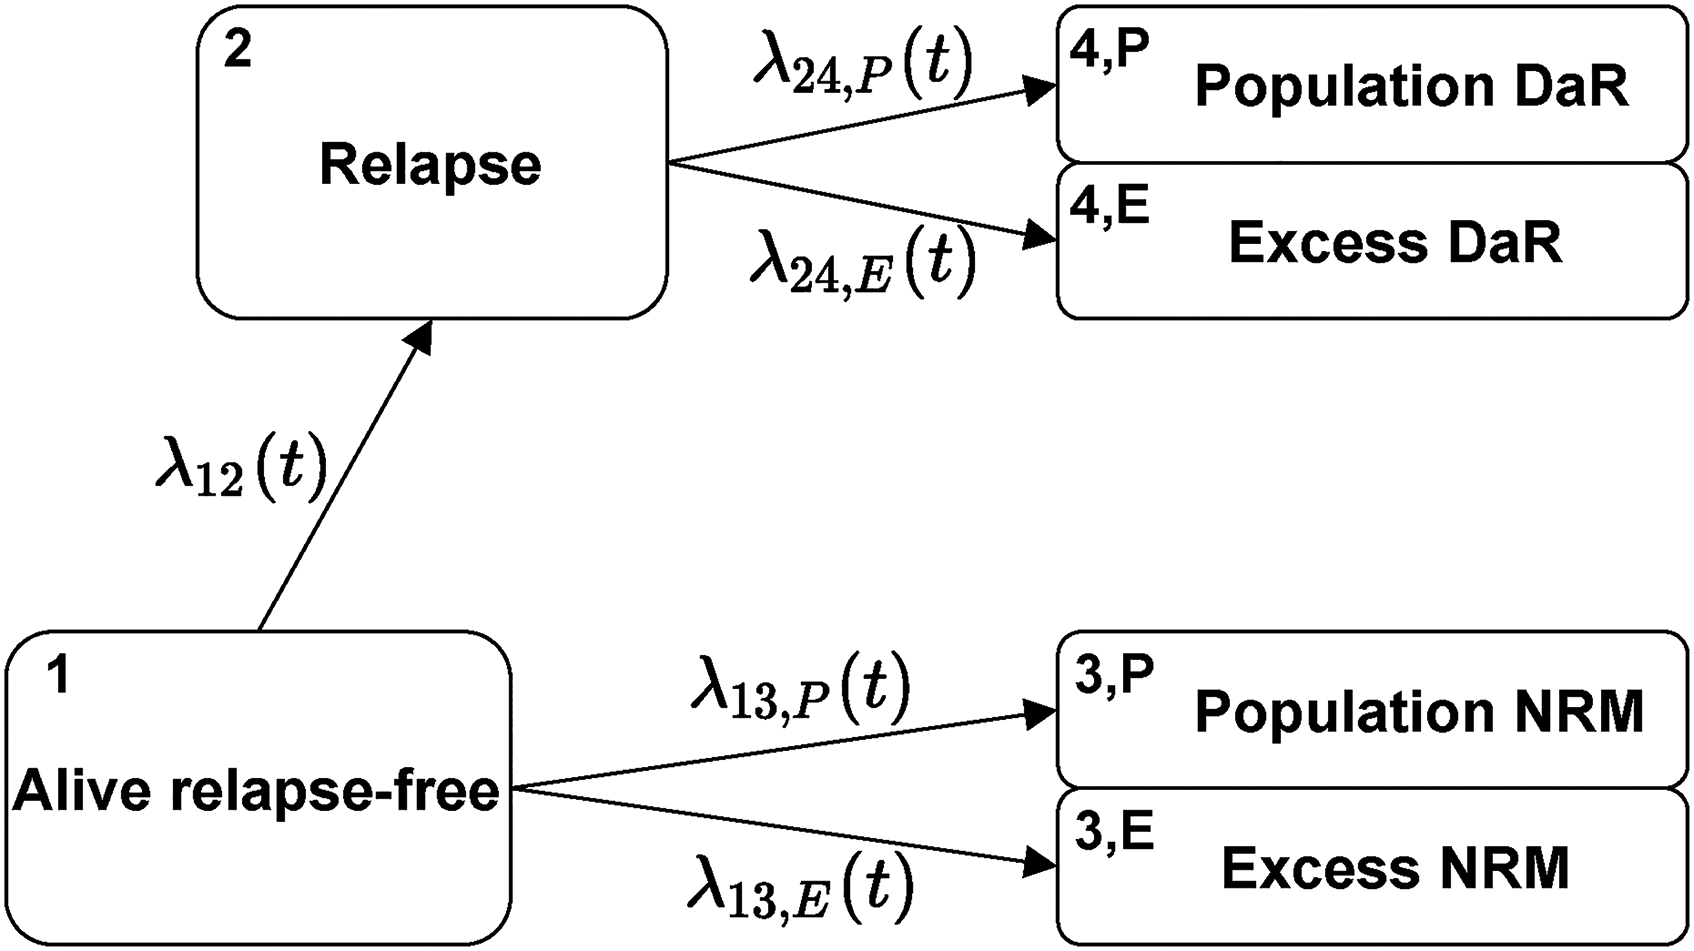
Transition diagram for the extended multi-state model.
We now discuss the quantities of interest and their estimation under this model. We start with the hazards. For transitions that do not reach death (e.g. the transition from Alive relapse-free to Relapse, see Figure 3), the hazard is the same as in the standard multi-state model (Figure 1). It can again be estimated by the Nelson-Aalen estimator (3). On the other hand, each transition reaching death is now split into two (compare transitions 2 and 3 in Figure 1 to the split transitions in Figure 3). The hazards for these transitions have the same form as in Section 2.2. The estimators follow from formulas (7) and (8) which we now write in general form. For a transition reaching death

We also examine some additional characteristics of the estimators
Having defined the estimates for transition hazards, we now turn to transition probabilities. Estimator
There are also other measures that are common in relative survival. One such measure is net survival. 5 However, it is questionable whether this measure is of interest for a multi-state model as its interpretation becomes less straightforward.
2.3.2 Variance estimation
We consider two approaches for estimating the variances of hazard and probability estimators—one based on the Greenwood estimator and the second one based on non-parametric bootstrap (simple resampling with replacement of individuals).
We start with transition hazards: for non-split transitions we use the usual Greenwood estimator (4) or bootstrap. To estimate the variances of the split hazards
Analogously, the variance of estimates for the transition probabilities is estimated using the Greenwood and bootstrap options.
2.3.3 CI methods
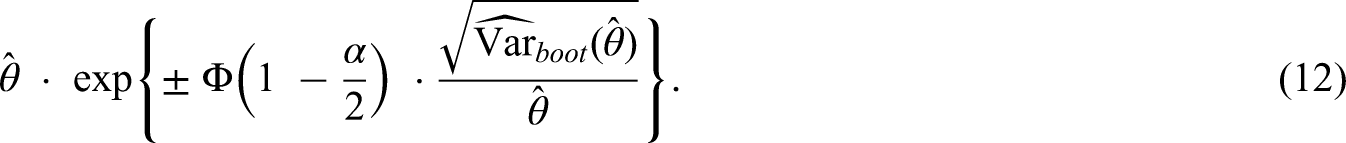
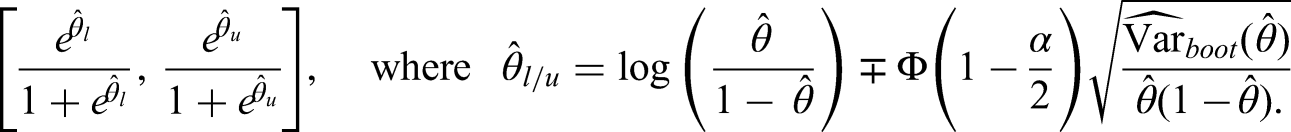
We consider CI methods for transition hazards and probabilities. Although the model of interest is still the model introduced in the previous subsection, the methods are general and can be applied in any non-parametric multi-state Markov model. We denote by (CI1) Plain scale using Greenwood (plain.G): a symmetrical (CI2) Plain scale using bootstrap (plain.boot): a symmetrical (CI3) Log scale using bootstrap (log.boot): a (CI4) Quantiles using bootstrap (q.boot): a We define two additional methods which we use for comparison with the previous four methods: (CI5) Logit scale using bootstrap (logit.boot): a (CI6) Complementary log-log using bootstrap (cloglog.boot): a


3 Simulations
We analyse the characteristics of the developed methodology presented in Section 2.3 through simulations. First, in Section 3.1, we introduce all details regarding how the simulations were performed and in Section 3.2, we present the results. All simulations were done in
3.1 Defining the simulation study
In this section, we present the aims, data-generating mechanisms, estimands, methods, and performance measures (i.e. ADEMP) used for simulation. These are reported as proposed in the tutorial by Morris et al. 31
3.1.1 Aims
Our main goal is to investigate how the newly proposed estimators for the extension of multi-state models with population mortality perform in a wide range of simulation scenarios. We will evaluate their bias, standard errors (SE) and coverage probabilities (CPs).
3.1.2 Data-generating mechanisms
Demographic variables We first have three event times for the following competing risks: relapse, population NRM, and excess NRM. In practice, we only observe NRM and relapse, but in the simulations we also generate the underlying population and excess times to death. If an individual reaches state relapse, times to population DaR and excess DaR are then simulated conditional on the time of relapse. All event times are simulated independently.
32
Times to death from population causes are simulated using population mortality tables for Slovenia (which are available in Remaining event times (time to relapse, excess NRM, and excess DaR) are simulated using In the simplest case, we take the hazard to be constant (i.e. we use the exponential distribution). In this case, the baseline hazard is constant and there are no covariate effects ( In some simulating scenarios, we take Weibull distributed event times for these transitions. In this case, Furthermore, we take simulation scenarios with a covariate effect (where Although we simulate event times for both population and excess transitions, only the minimum of these is included in the dataset as observed value. The generated times are then subjected to censoring. Censoring times are simulated from the exponential distribution. The rate parameter of the distribution is modified for every scenario such that approximately 20% of all individuals are censored at the end of follow-up time (
cov.eff.pos: we allow for a covariate effect for certain transitions, the baseline hazard is again constant. The covariate effects of age on the hazard of having excess NRM and relapse are positive. No covariate effect is taken for the hazard of having excess DaR. cov.eff.neg: we allow for a covariate effect for certain transitions, the baseline hazard is again constant. The covariate effect of age on the hazard of having excess NRM is positive, whereas on relapse it is negative. No covariate effect is taken for the hazard of having excess DaR.
Details on exact parameters can be found in the Supplemental Material. We additionally assess the impact of sample size on the estimators by varying sample size:
3.1.3 Estimands
Our main measures of interest are the transition hazards and probabilities of the multi-state model. All values are assessed at
Exact transition hazards and probabilities (the true values) were calculated by integrating with respect to the covariate distribution
3.1.4 Methods
We use the non-parametric approach outlined in Section 2.3 to estimate all transition hazards and probabilities, and we compare the performance of the variance estimators and the different CI methods.
3.1.5 Performance measures
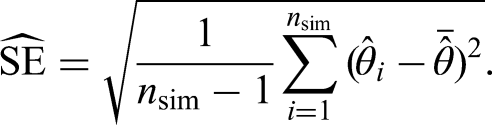
We also use the CP for calculating the number of replications
3.2 Results
3.2.1 Bias
Bias was negligible in all scenarios. Figure 4 shows the relative bias for cumulative transition hazards for all scenarios evaluated at the end of follow-up (
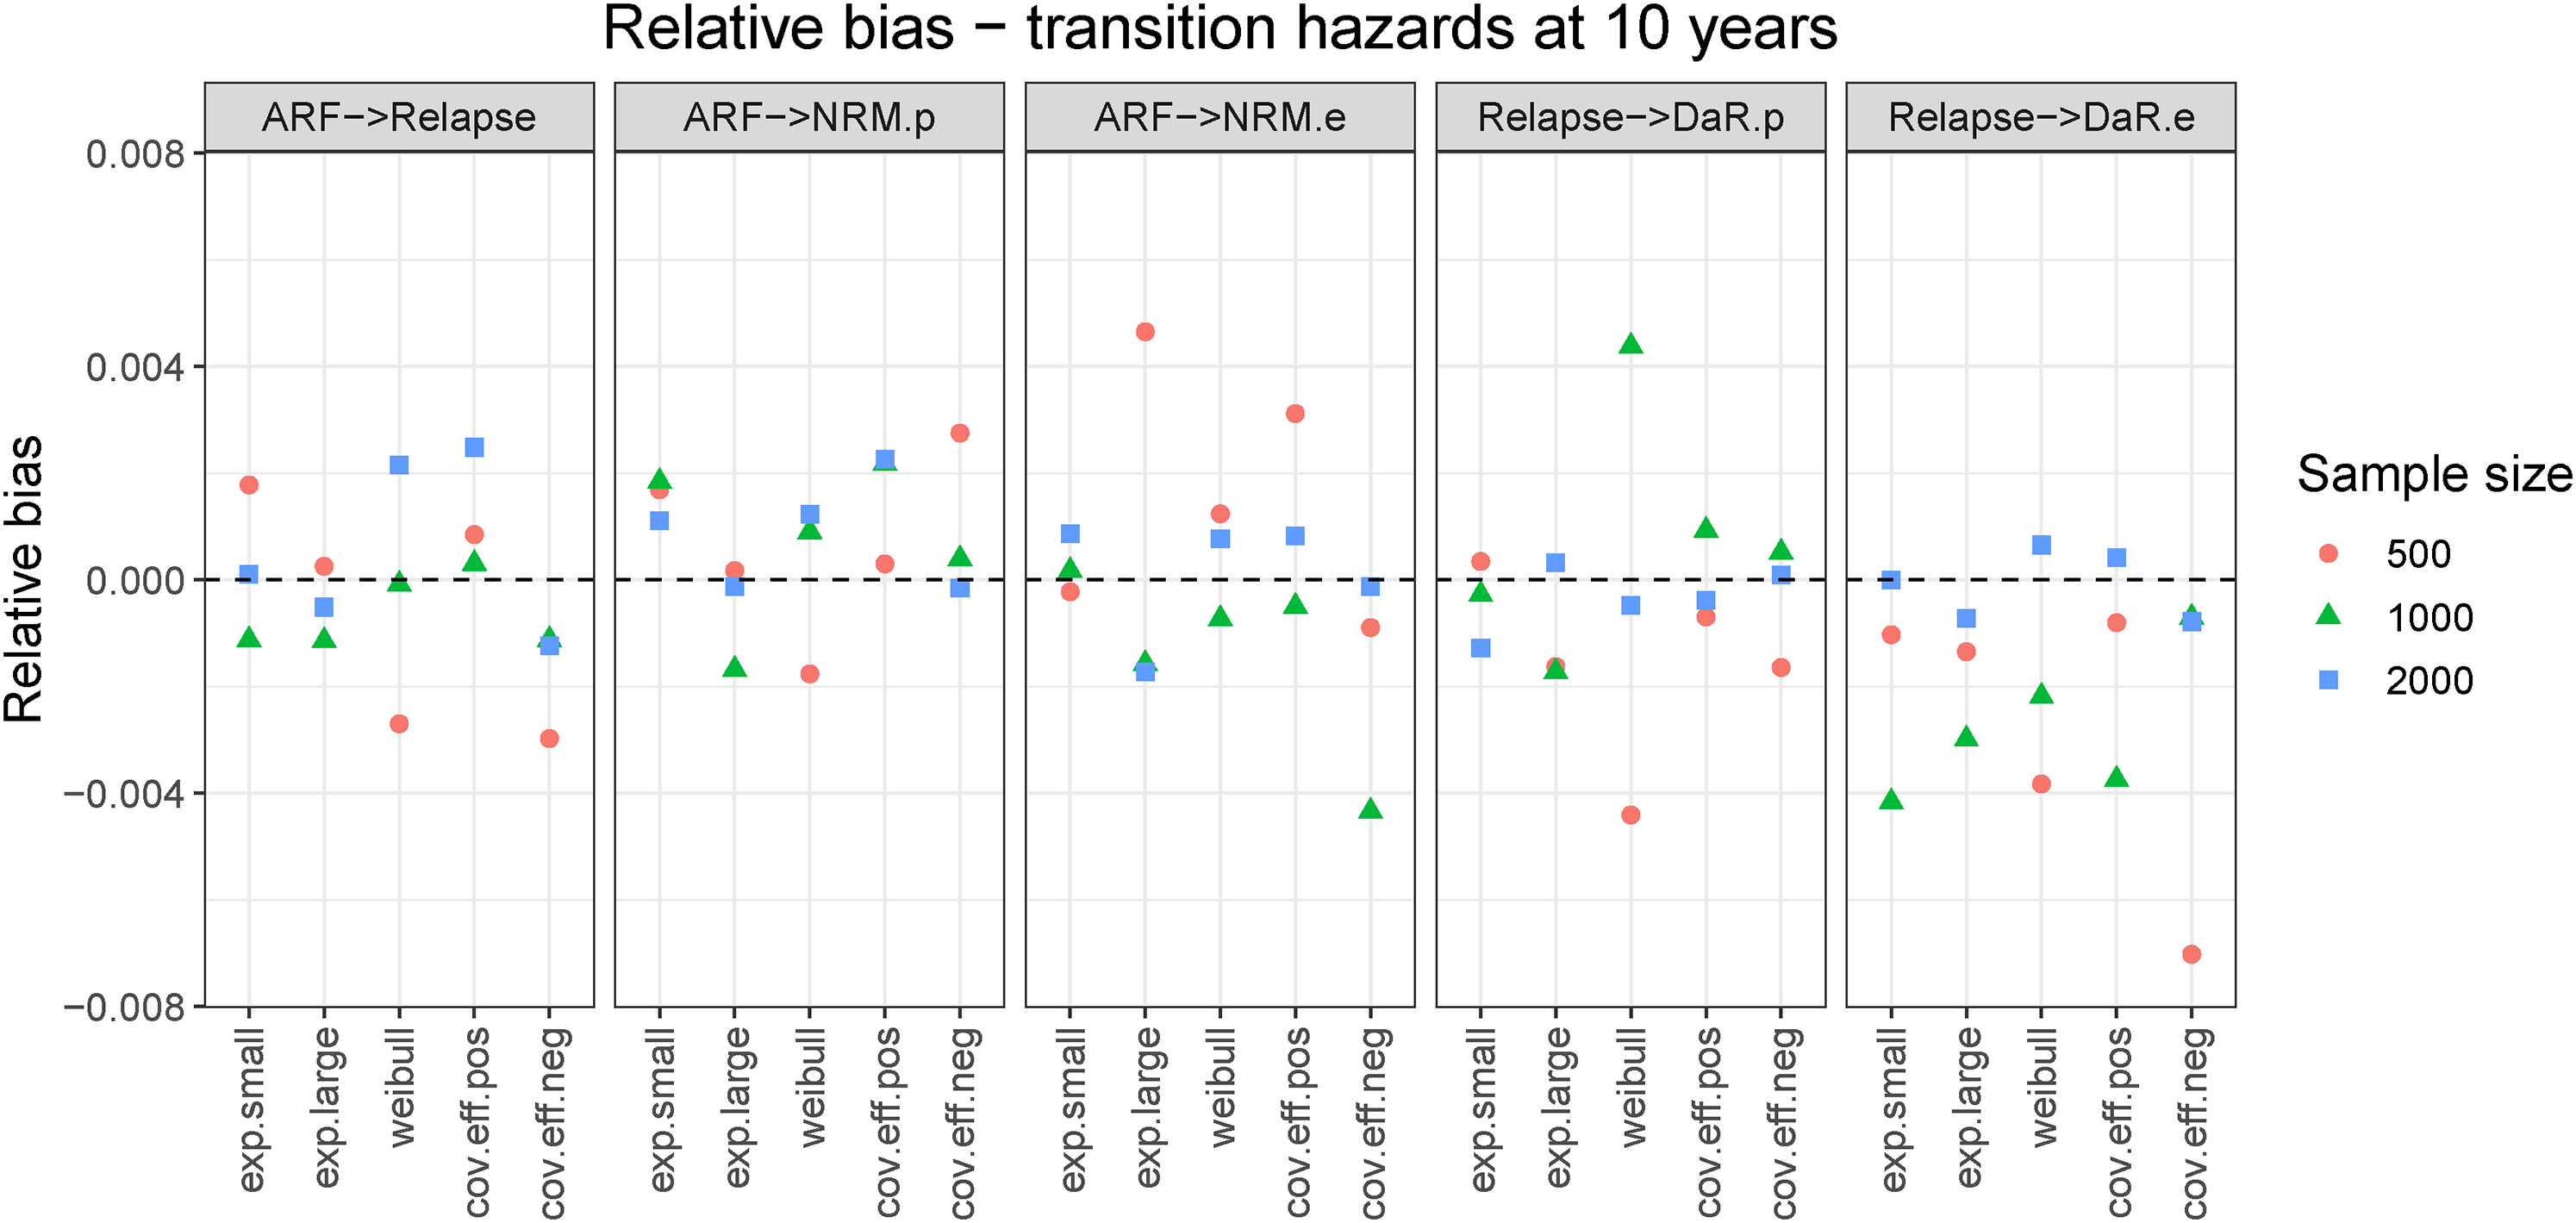
Relative bias for cumulative hazards evaluated at end of follow-up (
3.2.2 Standard errors
In Figure 5, we show SEs for scenario
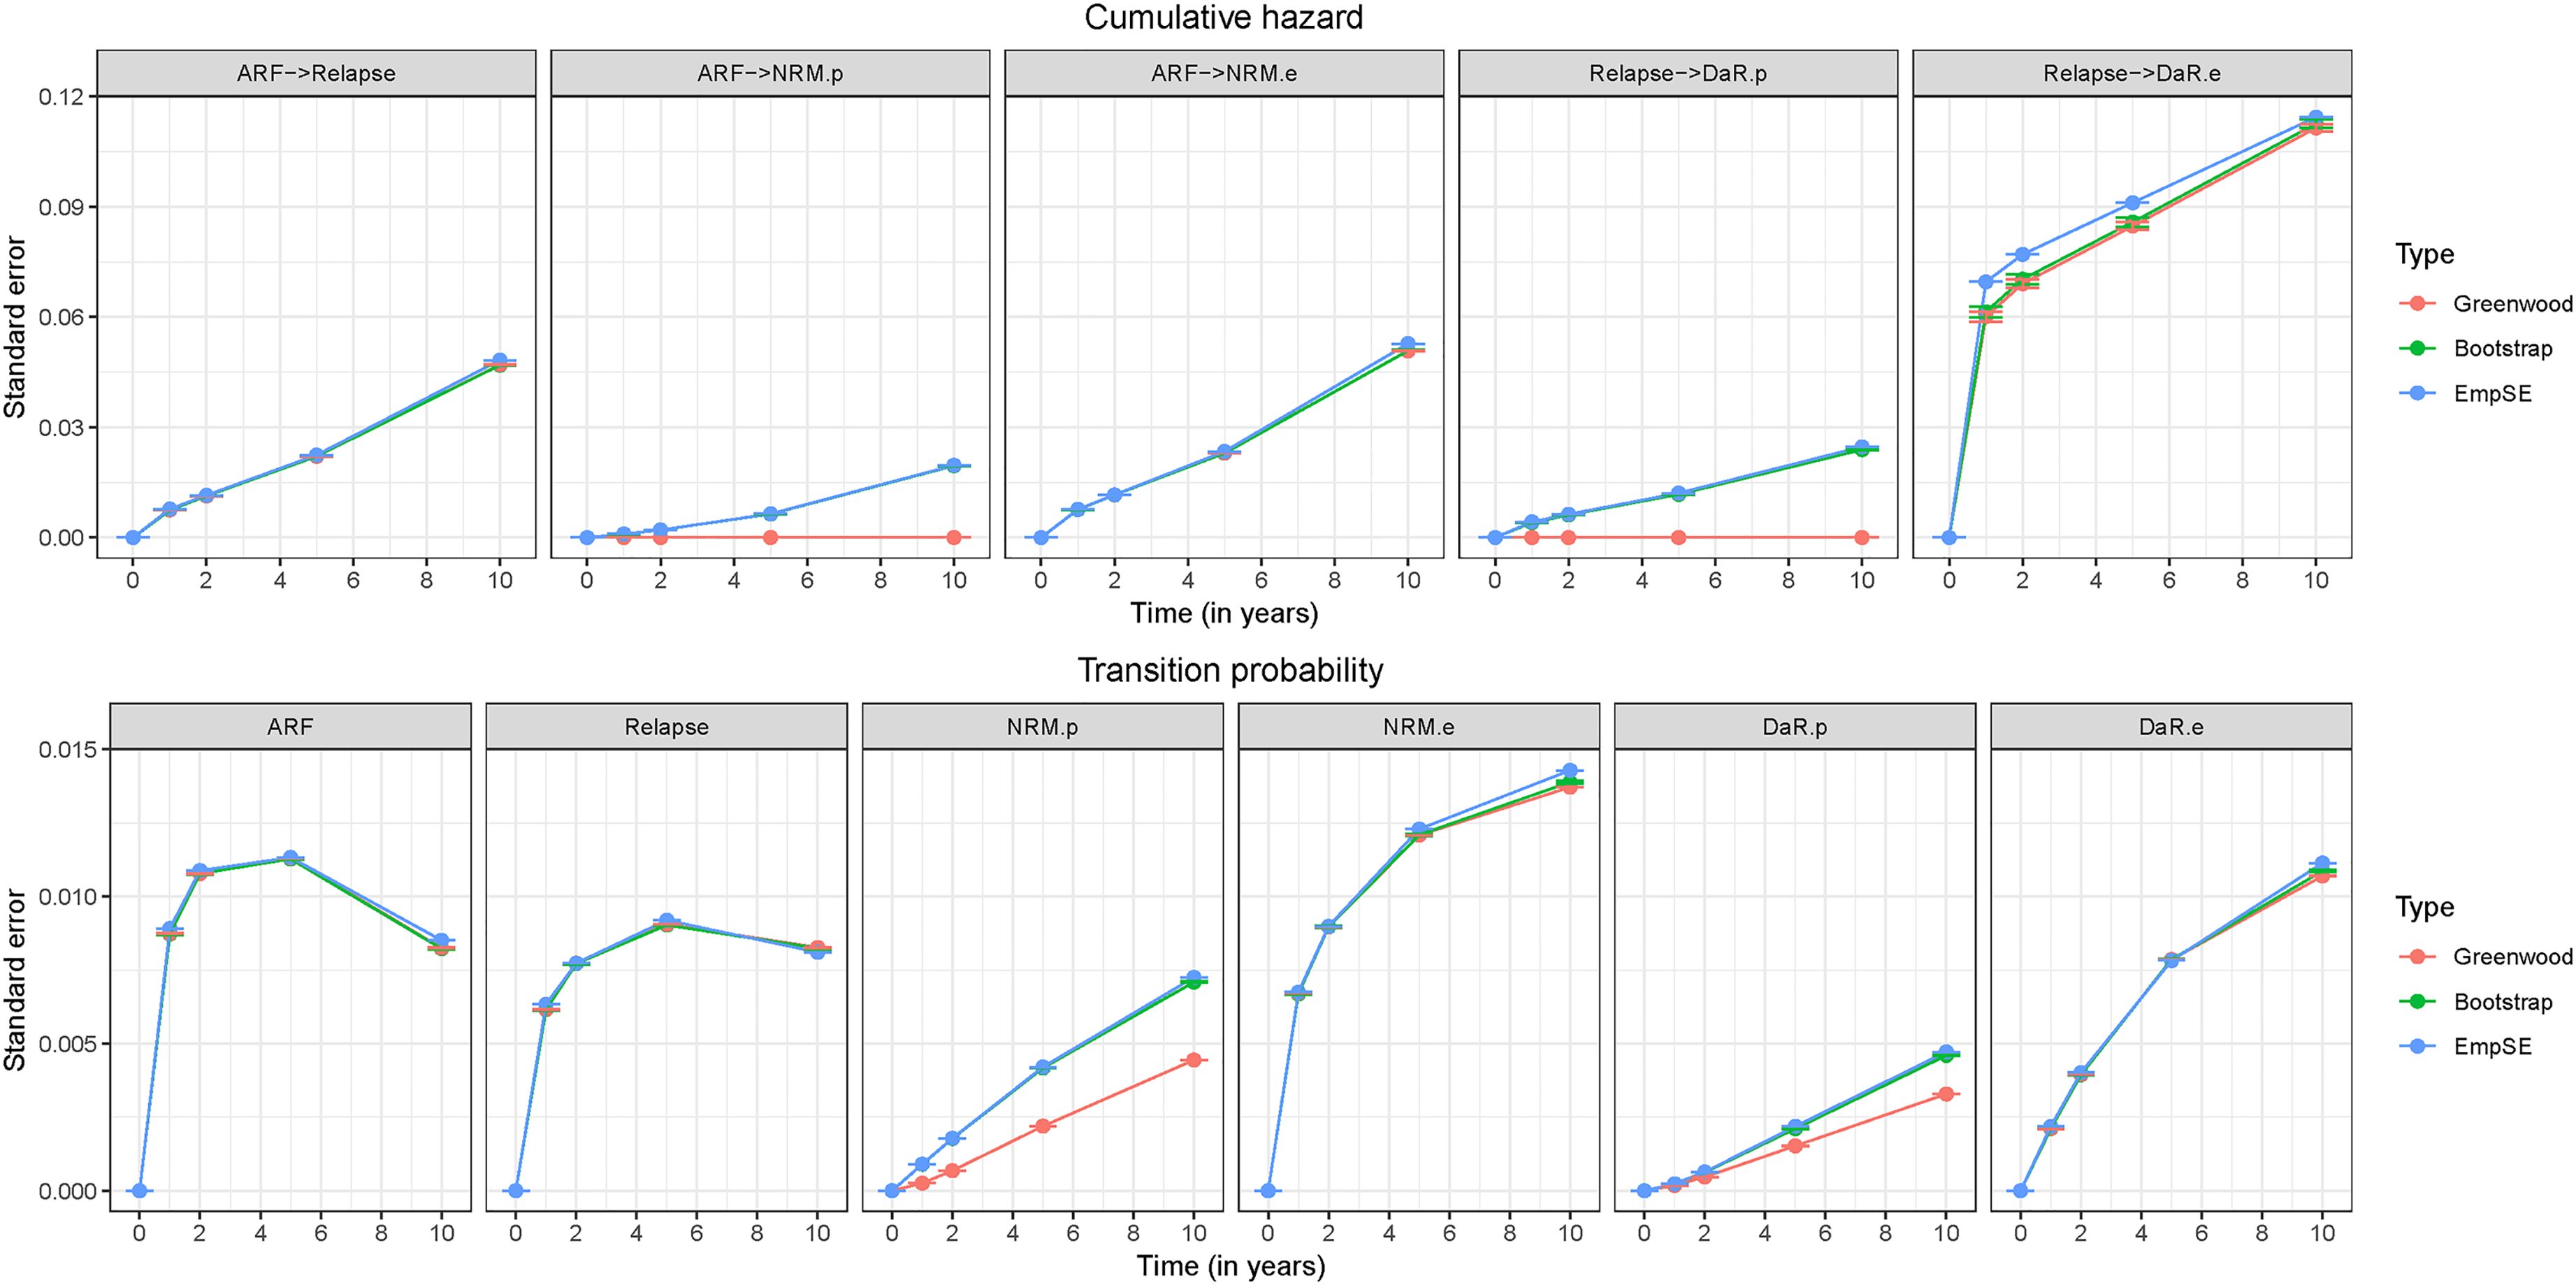
Standard erorrs for cumulative hazards and transition probabilities for scenario
When looking at the left-truncated transition going from relapse to excess DaR, we can see that both variance estimators for the cumulative hazards, Greenwood and bootstrap-based, gave evidently smaller SEs than the empirical SE. This occurred for all simulation scenarios. As further explained in Section S3 of the Supplemental Material, this phenomenon does not only appear for the extended multi-state model but is already present in a basic multi-state model for left-truncated transitions. Solving this problem is out of the scope of this paper.
For transition probabilities (Figure 5) both estimator options were close to the empirical SE, the population-related transitions being an exception. In this case, the bootstrap was again a reliable option. The SEs for population-related transition probabilities increased when the amount of population deaths increased.
We find the bootstrap-based method a reliable option for estimating variances for all transitions in the wide range of scenarios we have explored. For some simulation scenarios (those with a covariate effect) there was a small difference between the bootstrap estimate and the empirical SE for samples of size
We additionally compared the SEs for the split transitions to the SEs for the observed transitions. In most cases, the empirical SEs for the observed transitions were very similar to the ones for the excess-related transitions. This has been proven to hold asymptotically for transition hazards, that is,
3.2.3 Confidence intervals
The SEs relative to the cumulative hazards and transition probabilities are small in either estimation approach. To additionally evaluate how well the two variance estimators (Greenwood and bootstrap) perform, we use CPs. Figure 6 shows CPs for transition probabilities at the end of follow-up. An equivalent graph for transition hazards is shown in the Supplemental Material (Figure S5). On average, CPs were more stable and closer to the nominal value for transition probabilities than for hazards. By increasing the sample size the CPs also tended to increase and stay close to the nominal value (results not shown).
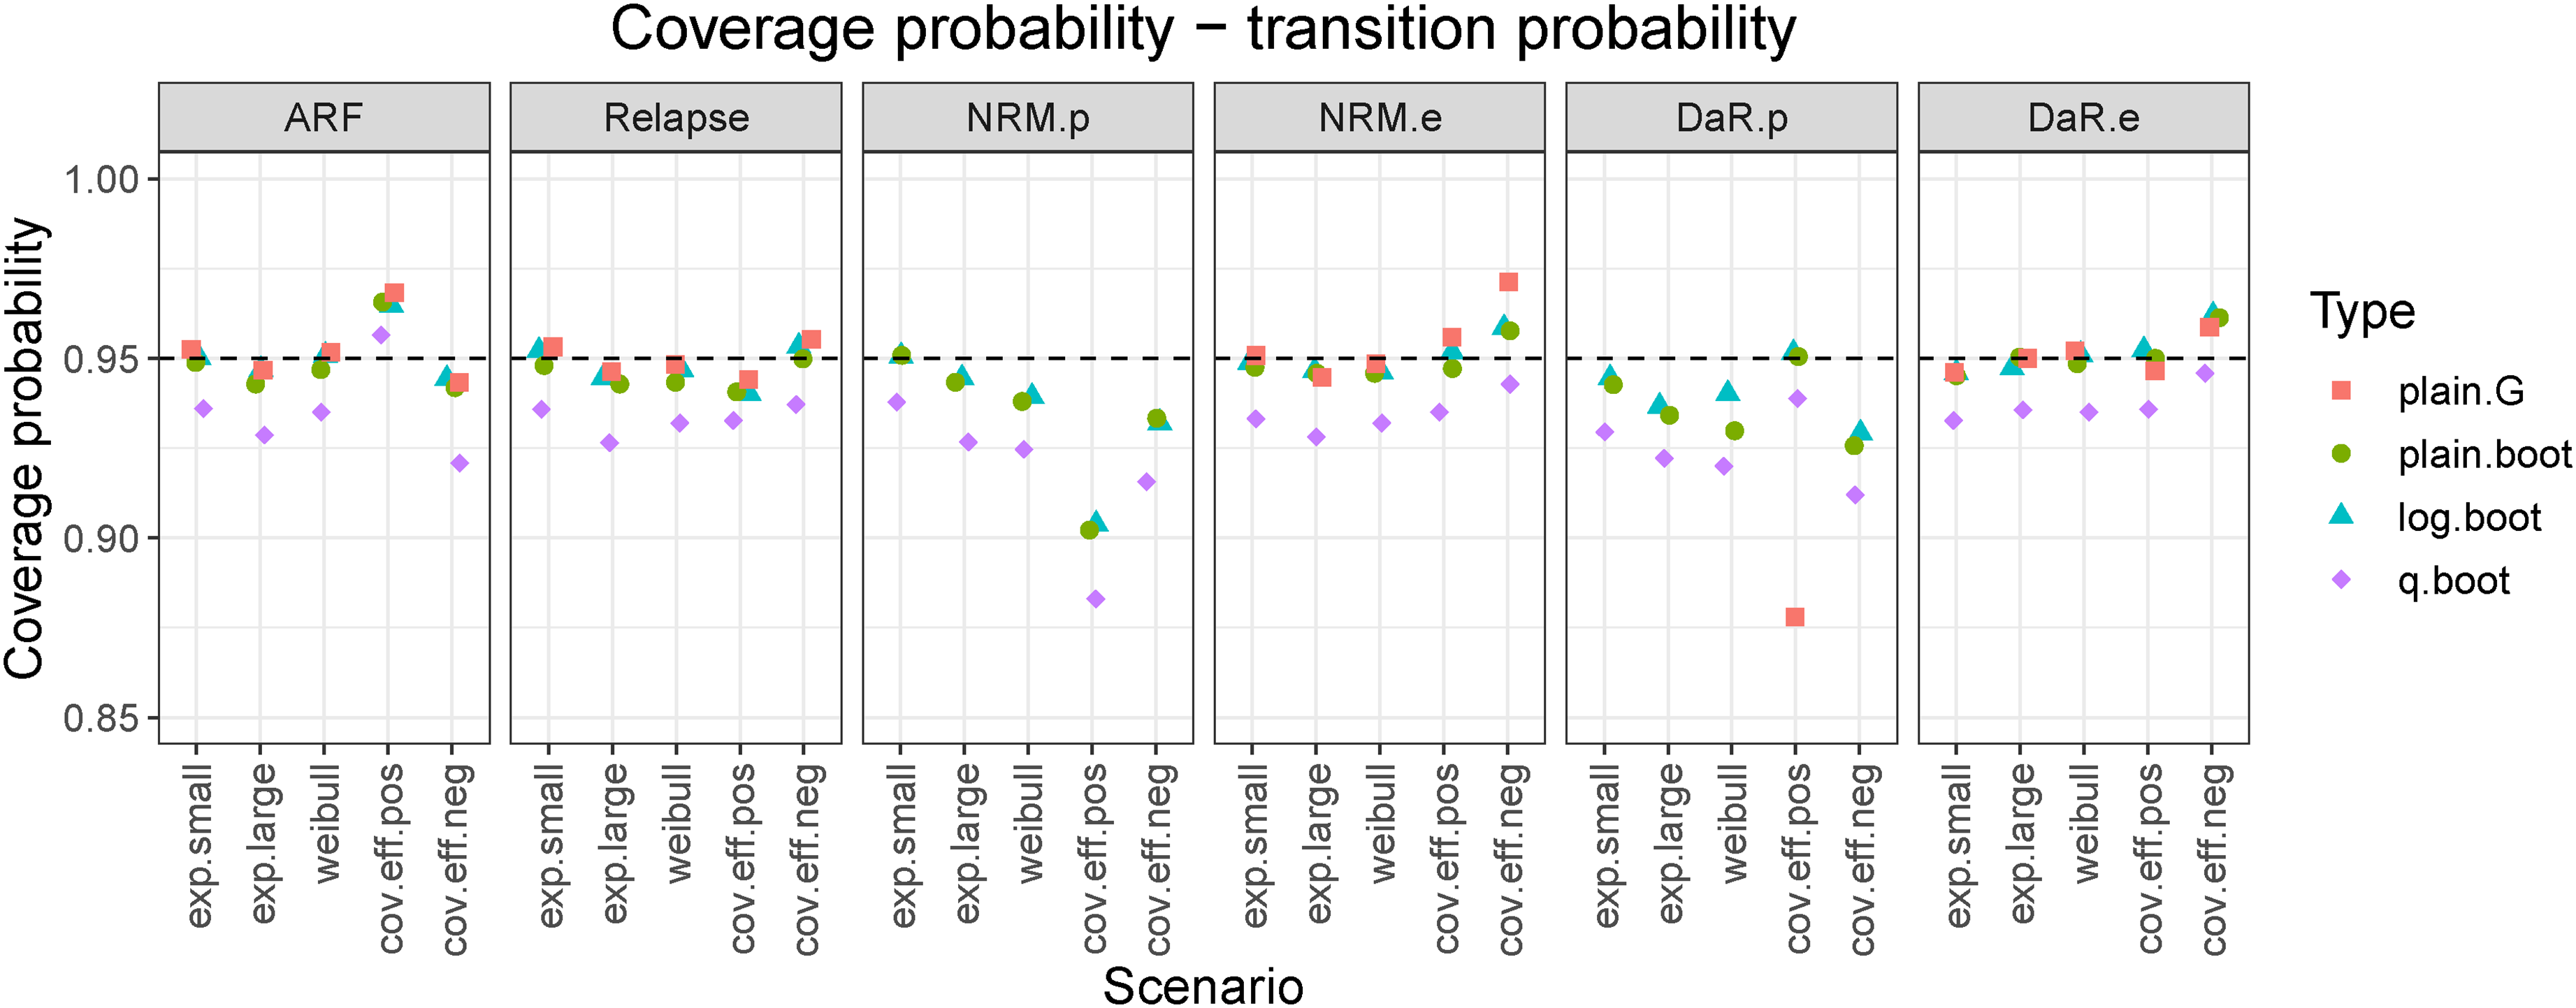
Coverage probabilities for transition probabilities evaluated at the end of follow-up (
In almost all cases,
The
However, there were cases where even
4 Illustration
The new methodology is briefly illustrated by a reanalysis of previously presented data, 4 which is taken as a motivating example in this article. The study population consisted of patients who had received a first allogeneic hematopoietic stem cell transplantation (alloHCT) for MDS or sAML between January 2000 and December 2012 and were recorded in the registry of the EBMT. 34 Further details on the selection criteria, patient characteristics and outcomes are available in the motivational paper. 4
Patients were followed since alloHCT and possible outcomes were relapse/progression (for the remainder of this section we call this relapse) or death where we again distinguish between NRM and DaR. Thus, a multi-state model with a transition diagram as shown in Figure 1 is applicable, which can be further extended as shown in Figure 3. To better illustrate the usefulness of the methodology proposed, a subsample from the original dataset was taken, only including patients aged
Figure 7 shows the estimated cumulative hazards (left graph) and transition probabilities (right graph) for the extended multi-state model, whereas in the Supplemental Material, these estimated values are shown with the corresponding CIs, see Figures S7 and S8. The huge cumulative hazard of excess DaR is a sign of the very poor prognosis after relapse. The cumulative hazard of experiencing relapse is for most of the time slightly larger than the cumulative hazard of excess NRM. The hazards for the population-related transitions are very similar, their difference only caused by the different composition of the risk sets in terms of demographic variables in the states ARF and Relapse.
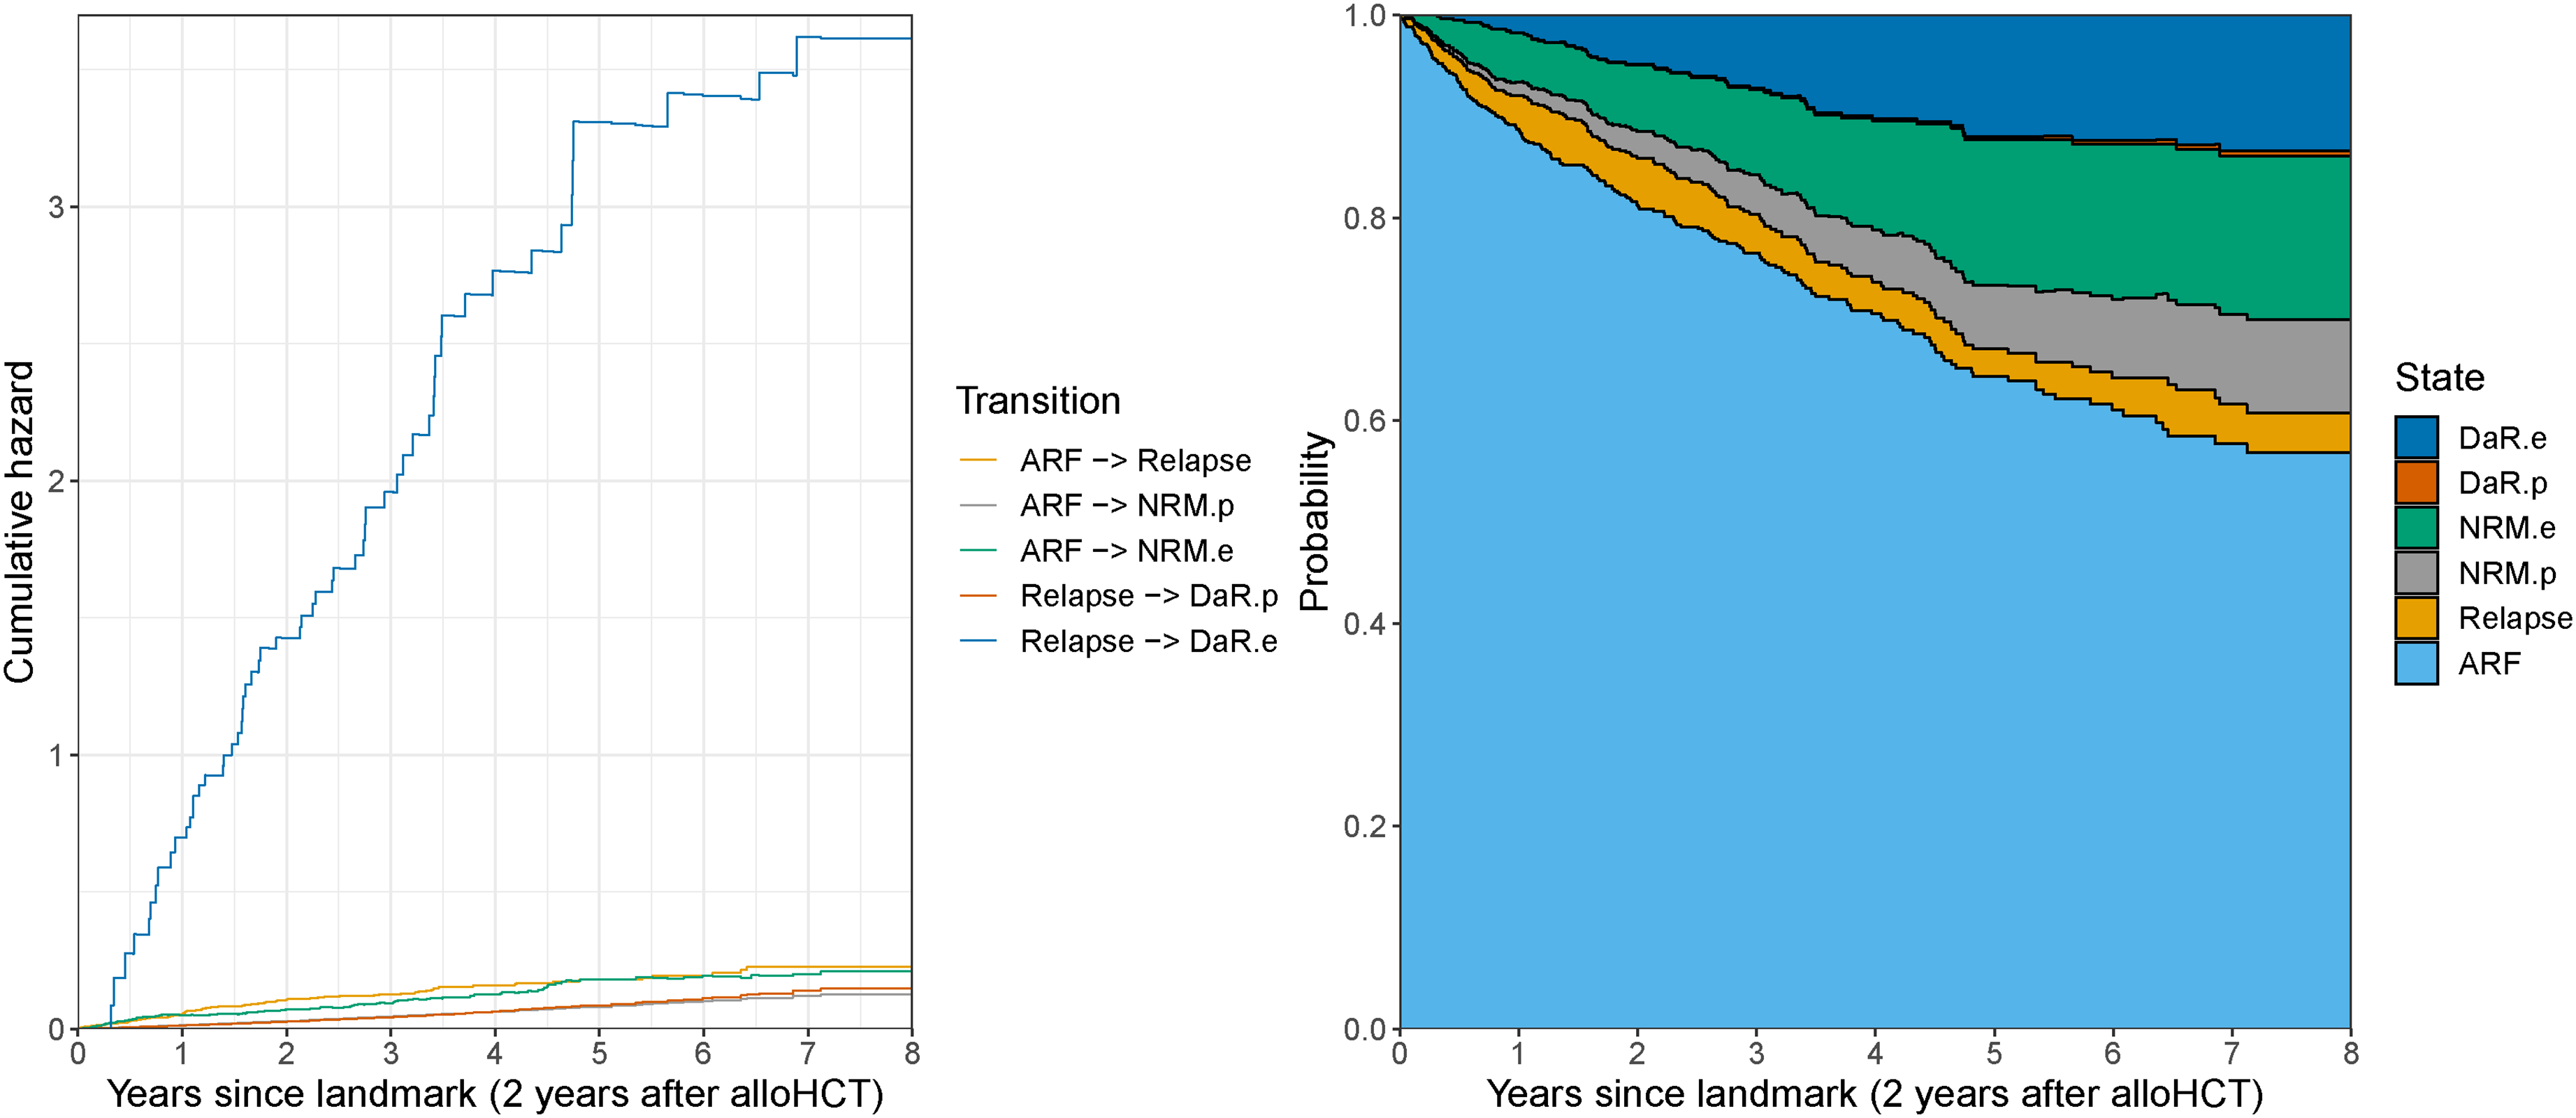
Estimated cumulative hazards (left) and transition probabilities (right) for patients 65 years or older at alloHCT and alive relapse-free at the 2-year landmark time estimated in the EBMT dataset (as introduced in Section 4). Estimates provided up to
The transition probabilities (right graph in Figure 7) provide additional insight into the outcomes of the transplanted patients. The probability of being alive and relapse-free steadily decreases through time and reaches a probability of 56.9% (95%
The clinical interpretation of these results is that DaR is almost identical to death due to relapse. In the past, only young patients were referred for alloHCT. For these younger patients (below the age of 60 years at the time of alloHCT) NRM is almost exclusively treatment-related mortality (where treatment refers both to the alloHCT and to other treatments before and after). Yet age at HCT has continuously increased in the past decades, and the presumption that NRM equals treatment-related mortality is not valid for the older transplanted population. In our example, this is demonstrated by the fact that
The
5 Discussion
In this paper, we have introduced an extension of a multi-state model containing death states where the exact cause of death is not known. We were able to account for death by other (population) causes in such a model using external population mortality tables. The relative survival theory has allowed for such an extension where we have solely focused on non-parametric estimation in a Markov setting. Thus, we have successfully integrated the basic relative survival idea (of splitting a death state in excess and population counterparts) in a general multi-state framework for any transition reaching death.
The present work focuses on transition hazards (through which the extension has been done) and transition probabilities, the latter being more easily interpretable for a non-statistical audience. The proposed estimators are defined in such a way that the information from mortality tables is properly taken into account. Based on our simulation study we can conclude that as expected, estimation bias is very minor.
By using the extended multi-state model we also have to assume the additive model (equation (6)) for all split transitions. Thus, in order for the excess hazard to be a proper hazard, it needs to be positive across the whole time interval. There are many practical settings where this does not hold 35 because the population under study has a better life expectancy than the general population, for example, because primarily patients with a more robust general health might survive certain diagnoses. If the model is still applied even though it does not really hold, negative cumulative hazards and transition probabilities are obtained, which could still give a useful message, if interpreted with caution. In such a case, negative cumulative hazards can only be obtained for excess-related transitions which then affect the transition probabilities of the excess and population death states.
Throughout the paper, we only split transitions to death states. However, the methods (together with the software implementation) allow transitions reaching intermediate events to be split as well. In this case, we would need adequate population tables for those specific transitions. For example, if we want to examine if patients with an autoimmune disease run a larger risk of a COVID-19 infection and death thereafter than the general population, a model could be developed with starting state diagnosis, intermediate event COVID-19 infection and absorbing states death before and after COVID-19 infection. Based on observed data for a cohort of these patients and population tables for the hazard of infection by COVID-19 and death after infection, the transition to the intermediate event could be split into a population and an excess part and similarly the transition from infection to death after infection could be split. A different example is available 15 where a model for Hodgkin lymphoma patients with a disease of the circulatory system (DCS) as an intermediate event is considered.
The present work has concentrated on non-parametric estimation of transition hazards, from which the relevant transition probabilities and state occupation probabilities can be derived. Covariates like age and sex have only been used for providing the correct population hazards. A next natural step would be to incorporate covariates in the estimation of the (excess) transition hazards. The most common approach is the Cox proportional hazards model, which has been used in multi-state models 24 and in relative survival. 36 Modeling by additive hazards is also an attractive alternative, 37 since the distinction between population and excess hazards for a particular transition is also additive, and the subsequent machinery of calculating transition probabilities from the transition hazards also involves addition of the transition hazards. Other modeling approaches have been also considered in previous literature.11–15
The suggested theory only uses a small part of the field of relative survival; it does not consider any other relative survival measures, for example, net survival or the relative survival ratio, and their extension to a general multi-state model. We leave this point for further research. We note that the crude probability of death (a common measure in relative survival) has its analogon in the split transition probabilities
As in any multi-state model, one has to carefully check the Markov assumption when modeling.
38
For a general multi-state model, there can be intermediate states for which the Markov assumption does not hold. One such example would be if the transition hazard of reaching DaR from relapse is dependent on the duration time in the relapse state. Estimation for Markov renewal models where transition hazards depend on the duration time has been previously discussed.
39
Since for Markov renewal models the relevant time scale is time since entry into the current state the population hazard in equation (9) can still be used, but times
For estimating the variance of the proposed measures, we suggest the bootstrap approach which was a suitable option in most of the simulation scenarios. The Greenwood estimator was also considered as a closed-form estimator. This required the additional assumption for the variance estimates of the population-related transition hazards to be equal to
An additional problem with variance estimation of left-truncated transitions has been also pointed out (and further illustrated in the Supplemental Material). This problem is inherent to a basic multi-state model already and is out of the scope of this paper but can be tackled in future work.
In the simulation study, we have also considered CI methods. The
All work has been implemented in
To conclude, we believe that the proposed extension of a non-parametric multi-state model could find its use in a wide range of practical applications. Especially for interventions encompassing potential long-term beneficial and adverse effects offered to older patients with a remaining life-expectancy of several years or even a decade, taking into account population mortality as part of the different components of mortality is relevant. In this paper, we have mostly focused on the theoretical aspects of this work. By conducting a thorough simulation study, we have further understood the properties of the estimators and come across additional challenges, some of which have to be dealt with in the future (e.g. variance estimation for left-truncated transitions, a theoretical variance estimator for population-related transitions, an improved CI method). We have devised an
Supplemental Material
sj-cls-1-smm-10.1177_09622802221074156 - Supplemental material for Integrating relative survival in multi-state models—a non-parametric approach
Supplemental material, sj-cls-1-smm-10.1177_09622802221074156 for Integrating relative survival in multi-state models—a non-parametric approach by Damjan Manevski, Hein Putter, Maja Pohar Perme, Edouard F Bonneville, Johannes Schetelig and Liesbeth C de Wreede in Statistical Methods in Medical Research
Supplemental Material
sj-bst-2-smm-10.1177_09622802221074156 - Supplemental material for Integrating relative survival in multi-state models—a non-parametric approach
Supplemental material, sj-bst-2-smm-10.1177_09622802221074156 for Integrating relative survival in multi-state models—a non-parametric approach by Damjan Manevski, Hein Putter, Maja Pohar Perme, Edouard F Bonneville, Johannes Schetelig and Liesbeth C de Wreede in Statistical Methods in Medical Research
Supplemental Material
sj-R-3-smm-10.1177_09622802221074156 - Supplemental material for Integrating relative survival in multi-state models—a non-parametric approach
Supplemental material, sj-R-3-smm-10.1177_09622802221074156 for Integrating relative survival in multi-state models—a non-parametric approach by Damjan Manevski, Hein Putter, Maja Pohar Perme, Edouard F Bonneville, Johannes Schetelig and Liesbeth C de Wreede in Statistical Methods in Medical Research
Supplemental Material
sj-R-4-smm-10.1177_09622802221074156 - Supplemental material for Integrating relative survival in multi-state models—a non-parametric approach
Supplemental material, sj-R-4-smm-10.1177_09622802221074156 for Integrating relative survival in multi-state models—a non-parametric approach by Damjan Manevski, Hein Putter, Maja Pohar Perme, Edouard F Bonneville, Johannes Schetelig and Liesbeth C de Wreede in Statistical Methods in Medical Research
Supplemental Material
sj-RData-5-smm-10.1177_09622802221074156 - Supplemental material for Integrating relative survival in multi-state models—a non-parametric approach
Supplemental material, sj-RData-5-smm-10.1177_09622802221074156 for Integrating relative survival in multi-state models—a non-parametric approach by Damjan Manevski, Hein Putter, Maja Pohar Perme, Edouard F Bonneville, Johannes Schetelig and Liesbeth C de Wreede in Statistical Methods in Medical Research
Supplemental Material
sj-RData-6-smm-10.1177_09622802221074156 - Supplemental material for Integrating relative survival in multi-state models—a non-parametric approach
Supplemental material, sj-RData-6-smm-10.1177_09622802221074156 for Integrating relative survival in multi-state models—a non-parametric approach by Damjan Manevski, Hein Putter, Maja Pohar Perme, Edouard F Bonneville, Johannes Schetelig and Liesbeth C de Wreede in Statistical Methods in Medical Research
Footnotes
Acknowledgements
We thank the EBMT Data Office in Leiden for providing the MDS dataset.
Authors' note
Johannes Schetelig and Liesbeth C de Wreede, Clinical Trials Unit, DKMS, Dresden, Germany.
Declaration of conflicting interests
The author(s) declared no potential conflicts of interest with respect to the research, authorship and/or publication of this article.
Funding
Damjan Manevski is a young researcher funded by the Slovene Research Agency (ARRS). The authors acknowledge the financial support by ARRS (Methodology for data analysis in medical sciences, P3-0154 and project J3-1761).
Supplemental material
Supplemental material for this article is available online.
References
Supplementary Material
Please find the following supplemental material available below.
For Open Access articles published under a Creative Commons License, all supplemental material carries the same license as the article it is associated with.
For non-Open Access articles published, all supplemental material carries a non-exclusive license, and permission requests for re-use of supplemental material or any part of supplemental material shall be sent directly to the copyright owner as specified in the copyright notice associated with the article.