
Abstract
Functional regression has been widely used on longitudinal data, but it is not clear how to apply functional regression to microbiome sequencing data. We propose a novel functional response regression model analyzing correlated longitudinal microbiome sequencing data, which extends the classic functional response regression model only working for independent functional responses. We derive the theory of generalized least squares estimators for predictors’ effects when functional responses are correlated, and develop a data transformation technique to solve the computational challenge for analyzing correlated functional response data using existing functional regression method. We show by extensive simulations that our proposed method provides unbiased estimations for predictors’ effect, and our model has accurate type I error and power performance for correlated functional response data, compared with classic functional response regression model. Finally we implement our method to a real infant gut microbiome study to evaluate the relationship of clinical factors to predominant taxa along time.
Keywords
1. Introduction
Microbiome is inherently dynamic in nature, attributing to the presence of interactions among microbes, microbes and the host, and with the environment. Researchers have shown that the microbiome can be altered over time, either transiently or long term, by infections or medical interventions such as antibiotics1–3. Recent advances in high-throughput experimental technologies are enabling researchers to measure dynamic behaviors of the microbiota at a large scale4–6.
Comprehensive analyses of the microbiota over time provide insights into essential questions about microbiome dynamics, for example, how microbiome composition changes through infection/antibiotics and do changes in the microbiome cause or increase susceptibility and risk of certain diseases. Longitudinal data provides more information than single time point data because temporal information creates an inherent ordering in microbiome samples, and thereby they exhibit statistical dependencies that are a function of time7–9. These features enable discovery of rich information about microbiome data, including short and long-term trends. Therefore, it is imperative to analyse longitudinal microbiome studies for risk prediction. However, one of the major challenge with longitudinal microbiome data is the presence of uneven number of timepoints along the longitudinal timeline of different subjects 10 , making it necessary for the use of appropriate computational techniques to address this issue.
To investigate factors associated with longitudinal microbiome composition, functional regression can be implemented, which considers longitudinal microbiome data as a continuous function for each subject. Functional regression is a well-developed method which has been used to model longitudinal data in different contexts. Morris 11 gave a comprehensive review on functional regression. There are a few reasons for choosing functional regression on longitudinal microbiome data. First, by modeling longitudinal data as continuous functions, uneven number of timepoints becomes not a problem. Next, depending on the research question, it may be more intuitive to consider microbiome data as function of time rather than discrete samples at single timepoints, so that the change patterns of microbiome dynamics can be illustrated by functional estimations. Last but not least, if there are large number of timepoints being observed, the predictor space can be at a very high dimension, where the traditional regression methods may become infeasible; in functional regression, the large number of timepoints becomes beneficial because it helps improving the estimation accuracy of the functional microbiome data for each subject.
However, to our best knowledge, the functional regression approach has not been implemented on microbiome sequencing data so far. Microbiome composition, which are usually quantified by operational taxonomic units (OTUs), may exhibit correlations between multiple OTUs 12 . The primary challenge in functional regression is to measure between-function OTU correlations. When considering the timepoints as discrete rather than functional, several different methods have been proposed in current literature to model multiple correlated OTUs. Briefly speaking, these methods can be categorized in three types. The most commonly used method is mixed effects model, which adds correlations of dependent variables by random effects13–17. Secondly, Dirichlet multinomial (DM) distribution and its extensions have been used to model the multivariate OTU data18–22. Lastly, the OTU correlations can be directly modeled by Generalized Estimating Equation (GEE) approach 6 .
There are three types of functional regression models in general: scalar-on-function, function-on-scalar and function-on-function. For analyzing longitudinal microbiome data, we focus on the second type, where longitudinal microbiome data is modeled as functional response and predictors are time-invariant scalars. There has been only limited methodology developments in current literature considering for correlated functional responses when performing function-on-scalar regression. Functional mixed effects model is a common solution23–26, but similar to the classic mixed effects model on scalar responses, the curve level random effects may only induce a positive correlation, while the OTU correlations can be both positive and negative 12 . Thus, the functional mixed effects model may not be appropriate for microbiome composition data.
In this paper, we focus on developing a novel functional regression model with correlated functional responses. Instead of using random effects to account for OTU correlations, correlation structure between multiple OTUs is constructed allowing for both positive and negative correlations, and accordingly we can model the correlated functional responses by generalized least squares estimations. In Section 2, We present the theoretical estimation of predictors’ functional effects when functional responses are correlated. Based on our developed theory, we then propose a data transformation method on both predictors and functional responses data, so that our model can be implemented computationally effective in practice. In Section 3, we check the unbiasedness of predictors’ effects estimation and statistical testing accuracy of our proposed model by simulation studies, and compare it with classic functional response regression model assuming independent functional responses. In Section 4, we apply our model to a real microbiome sequencing data with longitudinal measures. We finally discuss the limitations and further extensions of our method in Section 5.
2. Methodology
2.1 Functional regression theory overview
In functional data analysis, the functional data needs to be represented by linear combination of a finite number of known independent basis functions. The most commonly used basis functions are B-splines, Fourier series, principle components and wavelets 11 . Different functional regression methods were proposed in existing literature with each type of these basis functions27–29,24. In this paper, we focus on extending the classic functional response regression model using B-spline basis introduced by Ramsay and Silverman 27 to correlated functional response data. Additional works are required for modeling correlated functional responses under other basis representations.
The classic functional response regression assumes independent functional responses and estimates predictors’ effects by ordinary least squares estimations 27 . As the functional microbiome data may be correlated, we extend the classic estimation framework to generalized least squares estimations with a correlation matrix added in estimating equations representing OTU correlations. The idea of using generalized least squares estimations for correlated functional data has been implemented to estimate within-function correlations (correlations between timepoints) 30 . In Section 2.2, we use the similar idea but propose a novel correlated functional response regression model which estimates the predictors’ effects in theory after accounting for the between-function OTU correlations.
2.2 Correlated functional response regression model
Suppose the OTU data consists of

The functional data

In contrast to the regression spline smoothing which depends on the number of basis functions selected, spline smoothing by roughness penalties fix the number of basis to be
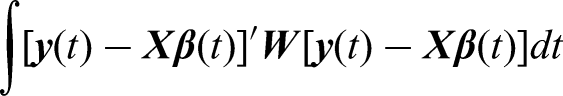
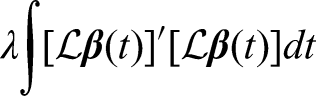
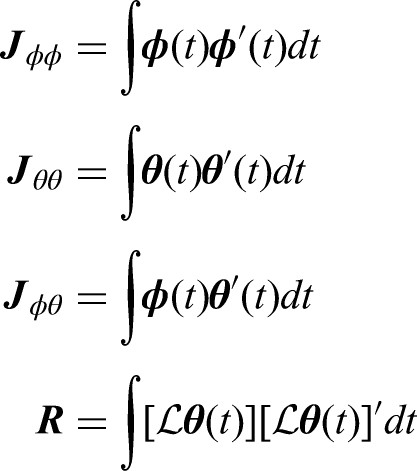
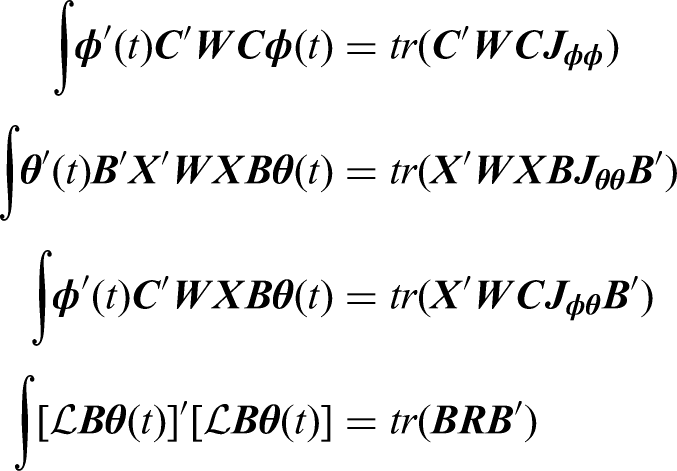
To estimate


2.3 Eliminating correlation by Cholesky decomposition
When the correlation matrix
We apply Cholesky decomposition to


Although our proposed transformation method does not directly estimate
2.4 Estimating correlation matrix
We showed in Section 2.2 that the estimating equation for correlated functional response regression model depends on correlation matrix
The GEE approach may provide different estimations of
In order to achieve the unbiased estimation, it needs to be noted that
The resulting estimator
3. Simulation
Firstly, simulation studies are designed to evaluate the unbiasedness of
In our simulation settings, we generate a dataset with sample size
Although the OTU correlations are assumed to be time invariant in our model, it may not be always true in practice. Thus, in addition to specifying a constant correlation (0.3 and -0.3) in simulation settings, we also specify the true correlations to be unequal at 10 timepoints, where
To check the unbiasedness of

Next, we check the type I error for testing

Comparison of type I error performance based on 10000 replications when the true OTU correlation is constantly 0.3, -0.3 or unequal (ranging from 0.05 to 0.5) at 10 timepoints,

Table 1 shows that testing
It needs to be noted that the permutation test adjustment cannot achieve accurate type I errors under classic functional response model when OTU correlations are present. The motivation behind permutation test is to adjust for the timepoints correlation rather than correlation between functional responses. Because the correlation between continuous timepoints is unknown, analytical form of the test statistics may not be available. With permutation test adjustment, type I errors are accurate if the functional responses are independent, regardless of the correlation between any timepoints. In our simulation, we apply permutation tests to both the classic functional response and correlated functional response model. As shown in Table 1, the classic functional response model can still have inaccurate type I errors due to OTU correlations. The OTU correlations need to be calibrated by Cholesky decomposition using our correlated functional response regression model.
Finally, we evaluate the power performance for testing
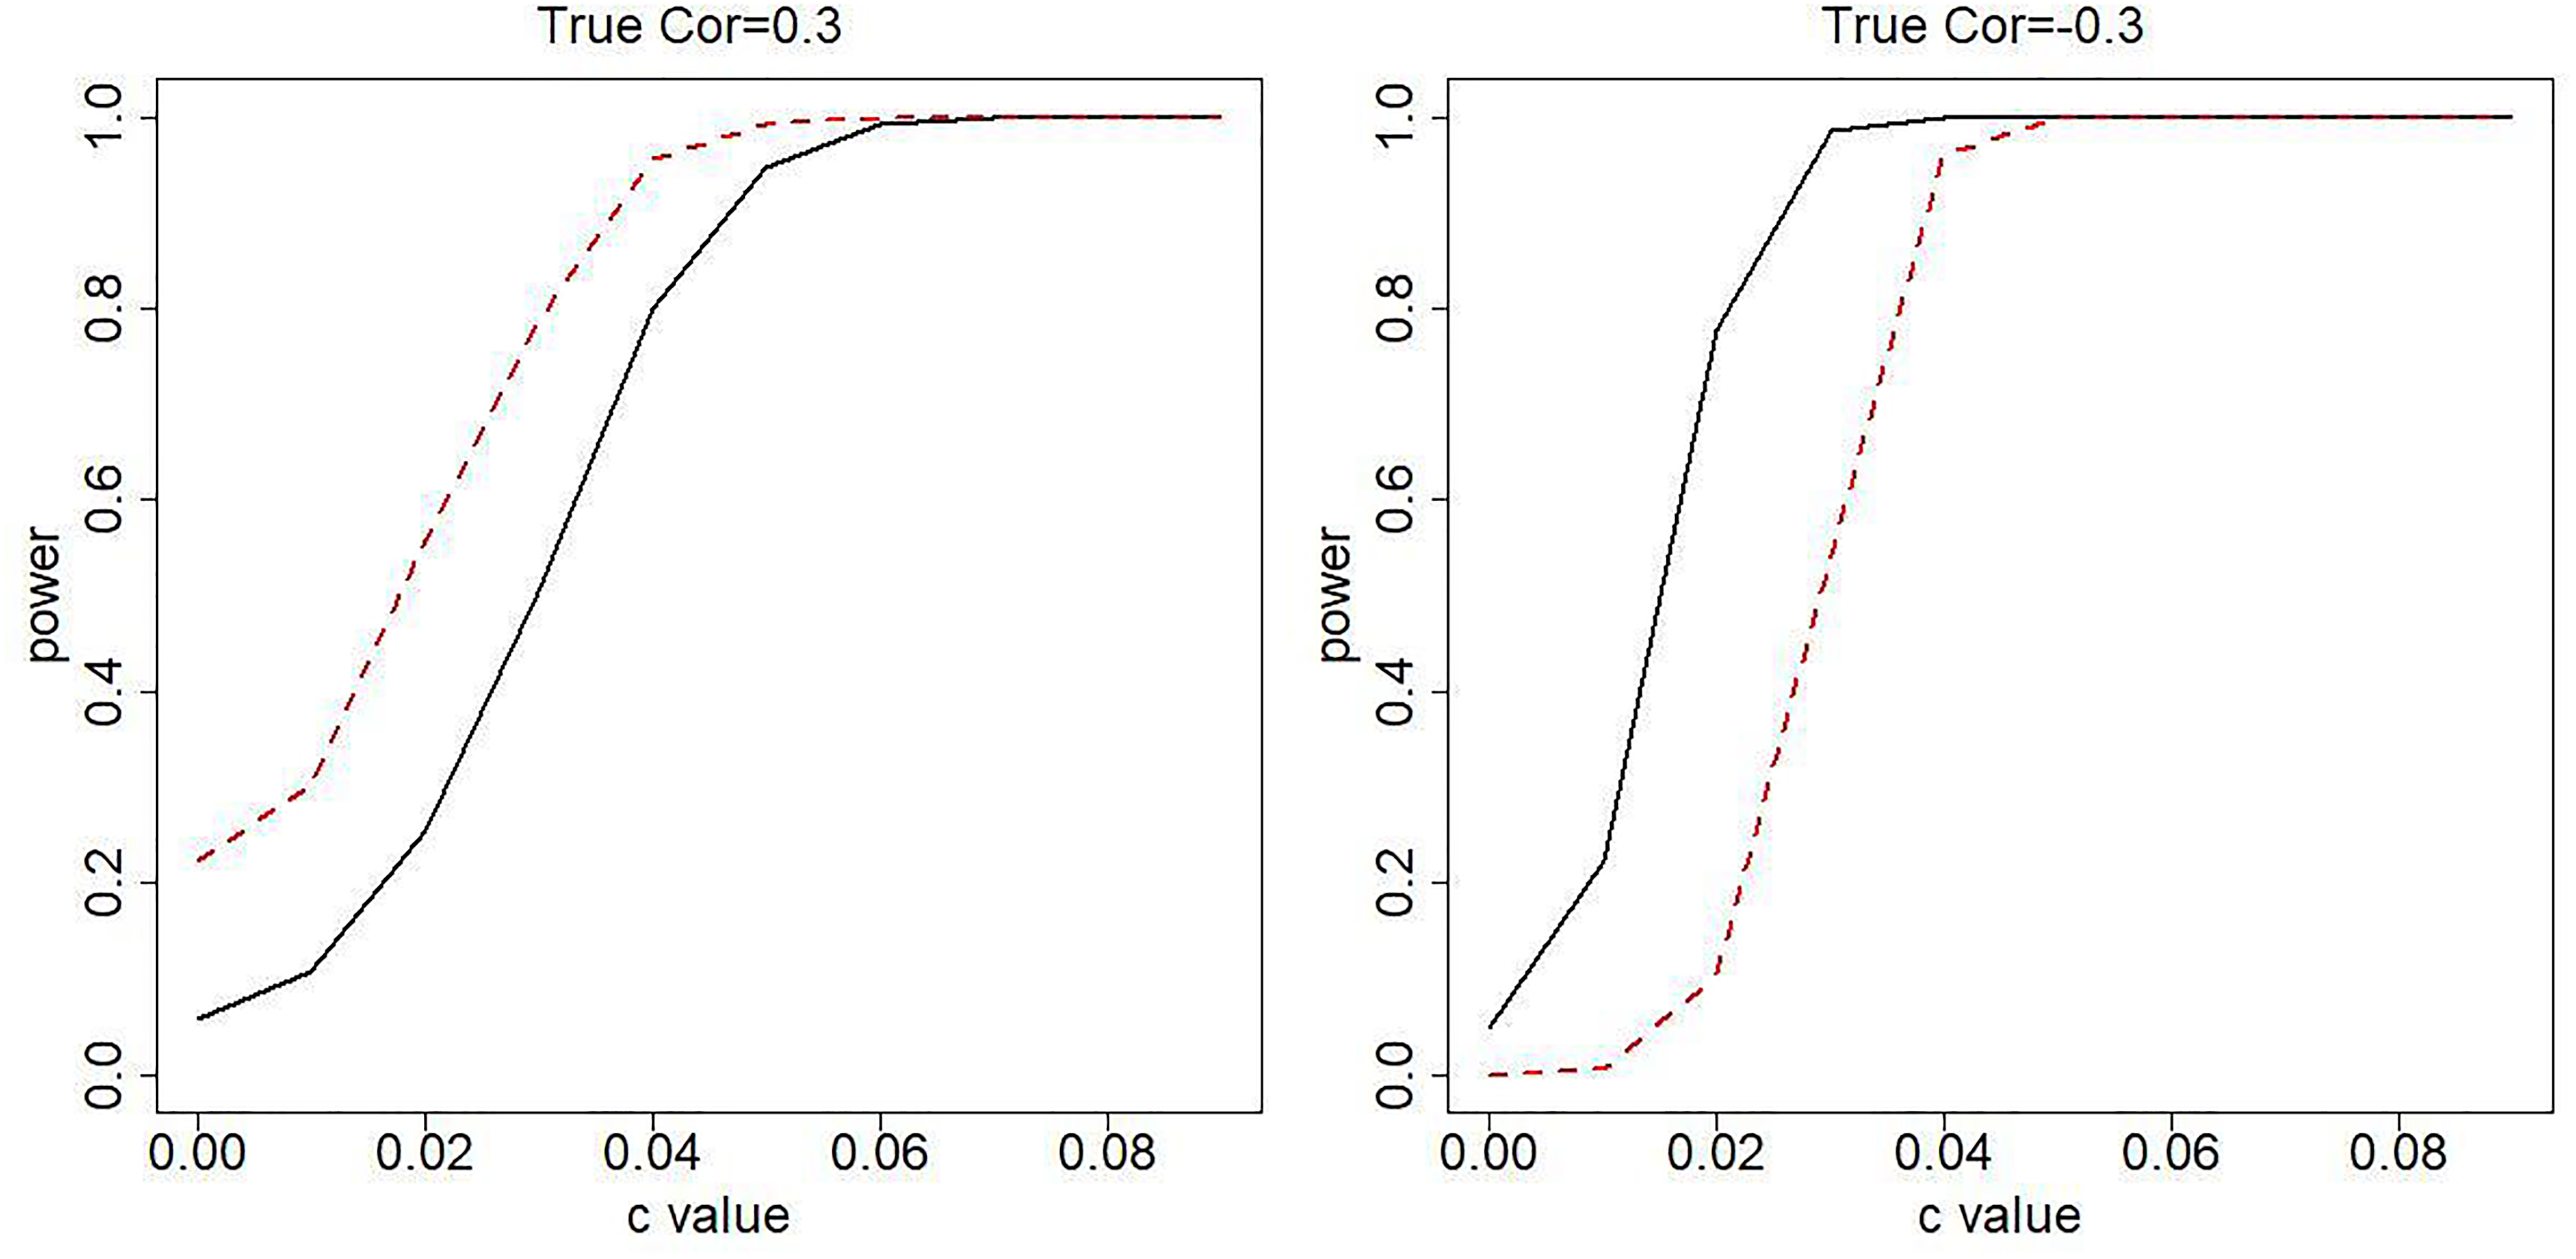
Power estimation for testing
When type I errors are accurate, power estimations are also expected to be accurate under our correlated functional response regression model (black solid curves). Figure 2 further shows that the power performance under classic functional response regression model (red dash curves) departs from our model. The power difference can be dramatic, for instance, 0.777 vs. 0.104 when correlation is -0.3 and
4. Application
We illustrate our method by implementing it into a premature infant gut microbiome study 32 . There are 922 specimens from 58 infants with multiple specimens sequenced at different postconceptional ages for each infant, and three predominant taxa are identified, which are Bacilli, Clostridia and Gammaproteobacteria. The relationship of clinical factors to predominant taxa were evaluated using mixed model regression treating the longitudinal observations of three predominant taxa as repeated measures in their study. In contrast, we model the longitudinal observations as function of postconceptional ages and analyze three predominant taxa together after considering their correlations.
We note that the postconceptional age measurements for each infant are not balanced as the number of measurements may be different. In addition, each infant sample may have different starting and ending ages. For better illustration, we shift and scale the postconceptional ages of each sample to make all postconceptional ages on the same scale from 1 to 10. The converted data is then applied to our functional response regression model. Residual plots after fitting our model are presented in Appendix B of the supplementary materials for model diagnosis.
The correlations between taxa are unknown and we use GEE method described in Section 3 to estimate the correlation matrix 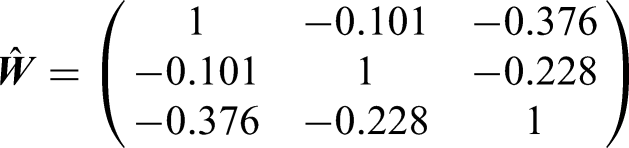
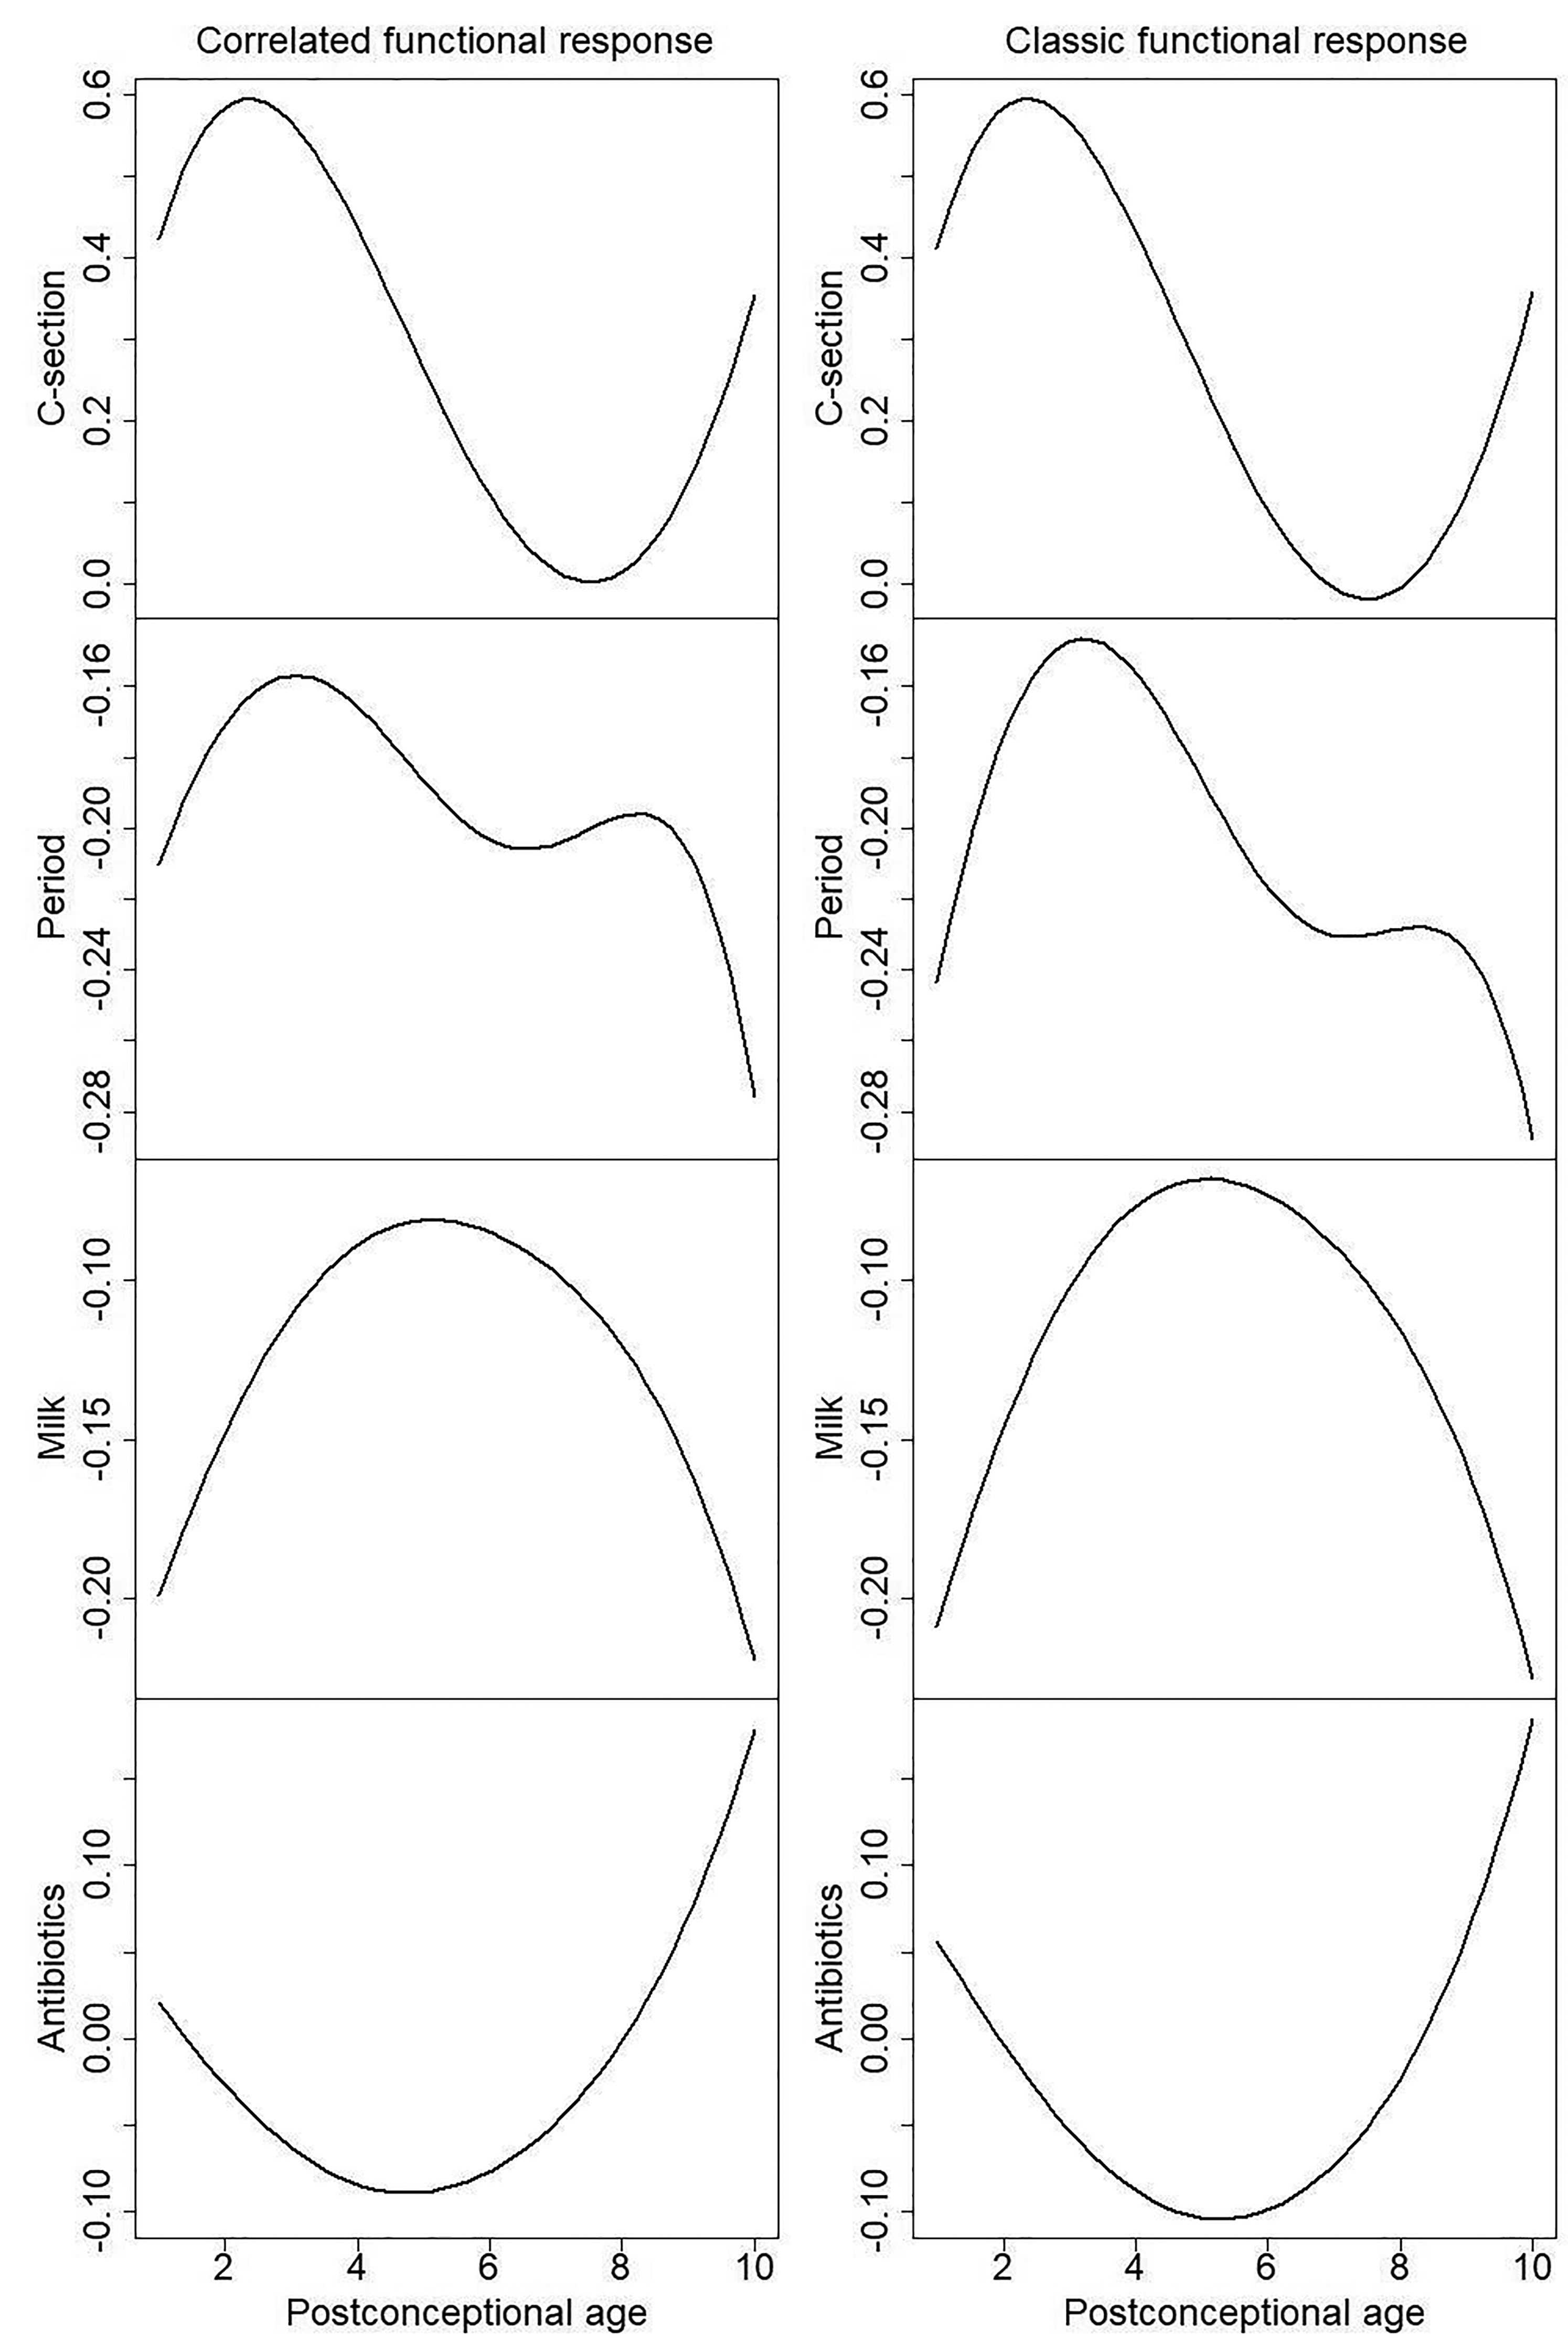
Effects of four clinical factors: mode of birth (C-section), period of study - sampled after 01/01/2011 or not (Period), breast milk volume (Milk) and days of antibiotics (Antibiotics) for predicting all three predominant taxa under correlated functional response regression model (left) and classic functional response regression model (right).
Simulation results from Section 3 suggests that the classic functional response regression model assuming no correlation among taxa may have deflated type I error, given the three predominant taxa are negatively correlated. To confirm this, we show p-values under both our correlated functional response regression model and classic functional response regression model in Table 2. Due to the deflated type I error, we observe that the p-values under classic functional response regression model are consistently less significant. For example, milk effects to three predominant taxa can only be identified at
P-values for testing the association between three predominant taxa and four clinical factors: mode of birth (C-section), period of study - sampled after 01/01/2011 or not (Period), breast milk volume (Milk) and days of antibiotics (Antibiotics).

5. Discussion
In this paper, we propose a correlated functional response regression model which can evaluate the association between correlated longitudinal OTU observations with their predictors. We further propose a data transformation technique to make our method computationally effective by using existing functional data analysis softwares. Predictors’ effects are theoretically derived and their properties including unbiasedness, type I error and testing power are evaluated by comprehensive simulations. Both simulations and application studies show that our model performance is superior to classic functional response regression model, and only our model can provide accurate type I errors, p-values and type I errors on correlated functional response data. Our proposed method is the first functional regression model on longitudinal microbiome data, which provides solid and effective computational tool on future clinical and biological research.
Despite the clear benefits of our method, there are also some limitations with our current model. First, we assume the RAs of OTU data follow log-normal distribution, which may not be true in practice. OTU data may be zero-inflated, and several methods have been proposed to deal with zero-inflated OTU data when OTU data is not functional33,34. It is our future work to incorporate these methods, e.g., two-part model, into functional regression framework. The major challenge is to extend the generalized linear model with binary responses to functional response situation, so that the longitudinal data of OTU prevalence may also be fitted as functional responses.
Another limitation is that the hypothesis testing approach relying on the
Footnotes
Acknowledgements
The authors acknowledge and are grateful for the support of the Tomcyzk AI and Microbiome Working Group.
Declaration of conflicting interests
The author(s) declared no potential conflicts of interest with respect to the research, authorship and/or publication of this article.
Funding
BC was supported by the Tomcyzk AI and Microbiome Working Group and the Princess Margaret Cancer Foundation. WX was funded by Natural Sciences and Engineering Research Council of Canada (NSERC Grant RGPIN-2017-06672), Princess Margaret Cancer Foundation Award.