
Abstract
Risk-prediction models for health outcomes are used in practice as part of clinical decision-making, and it is essential that their performance be externally validated. An important aspect in the design of a validation study is choosing an adequate sample size. In this paper, we investigate the sample size requirements for validation studies with binary outcomes to estimate measures of predictive performance (C-statistic for discrimination and calibration slope and calibration in the large). We aim for sufficient precision in the estimated measures. In addition, we investigate the sample size to achieve sufficient power to detect a difference from a target value. Under normality assumptions on the distribution of the linear predictor, we obtain simple estimators for sample size calculations based on the measures above. Simulation studies show that the estimators perform well for common values of the C-statistic and outcome prevalence when the linear predictor is marginally Normal. Their performance deteriorates only slightly when the normality assumptions are violated. We also propose estimators which do not require normality assumptions but require specification of the marginal distribution of the linear predictor and require the use of numerical integration. These estimators were also seen to perform very well under marginal normality. Our sample size equations require a specified standard error (SE) and the anticipated C-statistic and outcome prevalence. The sample size requirement varies according to the prognostic strength of the model, outcome prevalence, choice of the performance measure and study objective. For example, to achieve an SE < 0.025 for the C-statistic, 60–170 events are required if the true C-statistic and outcome prevalence are between 0.64–0.85 and 0.05–0.3, respectively. For the calibration slope and calibration in the large, achieving SE < 0.15
1 Introduction
Clinical risk-prediction models are used to predict the risk of either having a health outcome (diagnostic models) or developing a health outcome in the future (prognostic models) using information on patient characteristics. These models are often developed using a regression model that associates the outcome to patient characteristics, the predictor variables. For binary outcomes, a logistic regression model is commonly used. The model is fitted to the development data to estimate the regression coefficients which can then be used to predict the outcome in new patients. Risk-prediction models (hereafter ‘risk models’) have important clinical applications; for example, they are used for clinical decision-making and the clinical management of patients,1–3 to assess the performance of hospitals and clinicians by policy makers 4 and in precision medicine to identify patient subgroups for targeted treatment. 5
Given the important role of risk models in health care, it is essential to validate risk models, i.e. to assess their predictive performance in either the data used for model development (internal validation) or in a new dataset (external validation). Typically, in external validation, the risk model is used to obtain predictions for patients in a new dataset, and the quality of these predictions is assessed using measures of predictive performance, for example, measures of calibration, such as the calibration slope and calibration in the large, and measures of prognostic strength (also called discrimination), such as the C-statistic. A crucial aspect of designing an external validation study is deciding how large the sample size should be. A systematic review of published external model validation studies found that just under half of the studies evaluated models using datasets with fewer than 100 events. 6
Some broad recommendations have been made regarding the sample size for external validation studies for binary and survival outcomes. Harrell et al. 7 suggested that at least 100 events should be available in the validation data. Vergouwe et al. 8 suggested at least 100 events and 100 non-events are required in the validation dataset for binary outcomes. Their recommendation was based on the sample size required to detect a statistically significant difference between the estimate of the performance measure and a pre-specified value with 80% power and 5% significance level (for example, assuming a difference of 0.1 for the C-statistic). They used the estimated variance of the performance measure from the development data to calculate the sample size assuming that the outcome prevalence in the development and validation datasets is the same. When this assumption was unlikely to hold, they suggested using simulation to estimate the variance corresponding to a different prevalence in the validation data. Peek et al. 9 concluded that ‘substantial sample sizes’ are required for external validation studies to reliably test for lack of model fit (assessed using the calibration slope and Hosmer–Lemeshow test statistic) based on the resampling of large datasets and examining the variability of performance measures. They suggested avoiding the use of test-based approaches when assessing the predictive performance of models because of the large sample size requirements for the validation data. Collins et al. 10 used resampling methods to calculate the variance of performance measures and recommend a minimum of 100 events, and preferably 200 events or more, to obtain unbiased and precise estimates. Snell et al. 11 also used simulation to explore the sample size requirements for precision-based sample size calculations and considered a wide range of scenarios.
We focus on the two most common scenarios where the objective is either to calculate the required sample size to obtain an estimate of a measure of predictive performance with a desired level of precision, or to provide sufficient power to detect a difference in the estimate of a measure of predictive performance from a target value. The main aim of this paper is to derive formulae that can be used to calculate the sample size for external validation studies, by only making a few assumptions regarding the features of the validation dataset and using information about the anticipated population values of the C-statistic and outcome prevalence, quantities that can be obtained from previous studies. Moreover, since the sample size requirements may be affected by the prognostic strength of the model, a factor that has been linked to the sample size requirements for model development,12,13 we also investigate how the prognostic strength of the model and the prevalence of the outcome in the validation data influence the sample size requirements.
The structure of the paper is as follows. We start with the case where the outcome in a prediction model is binary. In Section 2, we introduce the measures of predictive performance considered in this paper and describe the possible objectives of an external validation study. In Section 3, we derive formulae for the variance of the estimated values of the C-statistic, calibration slope and calibration in the large that do not require any patient-level information. In Section 4, we use our variance formulae to derive formulae for precision- and power-based calculations and discuss how model strength and outcome prevalence affect sample size requirements. We use a simulation study in Section 5 to evaluate our variance and sample size formulae when the assumptions are met and under reasonable departures from these assumptions. Section 6 discusses alternative approaches to sample size calculation that may be used when the outcome in the prediction model is a survival time which may be subject to censoring. In Section 7, we demonstrate the application of the methods in a scenario with real data, and Section 8 provides a discussion.
2 Measures of predictive performance and criteria for sample size calculation
The predictive performance of a risk model in an external validation study is typically assessed using measures of calibration and discrimination. The calculation of these performance measures is based on the observed outcomes and the predicted probabilities in the validation data. These predicted probabilities are usually calculated using regression coefficients estimated in the development data and the predictor information in the validation data but could also be obtained from more recent modelling approaches such as random forests, support vector machines, neural networks and other machine learning techniques. 14
The most popular measure of model discrimination when the outcome is binary is the C-statistic, which measures the ability to separate individuals who experience the event of interest from those who do not. Considering two discordant patients, i.e. one who experiences the event and one who has not, the C‐statistic is the probability that the patient who experiences the event has a higher predicted risk than the patient who does not. A value of 0.5 suggests that the model has no discriminatory ability, while a value of 1 suggests that the model can discriminate perfectly between patients who experience events and those who do not. A risk model with a higher value of the C-statistic has a higher model strength than a model with a lower value of the C-statistic.
Calibration is often assessed using the calibration in the large and calibration slope. For the calibration slope, the binary outcome is regressed on the linear predictor in a logistic regression model, and the coefficient of the linear predictor in this regression is the calibration slope. 15 A slope of one suggests perfect calibration, a slope of less than one suggests overfitting and a slope greater than one suggests underfitting. For the calibration in the large, a similar regression model is considered as for the calibration slope, but with the coefficient of the linear predictor fixed to the value of one. The intercept term in this model is the calibration in the large. A calibration in the large of zero suggests that the proportion of events is equal to the mean of the predicted probabilities. A negative (positive) value suggests that the predicted probabilities are on average higher (lower) than the proportion of events. In this paper, we investigate the sample size requirements for validation studies when the main measures of predictive performance are the C-statistic, calibration slope and calibration in the large.
We consider two criteria to calculate the sample size for an external validation study based on different clinical aims:
Precision-based: the aim is to obtain an estimate of a measure of predictive performance, for example, the C-statistic, with a certain degree of precision expressed by the size of the standard error (SE) (or equivalently, the width of the confidence interval). Power-based: the aim is to detect whether the value of a measure of predictive performance (for example, the C-statistic) is significantly different from a pre-specified target value (e.g.
Previous studies investigating sample size requirements for validation studies used simulation or resampling-based methods to make some broad sample size recommendations based on estimating the variance of the estimated performance measures. In contrast, we aim to obtain formulae for the variance of the estimated performance measures as a function of the sample size and the true population values of the C-statistic and outcome prevalence. In practice, values for the latter two quantities are not known and anticipated population values, i.e. anticipated values in the population in which the validation study will be carried out, may be obtained from previous studies or expert clinical opinion. These formulae allow us to perform precision- or power-based sample size calculations for a particular study without the need to simulate data, thus entailing less computation.
In the next section, we obtain formulae for the variance of the estimated performance measures that do not require any patient-level data. Based on these, we then obtain formulae to perform precision- and power-based sample size calculations.
3 Formulae for the variance of the estimated measures of predictive performance and for sample size calculations for binary outcomes
3.1 Variance of the estimated C-statistic
Let
The C-statistic can be defined as

An estimator for the C-statistic is
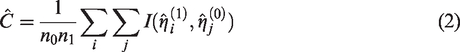
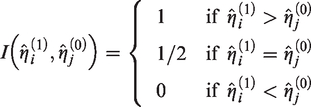
Several methods have been proposed for the estimation of the variance of the C-statistic. Simulation studies
16
have shown that the variance estimator proposed by DeLong et al.
17
performs best. DeLong’s variance estimator is given by

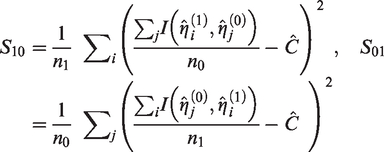
An asymptotic approximation to the variance of
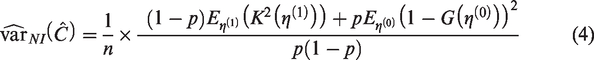
If it is assumed that the marginal distribution,


The cumulative distribution functions of
Assumption 1 – Marginal normality: η∼N (μ, σ2)
In practice, risk models most often include a number of continuous and categorical predictors, and, unless this number is very small or there are only binary predictors with extreme prevalences, the distribution of
In applying equation (4) under the assumption of marginal normality, values for the parameters of


In Section 5, we use simulation to study the performance of (4) under the assumption of marginal normality, and in Supplementary Material 3, we provide code to compute
Closed-form formula for the variance of the estimated C-statistic
If, instead, the distribution of the linear predictor in cases and controls is assumed to be known, one can obtain the expectations needed in (4) and hence estimate the variance
Assumption 2 – Conditional normality: η|Y∼N (μY, σY2), Y=0, 1.
Under Assumption 2, the C-statistic can be approximated
19
by
The formula is
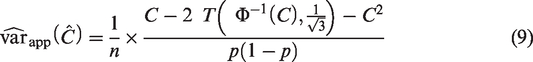
Figure 1a shows the relationship between the SE,
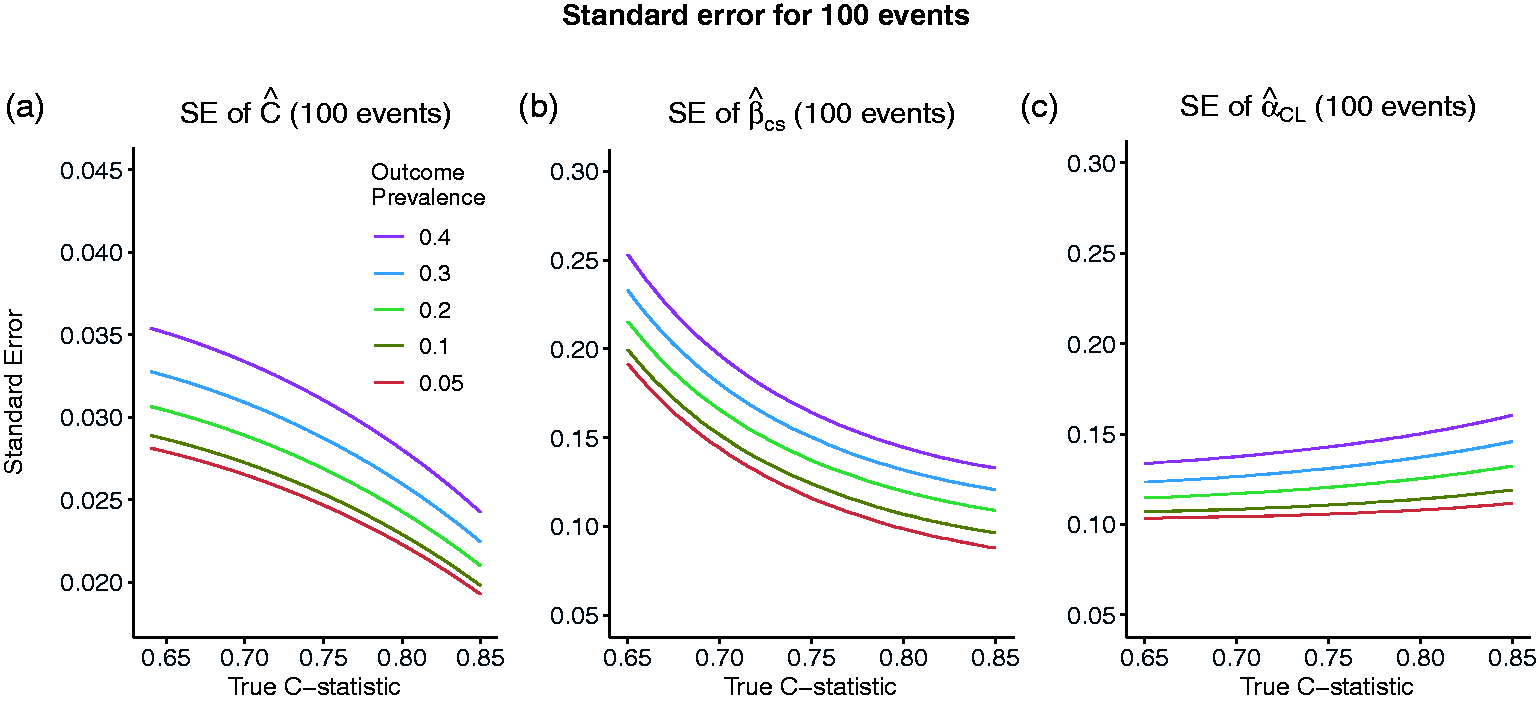
Standard error of the estimated C-statistic (a), calibration slope (b) and calibration in the large (c) as the true value of the C-statistic varies and the number of events is fixed to 100, corresponding to sample sizes of 2000, 1000, 500, 334 and 250 for outcome prevalences of 0.05, 0.1, 0.2, 0.3 and 0.4, respectively.
3.2 Variance of the estimated calibration slope and calibration in the large
The calibration slope is estimated by fitting the following logistic regression model to the validation data


This is equivalent to model (10) with
Assuming models (10) and (11), an asymptotic approximation for the variances of


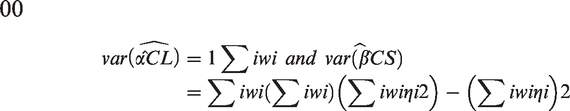
Assuming that
For example, if
Figure 1b and c, similar to Figure 1a, shows the relationship between the SEs
Closed-form variance estimators for calibration slope and calibration in the large
To obtain a simple formulae for the variance of the estimated calibration in the large that is free from patient-level information and avoids use of numerical integration, we make the assumption that the marginal distribution of the linear predictor is Normal (Assumption 1). In Supplementary Material 1, we approximate


To obtain an analogous formula for the variance of the estimated calibration slope that does not require the use of numerical integration, we assume that the conditional distribution of the linear predictor given
Assumption 3 – Conditional normality with equal variances: η|Y∼N (μY, σ2), Y=0, 1
Using results from the relationship between the parameters in a logistic regression model and the corresponding linear discriminant analysis (LDA) model,21–23 we obtain in Supplementary Material 1 the following formula for the variance of the estimated calibration slope that depends on the sample size, the true value of the C-statistic, the outcome prevalence and the calibration slope

In Section 5, we use simulation to evaluate the performance of (14) and (16) when their corresponding assumptions are met and under reasonable departures from these assumptions and also to establish a range of values of
4 Formulae for precision- and power-based sample size calculations
In this section, we use our variance estimators of Section 3 to obtain formulae for precision and power-based sample size calculations.
4.1 Precision-based sample size calculations
The most appropriate approach for sample size calculation for most validation studies is likely to be aimed at obtaining an estimate of a performance measure with reasonable precision, as measured by the size of the SE or the width of the confidence interval. Rearranging equation (9) to perform a precision-based sample size calculation based on the true values of
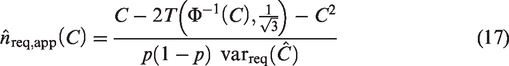


The closed-form formulae for the sample size require the true values of
Effect of model strength and outcome prevalence on the sample size/number of events
The effect of model strength and outcome prevalence on the number of events required to achieve the required precision of an estimated measure of predictive performance is illustrated in Figure 2. The number of events,
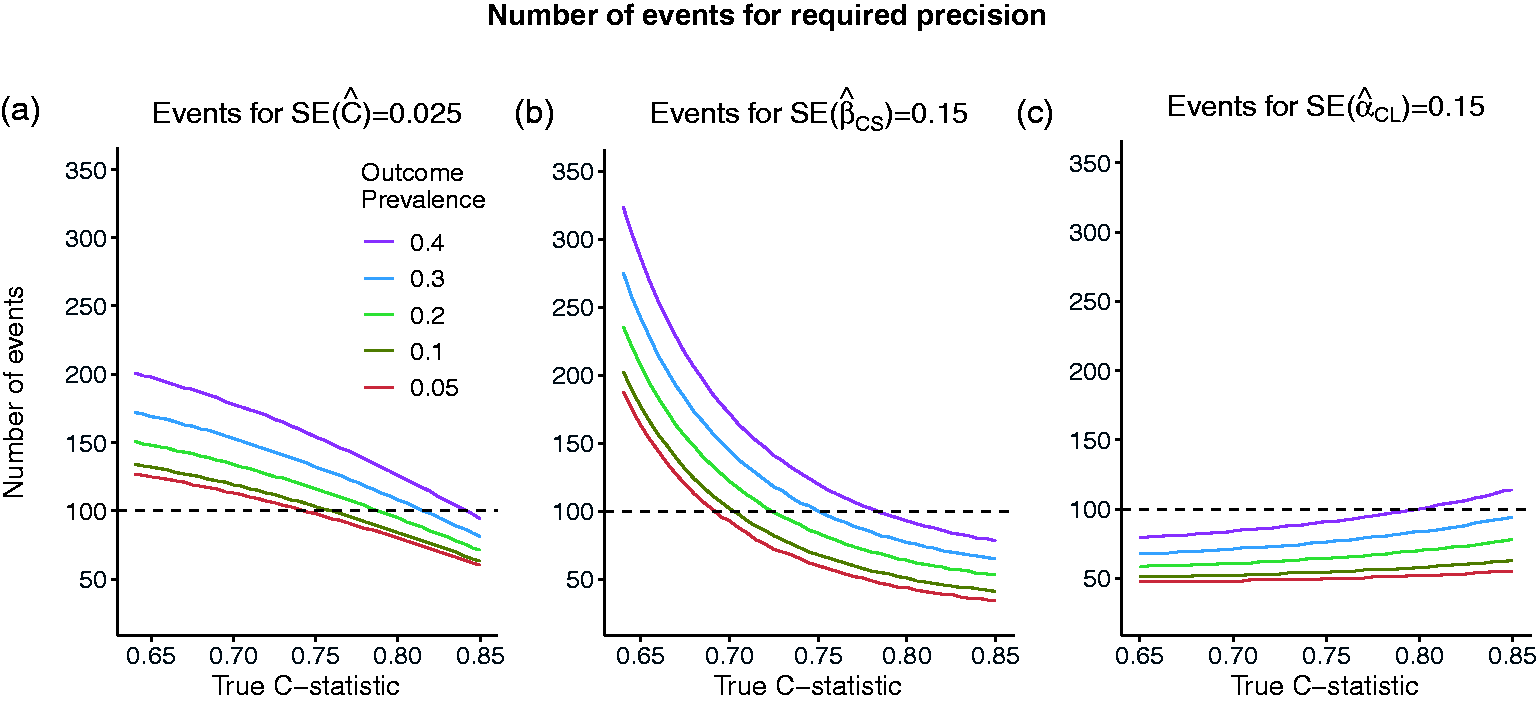
Number of events required to achieve required standard errors of: (a) SE = 0.025 for the estimated C-statistic of 0.025 (width of 95% CI = 0.1) or (b) SE = 0.15 for the estimated calibration slope (width of 95% CI = 0.6) or (c) SE = 0.15 for the estimated calibration in the large, as the true value of the C-statistic and the outcome prevalence varies.
For example, we compare the sample size recommendations for the C-statistic, calibration slope and calibration in the large for a given value of outcome prevalence of 10% and different model strengths for
4.2 Power-based sample size calculations
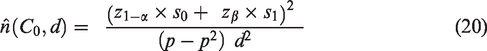
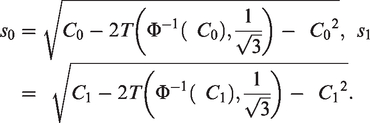
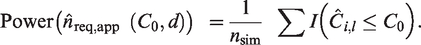
Power-based sample size calculations are appropriate to investigate whether the performance of an existing risk model holds in a different patient population, for example, in patients from a different country or in patients from a different time-period. For a measure of predictive performance,
The power, 1-β ( The true value of The threshold for rejecting
The power-based approach to sample size calculation is particularly relevant for the C-statistic. For example, assuming that the case-mix has remained unchanged, we may wish to show that an existing risk model is outdated, i.e. its predictive performance has deteriorated over time and so
An analogous result can be derived for the calibration slope should this be required.
Figure 3 shows the number of events required to detect a difference,
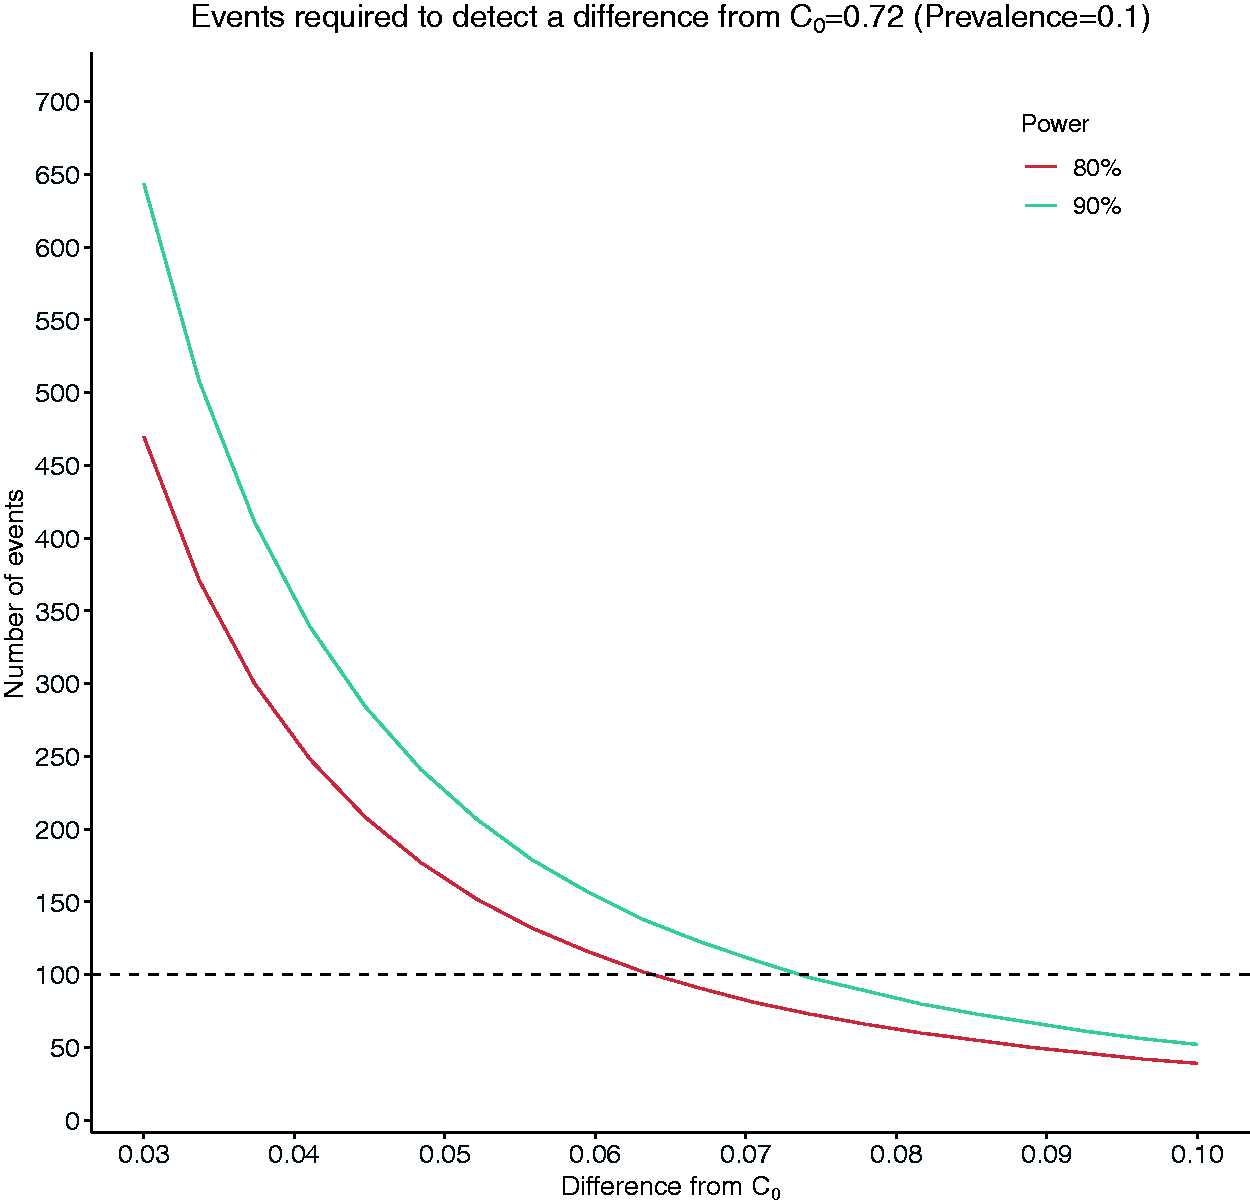
Number of events required to detect a difference of magnitude between 0.03 and 0.1 from a target value of C = 0.72 (C1 = C0 + d).
5 Simulation study
We use simulation to assess the performance of the variance and sample size formulae of Sections 3 and 4. We plan and report our simulation studies using the structure proposed by Morris et al. 24 which involves defining aims, data-generating mechanisms (DGMs), estimands/targets, methods and performance measures. All simulations were performed using the R software. The main code for simulations can be found in https://github.com/c-qu/samplesize-validation and in the Supplementary Material 3.
5.1 Simulation settings
Aims
Our variance estimators for the C-statistic, calibration slope and calibration in the large rely on approximations and assumptions. So we assess their performance first in settings where the assumptions hold to assess the quality of the approximations and then where there are departures from the assumptions.
We assess the performance of our sample size estimators for (a) precision- and (b) power-based sample size calculations in the same settings.
Data-generating mechanisms
We consider four DGMs that correspond to different degrees of departure from the assumptions. The distribution of the linear predictor is assumed to be:
Conditionally Normal given the outcome with the corresponding variances being equal. Conditionally Normal given the outcome with the corresponding variances being unequal. This results in a violation of the assumption of equal variances required by the formula for the calibration slope. Marginally Normal. This results in mild violation of both the assumption of conditional normality given the outcome and the assumption of equal variances. Marginally non-Normal in a way that results in marked violation of the assumption of marginal normality and both the assumption of conditional normality given the outcome and the assumption of equal variances.
The technical details of the data-generating process for DGMs 1–4 are presented in the Supplementary Material 2.
Parameter values
For all DGMs and aims, we consider a range of values for
Estimands/targets
(1) SEs of
(2a) Sample sizes to attain a required SE,
(2b) Power and significance level when the estimated sample size,
Methods
The estimated SEs,
Simulation process
For all simulations we used
Aim 1. We let
Aim 2a. We let
Aim 2b. We let
The probability of rejecting the null hypothesis when it is true is estimated by T
The probability of rejecting the null hypothesis when the alternative is true is estimated by
For large
Performance measures
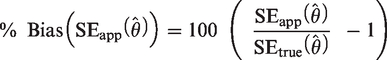
(1) Percentage bias in the estimated SE of
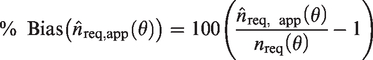
(2a) Percentage bias in the estimated sample size for a specified SE:
(2b) Type-1 error rate and power when a sample of size
5.2 Results
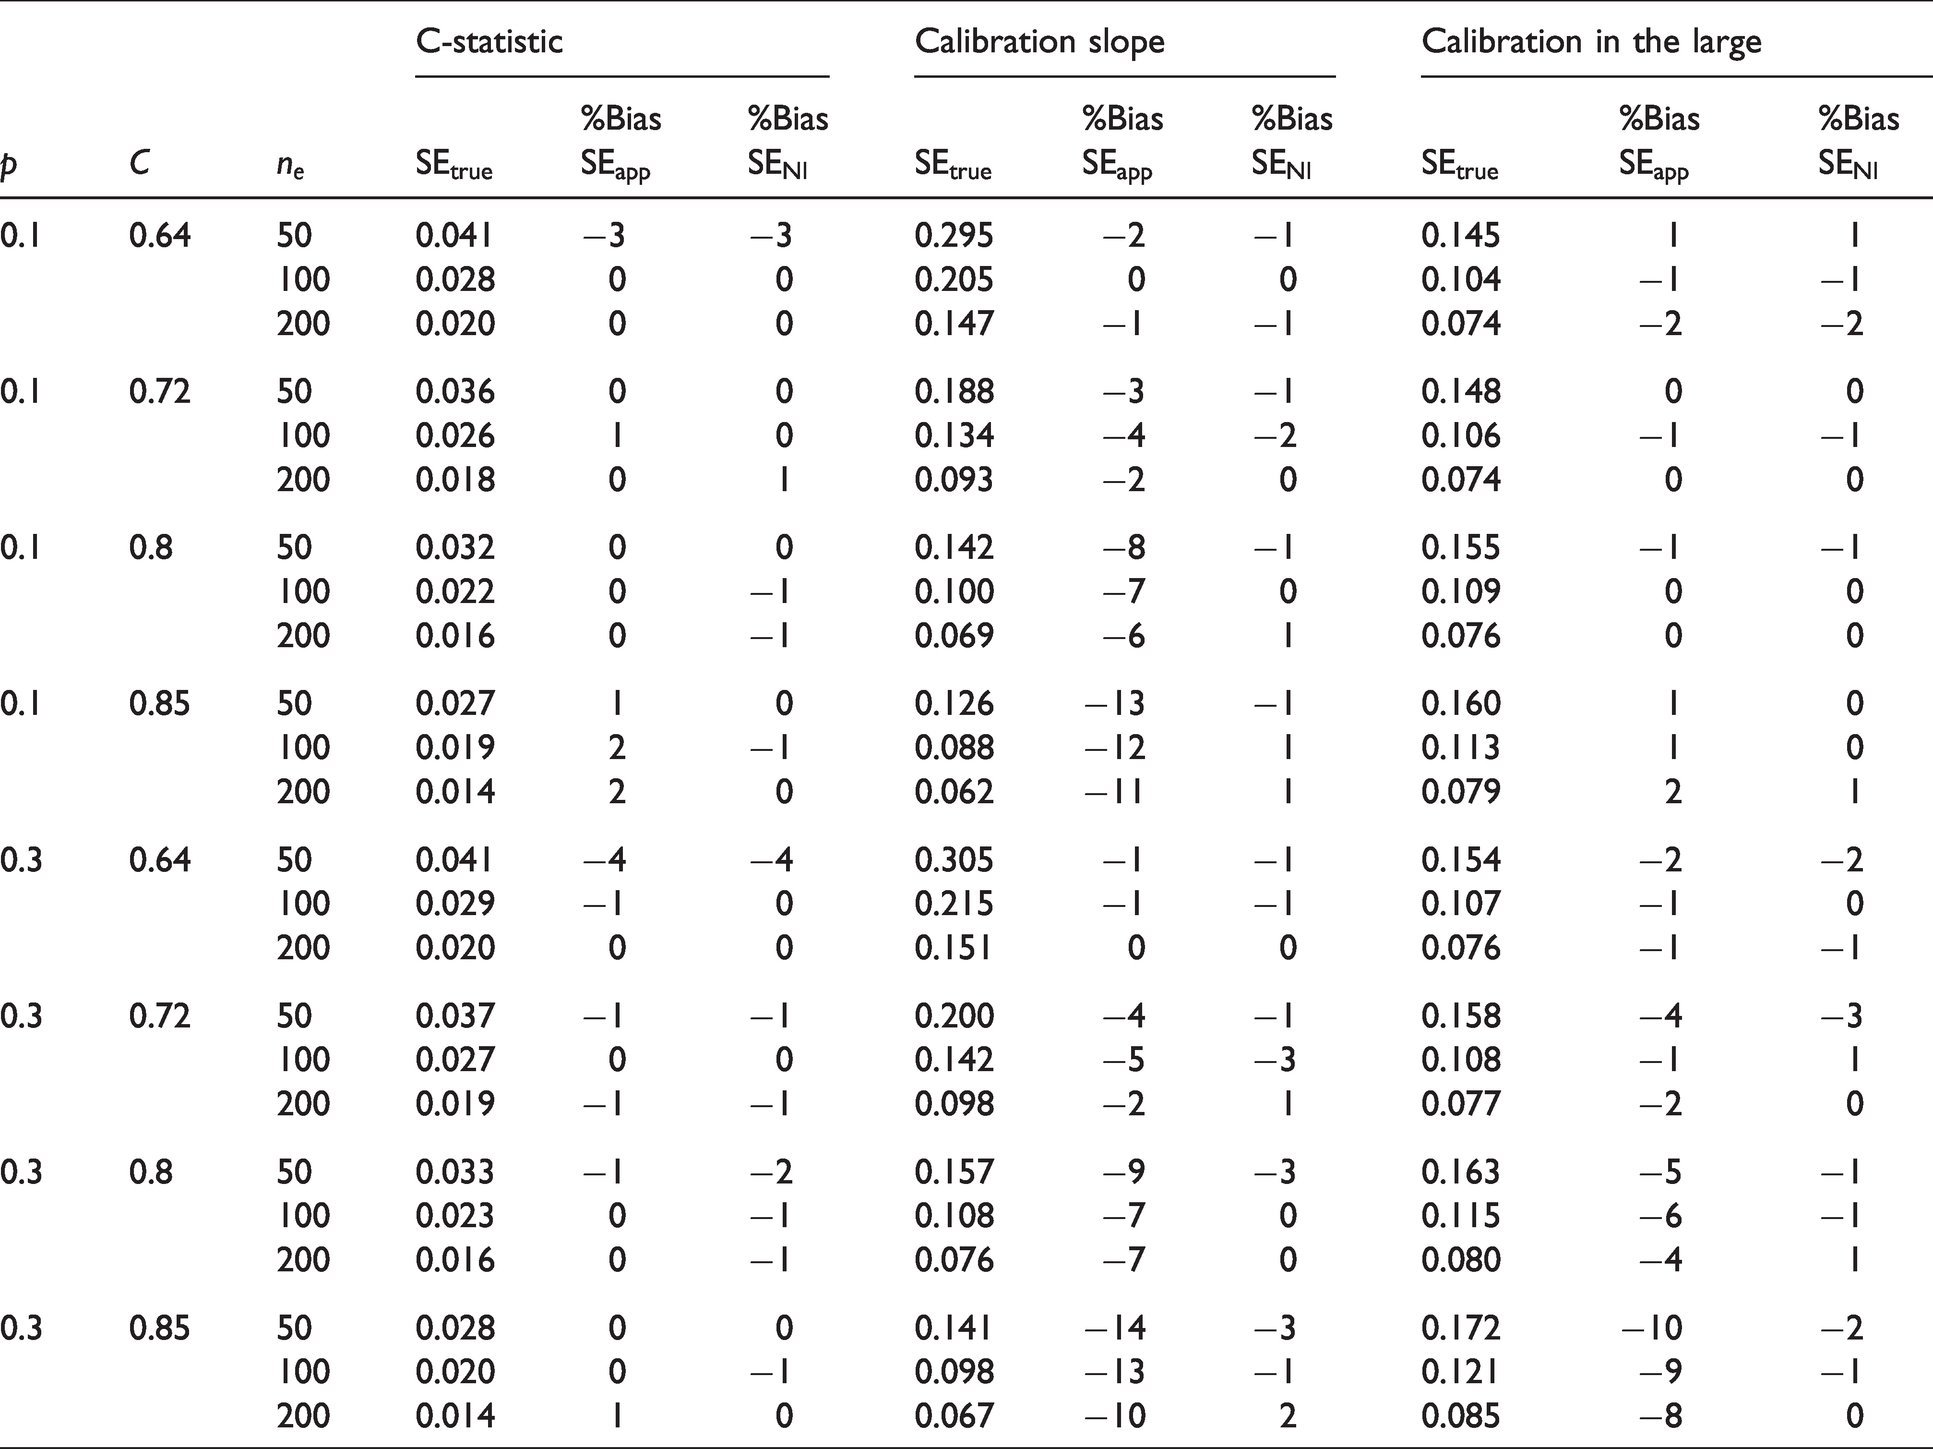
For DGM 1 and 3, we assessed both aims, while for DGMs 2 and 4 we primarily focus on Aim 1. For DGM 3, we present main results in Tables 1 and 2 for
DGM 3. % Bias of the estimated standard errors for
DGM 3. Number of events for a specified standard error for
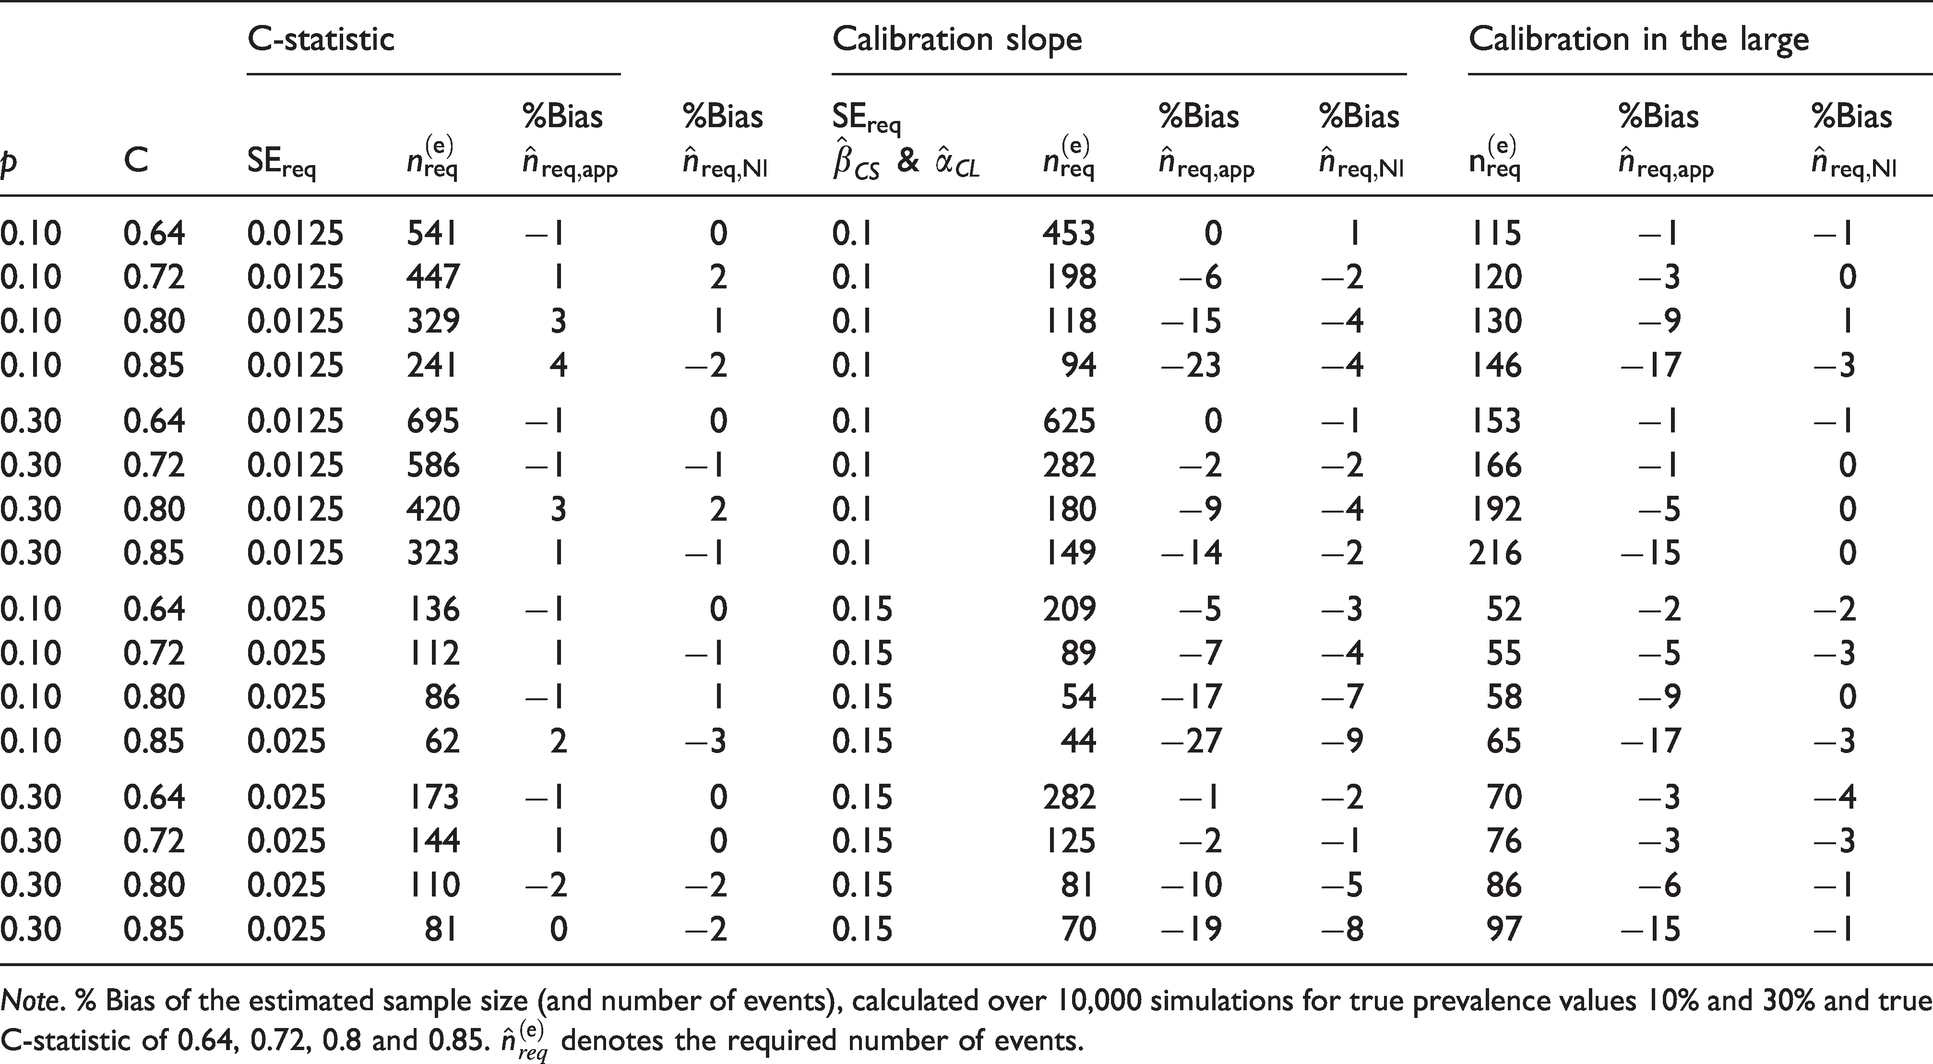
Note. % Bias of the estimated sample size (and number of events), calculated over 10,000 simulations for true prevalence values 10% and 30% and true C-statistic of 0.64, 0.72, 0.8 and 0.85.
DGM 1: Conditional normal linear predictor with equal variances
For the estimated C-statistic,
For the estimated calibration slope, the SEs were estimated well for values of
DGM 2: Conditional Normal linear predictor with unequal variances
Results for the estimated SEs of
DGM 3: Marginally Normal linear predictor
For the estimated C-statistic and calibration slope, the results were very similar to the results seen for DGM 1 and DGM 2. Arguably, the similarity is due to the fact that when the marginal distribution of the linear predictor is Normal, the conditional distribution of the linear predictor given the outcome is also approximately Normal, with the corresponding variances in the cases and control groups being very similar for values of
For
The results from using formula (4) that requires numerical integration were very similar, with the highest bias being less than 4%. This amount of bias occurred only for
For the estimated calibration slope, the SEs from our closed-form formula were estimated well for values of
The performance of the variance estimators that require the use of numerical integration was very good with minimal bias across most scenarios under DGM 3 (see Tables 1, 2 and S5, S6). The maximum bias (in absolute value) for the SE of the calibration in the large was 3%. For calibration slope, the maximum bias was –4%, except when the number of events was small (50) in which case the maximum bias was –8%. For values of
For
DGM 4: Marginally skewed linear predictor
The SE of
Summary
To summarise, our simulations suggest that our closed-form sample size formulae based on the C-statistic, the calibration slope and the calibration in the large estimate well the required sample size for values
6 Survival outcomes and further considerations
In Sections 3 to 5, we focused on risk-prediction models for binary outcomes. However, in health research, outcomes are often time-to-event (also known as Survival Outcomes, e.g. time to death, time to relapse), and our formulae are not designed to apply to these settings. Expressing the variance of Harrell’s C-index, 25 which is the most popular concordance measure, and the variance of the calibration slope for survival outcomes in a form that does not depend on patient-level information is cumbersome and may not result in simple formulae analogous to those for binary outcomes.
We next discuss two simple approaches for variance and sample size estimation that can be used in specific scenarios for risk models with survival outcomes. In the first, we make use of our variance and sample size formulae for binary outcomes and apply them to survival outcomes. In the second, we assume that an estimate of the variance of the estimated performance measures is available from a previous validation exercise. Using the fact that the asymptotic variance is proportional to the sample size and using a variance estimate from an existing study, we then obtain formulae to estimate the sample size to attain a required variance for the estimated C-index/C-statistic and the estimated calibration slope.
6.1 Use of variance estimators for binary outcomes in survival-data settings
As the regression parameters from logistic and Cox regression are similar when the probability of event occurrence is low,26,27 we investigated whether our formulae for the variances of
The variance formulae for binary data performed best when the proportion of failures was small, i.e. the proportion of censored individuals was very high (Table S9). For the C-index, when
In summary, when dealing with survival data, our formula for the variance of
6.2 Sample size calculation when estimates for measures of predictive performance are available from a previous validation study
We also considered an alternative approach to sample size calculation which requires an existing validation dataset called the ‘reference dataset’ and an estimate of
We let 
In practice, the larger the size of the reference dataset, the better 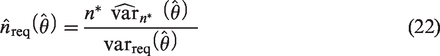
It is noted that (22) assumes that the outcome prevalence in the newly collected data is the same as the prevalence in the reference dataset.
7 Real data illustration
A risk model was developed
28
to predict the risk of in-hospital mortality for patients undergoing heart valve surgery based on pre-operative patient characteristics. Heart valve surgery has an associated in-hospital mortality rate of 4% to 8%. The development sample consisted of 16,679 patients in Great Britain and Ireland who had surgery between 1995 and 1999, and the proportion of deaths was 6.4%. The risk model included 13 categorical and continuous predictors. The model was validated in a sample of 16,160 patients who had surgery in the five following years. The proportion of deaths in the validation sample was 5.7%. The estimated C-statistic was 0.77, and the calibration slope 1.00. The estimated calibration in the large was not available. Using the individual-level data for all patients in the validation data, the De Long’s estimate of the SE of
Suppose we wish to collect new data and assess the performance of this model in a contemporary patient population. We perform sample size calculations using:
the formulae of Section 4 for precision- and power-based calculations and the formula of Section 6.2 which requires the presence of previous validation data.
We compare the recommendations based on the approaches above with the current guideline recommendation of at least 100–200 events. The code for the sample size calculations that follow can be found in Supplementary Material 3.
Sample size calculation based on anticipated values for the outcome prevalence and C-statistic
Precision-based sample size calculation
Based on information available from the literature, the discriminatory ability of the model is reflected by an anticipated population value of
Power-based sample size calculation
Suppose that the risk model is considered to be outdated and it is hypothesized that its discriminatory ability is now lower. Suppose we wish to collect enough data to be able to detect a difference of 0.05 from the null value of
Sample size calculation based on existing estimates for the measures of predictive performance from an existing validation study
The reference dataset is considered to be the existing validation dataset of 16,160 patients with
Current guideline recommendations of 100 events
Given an assumed outcome-prevalence of 5.7%, a validation sample of at least 1760 patients would be required to ensure at least 100 events are observed. This size would correspond to an SE
8 Discussion
In recent years, sample size estimators for the development of risk models for continuous, binary and survival outcomes12,29 and for the external validation of risk models for continuous outcome 30 have been suggested. In this work, we propose sample size estimators for the validation of risk models for binary outcomes, which fill an important gap in the literature, and will enable researchers to make quick and informed sample size choices when designing their validation studies. Also, when it is only feasible to collect limited data due to cost, time or other restrictions, our estimators may inform researchers about the anticipated precision of the estimated validation measures or the power with which a desired difference can be detected.
Analogous calculations can be performed using simulation,8,10,11 akin to the approaches used in this paper to obtain the true values of SEs and sample sizes under certain assumptions. Simulation will typically require more programming knowledge compared to applying our formulae, and it will be more accurate, although our estimators have shown very good performance in a wide range of scenarios. Thus, simulation remains an alternative useful tool, particularly when it is required to perform sample size calculations tailored to the characteristics of a particular study.
The decision about the required sample size in validation studies for binary outcomes has so far been predominantly based on the recommendation of at least 100 events (or non-events). This recommendation partly accounts for outcome prevalence but does not take into account the model strength, as reflected by the C-statistic. So, for a given prevalence, the recommended sample size will be fixed even though different model strengths would correspond to different precisions for the estimates of the performance measures. It also does not differentiate between precision- and power-based sample size requirements.
We have proposed easy-to-use formulae for sample size calculations for external validation studies, based on the C-statistic, the calibration slope and calibration in the large which are standard measures for the predictive performance of a risk model for binary outcomes. In particular, we have proposed formulae to estimate the sample size required to ensure either that: (a) the true variance of an estimated measure of predictive performance is approximately equal to a specified value (precision-based calculation) or (b) there is sufficient power to detect a difference in the estimate of a measure of predictive performance from a target value (power-based calculation). To achieve this, we derived formulae for the variance of the estimated performance measures as a function of sample size and the true values of the C-statistic and outcome prevalence under the assumption of conditional normality given the outcome for the C-statistic and calibration slope and marginal normality for the calibration in the large.
Assessing departure from model assumptions
We used simulation to assess the validity of our variance and sample size formulae when the assumptions about the distribution of the linear predictor were met and under reasonable departures from these assumptions. We have found that under the assumption of marginal normality (DGM 3), our closed-form variance formula for the C-statistic performed well across a range of values range of values for the true
When the linear predictor was severely skewed, both marginally and conditionally for the cases and the controls, our formulae performed well for values of
Selection of the required SE for precision-based and the acceptable difference for power-based sample size calculations
Both precision- and power-based calculations using our formulae require the input of values for the C-statistic and the outcome prevalence. Anticipated values for these quantities can be obtained from previous development and/or validation studies or expert clinical opinion.
If we were to adhere to the existing rule of 100 events, we would obtain, approximately,
Our formulae for precision-based sample size calculations additionally require the researcher to provide a value for the required SE of the estimated performance measure. The decision regarding the required precision for
Our formulae for power-based calculations additionally require the specification of a value for the difference from the target value of
Sample size calculations for survival outcomes
Our formulae for the sample size calculations were developed for validation studies with binary outcomes. We have also investigated the validity of these formulae for survival data, where prevalence is taken to be the proportion of observed failures. The formulae for calibration slope can be applied when prevalence is 10% or less and provide a slightly conservative sample size recommendation. The formulae for the C-statistic should be used with caution when
Supplemental Material
sj-pdf-1-smm-10.1177_09622802211007522 - Supplemental material for Estimation of required sample size for external validation of risk models for binary outcomes
Supplemental material, sj-pdf-1-smm-10.1177_09622802211007522 for Estimation of required sample size for external validation of risk models for binary outcomes by Menelaos Pavlou, Chen Qu, Rumana Z Omar, Shaun R Seaman, Ewout W Steyerberg, Ian R White and Gareth Ambler in Statistical Methods in Medical Research
Supplemental Material
sj-pdf-2-smm-10.1177_09622802211007522 - Supplemental material for Estimation of required sample size for external validation of risk models for binary outcomes
Supplemental material, sj-pdf-2-smm-10.1177_09622802211007522 for Estimation of required sample size for external validation of risk models for binary outcomes by Menelaos Pavlou, Chen Qu, Rumana Z Omar, Shaun R Seaman, Ewout W Steyerberg, Ian R White and Gareth Ambler in Statistical Methods in Medical Research
Supplemental Material
sj-txt-3-smm-10.1177_09622802211007522 - Supplemental material for Estimation of required sample size for external validation of risk models for binary outcomes
Supplemental material, sj-txt-3-smm-10.1177_09622802211007522 for Estimation of required sample size for external validation of risk models for binary outcomes by Menelaos Pavlou, Chen Qu, Rumana Z Omar, Shaun R Seaman, Ewout W Steyerberg, Ian R White and Gareth Ambler in Statistical Methods in Medical Research
Footnotes
Declaration of conflicting interests
The author(s) declared no potential conflicts of interest with respect to the research, authorship, and/or publication of this article.
Funding
The author(s) disclosed receipt of the following financial support for the research, authorship, and/or publication of this article: This work was supported by the Medical Research Council grant MR/P015190/1. I.R.W. was supported by the Medical Research Council Programme MC_UU_12023/29. S.R.S was funded by the Medical Research Council Programme grant MC_UU_00002/10 and supported by the NIHR Cambridge BRC.
Supplemental material
Supplemental material for this article is available online.
References
Supplementary Material
Please find the following supplemental material available below.
For Open Access articles published under a Creative Commons License, all supplemental material carries the same license as the article it is associated with.
For non-Open Access articles published, all supplemental material carries a non-exclusive license, and permission requests for re-use of supplemental material or any part of supplemental material shall be sent directly to the copyright owner as specified in the copyright notice associated with the article.