
Abstract
Quantifying the tool–tissue interaction forces in surgery can be used in the training process of novice surgeons to help them better handle surgical tools and avoid exerting excessive forces. A significant challenge concerns the development of proper statistical learning techniques to model the relationship between the true force exerted on the tissue and several outputs read from sensors mounted on the surgical tools. We propose a nonparametric bootstrap technique and a Bayesian multilevel modeling methodology to estimate the true forces. We use the linear exponential loss function to asymmetrically penalize the over and underestimation of the applied forces to the tissue. We incorporate the direction of the force as a group factor in our analysis. A weighted approach is used to account for the nonhomogeneity of read voltages from the surgical tool. Our proposed Bayesian multilevel models provide estimates that are more accurate than those under the maximum likelihood and restricted maximum likelihood approaches. Moreover, confidence bounds are much narrower and the biases and root mean squared errors are significantly smaller in our multilevel models with the linear exponential loss function.
Keywords
1 Introduction
Quantification of the force exerted during the performance of surgical operations is of importance in the training process of novice surgeons and surgical residents. A significant amount of errors in neurosurgical operations (more than 50%) is due to excessive force to the brain tissue. 1 Quantification of such forces would help trainees learn about safe margins of forces when dealing with human tissue, and help residents acquire surgical skills in practice. Knowledge of the force values may also significantly improve the learning curve, since the residents can “learn-by-doing”, instead of only “observing” experienced surgeons performing surgical tasks. 2
The development of educational systems, that precisely reflect the mechanical components, such as tool–tissue interaction forces, during an operation, is of importance. Without such systems, trainees require years of experience and multiple pre-clinical and clinical trials to become educated in dealing appropriately with human tissues. Therefore, there is an increasing demand to enhance the efficiency of the learning process and provide trainees with quantitative tools to assess their surgical skills.3,4 This paper concerns microsurgical operations, where the goal is to increase the accuracy and resolution of the functionality of the sensorized surgical forceps by adding some miniature force-sensing components called strain gauge. 2 The force exerted to the brain tissue generates a change in the electrical resistance of the strain gauge, and as a result, the voltage would change.1–3,5 There is a relationship between the force applied to the brain tissue and the voltages read from the mounted strain gauges on the prongs of the surgical forceps. It is required to appropriately model the output voltages (response variable) and the force components (explanatory variable), to estimate the resultant force.
In this paper, we study a dataset that was obtained from a calibration station developed to calibrate a bipolar forceps instrumented with small strain gauges. The data set was provided by the Project neuroArm at the University of Calgary, and was partially used in our recent work in which the nonparametric bootstrap technique was employed to estimate two-dimensional (2D) forces exerted on a cadaveric brain during the performance of some neurosurgical tasks. 6 We developed a Naïve method using the underlying deterministic and physical properties pertinent to the strain gauges. 2 However, the Naïve approach has important limitations, as it does not allow to construct necessary precision measures and confidence intervals for the predicted forces. To overcome these problems, we developed another approach based on a nonparametric bootstrap technique to accurately estimate the amount of force associated with the observed signals in a 2D environment where the forces are implemented in only x and y directions. Necessary confidence intervals were developed and later used in the calibration of the sensorized bipolar forceps. 6
In practice, forces are applied to the tissue in three directions. One needs to provide accurate estimates of forces along x-, y-, and z-axes using voltage signals read from three strain gauges. The first two strain gauges (measuring the deflections in x and y directions) were mounted onto the surface of each prong of the forceps. To place the third sensor for measuring the deflection along z-axis, the tool was altered and the strain gauge was installed inside a U-shaped notch created during alteration (see the inset in Figure 1).
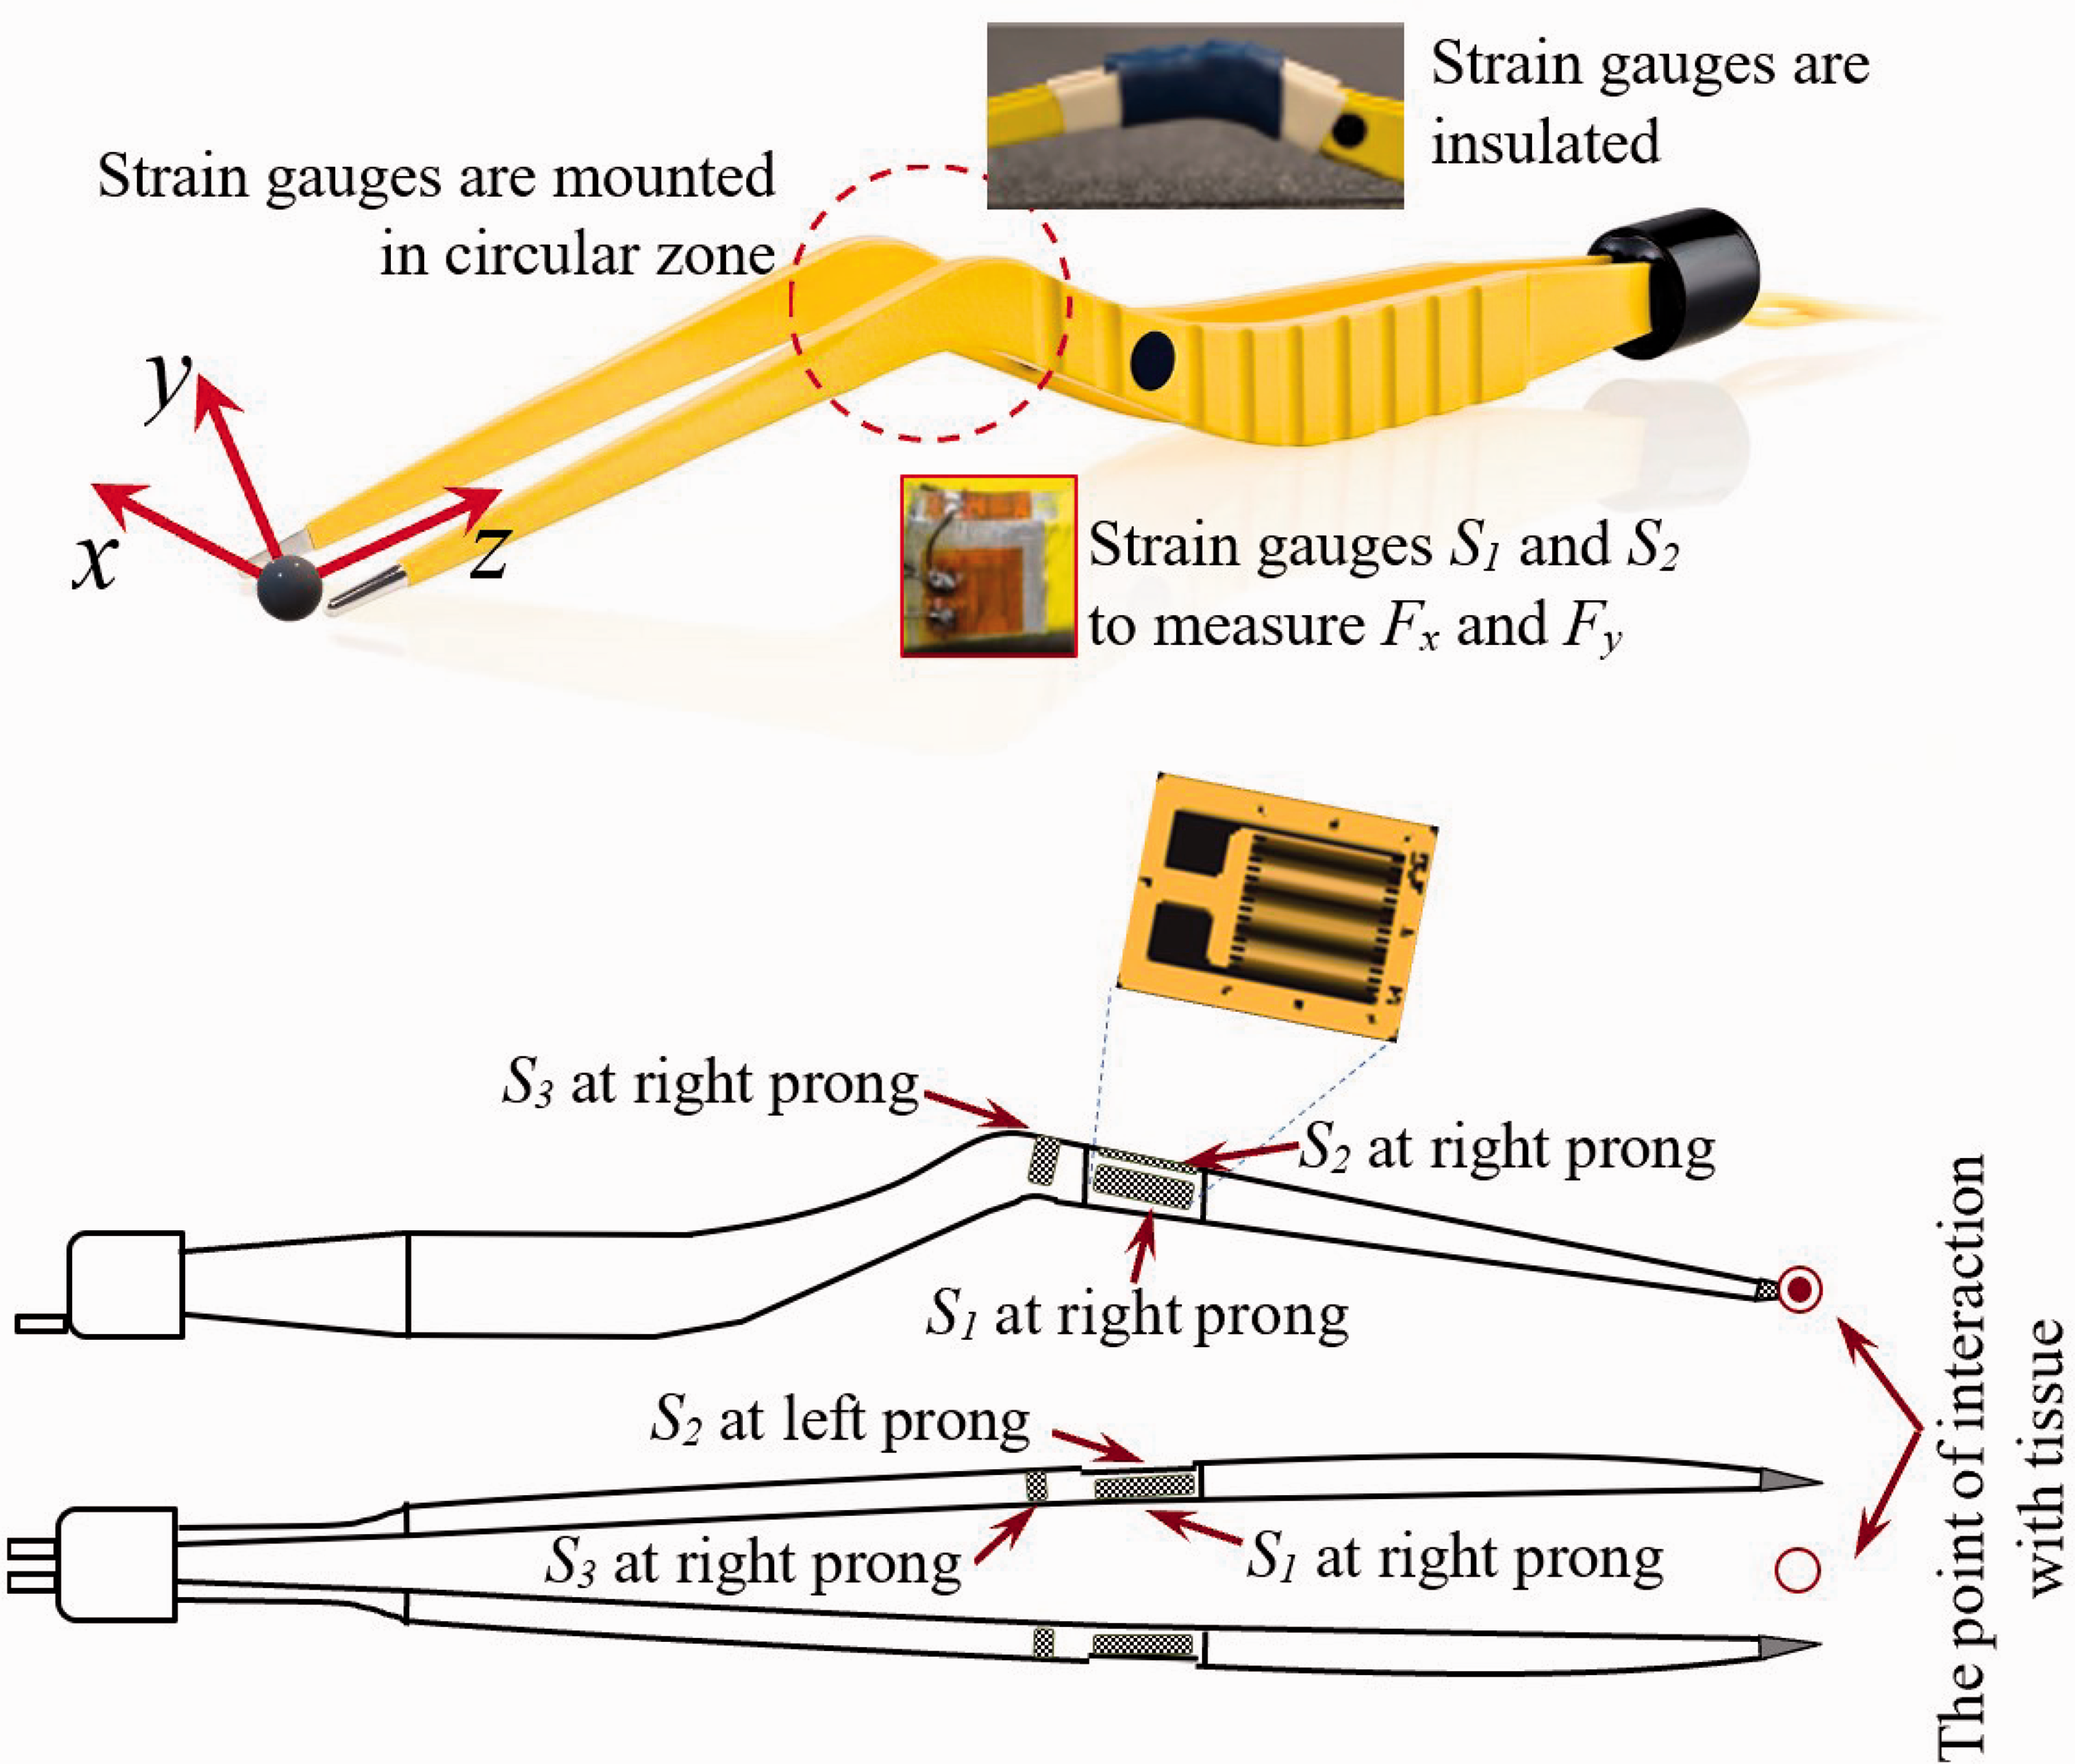
Schematic of the developed bipolar forceps that uses three strain gauges S1, S2, and S3 to quantify the force components in x, y, and z directions, respectively. The bipolar forceps is covered with a nonconductive material to protect the circuit during the operation and sterilization.
Due to the nonlinear behavior of the strain gauges in the revised form of sensorized bipolar forceps, the signals measured from some of the strain gauges are often very noisy and out of range. As a result, the current approaches can provide accurate estimates of the forces in only x and y directions, and are not able to obtain reasonable results when data on the x, y, and z directions are used simultaneously. In this paper, we develop different techniques to address this important issue. To this end, we first adopt the nonparametric bootstrap technique for our 3D dataset and demonstrate that this technique does not properly estimate the interaction force in all three directions. We then propose different approaches based on a weighted least squares regression 7 method as well as Multilevel modeling 8 using a Bayesian approach. 9 As underestimating the implemented forces is not desirable in our application, we develop a new Bayesian multilevel modeling approach using an asymmetric penalty (loss) function that penalizes underestimation more than overestimation. Theoretical results are augmented with a real data analysis using training, testing and validating datasets.
The rest of the paper is organized as follows. In Section 2, we discuss the experimental dataset, state of the main issue pertinent to analyzing the data for estimating the true value of the force components in three Cartesian directions using voltages read from the strain gauges mounted onto each prong of the bipolar forceps. In Section 3, we develop two nonparametric bootstrap techniques using the least squares and the weighted least squares methods, and show how the weighting approach can partially resolve some of the issues pertinent to our dataset. A multilevel modeling approach is developed in Section 4 using the Bayesian and non-Bayesian methodologies for explained estimation problems. A linear exponential (LINEX) loss function, as an example of an asymmetric penalty function, is used to obtain estimates in order to avoid underestimation of the applied forces. We also propose a weighted approach for the multilevel modeling to account for the nonhomogeneity of the read voltages from different strain gauges in the device. We discuss how to obtain the precision and confidence intervals associated with each estimate. The results of implementing the proposed approaches are reported in Section 5. Conclusions made in this research and future work are outlined in Section 6.
2 Statement of the problem and specification of employed calibration dataset
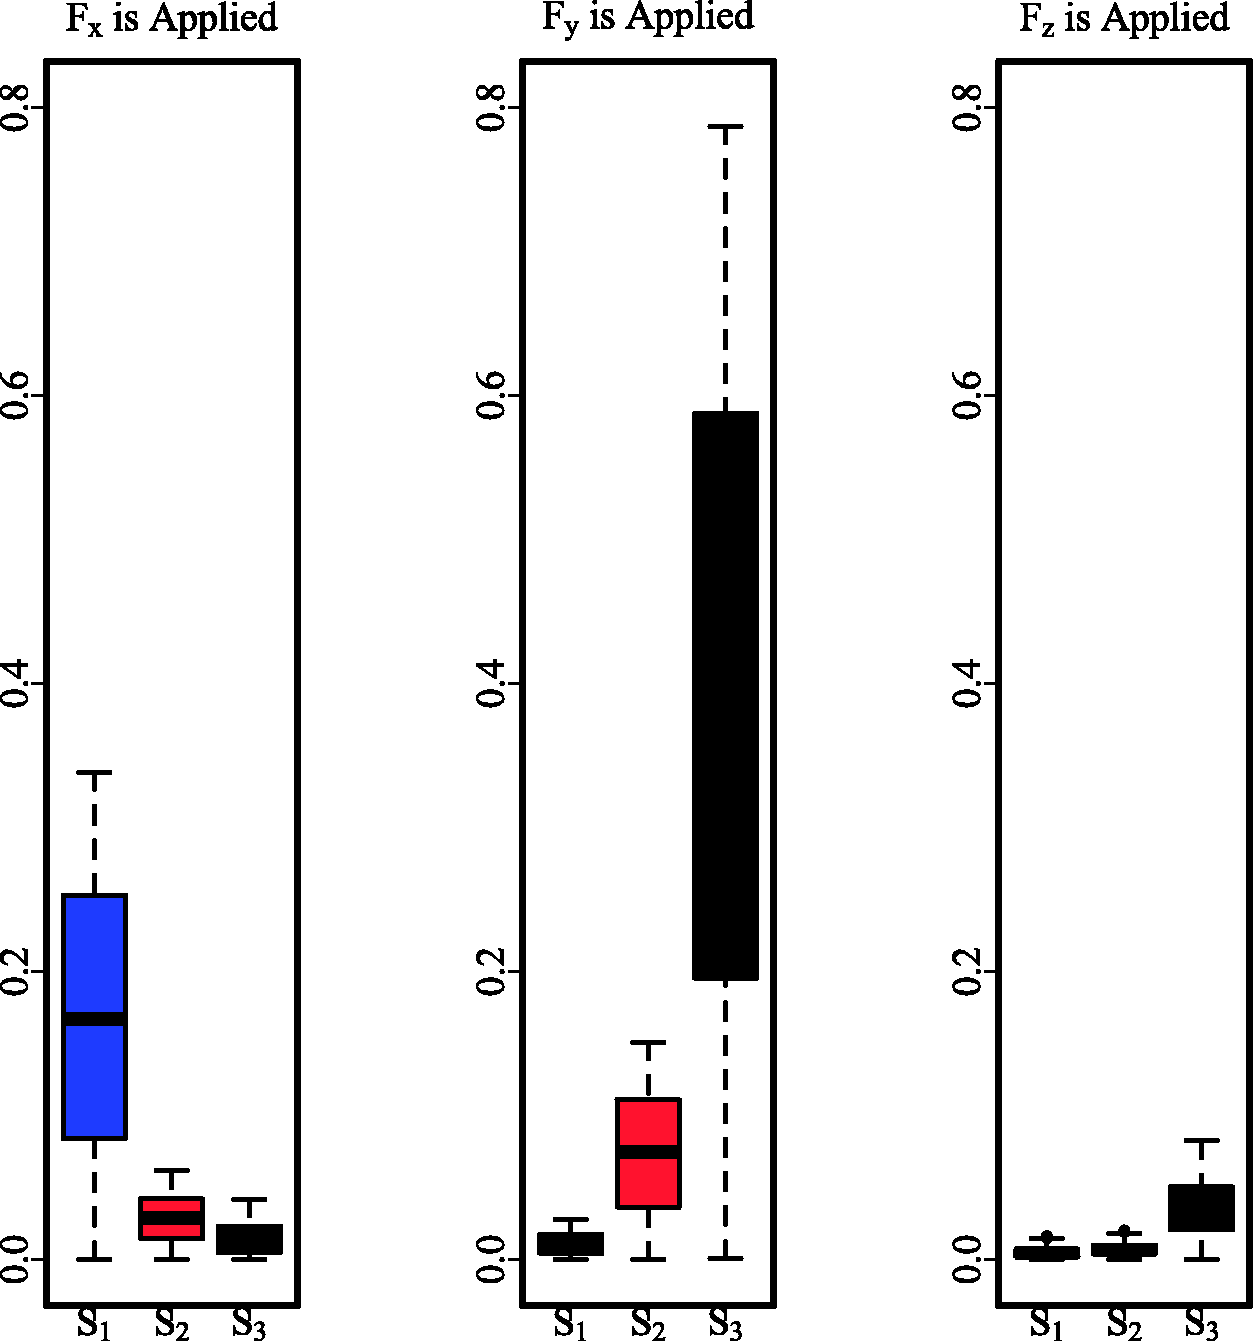
The calibration dataset is obtained by applying forces in the x, y, and z directions, where each pair of the strain gauges measures the deflection in the corresponding direction. The amount of deflection in each direction is quantified using a voltage read from the corresponding strain gauge. Specifically, the strain gauges S1, S2, and S3 are designed to measure three individual voltages when a force is applied along the x-, y-, and/or z-axes, respectively. While three strain gauges are installed on each prong of the forceps, we only present the dataset of one of the prongs in this study for the sake of compactness. Figure 2 illustrates the box plots of the voltages in S1, S2, and S3 when the force is applied in x, y, and z directions, respectively. When the force is applied in a certain direction, we expect to observe a substantial amount of output voltage from the corresponding strain gauge. For instance, the application of a force in the x direction should result in larger output voltages from S1 than S2 and S3. Similarly, an applied force in the z direction should result in output voltages in S3 that are significantly higher than those recorded in S1 and S2. The first panel of Figure 2 shows the read voltages when the force is applied in the x direction. One can see that the observed voltages in S2 and S3 are close to zero, while voltages read from S1 are more significant as expected. However, when Fy is applied, an anomaly occurs as we see in the second panel of Figure 2 that the observed voltages in S2 and S1 are close to zero, but voltages in S3 are remarkably significant. Nevertheless, we expected to observe voltages in S2 be more significant than those read from S1 and S3. Also, from the third panel of Figure 2, it seems that when force is applied in the z direction, mounted sensors have difficulty recording anything significant. Although the behavior of the read voltages is in line with one might expect. We suspect that this problem is caused by improper placement of S3. In other words, when a force is applied in the y direction, S3 experiences more deflection than S2 due to specific configuration considered to measure the voltages corresponding to the z-axis. As we observe in Figure 2, another issue pertinent to observations concerns the variability of the observed voltages in each strain gauge. Variances of the observed voltages obtained from three strain gauges are significantly different given applied forces along each axis. To address these issues, we propose methods based on the bootstrap approach with a Bayesian multilevel modeling to provide meaningful estimates of the force along the z direction.
Observed voltages in strain gauges 1, 2, and 3 (
In this paper, three groups of datasets obtained from the strain gauges S1, S2, and S3 of sensorized bipolar forceps are used:(i) Training: in which both forces and voltages are observed, (ii) Validation: which is used for tuning model parameters and perform model selection (iii) and Test: in which we observe both voltages and forces (same as the Training datasets); however, the forces are assumed to be unknown. The latter group is used to predict forces by the proposed methodology for comparison purposes. 6 For obtaining the Training dataset, 20 trials were run using the bipolar forceps proposed and applied forces and observed voltages were recorded.2,3 In each direction (x, y, and z), forces between 0.2 N and 2 N with increments of 0.2 N in forward and backward directions were applied to the left and right prongs of the forceps and observed voltages were recorded. In forward motion, the applied force increased from 0.2 N to 2 N, in the backward direction the force was reduces from 2 N to 0.2 N.
3 A bootstrap approach based on a weighted least squares method
In this section, we study a nonparametric method based on the bootstrap approach to estimate the true values of the forces using observed voltages in a 3D situation. 6 We present an algorithm based on an ordinary least squares regression modeling approach. To resolve the issue of nonhomogeneity of the read voltages and improve the bootstrap approach one can use a weighted least squares approach for model fitting.
Suppose we observe


1. Form the rth bootstrap training and test datasets by resampling the residual pool

and
2. Fit models (1) to the bootstrap datasets T(r) and associated forces to obtain the corresponding values of the parameters, denoted by 3. Calculate 4. Repeat steps 1 to 3 for 5. Use the B estimated force values to construct point and interval estimates as described in Azimaee et al.
6

As we show in Section 5, this method provides acceptable estimates of the forces in the x and y directions, while suffering from poor performance in the z direction. Due to the nonhomogeneity of read voltages from the strain gauges, the variability of the residuals obtained from fitting regression models in our OLS approach is also changing from one model to another. This suggests using a weighted least squares (WLS) approach with proper weights in order to obtain more suitable regression models to be used in our proposed bootstrap method. To this end, we use the inverse of the variances of observations read from each strain gauge to construct the necessary weights in the WLS approach to run the bootstrap calibration procedure.
4 Multilevel modeling and a Bayesian approach using the LINEX loss function
In this section, we propose a new method based on multilevel modeling. We develop necessary estimates under an asymmetric loss function to avoid underestimation of the applied forces in each direction, which is more important than overestimation in our application. Multilevel models are generalizations of the regression models, in which a set of data is structured in different categories such that their characteristics and the model’s coefficients can vary within each category.
Multilevel models are also referred to as mixed models as they consist of fixed and random coefficients. 9 In this approach, instead of complete pooling (i.e. ignoring the effects of different group levels) or no-pooling (i.e. separate modeling for different groups), one can perform a partial pooling 8 to avoid overfitting the data and account for nonhomogeneity between different groups.
Consider the force direction as a group factor with three levels corresponding to x, y, and z, respectively. We introduce the varying slope models with no intercept
9

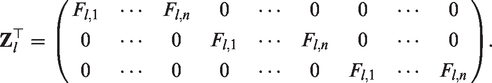
By putting together the voltages read from the stain gauge l (for all values of j and i) into a vector

Similarly,

Note that working with the covariance matrix Σ l is very convenient. However, it worth mentioning that Σ l provides a simplified representation of the existing covariance structure in our data set and one might decide to work with more general cases where the matrix Gl is not diagonal.
4.1 Estimation of fixed and random effects coefficients
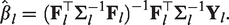
For the moment, suppose

Maximizing (9) with respect to βl results in
Note that

In order to derive an expression for

which is minimized at

Therefore, assuming that

In our calibration problem, underestimating the amount of implemented force on the brain tissue might have severe consequences such as the need for repeating a surgical task and increasing time of the operation and should be prevented. To this end, we use a LINEX loss function to penalize underestimation more than overestimation and obtain results that are more suitable for the targeted problem.10,11 The LINEX loss function is defined as


Now, the Best LINEX Unbiased Predictor of

Assuming that
4.2 Estimation of the covariance matrices
and
The ML approach and restricted (or residual) ML (REML) strategies are proposed to estimate
We then substitute


4.3 Bayesian approach for multilevel modeling
In order to improve our estimation in terms of accuracy, we employ the Bayesian approach for the multilevel regression problem. This allows us to incorporate prior information about the underlying problem into the estimation process and obtain better and more accurate estimates.
9
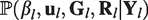
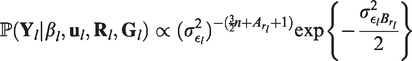
To this end, considering the multilevel model (7), we first write the posterior distribution of

Suppose,

Therefore


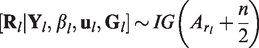
Using (18), straightforward calculations show that


Using (20) and (21), it is straightforward to show that
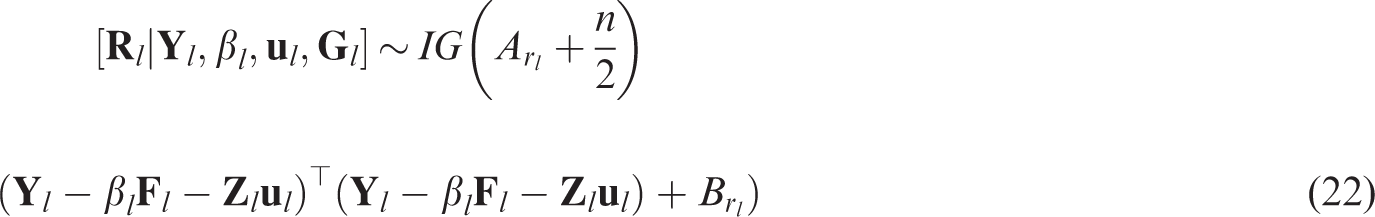
Similar to (21) for
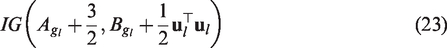
Finally, in order to make statistical inference, we use the Markov Chain Monte Carlo (MCMC) approach to sample from the posterior distribution based on the following algorithm9
Generate initial values For Sample Sample Sample
For the comparison purpose, we obtain the estimates under the SEL and LINEX loss functions. Through the MCMC process, we obtain M estimates of βl and
Under the LINEX loss function these estimates are obtained by averaging estimates obtained via (14),
5 Results
5.1 Results obtained from bootstrapping
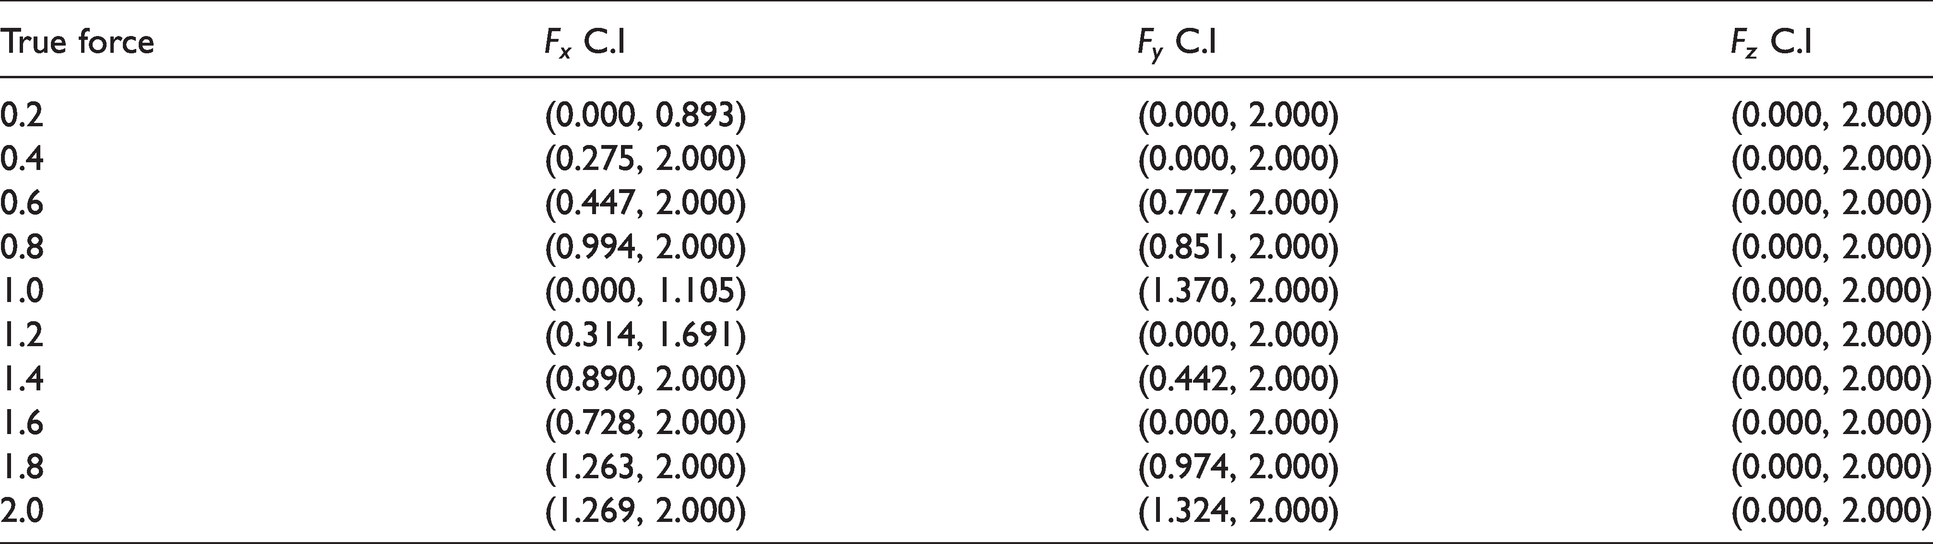
Table 1 represents the estimated bootstrap confidence bounds in each direction for the amount of forces between 0.2 N and 2 N with an increment of 0.2 N. Under the LS approach the bootstrap confidence intervals are too wide, and the estimated forces are often very different from the true force values. Figure 3 shows the observed voltages from each strain gauge where different colors are used to show different directions. It also shows the residuals obtained by fitting LS regression models in (1). One can see that the residuals are not homogeneous and those pertinent to S3 are relatively large. To adjust for nonhomogeneity of the error terms, we used the bootstrap method with a WLS approach based on the following weights
7

Bootstrap confidence intervals for forces applied to the right forceps tip, in the x, y, and z directions using the LS regression approach.
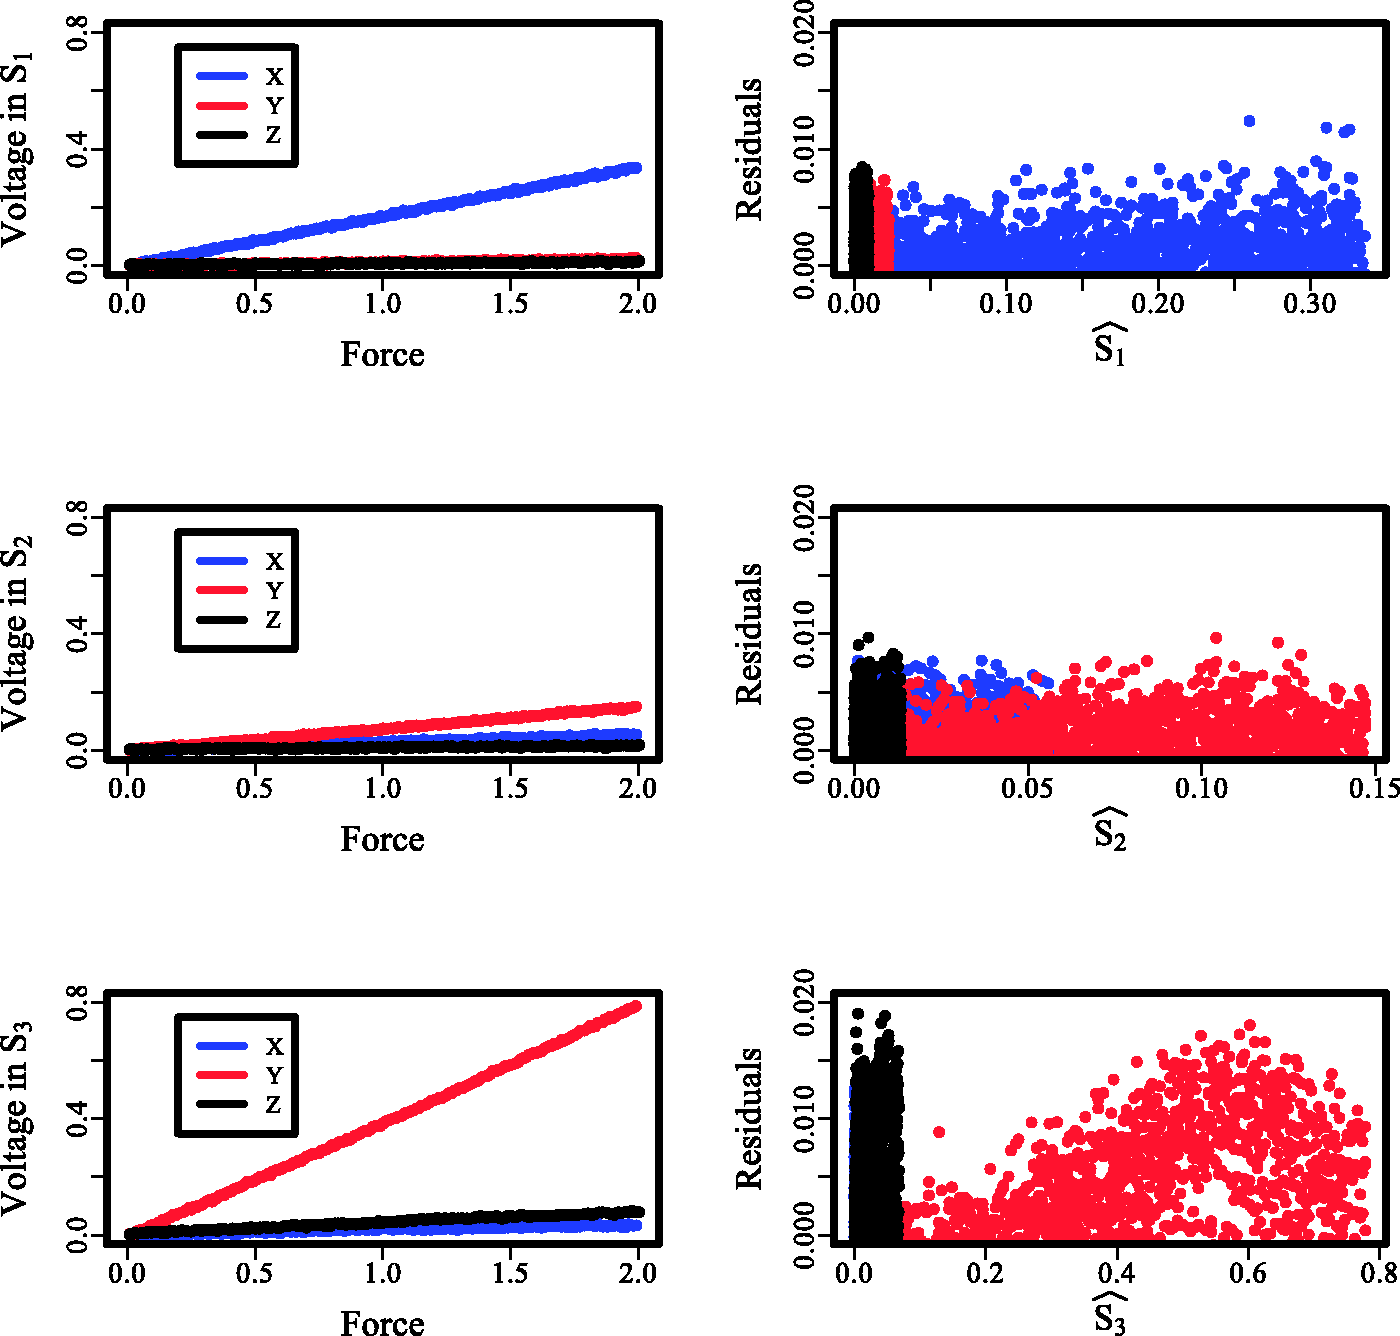
In the left panel, observed voltages from each strain gauge are presented versus the amount of force in three directions. In the right panel, residuals obtained from fitting models in each strain gauge are illustrated versus the fitted values of voltages for all three directions. Different directions are specified with different colors.
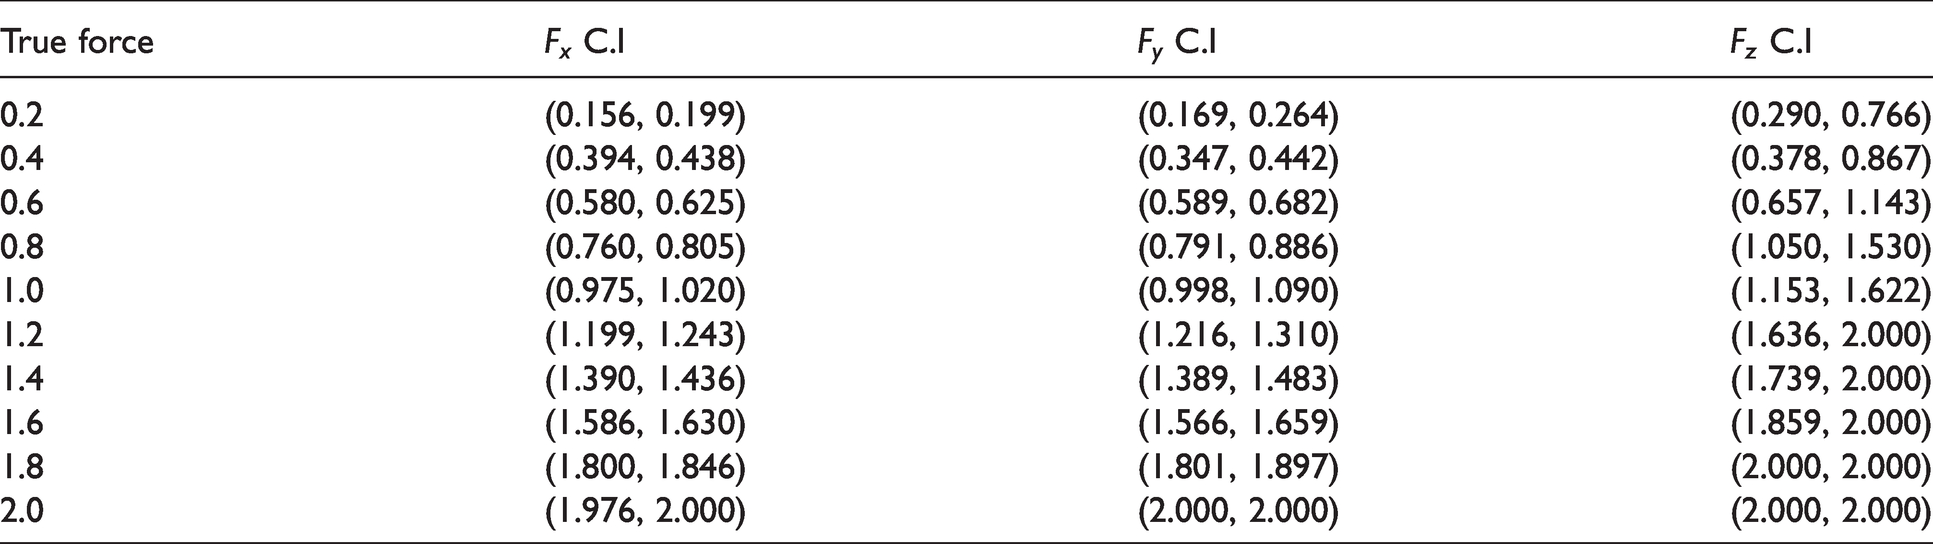
These weights are associated with the variance of the voltages read from Sl in (1), l = 1, 2, 3. Results for the bootstrap method with WLS regression models are presented in Table 2. We observe that estimated confidence intervals are significantly improved compared to Table 1. For most cases, the true amount of forces in the x and y directions are within the estimated intervals. However, estimated confidence intervals for forces in the z direction are still not accurate enough, and the length of the intervals is considerably large.
Confidence intervals for forces applied to the right forceps tip, in the x, y, and z directions using the WLS regression approach.
5.2 Results obtained from multilevel modeling
For the multilevel modeling approach we used
In theory, we should not consider intercepts in the underlying models, since voltages are not observed when no forces are applied. However, we violate this assumption and consider models with intercept, which provides better results. Also, we performed our study under both SEL and LINEX loss functions. For the LINEX loss function, we use
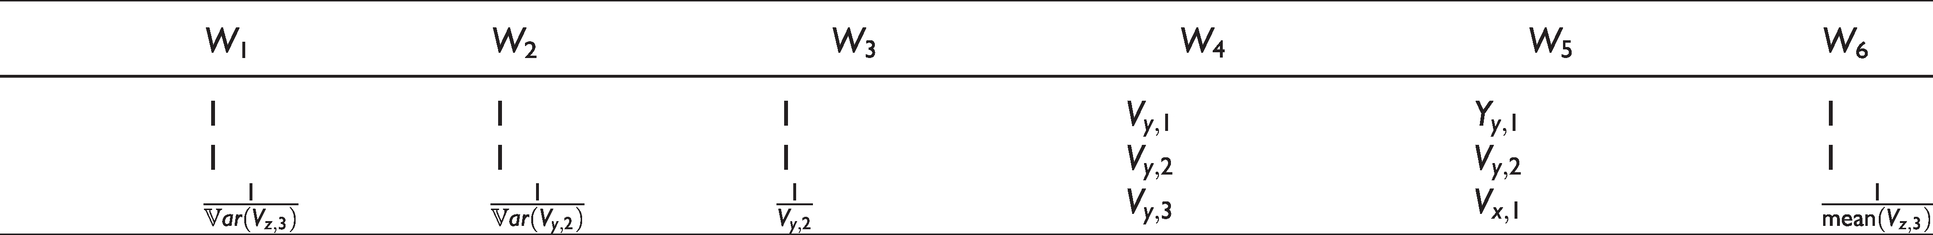
According to our numerical studies (not presented here), we observed that under the LINEX loss function, estimated forces in the x and y directions are close to their true values, but estimation in the z direction is not accurate enough irrespective of the values of α. The details of such numerical studies can be found in Chapter 4 of Azimaee. 15 This is due to mechanical issues associated with adding the third pair of strain gauges as discussed in Section 2. To address this, we decided to apply weights in our multilevel modeling approach. Since the problem was only in estimating the forces along z direction, we applied weight only for l = 3 in model (7) to account for the problem in the voltages read from Sl. As shown in Table 3, we considered different weights associated with data obtained from S3 when forces are applied in the x, y, and z directions.
Six different proposed weights to use in multilevel modeling approach.
Our comprehensive numerical studies in Azimaee
15
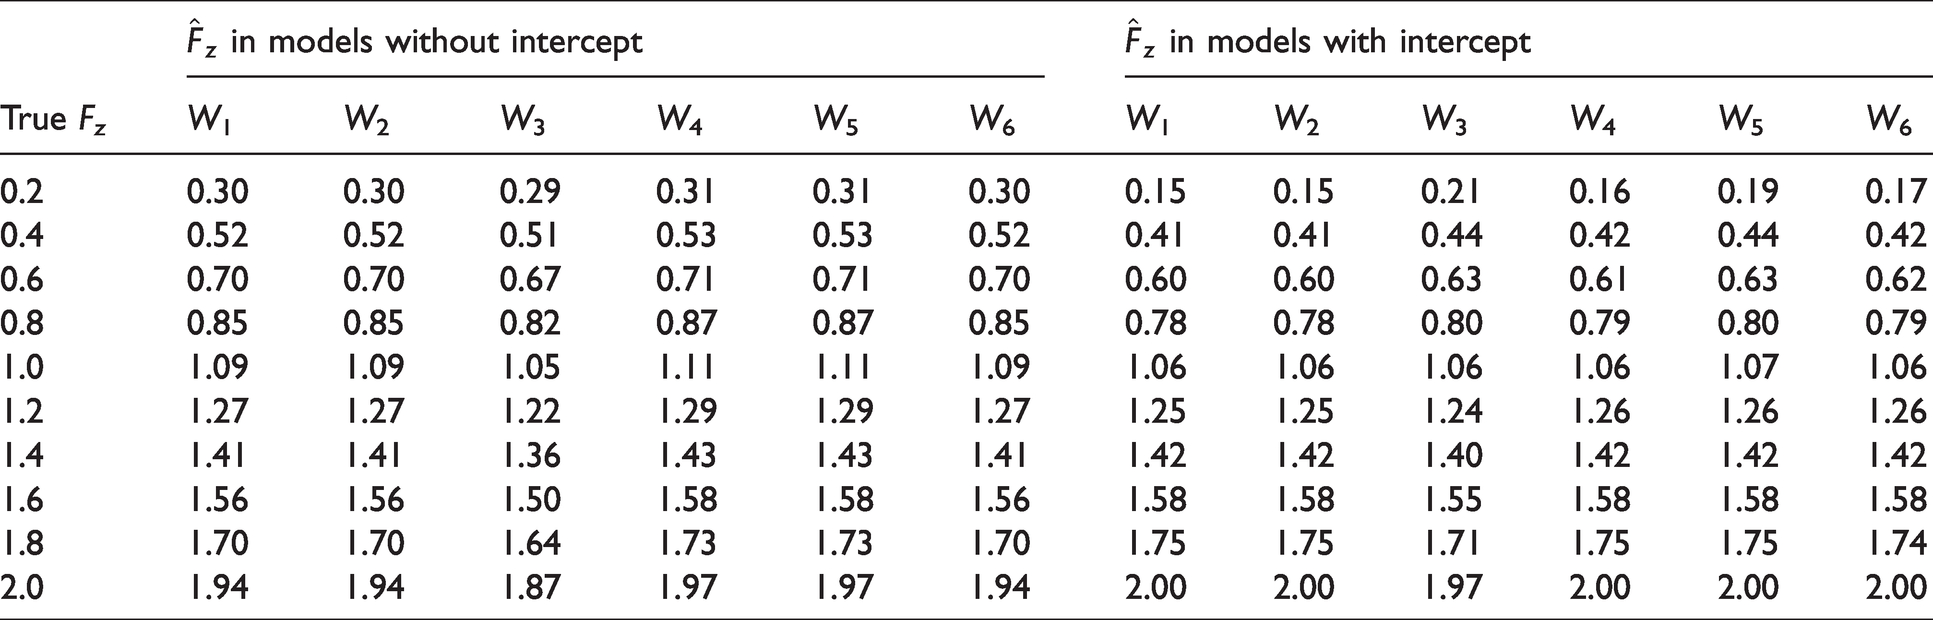
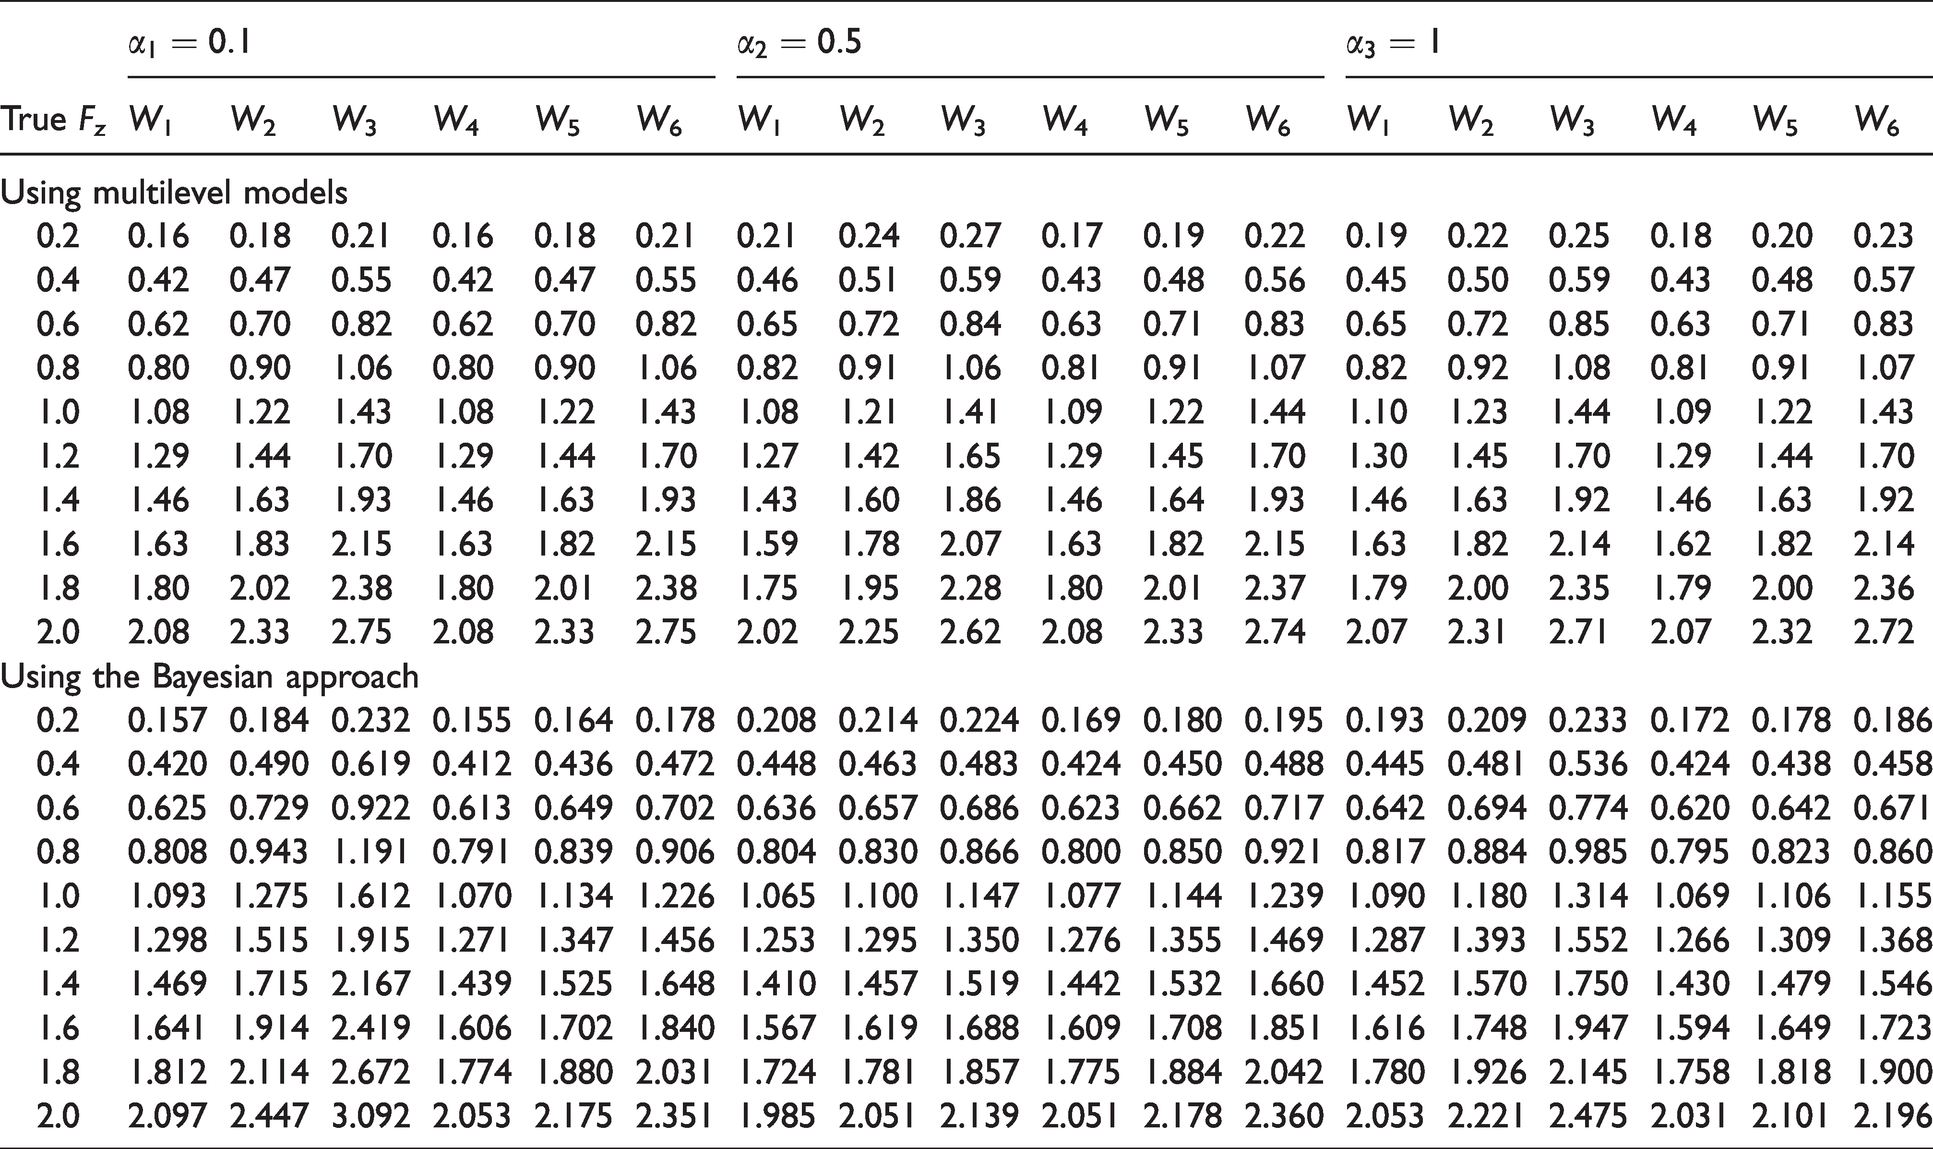
show that models with intercept provide better force estimation compared to those without intercept. As such, we only present the results for models with an intercept from here on. Table 4 shows estimated forces in the z direction using different weighs under the SEL function for models with and without intercept. Under the LINEX loss function the best results are obtained when
Estimated forces in the z direction, considering six different weights under the SEL loss function using models with or without intercepts.
Estimated forces in z direction, considering six different weights under the LINEX loss using models with intercept using the multilevel models and the Bayesian approach.
In order to provide interval estimation, we employed a bootstrap technique with multilevel models. Once again, we considered both models with and without an intercept for obtaining the results. Bootstrap results are obtained from models with considering weights (WLS). The bootstrap procedure is the same as in Section 3, except that instead of linear regression models, we fitted multilevel models as presented in (7). Based on the results presented in Tables 4 and 5, we selected W3 to be used in the model for estimating forces in z direction under SEL and W1 under LINEX loss in the bootstrapping procedure. We also considered
5.3 Results obtained using the Bayesian approach
In this section, we report predicted values of the applied forces along x, y, and z directions that are obtained using the Bayesian approach under both SEL and LINEX loss functions. To obtain the results, we used lmer-stan function of “rstanarm” package, in
Once again, we considered intercepts in the model and applied weights (as described in Section 3) in the model (WLS). Results are reported in Table 5 for models with an intercept under the LINEX loss function. One can observe that estimated forces using models with intercepts are close to the true values of forces. Among all weights that have been employed, W4 provides more accurate results and most predictions are very close to the true amount of applied forces for models under both SEL and LINEX loss functions. For instance, there is no bias in estimating the true force of 2 N, under the SEL when W4 is applied. Another point to consider is the robustness of the algorithm with respect to the choice of different priors for
Point estimates of applied forces in the x, y, and z directions using the Bayesian approach in multilevel modeling with different priors for models with intercepts.
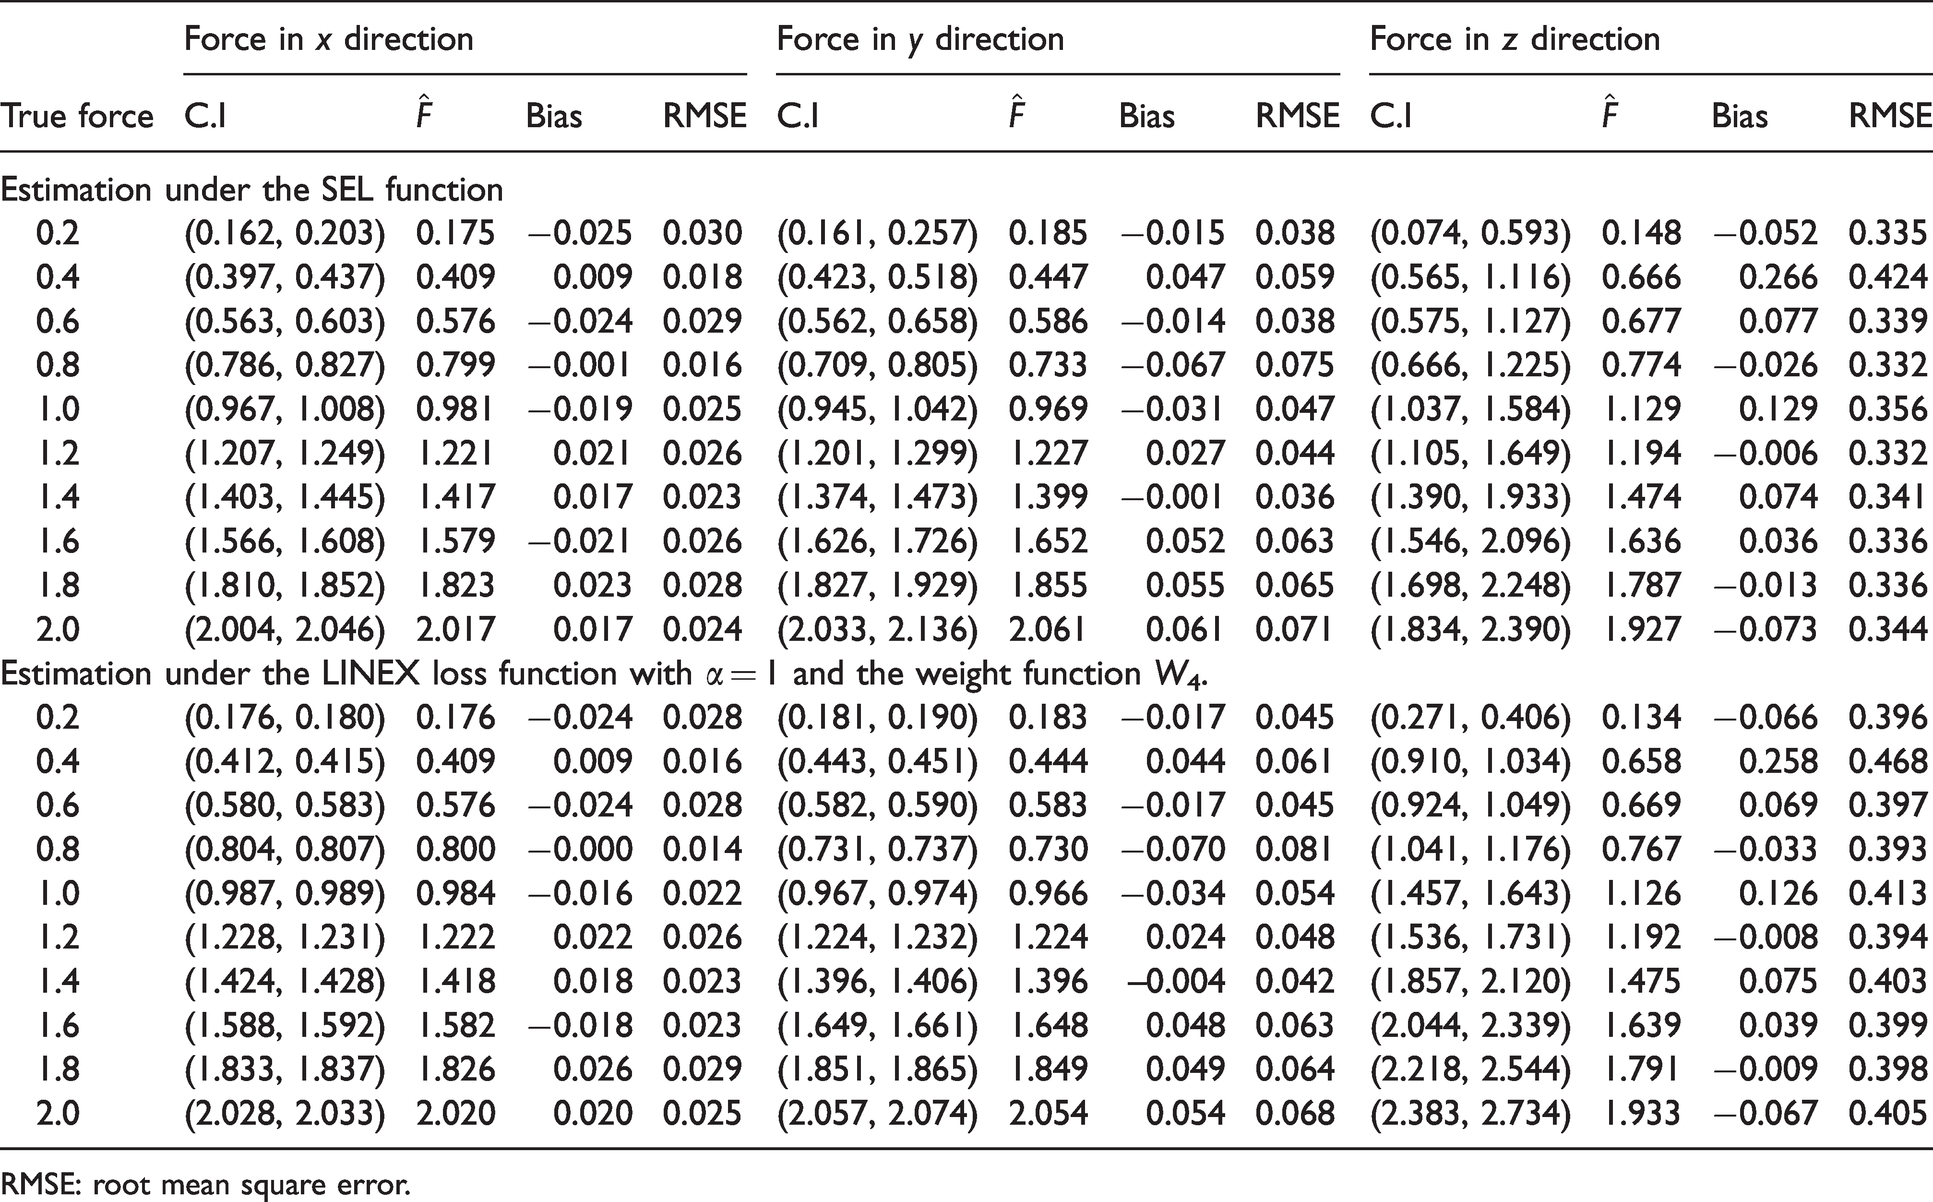
We also employed the proposed bootstrap method in Section 3 for the Bayesian approach. Results of bootstrapping under the SEL approach and the LINEX loss function are presented in Table 7 when we use the weight function W4 and α = 1. Under the SEL function confidence bounds that we obtained using models with intercept for Fz are more precise and almost always contain the true values of the forces, nevertheless, the bounds are relatively wide. Point estimates of applied forces in the z direction are much better than other estimates and the bias is negligible under the SEL function. As can be seen, under the LINEX loss function, estimated confidence intervals for Fx and Fy are very narrow, and often do not contain the true values of the force. Although the calculated bounds for Fz are also narrower, true values of force are not included within the bounds. The advantage of results obtained under the LINEX loss is that the point estimates with considering intercept in the models are relatively accurate. In Table 7, we have used the bias and RMSE as the usual performance measures under to compare our estimates. One can also calculate the bias and risk associated with estimates under the LINEX loss function. 17
Point and interval estimates of applied forces in the x, y, and z directions using the bootstrap method and the Bayesian approach for multilevel modeling under the SEL and LINEX loss functions.

RMSE: root mean square error.
6 Conclusions and future work
We proposed several statistical methodologies to provide accurate point and interval estimates of force components exerted to the brain tissue during the performance of surgical tasks. Three small strain gauges were mounted onto each prong of a conventional surgical bipolar forceps, and the voltage signals of each strain gauge installed on a calibration station were used to estimate the value of force components applied. To calculate the estimates of the interaction forces, we developed a bootstrap technique that was later used in conjunction with weighted least-squares linear regression and multilevel models to estimate the unknown force values using observed voltages. The nonparametric bootstrap technique provides accurate point and interval force estimation along the x and y directions and fails to accurately estimate the force in the z direction due to particular mechanical design considered to place the strain gauge for measuring the force along the z-axis. We introduced different weights to the model building process to come up with more accurate estimates. After applying these weights, bootstrap results were improved as well, but still, results were not satisfactory for the z direction.
Since the calibration data was readily structured based on the direction in which the force was exerted to the brain tissue (in x, y, and z directions), we developed a proper multilevel model for our calibration problem. The force estimates obtained from the multilevel modeling yield better estimates when compared with those under the WLS approach. The estimates improved further as weights were introduced into the model. Furthermore, we enhanced our results by using a Bayesian approach to estimate the coefficients of the underlying multilevel models. Results obtained under both the SEL and the LINEX loss functions to avoid overestimating the applied forces. We also employed our proposed bootstrap methodology in conjunction with multilevel models to provide interval estimates and enhance the accuracy of our point estimation. The overall results suggest that estimations obtained using multilevel models are more accurate; however, the Bayesian approach provides narrower confidence bounds with smaller bias and RMSEs. Another important observation is that using an intercept in the model helps obtain more accurate results. An interesting direction for future work is to consider measurement error in the model, specifically, multilevel models. 18 This seems to be a proper direction as there are obviously measurement errors in the read voltages from the strain gauges. Another interesting research direction involves robust Bayesian analysis to study the sensitivity of our results with respect to the choice of prior distributions in the underlying Bayesian multilevel modeling approach.
Footnotes
Acknowledgment
The authors gratefully acknowledge the contributions of Project neuroArm at the University of Calgary for sharing the data set for validating the statistical tools employed in this work. These set of data were previously used in part for calibration of surgical tools under the nonparametric Bootstrap technique in 2D. 6 We would like to thank reviewers for their constructive comments, which improved the quality of this work.
Declaration of conflicting interests
The author(s) declared no potential conflicts of interest with respect to the research, authorship, and/or publication of this article.
Funding
The author(s) disclosed receipt of the following financial support for the research, authorship, and/or publication of this article: Mohammad Jafari Jozani acknowledges the partial support of NSERC.