
Abstract
Introduction
In a confirmatory diagnostic accuracy study, sensitivity and specificity are considered as co-primary endpoints. For the sample size calculation, the prevalence of the target population must be taken into account to obtain a representative sample. In this context, a general problem arises. With a low or high prevalence, the study may be overpowered in one subpopulation. One further issue is the correct pre-specification of the true prevalence. With an incorrect assumption about the prevalence, an over- or underestimated sample size will result.
Methods
To obtain the desired power independent of the prevalence, a method for an optimal sample size calculation for the comparison of a diagnostic experimental test with a prespecified minimum sensitivity and specificity is proposed. To face the problem of an incorrectly pre-specified prevalence, a blinded one-time re-estimation design of the sample size based on the prevalence and a blinded repeated re-estimation design of the sample size based on the prevalence are evaluated by a simulation study. Both designs are compared to a fixed design and additionally among each other.
Results
The type I error rates of both blinded re-estimation designs are not inflated. Their empirical overall power equals the desired theoretical power and both designs offer unbiased estimates of the prevalence. The repeated re-estimation design reveals no advantages concerning the mean squared error of the re-estimated prevalence or sample size compared to the one-time re-estimation design. The appropriate size of the internal pilot study in the one-time re-estimation design is 50% of the initially calculated sample size.
Conclusions
A one-time re-estimation design of the prevalence based on the optimal sample size calculation is recommended in single-arm diagnostic accuracy studies.
1 Introduction
The determination of the correct sample size is an essential component of a confirmatory study in general. If the sample size is too large, more patients than necessary will be exposed to a treatment or diagnostic test under investigation. Otherwise, if the sample size is too small, it will not be ensured to find a relevant effect on the basis of those patients who are involved. In each case, ethical and financial issues will arise. The special feature of a confirmatory diagnostic accuracy study is the combination of the sensitivity (as the true positive rate) and the specificity (as the true negative rate) to co-primary endpoints, measured in two independent subpopulations. This means that for both endpoints a separate sample size calculation is performed, giving the needed number of diseased and non-diseased individuals. Based on the prevalence the total sample size is calculated, which can be different for both endpoints. In this case, the maximum of the total sample sizes of both endpoints is the final sample size.
The guideline on clinical evaluation of diagnostic agents of the European Medicine Agency 1 demands the specification of the sample size in a confirmatory diagnostic accuracy study in the study protocol. The guideline highlights the dependency of the sample size on the prevalence. This means that the total sample size for the sensitivity and for the specificity may differ in the case of a low or high prevalence. This aspect leads to an unbalanced design. In a confirmatory diagnostic accuracy study, the sample size of each endpoint is often calculated with an individual power of 90% to reach an overall power of at least 80%. This is possible because sensitivity and specificity are estimated in independent subgroups. However, in the case of a low or high prevalence, the empirical overall power is noticeably larger than 80% due to the unbalanced design. This paper solves this problem of an overpowered sample size determination by providing an approach to calculate the optimal sample size depending on the prevalence. This approach is illustrated through the example of a study design containing the comparison of one experimental test to a prespecified minimum sensitivity and specificity in which the reference standard defines the true disease status. Furthermore, if the true prevalence is not known for the initial sample size calculation in this study design, a procedure for the blinded re-estimation of the sample size based on the prevalence is presented. This enables the adaptation of the sample size during the study.
In the literature, sample size calculations are hardly published in diagnostic studies.2–4 In methodological research, there are several approaches which address the usage of binomial confidence intervals based on the normal approximation as the basis of the sample size calculation. Agresti and Coull 5 describe an own confidence interval which provides a better coverage probability than the standard Wald confidence interval. Beyond that, Piegorsch 6 gives a survey about binomial confidence intervals which are superior to the Wald confidence interval. Wei and Hutson 7 give a new sample size calculation method which is based on the expected width of the confidence interval under the assumption of an hypothesized proportion. Research for blinded sample size re-estimation in the context of clinical trials does already exist.8–10 Asakura et al. 11 published an interim evaluation with co-primary endpoints in clinical trials. However, this approach is applicable only for co-primary endpoints measured on the same individuals. Flahault et al. 12 developed an approach for sample size calculation allowing for uncertainty in the prevalence. They determine the sample size so that the sample contains, with a predetermined probability, enough diseased and non-diseased people. No research is found addressing the problem of overpowering as a consequence of the sample size calculation for co-primary endpoints measured in independent subpopulations. Furthermore, the implementation of a blinded sample size re-estimation procedure based on the prevalence for the comparison of one experimental test to a prespecified minimum sensitivity and specificity neither could be found. This lack of research gives evidence to the present paper.
This publication is structured the following way: at first, the problem of overpowering with the conventional way of sample size calculation in diagnostic accuracy studies with co-primary endpoints is explained. The next two subsections present the theoretical basis and practical application of an approach to negotiate this problem by calculating the optimal sample size. After this, the procedure of a one-time and a repeated blinded sample size re-estimation based on the prevalence is presented. In Section 4, the results of the simulation study concerning the one-time and repeated sample size re-estimation design are compared to those of the fixed design and among each other. Finally, the results of the simulation study are discussed and a conclusion is given.
2 Sample size calculation in a confirmatory diagnostic accuracy study
2.1 Conventional sample size calculation
As already mentioned in Section 1, sensitivity and specificity are combined as co-primary endpoints which is done through the Intersection-Union Test. The global null hypothesis

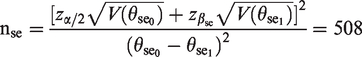
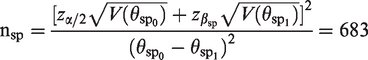
For the sample size calculation in a confirmatory diagnostic accuracy trial, both endpoints must be considered. The true disease status of the patients is unknown at the time of enrolment into the study. The sample size is determined in three steps: first, the individual sample size for the sensitivity
This procedure is exemplified with a confirmatory single-arm diagnostic accuracy study for the diagnosis of pancreatic cancer. The example is based on a two-arm study used by McCray et al.
17
The experimental test to be examined is the computed tomography (CT).The biopsy is the reference standard. The positron emission tomography which serves as the experimental test in the publication of McCray et al.
17
is not considered here. The conventional sample size calculation is done so that an overall power ( 1. Number of diseased individuals
Number of non-diseased individuals
2. Total sample size including at least

Total sample size including at least

3. N = max(
As the example shows, if the prevalence is low, the total sample size of the sensitivity determines the final sample size. Hence, more people than needed are included to show the specificity which often leads to an overpowered study. If the prevalence was high, the same problem would arise. But in this case, the specificity would probably determine the final sample size and the endpoint of the sensitivity would be overpowered now.
2.2. Optimal sample size calculation
To overcome the problem of an overpowered diagnostic accuracy study, an approach for the calculation of an optimal sample size is proposed. This approach ensures the desired overall power which is perfectly adjusted to the prevalence. The sample size is optimal in the way that it is the smallest representative sample that achieves the advertised overall power. The approach is based on the idea to individually split the overall power to the endpoint of the sensitivity and specificity. Hence, an individual type II error is assigned to each of both endpoints so that the required sample sizes of both endpoints are equal. To reach an overall power of 80%, the individual power of each endpoint cannot be smaller than 80%. In conclusion, none of both endpoints is overpowered which leads to a correct empirical overall power. As this method is developed for a confirmatory setting, the true disease status of the patients is unknown at the time of enrolment into the study. In analogy to the conventional sample size calculation, assumptions about the prevalence have to be made.
The mathematical definition of this approach is again exemplified through the single-arm design

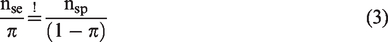

Under the condition


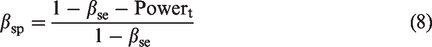
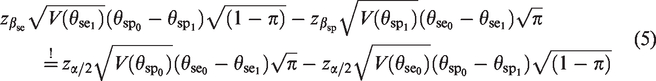
Plug the condition into the sample size calculation
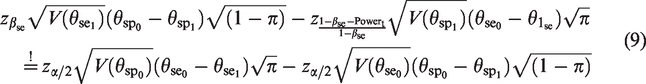
Equation (9) cannot be solved analytically with respect to
The analysis of a study based on this optimal sample size calculation is proposed to be done by the logit confidence interval. It is defined as
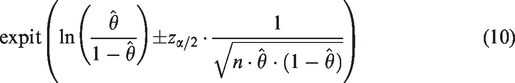
with expit(x) =
2.3 Application of the optimal sample size calculation
The optimal sample size calculation method is now applied to the single-arm diagnostic accuracy study for the diagnosis of pancreatic cancer already used in the context of the conventional sample size calculation in Section 2.1. Both sample size calculations are based on the requirement to reach an overall power of 80% and a maximal type I error rate per endpoint of 5% (two-sided). Figure 1 compares the empirical overall power and the sample size between the conventional and optimal sample size calculation for a varying prevalence π. The sample sizes of both approaches in Figure 1 on the right are almost equal if the prevalence is balanced. But with a decreasing or increasing prevalence, the sample sizes of both approaches differ. Due to the individual split of the overall power to both endpoints in the optimal approach, the sample size of the optimal approach is smaller than the one of the conventional approach. The study under the conventional procedure is highly overpowered in the case of a low or high prevalence. With a balanced prevalence, the empirical power of the conventional approach is closer to the desired theoretical power of 80%. Adapted to the prevalence, the empirical power of a study conducted with the optimal sample size does not relevantly differ from the theoretical power of 80%. Additionally, Figure 1 shows the empirical individual power of both endpoints which varies complementary between 80% and almost 100%. The individual power of one endpoint cannot become smaller than the advertised overall power of 80%.
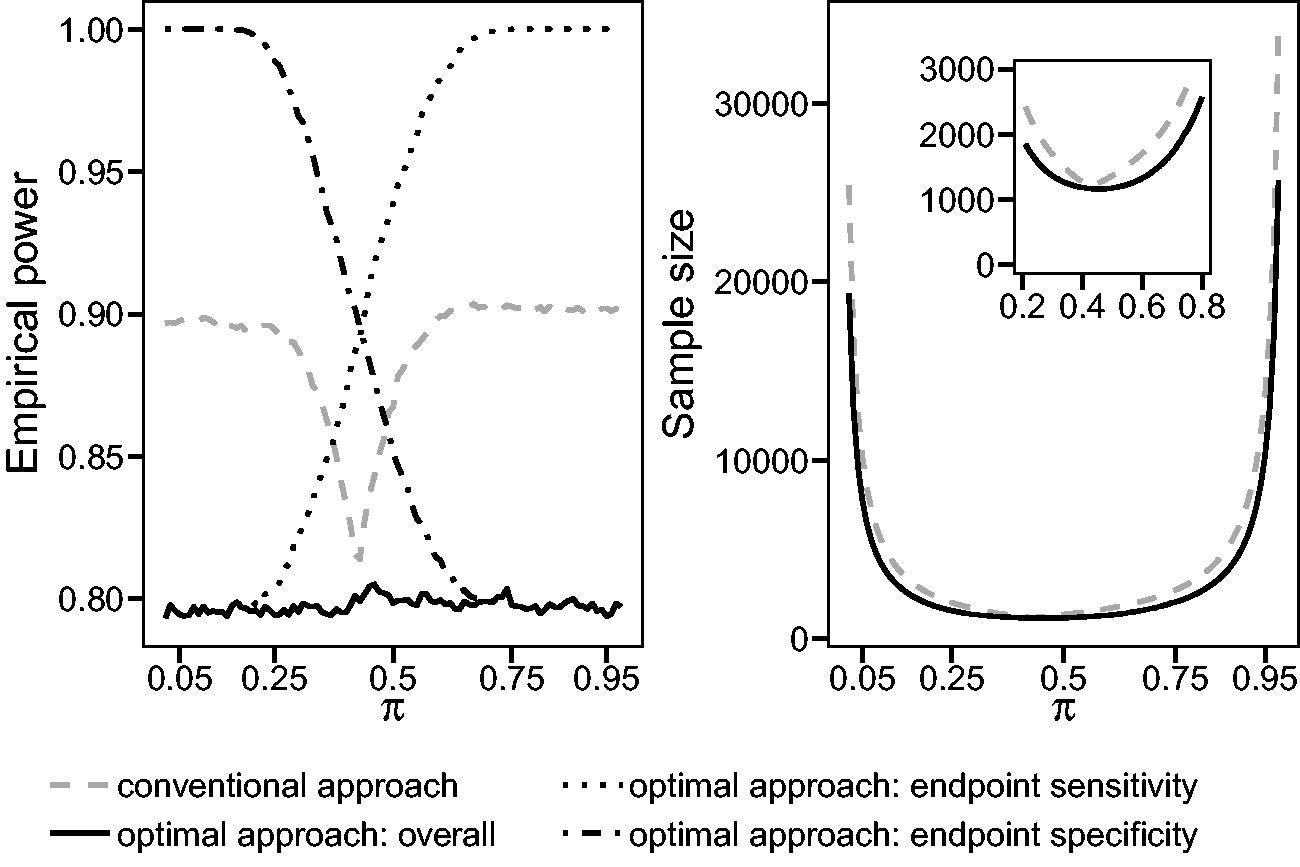
Comparison of the conventional and optimal sample size calculation with respect to a varying prevalence π and the resulting empirical overall power or sample size. The parameters of this example are as follows: α = 0.05 (two-sided),
To reveal the importance of a correct assumption about the prevalence, the discrepancy between the initial sample size based on a wrongly assumed prevalence and the sample size based on the true prevalence is considered. The sample sizes are calculated with the optimal sample size calculation procedure. In the context of the chosen example, the initially wrongly assumed prevalence is 0.3 with a resulting initial sample size of 1367 individuals. Table 1 shows several scenarios with a variation of the true prevalence
Application of the optimal sample size calculation approach: Highlighting the discrepancy between the initial sample size of 1367 people based on the wrongly assumed prevalence of 0.3 and the true sample sizes (true N) based on a varying true prevalence
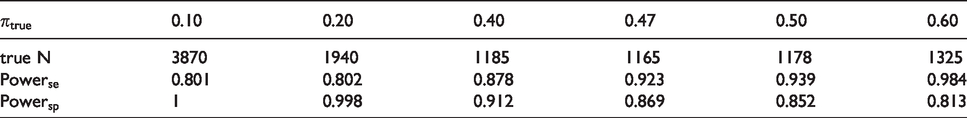
The comparison of the initial and true sample size gives evidence for a re-estimation design of the prevalence during a confirmatory diagnostic accuracy study. In this context, a wrongly assumed prevalence can be re-evaluated and consequently the sample size can be adjusted. The following section introduces the procedure of the blinded sample size re-estimation based on the prevalence, using the optimal sample size calculation approach.
3 Blinded sample size re-estimation
In a fixed design without an internal pilot study, the sample size is calculated based on assumptions of a preceding study and is not adjusted before the final analysis. The process of an internal pilot design with a one-time re-estimation of the prevalence also starts with this initial sample size calculation but runs through five phases:
21
Calculation of the initial sample size with the optimal procedure (e.g. based on assumptions of a preceding study) Recruitment of patients until the predetermined size of the internal pilot study is reached Re-estimation of the prevalence and recalculation of the sample size with the optimal procedure If the recalculated sample size is larger than the already recruited sample size, further patients will be recruited until the adjusted sample size will be reached. Otherwise, no further recruitment is necessary. Analysis of the study based on the unadjusted type I error level due to the blinded character of the re-estimation procedure
In the repeated prevalence re-estimation design, the prevalence and the sample size are re-estimated several times based on a steadily growing sample. The recruited sample increases during each run by a predetermined size. The re-estimation procedure is finished as soon as the already recruited sample is too large to not exceed the recalculated sample size after the addition of the next fraction of patients. Hence, the repeated re-estimation design iterates between step 2 and 3 before it proceeds to step 4 and 5.
The prevalence is re-estimated by the well-known maximum likelihood estimator of a binomial proportion
22
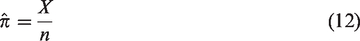
X denotes the number of diseased patients in the sample and n represents the sample size on which the re-estimation is based. The prevalence represents a nuisance parameter in a diagnostic trial. Consequently, the recalculation of the sample size based on the re-estimated prevalence is defined as a blinded adaptive design. 23 In the context of a blinded sample size recalculation in a diagnostic study, the sensitivity or the specificity of the experimental test is kept a secret because they are not of interest during the interim analysis. Therefore, the type I error is expected to be not inflated which will be explored by the simulation study.
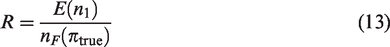
To evaluate the appropriate size of the internal pilot study in the context of the one-time re-estimation design, the quotient R is used. It is defined as
24
4 Simulation study
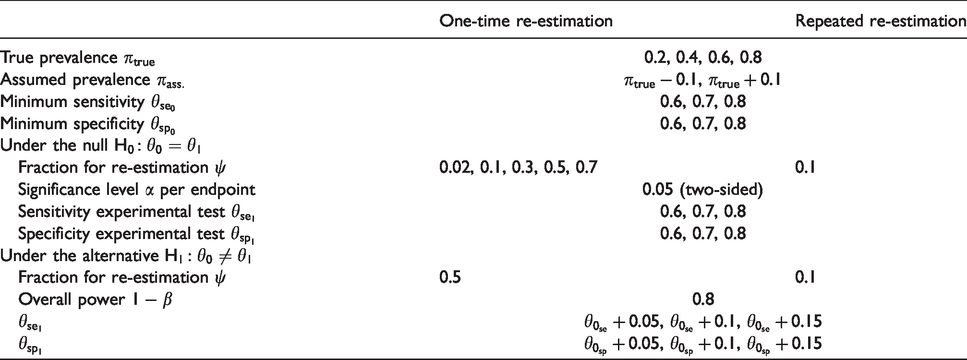
The simulation study aims to evaluate the type I error rate, the power, and the bias of the design with the one-time as well as the repeated re-estimation of the prevalence, each in comparison to the fixed design. Furthermore, the appropriate size of the internal pilot study for the one-time re-estimation is proposed. The mean squared errors (MSEs) of the re-estimated prevalence and of the adjusted sample size are compared between both adaptive designs. For the design with a one-time re-estimation 3888 scenarios, and for the repeated re-estimation design 1296 scenarios are simulated. They are given in Table 2. Per scenario, 100,000 replications are performed.
Simulated scenarios.
4.1 One-time re-estimation of the prevalence
At first, the results of the simulations concerning the type I error rate, power, and bias of the design with the one-time re-estimation of the prevalence are given. The results of the design with the repeated re-estimation of the prevalence are similar to those of the one-time re-estimation design and are therefore not shown in the text. The results of all simulated scenarios are given in the supplement materials as tables. Figure 2 shows the global type I error rate of the one-time re-estimation and the fixed design for the scenarios with
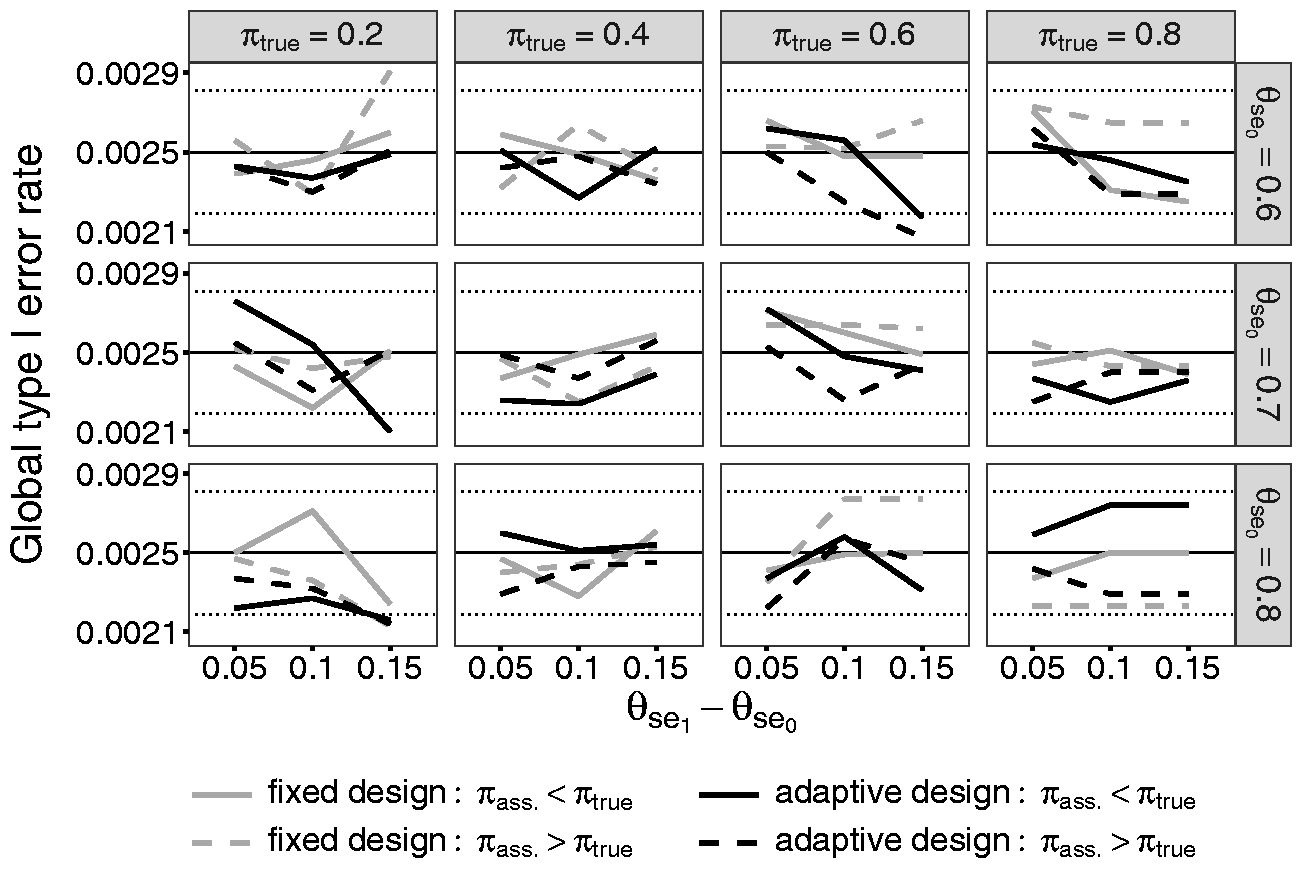
Comparison of the global type I error rates of the fixed design and the adaptive design containing a one-time re-estimation of the prevalence with
A figure containing the individual type I error rate for sensitivity and specificity for the same scenarios as for the global type I error rate is given in the supplement materials. In the following, the results of the individual type I error rate of the endpoint of the sensitivity will be explained. In the scenarios with a small prevalence, a high minimum sensitivity, and a much higher sensitivity of the experimental test, the type I error rate is smaller than 0.05 irrespective of whether the true prevalence is initially over- or underestimated. Kottas et al. 25 show that the logit interval is conservative in the case of a small sample size. In the named scenarios, the small sample is represented through a small number of diseased patients due to the low prevalence. The high minimum sensitivity and the high sensitivity of the experimental test additionally diminish the sample size. The decision of a potential rejection of the null hypothesis is based on this small number of diseased patients who are diagnosed correctly with a high probability. Hence, the use of the logit confidence interval leads to the conservative type I error rates in these scenarios. The individual type I error rates of the specificity reveal the same results in the corresponding scenarios with a high prevalence.
Figure 3 contains the results of the overall power simulations of the scenario with the same parameters as described above in the context of the type I error rate. The results reveal the effect of a wrongly assumed prevalence during sample size calculations in the fixed design. The fixed design is either over- or underpowered depending on the difference between the true and the initially assumed prevalence. If the true prevalence is assumed to be too low, the study will be overpowered in the case of a low prevalence. In this context, the individual sample size of the sensitivity is the maximum to choose. But it is divided by a too small assumed prevalence which leads to a too large sample size. This causes an overpowered study. If the true prevalence is high, the individual sample size of the specificity will determine the total sample size. If the true prevalence is underestimated, the sample size of the specificity will be divided by a too large proportion of the non-diseased. Hence, the sample size and the power are too low. This mechanism will be reversed if the true prevalence is overestimated. Additionally to the true and assumed prevalence, the difference between minimum sensitivity and the sensitivity of the experimental test
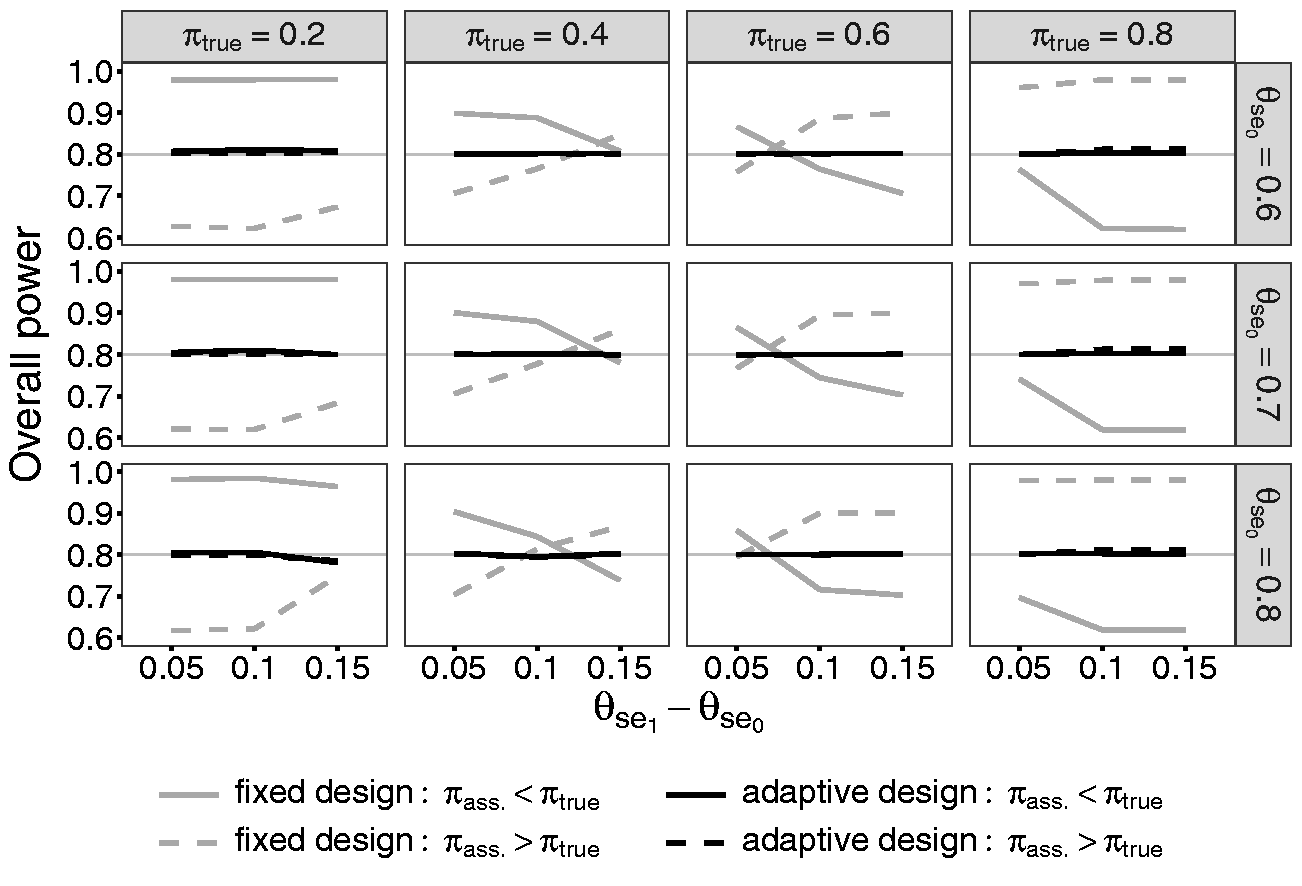
Comparison of the overall power of the fixed design and the adaptive design containing a one-time re-estimation of the prevalence with
The overall power of the one-time re-estimation design reaches exactly the desired power of 80%. Due to the re-estimation of the prevalence, the effect of an initially wrongly specified prevalence can be absorbed. This is valid for all other simulated scenarios.
The bias of the estimated prevalence decreases the larger the size of the internal pilot study ψ is. But with
4.2 The size of the internal pilot study in the one-time re-estimation design
The appropriate size of the internal pilot study is explored by simulating the quotient R of the adjusted sample size after re-estimation
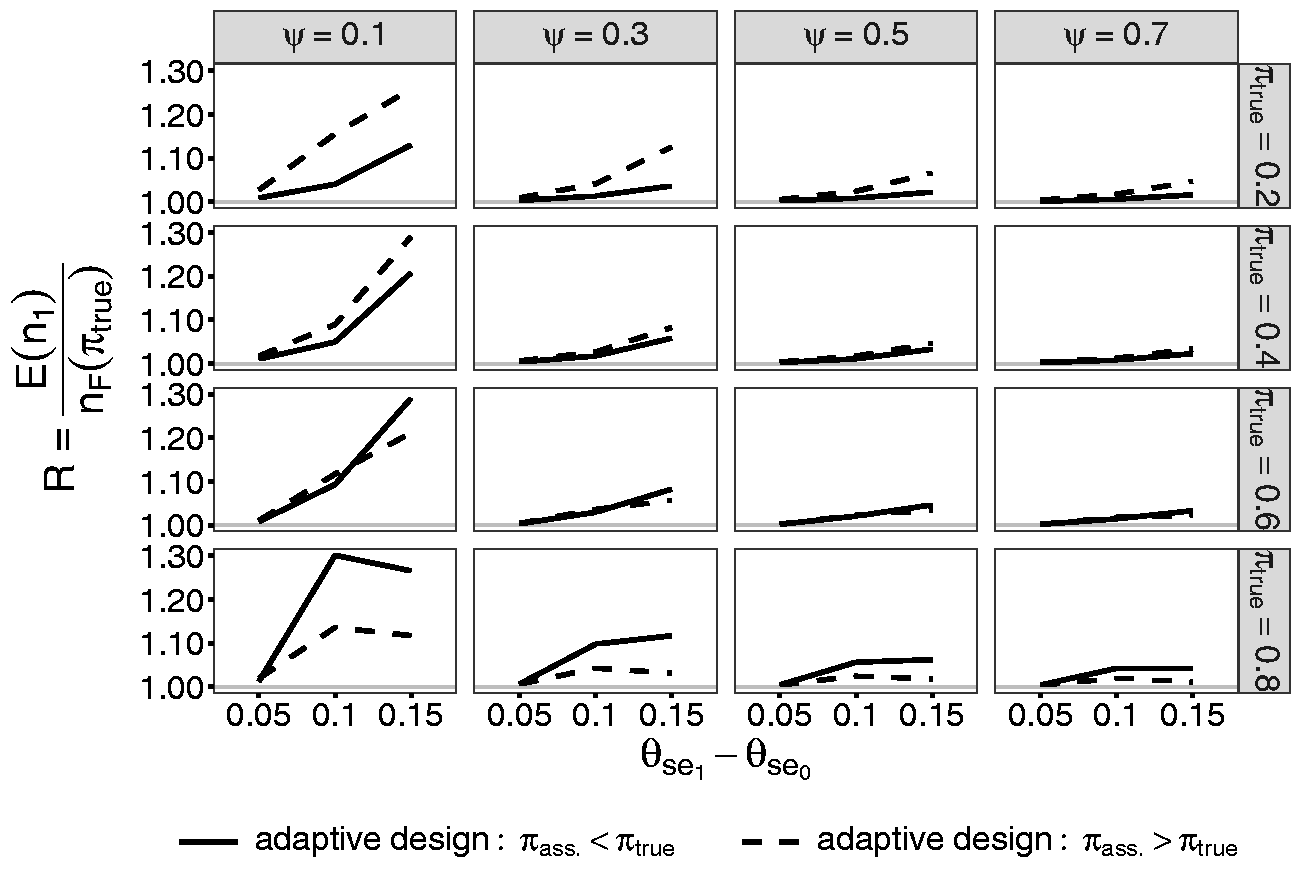
R in dependence of the size of the internal pilot study ψ for the scenarios with
4.3 Comparison of the design with one-time and repeated re-estimation of the prevalence
This section compares the designs with the one-time and repeated re-estimation of the prevalence with respect to the MSE. The MSE measures the squared mean difference between the true prevalence
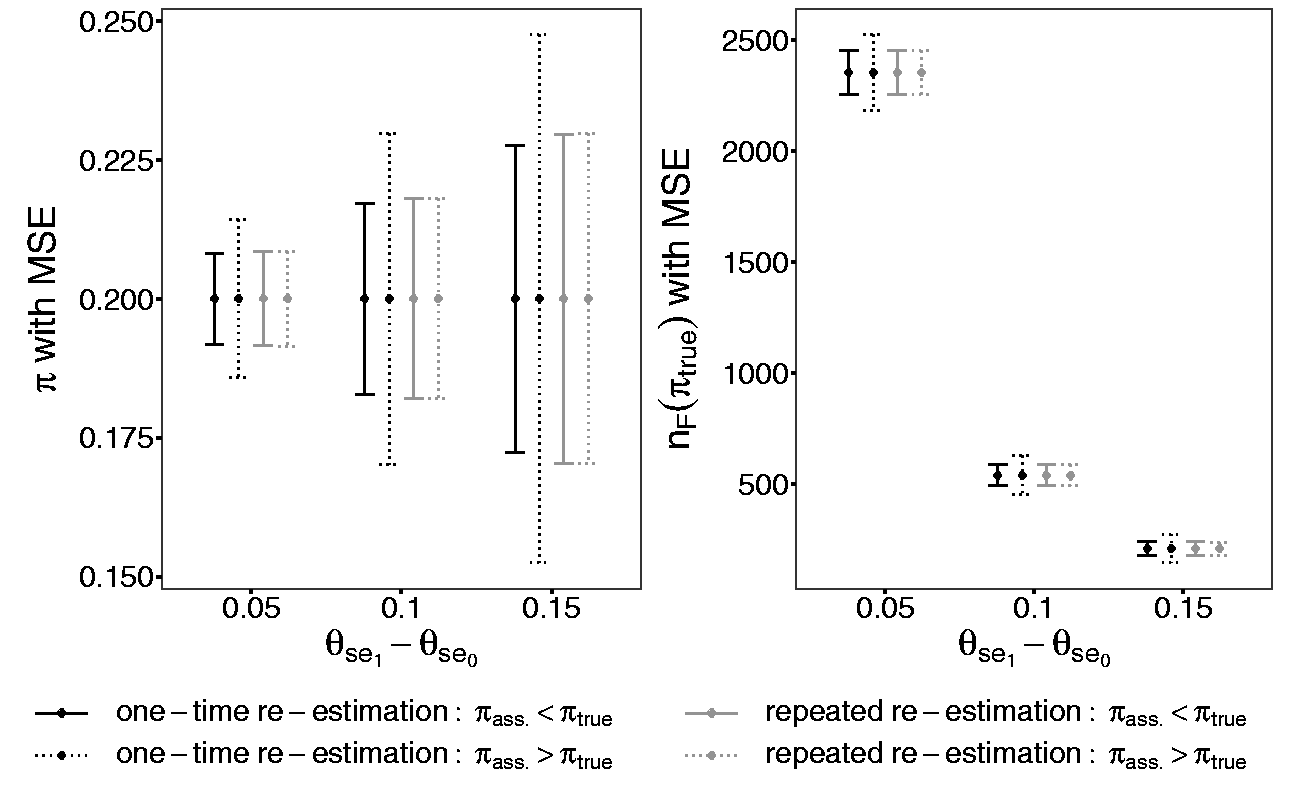
Comparison of the design with one-time and repeated re-estimation of the prevalence regarding the MSE of the re-estimated prevalence
5 Discussion
This paper deals with two aspects of confirmatory diagnostic accuracy studies. First, it presents an improved method for the sample size calculation. This approach allows to calculate the sample size by individually splitting the overall power to each endpoint depending on the prevalence. Consequently, the study will not be overpowered. This approach can be generalized for all sample size calculations combining two co-primary endpoints which are based on independent data. Its idea is to get the same sample size for each endpoint for the purpose of not needing to choose a maximum out of them. Hence, it is not limited to diagnostic studies.
Second, this paper evaluates two designs to re-estimate the prevalence and to adjust the sample size in a confirmatory diagnostic accuracy study: the one-time re-estimation and repeated re-estimation design. For both designs, we propose the optimal approach for the initial and adjusted sample size calculations. Both blinded sample size re-estimation designs do not inflate the type I error rate and re-estimate the prevalence without any bias. These two re-estimation procedures compensate a wrongly assumed prevalence and its consequences on the initial sample size. Consequently, the empirical overall power equals the desired theoretical one.
As chosen in the simulation study, a difference between the assumed and true prevalence of 10% is considered to be a realistic deviation. The assumptions about the prevalence in a confirmatory diagnostic accuracy study come in general from preceding studies. Hence, the assumed difference in the confirmatory diagnostic accuracy study should not differ heavily from the true one.
The repeated re-estimation design reveals no relevant advantage concerning the MSE of the re-estimated prevalence or of the adjusted sample size. In both designs, an initially wrongly assumed prevalence can be efficiently corrected.
Hence, we recommend the application of a one-time re-estimation design in a confirmatory diagnostic accuracy study. A unique re-estimation of the prevalence is sufficient. It shows no disadvantage concerning the precision of the estimation but causes less effort compared to the repeated re-estimation procedure.
The appropriate size of the internal pilot study in the one-time re-estimation design is evaluated to be 50% of the initially calculated sample size. The sample size in diagnostic accuracy studies strongly varies from hundred to several thousands participants. The prevalence and the effect size of the sensitivity and of the specificity mainly cause this large range. To be able to make common statements about the appropriate size of the internal pilot study despite of the large range of sample sizes, the size of the internal pilot study is indicated as a proportion.
6 Conclusion
In this paper, a new method for the calculation of the sample size in a confirmatory diagnostic accuracy study with independent co-primary endpoints, the sensitivity and the specificity, is developed. With this method, it is possible to avoid overpowered diagnostic studies which often appear with the conventional approach of sample size calculation. The idea of the optimal sample size calculation is to individually split the overall power to both endpoints in dependence of the prevalence. Furthermore, two blinded designs for the re-estimation of the sample size based on the prevalence are presented either with a one-time or a repeated re-estimation. These designs are evaluated in a simulation study under various parameter combinations. Due to the blinded re-estimation, the type I error rate is not inflated. An initially wrongly assumed prevalence can be compensated and the desired overall power is reached. The design with a one-time re-estimation reveals no disadvantages concerning the MSE of the re-estimated prevalence or adjusted sample size compared to the repeated re-estimation design. Therefore, it is recommended for a confirmatory diagnostic accuracy study. The re-estimation of the prevalence has practical relevance to avoid over- or underpowered studies with wrongly specified sample sizes. Hence, an unnecessary burden of participants in a confirmatory diagnostic trial can be inhibited.
Supplemental Material
sj-pdf-1-smm-10.1177_0962280220913588 - Supplemental material for Sample size calculation and re-estimation based on the prevalence in a single-arm confirmatory diagnostic accuracy study
Supplemental material, sj-pdf-1-smm-10.1177_0962280220913588 for Sample size calculation and re-estimation based on the prevalence in a single-arm confirmatory diagnostic accuracy study by Maria Stark and Antonia Zapf in Statistical Methods in Medical Research
Supplemental Material
sj-pdf-2-smm-10.1177_0962280220913588 - Supplemental material for Sample size calculation and re-estimation based on the prevalence in a single-arm confirmatory diagnostic accuracy study
Supplemental material, sj-pdf-2-smm-10.1177_0962280220913588 for Sample size calculation and re-estimation based on the prevalence in a single-arm confirmatory diagnostic accuracy study by Maria Stark and Antonia Zapf in Statistical Methods in Medical Research
Supplemental Material
sj-pdf-3-smm-10.1177_0962280220913588 - Supplemental material for Sample size calculation and re-estimation based on the prevalence in a single-arm confirmatory diagnostic accuracy study
Supplemental material, sj-pdf-3-smm-10.1177_0962280220913588 for Sample size calculation and re-estimation based on the prevalence in a single-arm confirmatory diagnostic accuracy study by Maria Stark and Antonia Zapf in Statistical Methods in Medical Research
Supplemental Material
sj-pdf-4-smm-10.1177_0962280220913588 - Supplemental material for Sample size calculation and re-estimation based on the prevalence in a single-arm confirmatory diagnostic accuracy study
Supplemental material, sj-pdf-4-smm-10.1177_0962280220913588 for Sample size calculation and re-estimation based on the prevalence in a single-arm confirmatory diagnostic accuracy study by Maria Stark and Antonia Zapf in Statistical Methods in Medical Research
Supplemental Material
sj-pdf-5-smm-10.1177_0962280220913588 - Supplemental material for Sample size calculation and re-estimation based on the prevalence in a single-arm confirmatory diagnostic accuracy study
Supplemental material, sj-pdf-5-smm-10.1177_0962280220913588 for Sample size calculation and re-estimation based on the prevalence in a single-arm confirmatory diagnostic accuracy study by Maria Stark and Antonia Zapf in Statistical Methods in Medical Research
Supplemental Material
sj-pdf-6-smm-10.1177_0962280220913588 - Supplemental material for Sample size calculation and re-estimation based on the prevalence in a single-arm confirmatory diagnostic accuracy study
Supplemental material, sj-pdf-6-smm-10.1177_0962280220913588 for Sample size calculation and re-estimation based on the prevalence in a single-arm confirmatory diagnostic accuracy study by Maria Stark and Antonia Zapf in Statistical Methods in Medical Research
Supplemental Material
sj-pdf-7-smm-10.1177_0962280220913588 - Supplemental material for Sample size calculation and re-estimation based on the prevalence in a single-arm confirmatory diagnostic accuracy study
Supplemental material, sj-pdf-7-smm-10.1177_0962280220913588 for Sample size calculation and re-estimation based on the prevalence in a single-arm confirmatory diagnostic accuracy study by Maria Stark and Antonia Zapf in Statistical Methods in Medical Research
Footnotes
Acknowledgements
We thank Werner Brannath for his inspiring ideas in the context of the development of the new methods. Our thanks also go to the unknown reviewers who really helped to improve the manuscript. Furthermore, we acknowledge the Deutsche Forschungsgemeinschaft for financing the project “Flexible designs for diagnostic studies” to which this article belongs.
Declaration of conflicting interests
The author(s) declared no potential conflicts of interest with respect to the research, authorship, and/or publication of this article.
Funding
The author(s) disclosed receipt of the following financial support for the research, authorship, and/or publication of this article: This article is supported by the Deutsche Forschungsgemeinschaft (ZA 687/1-1).
Supplemental material
Supplement material is available online for this article.
Appendix 1
References
Supplementary Material
Please find the following supplemental material available below.
For Open Access articles published under a Creative Commons License, all supplemental material carries the same license as the article it is associated with.
For non-Open Access articles published, all supplemental material carries a non-exclusive license, and permission requests for re-use of supplemental material or any part of supplemental material shall be sent directly to the copyright owner as specified in the copyright notice associated with the article.