
Abstract
Drug combination trials are often motivated by the fact that individual drugs target the same disease but via different routes. A combination of such drugs may then have an overall better effect than the individual treatments which has to be verified by clinical trials. Several statistical methods have been explored that discuss the problem of comparing a fixed-dose combination therapy to each of its components. But an extension of these approaches to multiple dose combinations can be difficult and is not yet fully investigated. In this paper, we propose two approaches by which one can provide confirmatory assurance with familywise error rate control, that the combination of two drugs at differing doses is more effective than either component doses alone. These approaches involve multiple comparisons in multilevel factorial designs where the type 1 error can be controlled first, by bootstrapping tests, and second, by considering the least favorable null configurations for a family of union intersection tests. The main advantage of the new approaches is that their implementation is simple. The implementation of these new approaches is illustrated with a real data example from a blood pressure reduction trial. Extensive simulations are also conducted to evaluate the new approaches and benchmark them with existing ones. We also present an illustration of the relationship between the different approaches. We observed that the bootstrap provided some power advantages over the other approaches with the disadvantage that there may be some error rate inflation for small sample sizes.
1 Introduction
Combining different drugs is an important treatment option in many therapeutic areas such as respiratory, cardiovascular disease, cancer or infectious diseases. The hope is that by combining two drugs (with typically different modes of action), one can achieve a greater beneficial effect than either therapy alone. According to the regulatory requirement by the U.S. Food and Drug Administration's policy (21 CFR 300.50, 1 CDER, 20132), the fixed-dose combination drug must have confirmatory evidence for being more effective than each component drug alone. The primary questions that often arise in a drug combination therapy trial are: (1) Does there exist a dose combination that shows a better effect than the placebo control (effectiveness)? (2) Does there exist a dose combination that is superior to the individual treatments (superiority), where the individual treatments are often termed as monotherapies? (3) What are the specific combinations that fulfill both effectiveness and superiority?
Laska and Meisner 3 and Snapinn 4 are the first to consider the problem of testing the superiority of a certain combination treatment over the component treatments in a single dose combination setting. They conducted a “min-test”, where the minimum of the test statistics comparing the combination treatment with the monotherapies are used to show that the combination treatment is better. Extending the above approach in a multiple dose combination setting is not simple. In a multiple dose combination trial, multi-level factorial designs involving simultaneous multiple dose combination comparison comes into play and one has to propose multiple testing procedure (MTP) to address the multiplicity issues here.
Several authors have addressed the primary questions stated in the earlier paragraph in several ways. Hung5–7 proposed two single-step testing procedures that showed that there exists at least one combination in a multiple dose factorial drug combination study that is better than administering the component drugs alone. Hellmich and Lehmacher 8 proposed a testing method for identifying the set of all minimum effective combinations in the case of monotone mean responses. Buchheister and Lehmacher 9 proposed a closed testing procedure using special linear contrast tests and extended the global maximum test by Hung 6 to a local maximum test for the identification of the superior dose combinations while preserving the family-wise error rate. Soulakova and Sampson 10 and Soulakova 11 proposed a procedure where their objective was to identify the set of minimum effective combination doses using the global average tests proposed by Hung 5 under a closed testing principle. In all of these papers, the problems of efficacy and superiority of a combination drug were addressed separately which allowed explicit discussion of statistical issues. However, in practice, if a certain effective combination is shown to be superior, it is necessary to explain how results of the two individual procedures may be combined and what adjustments are needed to claim both efficacy and superiority. To address this, Soulakova12,13 expressed the problem of identifying the effective and superior drug combinations as a two stage problem, where the min-test is conducted at the first stage for comparing the drug combinations with the monotherapies at each dose level and then Holm's rejective multiple testing approach 14 is employed in the second stage to obtain doses that show superiority over placebo.
In this paper, we focus on showing superiority with regard to the monotherapies and ignore the formal requirement of showing effectiveness, i.e. superiority over placebo. However, we will indicate in the discussion how to include the tests for effectiveness in some of the approaches considered here. We have already seen that many approaches are suggested in the literature to address the goals of testing superiority of drug combinations in a multi-level factorial design and identifying the set of superior dose combinations. The method suggested by Hung 7 is one of the pioneer approaches that proposed a global test to deal with the above problems. Other authors have mainly proposed alternatives to test the same global null hypothesis that there exists at least one combination that provides superiority. Some authors proposed alternative approaches9,15 to control the family-wise error rate (FWER) strongly and identify all beneficial combinations in a multiple dose combination setting. However, most of the approaches proposed are either based on step-wise MTPs for a nonhierarchical hypothesis family, such as methods by Holm, 14 Hochberg, 16 and resampling methods by Westfall and Young 17 ; see Soulakova12,13 or rely on closed testing principles proposed by Marcus, Peritz, and Gabriel 18 ; also see Hellmich and Lehmacher, 8 Buchheister and Lehmacher, 9 Soulakova and Sampson, 10 and Soulakova. 11 In this article, instead of relying on conventional MTPs mentioned earlier (like Holm 14 or Hochberg 16 ), we will propose two new multiple testing procedures, by which one can test for superiority of the drug combination using: (i) a parametric bootstrap approach and (ii) FWER control under the least favorable null configuration. The parametric bootstrap approach suggested here estimates the parameters from the given dataset under the constraints imposed by the null hypothesis and obtains the null distribution of the test statistics by sampling data with the estimated parameters. Hence, it provides a tool to carry out the multiple comparisons in a parametric setup, without worrying about all the sampling distributions of the inherent test statistics in the composite null hypotheses. The least favorable null configuration approach aims to control the maximum type 1 error rate in the above multiple testing problem. It identifies the worst possible configurations (a subset of the null parameter space) that allow one to obtain a bound on the size of the test and control it within the desired significance limit. Thus the bootstrap approach and the least favorable null configuration approach both suggest ways of controlling the FWER which is a mandatory requirement for therapeutic dose response studies in Phase III clinical trials. While the least favorable null configuration approach leads to a FWER that is always below the nominal level α (and often much smaller), the bootstrap approach controls the FWER only asymptotically. However, the latter has the advantage of being less conservative.
2 Problem
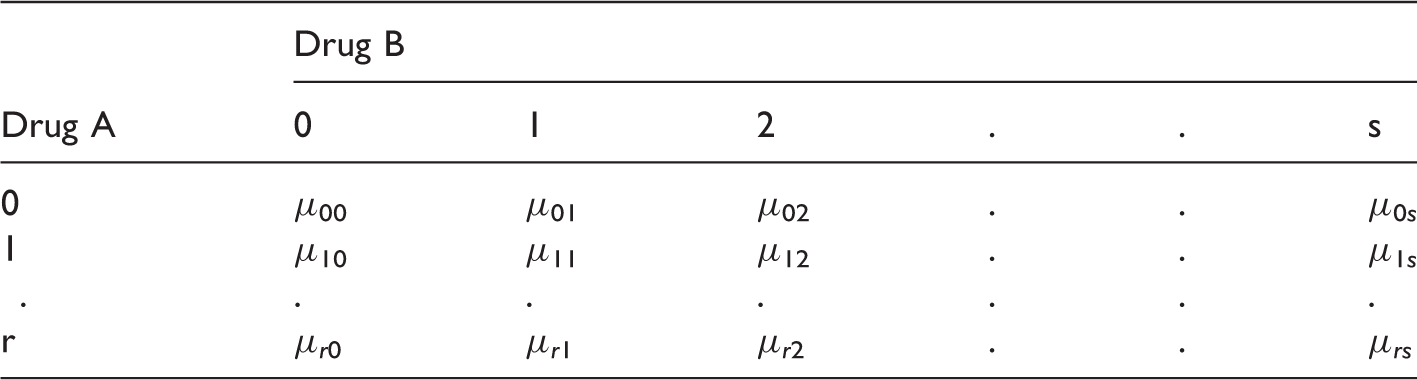
Consider a random vector Y, containing the clinical measurement of interest and a (r + 1) × (s + 1) factorial design trial where the dose levels are coded as 0, 1, 2,…r for drug A and 0, 1, 2,…s for drug B. The response Y is observed for (r + 1) × (s + 1) parallel dose combination groups and it is assumed to have the following model

Here {μi0, i = 1, 2,…r} are the mean responses of the monotherapies of Drug A and {μ0j, j = 1, 2,…s} are the mean responses of the monotherapies of Drug B and {μ
ij
, i = 1, 2,…r, j = 1, 2,…s} denote the mean response at dose combination, dose i of drug A and dose j of drug B. We assume here that
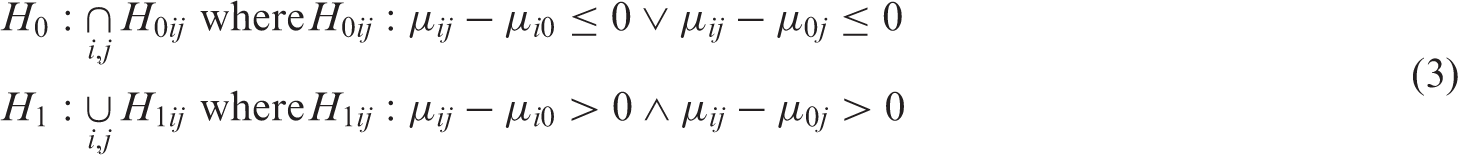
For the (i, j)th dose combination, the alternative hypothesis of interest is that the dose combination is more effective than both monotherapies, i.e. H1ij: μ
ij
> μi0 and μ
ij
> μ0j. The corresponding null hypothesis is H0ij: μ
ij
≤ μi0 or μ
ij
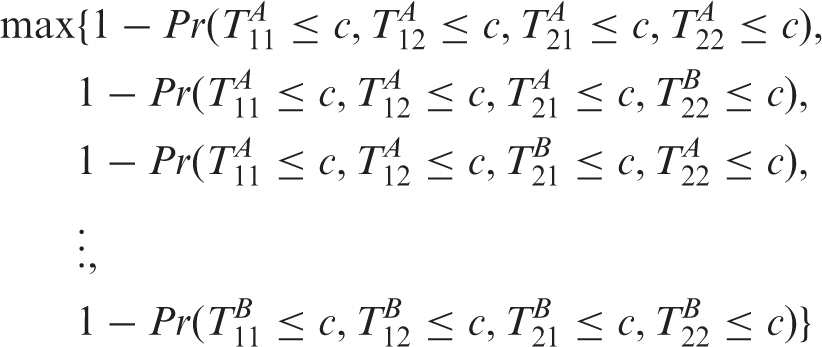
≤ μ0j. The global hypothesis associated with testing all active dose combinations versus their respective components is

3 Methods
3.1 Max-min test
We can rewrite the global null and corresponding alternative of the hypotheses discussed in equation (2) as
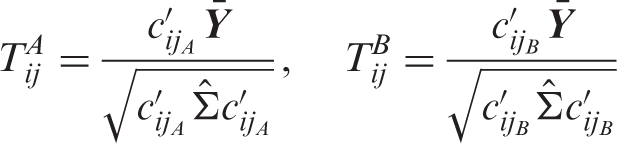
If T
ij
denotes the test statistic for testing H0ij against H1ij, then the test statistic for testing the global null is given by

The raw p-values (p
ij
) for testing H0ij can be easily obtained but for testing multiple combinations; these raw p-values need to be adjusted. Multiplicity adjustment is challenging because the null distribution of the “Max” test statistic in equation (4) is unknown and it is difficult to compute. Essentially one needs to adjust the p
ij
such that the FWER is controlled at significance level α for any of the possible null configurations. We can compute the p-values for all H0ij and perform a Bonferroni correction for the (r × s) union tests shown in equation (3). However, the Bonferroni method is over conservative in almost all situations, so we consider alternative approaches to control the type 1 error rate. A more efficient approach is to control the maximum type 1 error based on the joint distribution of the test statistics. The maximum type 1 error can be calculated by searching for the “worst possible parameter configurations” within the null space for which the size of the test is maximized.
19
We will see below that in our case the maximum type I error is not achieved by any finite parameter configurations but for hypothetical limiting cases where each T
ij
becomes equal to either
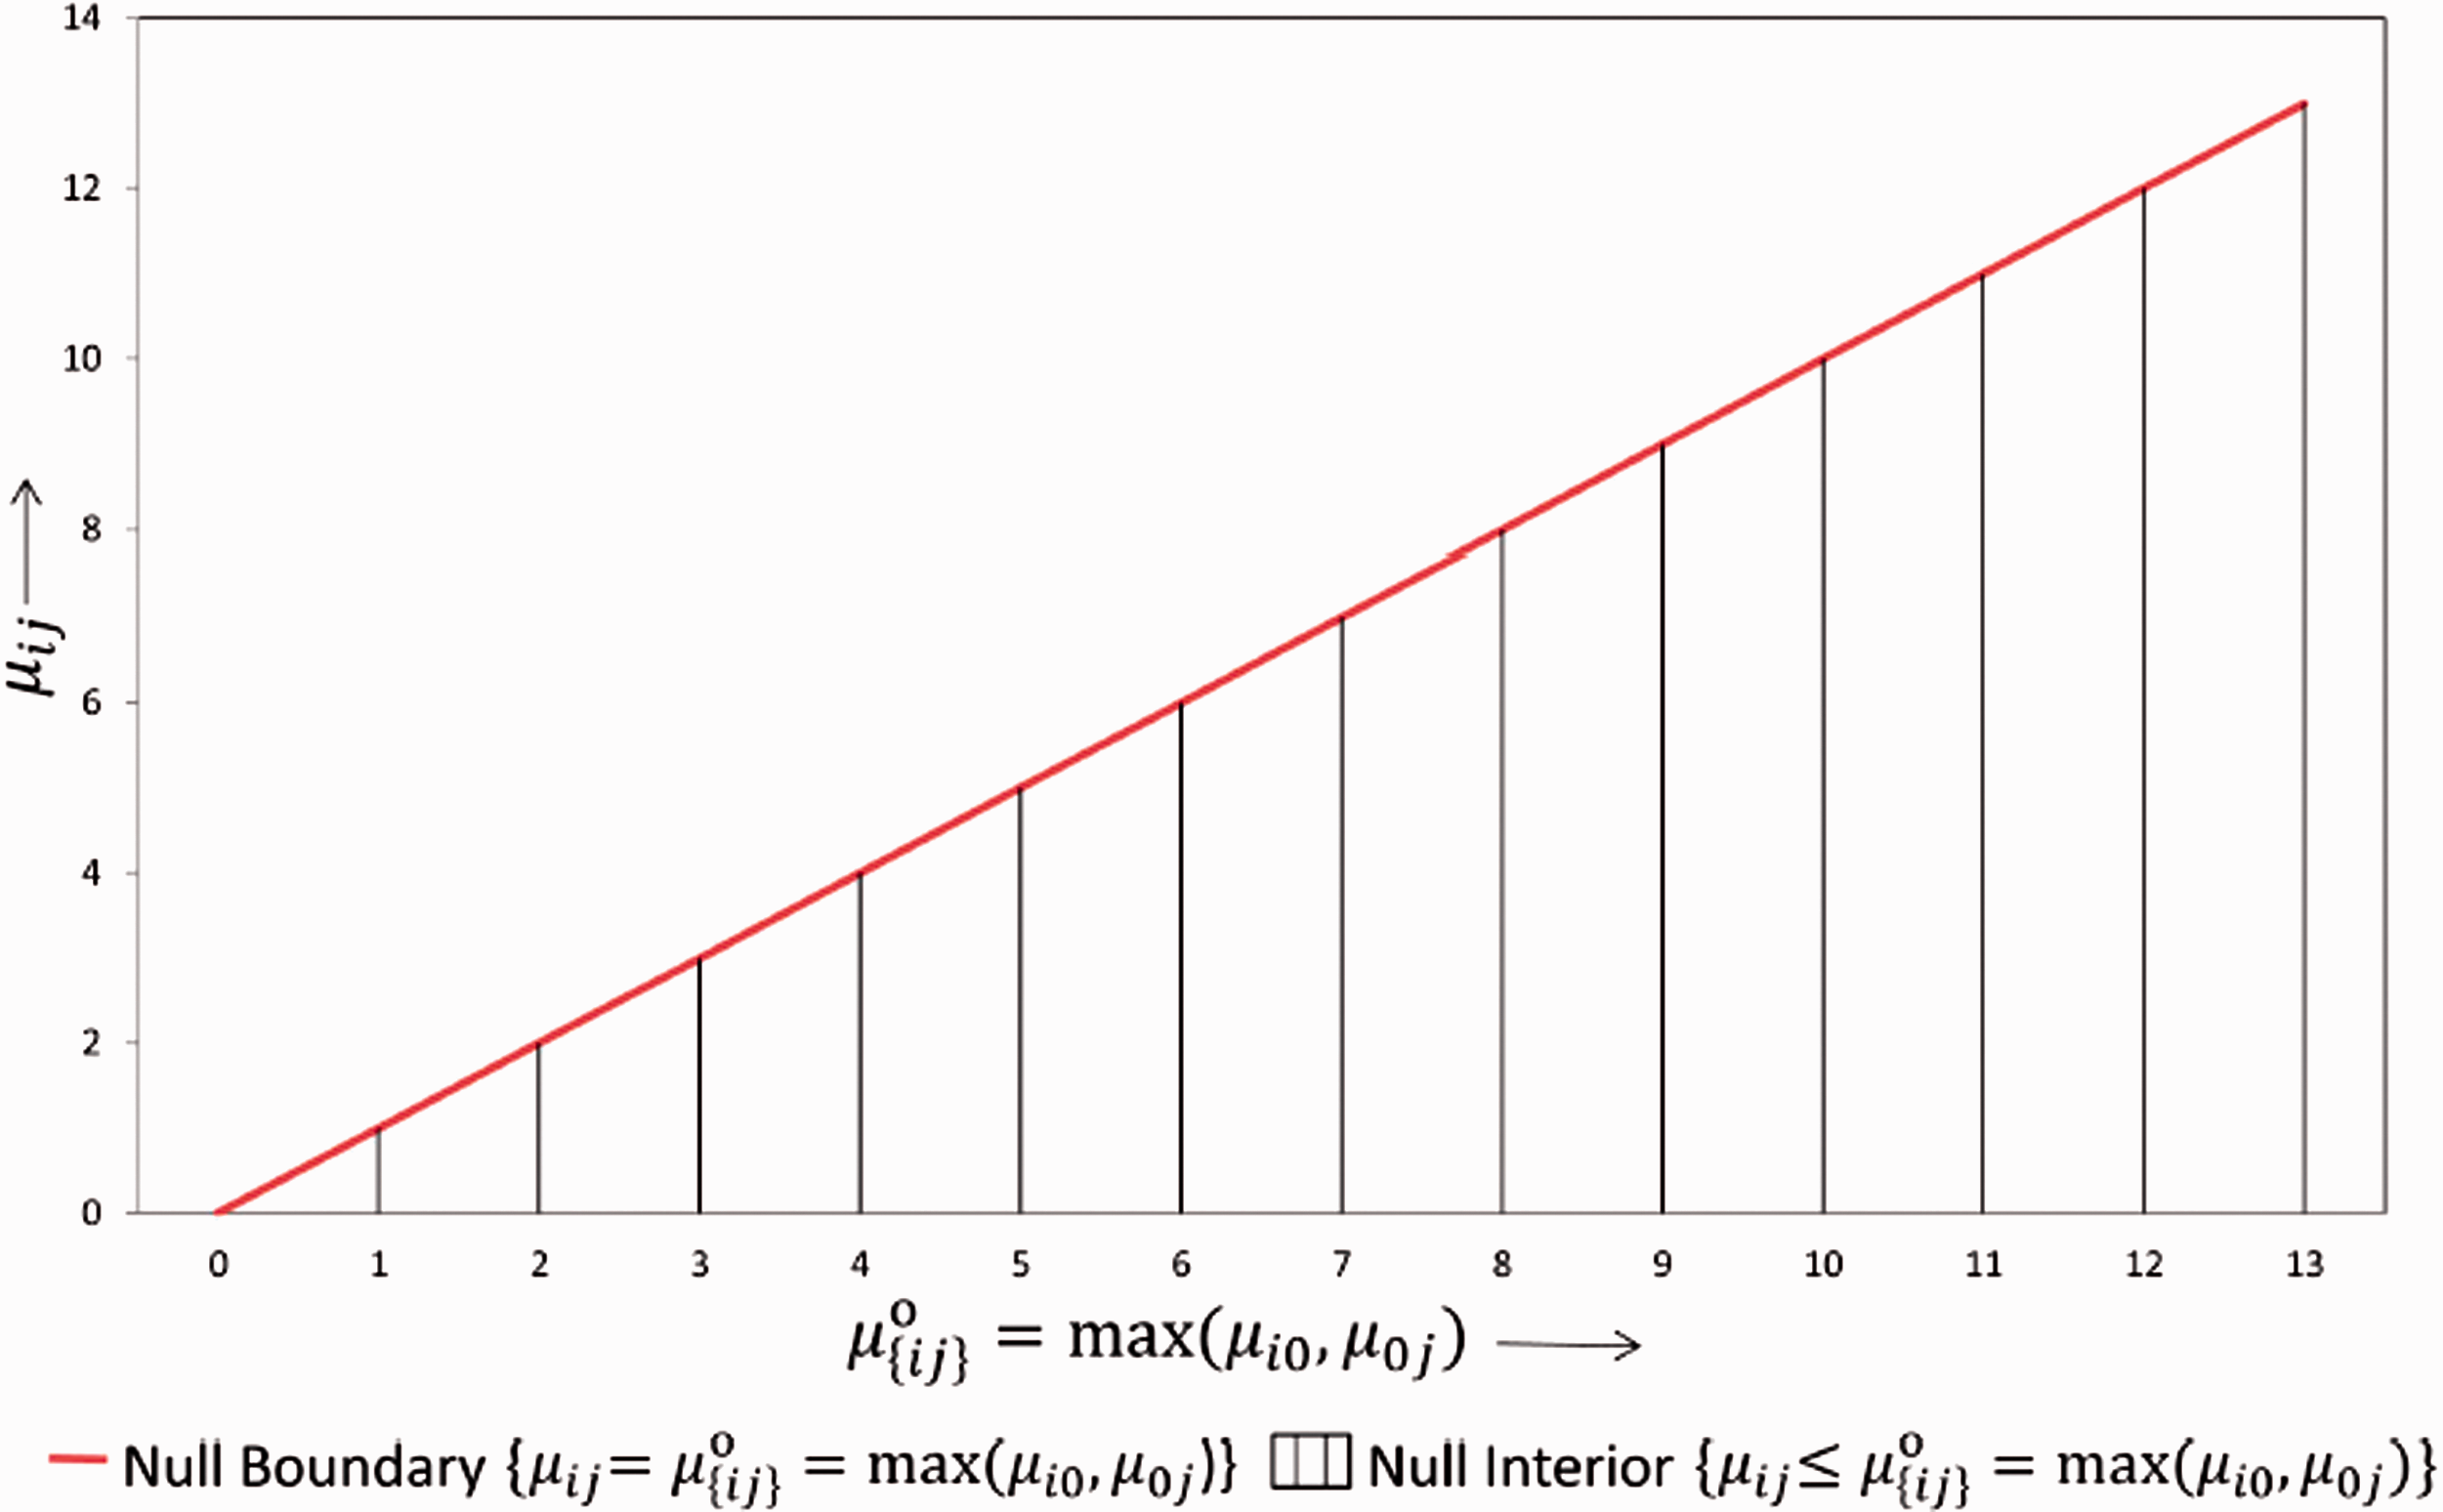
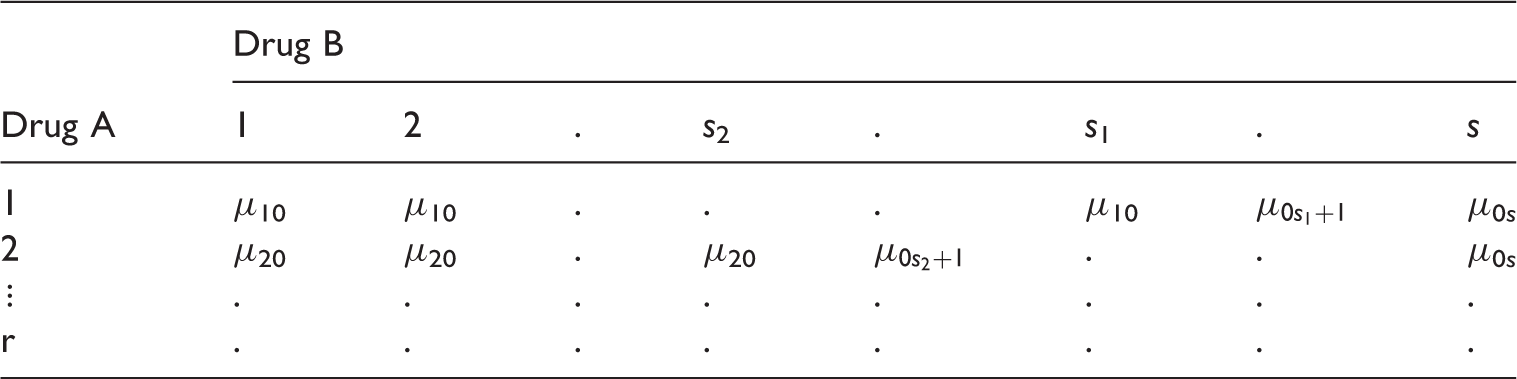
3.1.1 Least favorable null
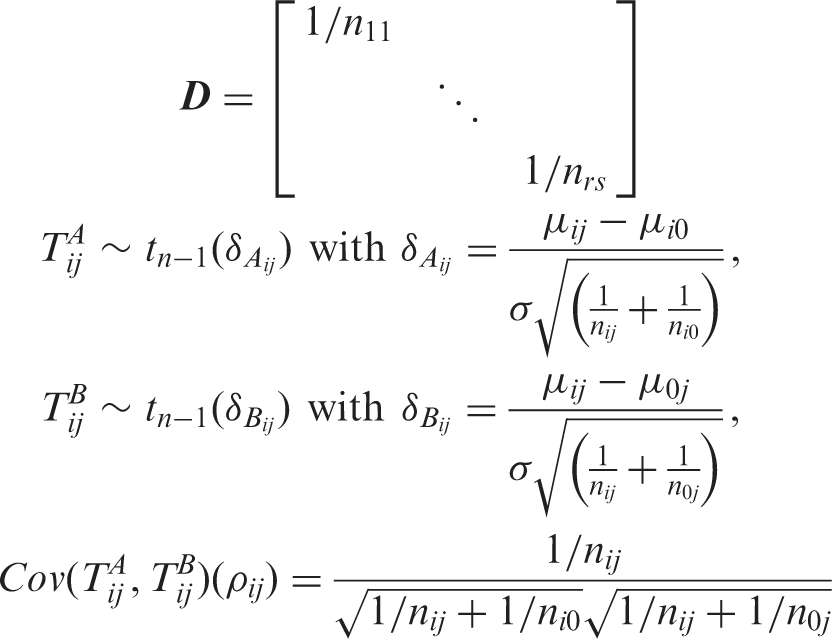
The least favorable null configurations (LFC) identify the “worst case scenarios” that lead to the maximum type 1 error rate over the full parameter space. Note that the test statistics for evaluating H0ij, T
ij
, is stochastically bounded by both


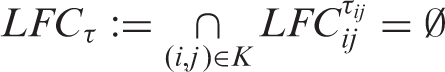
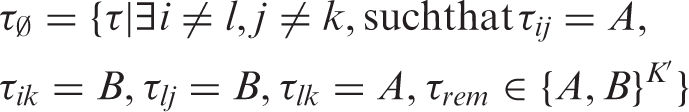
We will call τ a configuration of A's and B's. Now, some τ ∈ {A, B}
K
are infeasible in the sense that
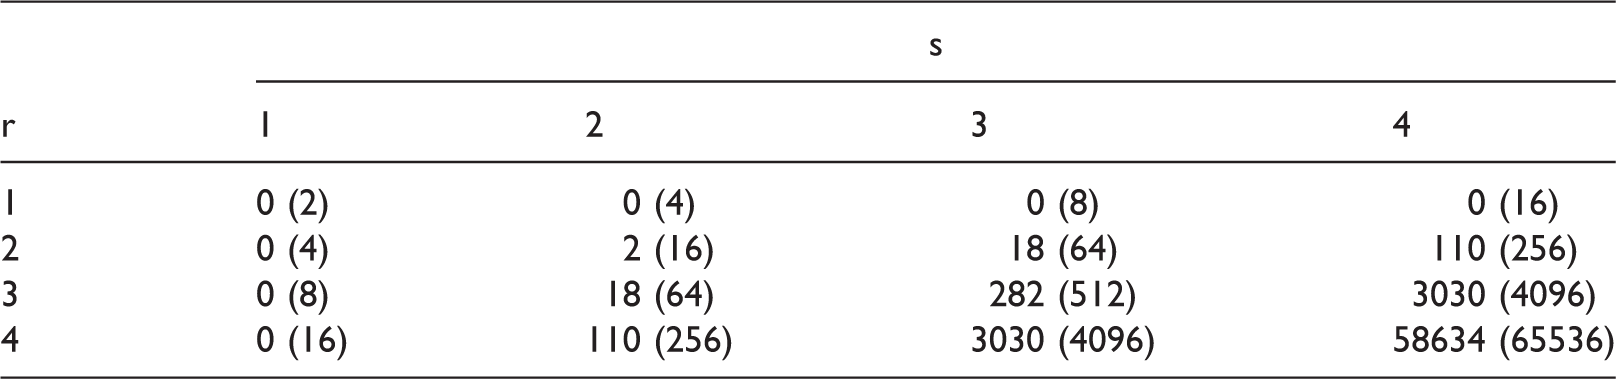
Cardinality of infeasible LFC and the cardinality of all the LFC (in bracket) for different choices of dose levels of Drug A and Drug B, r and s, respectively.
Consider the critical value C
α
for the above approach such that it satisfies

We reject the global null in equation (3) when the observed T > C
α
. Furthermore, all the component test statistics T
ij
are tested against the critical value C
α
and decisions are taken following a single-step testing procedure.
21
The adjusted p-value for each component hypothesis H0ij for the LFC approach can be obtained by computing the following probability;
3.1.2 Example
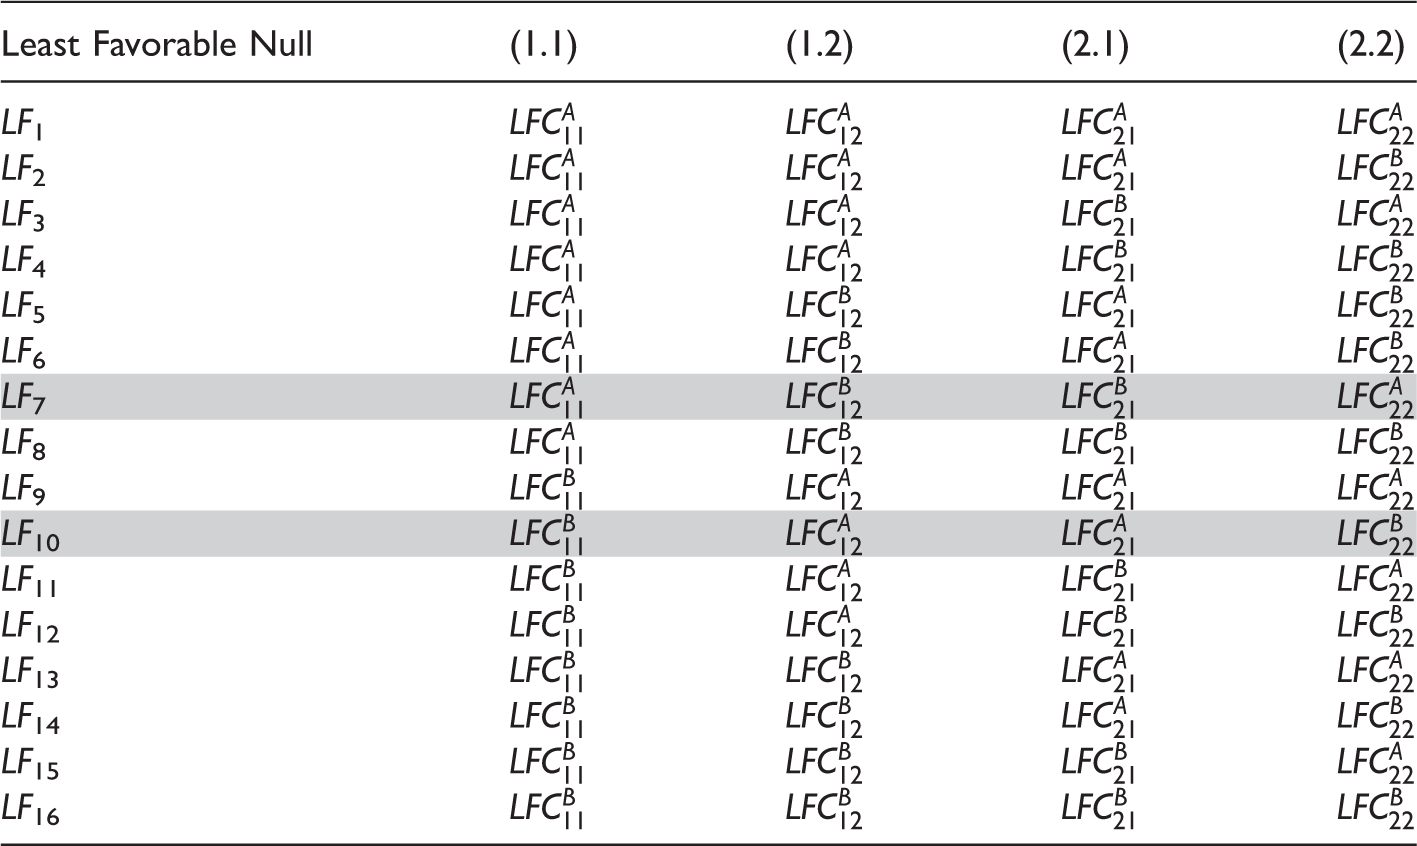
All least favorable null configurations for a 3 × 3 drug combination trial with four dose combinations.
The maximum type 1 error can be computed as
Obviously the FWER is bounded by the maximum over all the LF
i
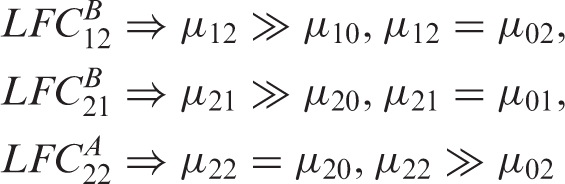
in Table 2, but note that we have omitted the infeasible LF7 and LF10. We will now show that the FWER under all mean constellations are controlled by the feasible LFC (LFC obtained after omiting LF7 and LF10). Clearly, the FWER under any mean constellation increases when replacing inequalities μ
ij
≤ μi0 and μ
ij
≤ μ0j by equalities. The resulting FWER is then dominated by the LF
i
in Table 2 with similar equalities, i.e. the FWER under any mean constellation with μ
ij
≤ μi0 is bounded by the corresponding FWER under the LFC where μ
ij
= μi0 (LFC where τ
ij
= A), and the FWER under any mean constellation with μ
ij
≤ μ0j is bounded by the corresponding FWER under the LFC where μ
ij
= μ0j (LFC where τ
ij
= B). Assume now that μ corresponds to the set similar to LF7 where the dose combination means are equal to one monotherapy and finitely larger than the other monotherapy. We call this case

Since we are omitting LF7 which is a bound for the FWER under the mean constellation F, we explore other bounds for this within the FWER under the feasible LF i 's. Note that this particular configuration, F, can hold true only when all the inequalities are substituted by equality, i.e. μ ij = μi0 = μ0j for all (i, j). Under this configuration, the FWER is bounded by the FWER of any feasible LF i because the probability of rejection goes up when one of the means is really high. Hence controlling the maximum type 1 error within the significance level α ensures that the FWER is controlled in the strong sense.
For a given multiple dose combination study, compute the test statistics For the given dataset estimate the mean under the constraints, i.e.
a) b) (a) Simulate 5000 normal distributed random variables with mean estimate Find out the proportion of times the test statistics from the simulated data is greater than the observed test statistics both in case (a) and (b). This gives our p-value for the above bootstrap test under option (a) and (b), respectively.
The null parameter space for any dose combination.
Note that instead of calculating a p-value we could equivalently calculate the (1 – α) quantile of the bootstrap distribution for T and use this as the critical value for T. We will refer to this bootstrap critical value in the next section. We have used the unrestricted mle
3.2 Relationship between the different approaches
With the bootstrap approach, the critical value depends on the data via the constraint parameter estimates. Hence, the critical value is a random variable in the bootstrap approach whereas it is a fixed number for the LFC and Hung's approach. 7
In this section, we investigate different approaches by comparing their critical values under a particular dose combination setup. We illustrate the distribution of critical values for the different methods in Figure 2. For simplicity we simulate data from a balanced factorial design with r = 1, s = 1, and n
ij
= 25 for all (i, j) combinations. Further we fix the first effect size at 0, i.e. set δ1 = μ11 – max(μ10, μ01) = 0 and the second effect size (δ2 = μ12 – max(μ10, μ02)) begins with 0 and increases along the X-axis. For the above setup, we plot the critical value of the test statistic (along the Y-axis) for the LFC approach, Hung's
7
approach, Bootstrap approach and the oracle critical value, i.e. the critical value that can be derived if we know the unknown true null distribution of the test statistics. Since there is only one combination involved, computing the distribution of the test statistic under the global null H0 in equation (3) is not complicated. We observe that the critical value under the LFC is indeed a limiting case of the oracle critical values.
Distribution of critical value for the different methods under the set up: Drug A and Drug B both have one active dose group with sample size per dose group=25. The first effect size (δ1) is 0 and the second effect size (δ2) varies. Note that 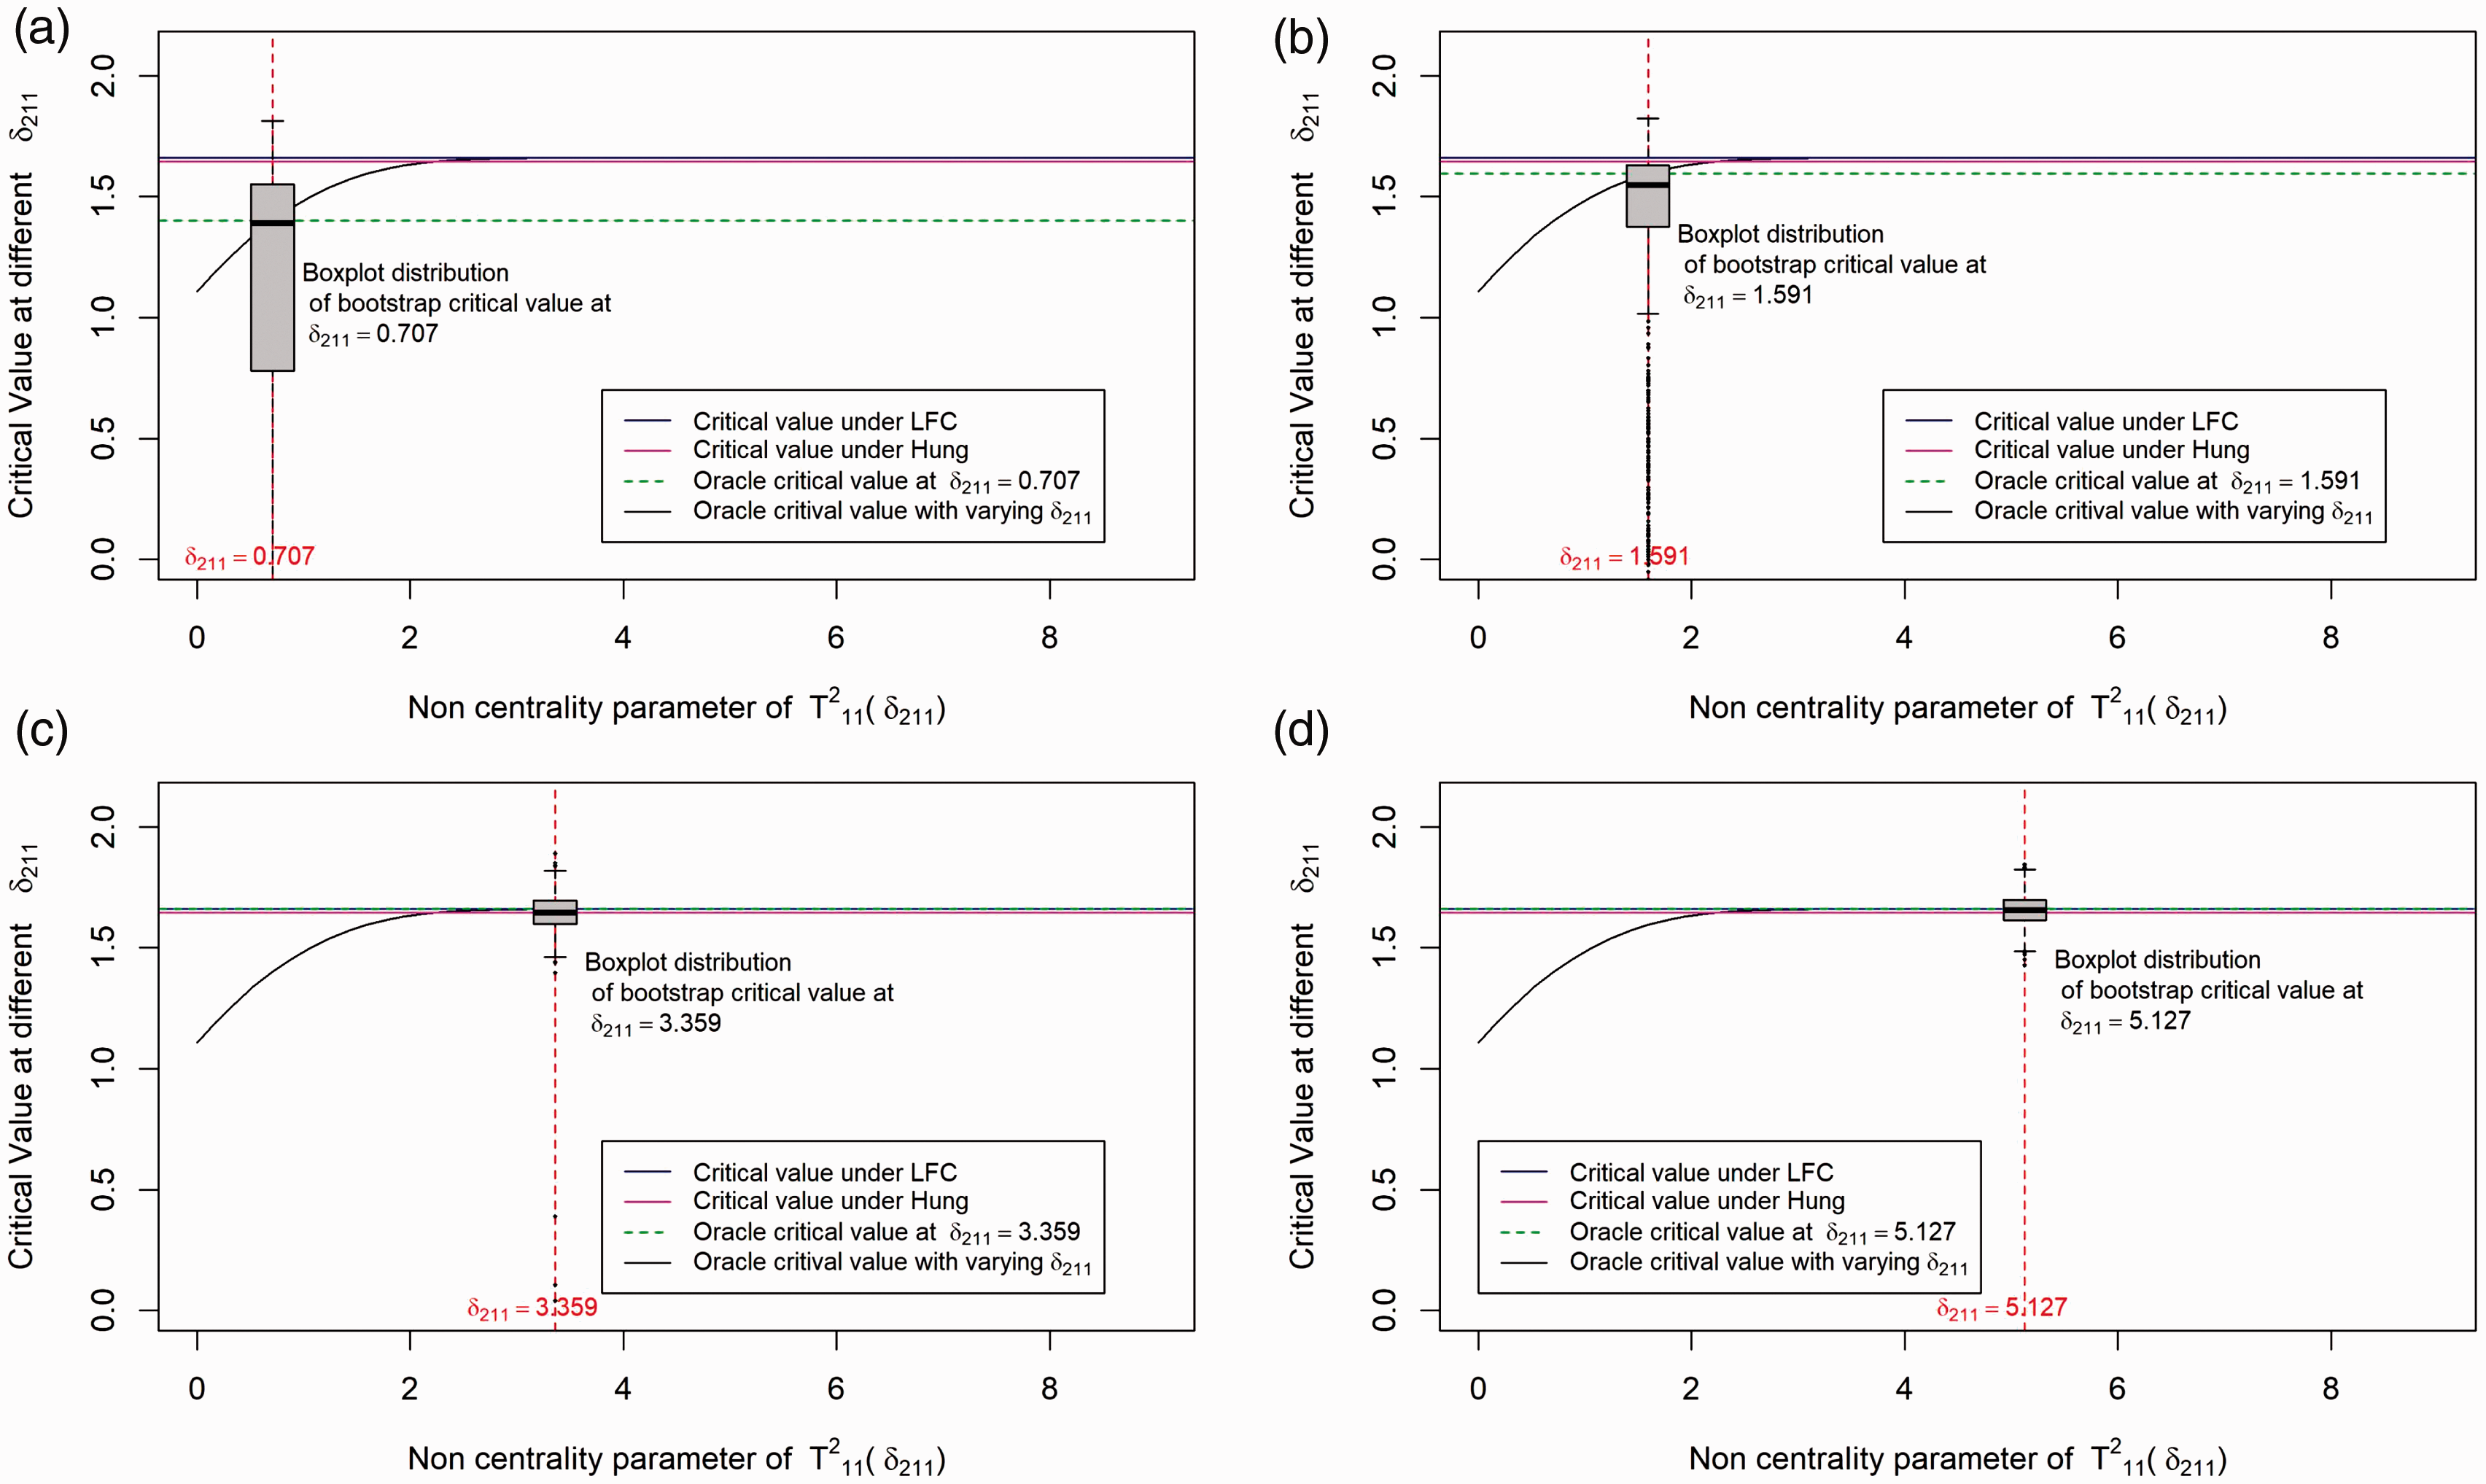
Our LFC approach is similar to the one in Hung's
7
approach with the exception that it does not rely on an asymptotic normal approximation. The LFC approach identifies the same configurations as the extreme parameter configurations of the parameter δ
ij
(where
We have conducted 1000 simulations at some particular fixed values of δ1 and δ2. δ1 is fixed at 0 and 4 different values of δ2 are selected and the boxplots distribution of the critical values for the bootstrap method under the different values of δ2 is shown in Figure 2. As one can see from the plot, the critical value under the bootstrap method is approximately centered around the oracle critical value at each pre-selected δ2 (shown by the dotted green line). However, there might be cases where the critical value under the bootstrap method is smaller or larger compared to the oracle critical value. Asymptotically the type error should be controlled strongly with the subset pivotality criteria 20 under the bootstrap approach but the critical value is sometimes underestimated as shown in Figure 2(c), thereafter explaining the inflation in type 1 errors observed in our simulation scenarios shown in Table 15.
A similar illustration of the above scenario with δ1≠0 is given in Figure 3 of Appendix 1. In summary, it is observed that the critical value under the bootstrap method is always centered around the least favorable null critical value and it is with a high probability below the least favorable critical value for smaller δ2. This indicates that the bootstrap method will give more power than the LFC approach.
From the above illustration, it is expected that the LFC approach gives more conservative results compared to the bootstrap approach and it also shows that Hung's 7 approach behaves similar to the LFC approach.
4 Numerical example
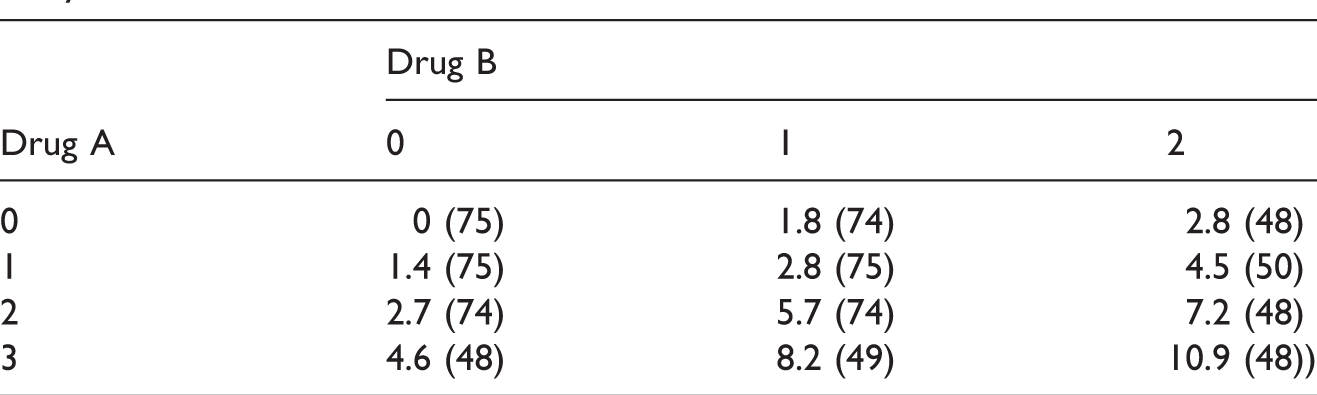
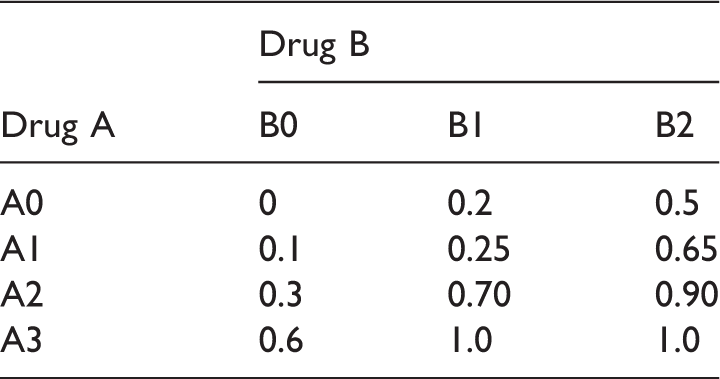
Mean responses and the sample sizes (in bracket) of the drug combination study.
Unadjusted and adjusted p-values for each drug combination, when different methods are applied to the data example in Table 3.
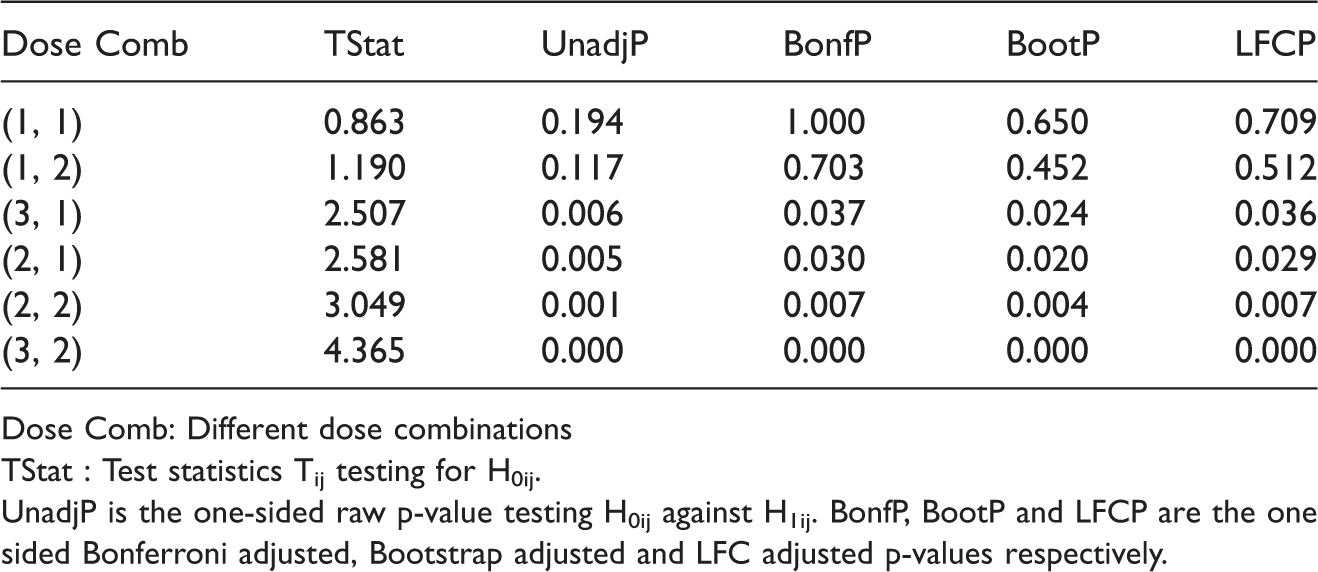
Dose Comb: Different dose combinations TStat : Test statistics Tij testing for H0ij. UnadjP is the one-sided raw p-value testing H0ij against H1ij. BonfP, BootP and LFCP are the one sided Bonferroni adjusted, Bootstrap adjusted and LFC adjusted p-values respectively.
We see from Table 4 that all the approaches proposed by us suggest that at 5% significance level the combinations (2, 1), (2, 2), (3, 1), and (3, 2) are superior to the monotherapies. For the Bonferroni adjusted method, the p-values are compared to the local significance level 0.8% to control the overall type 1 error at 5%. This numerical example was also investigated by other authors. Based on a global test, Hung 7 concluded that there exists at least one combination that is superior to the monotherapies. He also applied an approximation of James 24 to adjust the p-values and thereby identified the dose combination (2, 1), (2, 2) and (3, 2) as superior. But now that there is no need to approximate the distribution of the test statistics because Genz and Bretz 23 proposed numerical techniques for an efficient evaluation of multivariate t-distribution probabilities over rectangular regions. Hellmich and Lehmacher 8 implemented the AVE and MAX test proposed by Hung 7 using the above proposed adjustment on the same dataset and concluded that the combination (2, 2) and (3, 2) are superior at 2.5% significance level (one-sided) with strong FWER control. Furthermore, using Holm's method, they showed that dose combinations (2, 1) and (3, 1) are also effective at significance level 2.5% (one-sided) to control the FWER at 5%. Soulakova 12 cited the same example and concluded using Holm's approach that all the four combinations: (2, 1), (2, 2), (3, 1), and (3, 2) are superior and effective at significance level 5%. However, unlike Hellmich and Lehmacher, 8 they conducted a test for both effectiveness and superiority and did not assume a priori that the dose combinations means are always greater than or equal to the monotherapy means.
5 Simulation studies
In this section, a simulation study is presented. The main objective of this simulation study is to compare the performance of the following approaches: (1) Hung's method, (2) parametric bootstrap method, (3) Bonferroni correction and (5) LFC approach with regards to their (a) ability to control the overall type 1 error at 5% significance level and (b) power to detect the superior dose combinations. We consider 11 scenarios overall, amongst which Scenario 1 and Scenario 2 are designed to investigate the strong control of type 1 error rate and Scenario 3 to Scenario 11 are designed to compare power performance of the different testing strategies. In Scenario 1 to Scenario 3 we are considering a balanced factorial design with r = 2, s = 1, and n ij = n for all (i, j) combinations. In Scenario 4 to Scenario 11 we are considering an unbalanced factorial design with r = 3, s = 2, and differing n ij for the (i, j) combinations.
5.1 Simulation scenarios
The simulation scenarios are divided into two parts. Section 5.1.1 refers to some new scenarios which are introduced in this article and Section 5.1.2 refers to the scenarios taken from Hung (2000). 7
5.1.1 New scenarios
Four least favorable null configurations in a 3 × 2 factorial design.
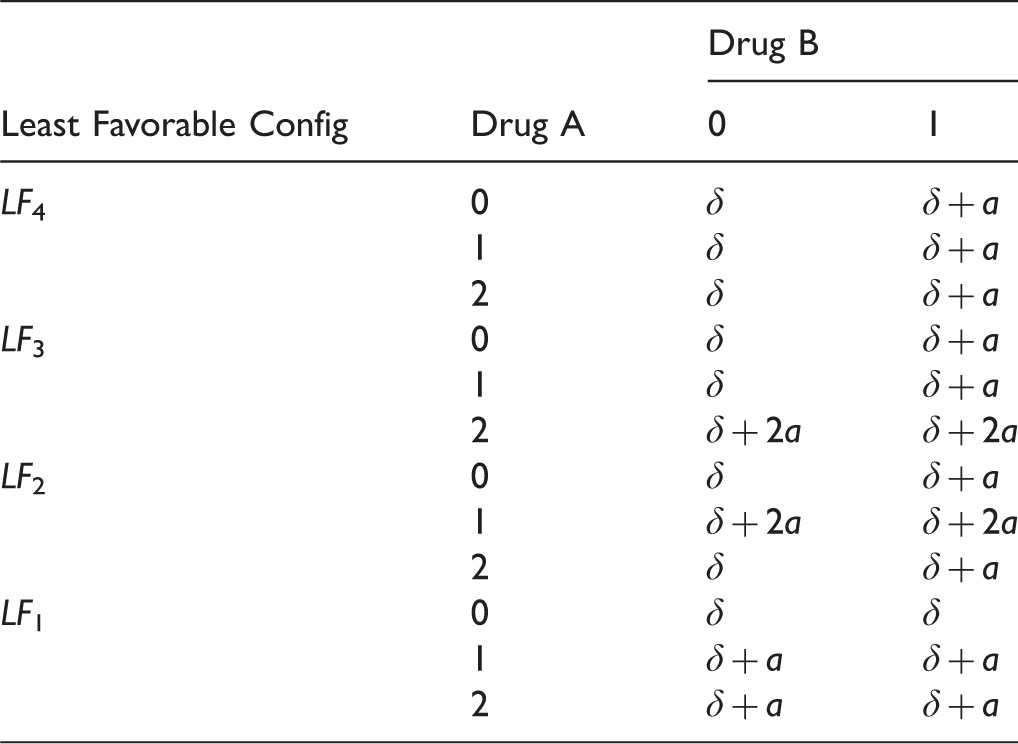
However, as Scenario 1 is very extreme, Scenario 2 is considered to evaluate the performance of the different methods under a more realistic set up, where the value of a in Scenario 1 is replaced by 0.7. To evaluate the power performance across different sample sizes in a balanced design, data are simulated under Scenario 3 shown in Table 6.
We consider five different sample sizes for the above described scenarios: 10, 25, 50, 75, 100. We evaluate the empirical type 1 error and power based on 5000 simulation runs assuming normally distributed errors with standard deviation 1. For the parametric bootstrap method, 5000 bootstrap samples are used.
5.1.2 Scenarios from Hung (2000)
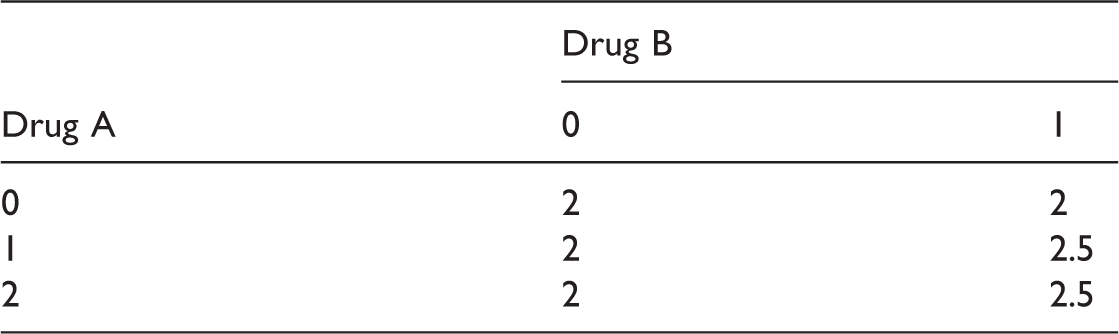
Scenario 3: A balanced design scenario devised to evaluate the power of the different methods across different sample sizes.
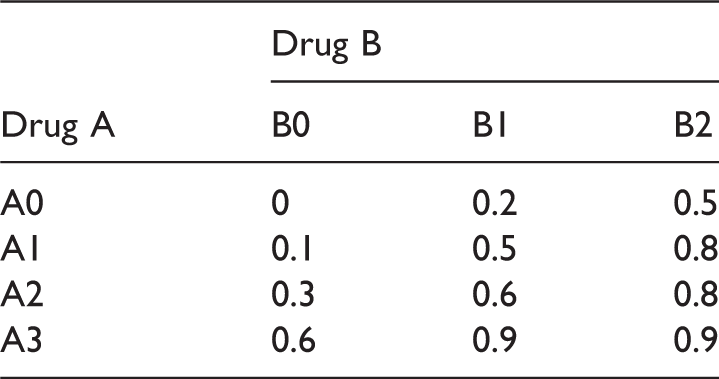
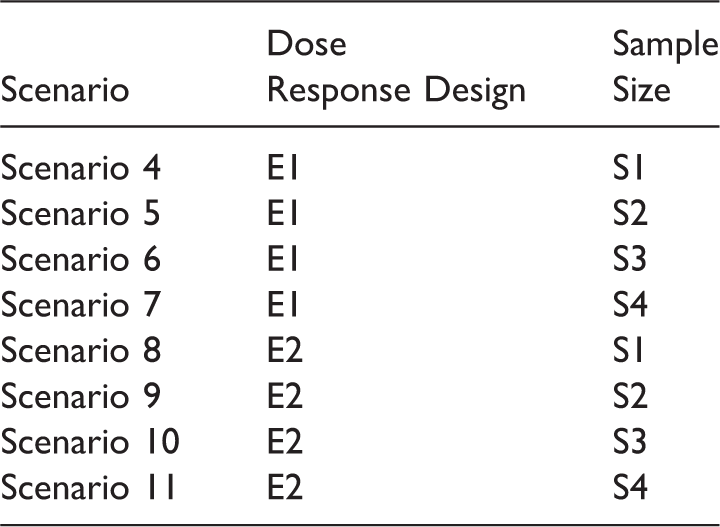
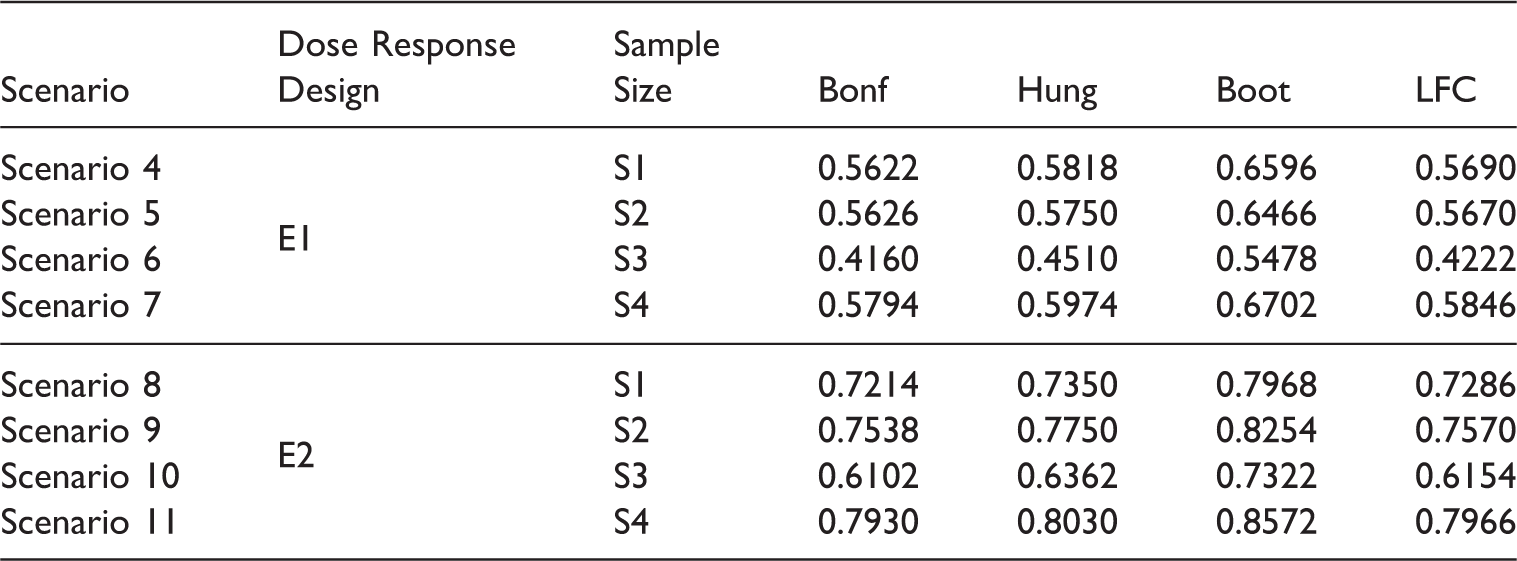
Dose-response means for the factorial design E1.
Dose-response means for the factorial design E2.
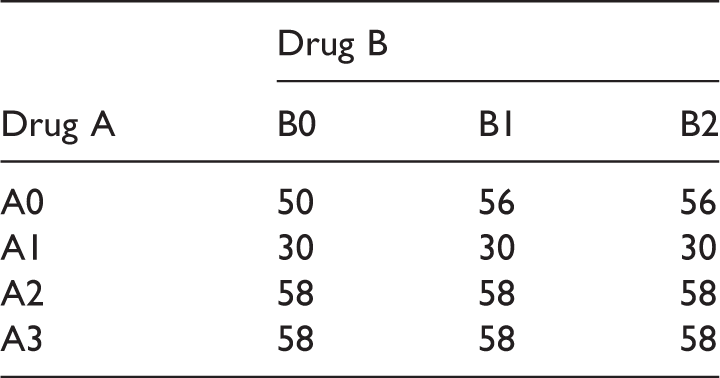
Sample size scenario (S1) for the drug combination designs (E1 and E2).

5.2 Simulation results
Sample size scenario (S2) for the drug combination designs (E1 and E2).
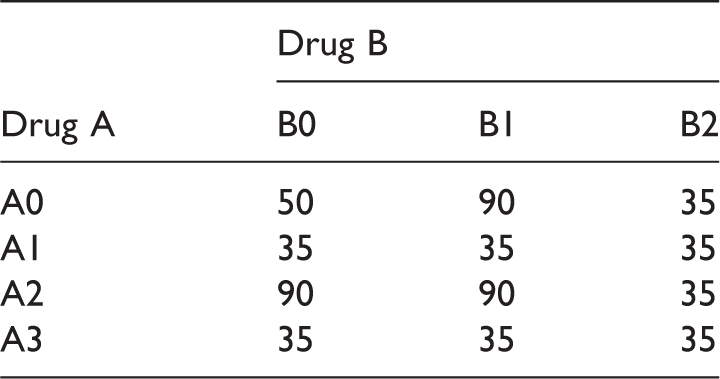
Sample size scenario (S3) for the drug combination designs (E1 and E2).
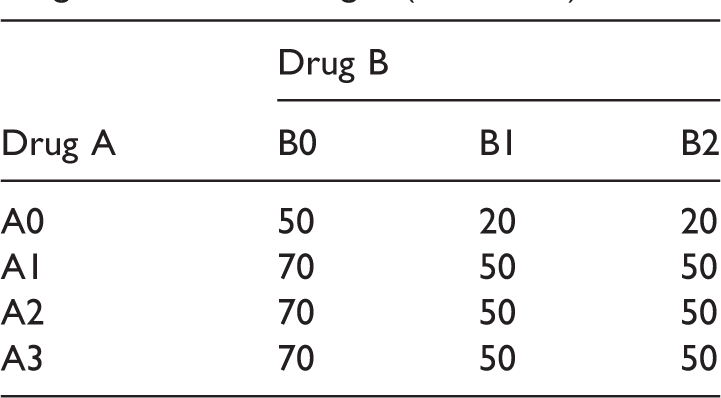
Sample size scenario (S4) for the drug combination designs (E1 and E2).
Scenario 4–Scenario 11.
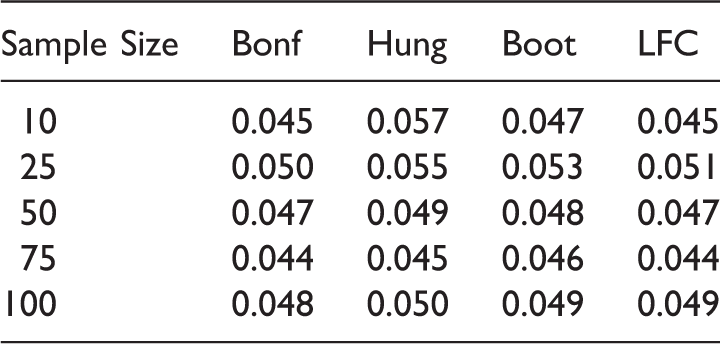
Empirical type 1 error rate for the different methods: Scenario 1.
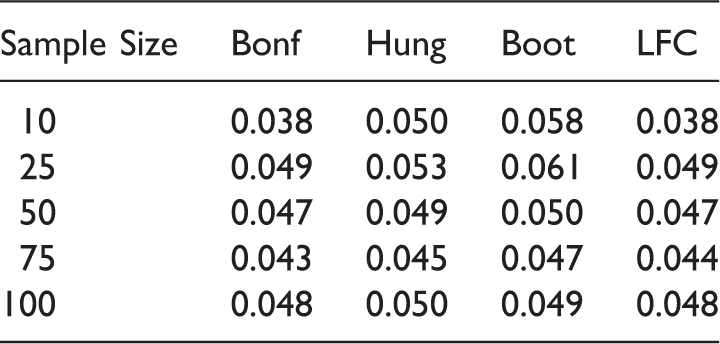
Empirical type 1 error rate for the different methods: Scenario 2.
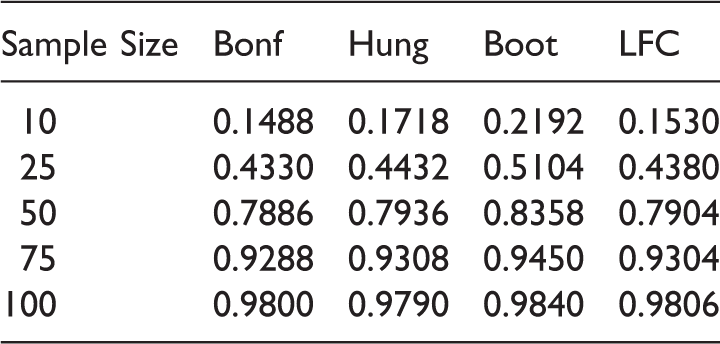
Empirical power of the 5% level max test for the different methods under Scenario 3.
Empirical power of the 5% level max test for the different methods under the data scenarios in Table 13.
From Tables 14 and 15 we observe that the Bonferroni method and the LFC approach show a more conservative behavior compared to Hung's and the bootstrap approach. Note that though the Bonferroni method is criticized quite often in the literature, it performs almost as good as the LFC approach in our simulations.
The type 1 error is somewhat inflated for small sample sizes (e.g. n ij = 10, 25 ∀i, j) with the bootstrap method. Tables 16 and 17 indicate that the parametric bootstrap approach shows uniformly better power performance than the other methods across all the sample sizes. This is because, under the alternative scenarios, the critical value of the bootstrap method is mostly below the critical value of the LFC approach. This has been elaborated in Section 4. The power performance of Hung's 7 approach is similar to the power performance of the LFC approach. This is because they are essentially the same, one using an approximate and the other the exact distribution of the same test statistics. Note that we have used only 5000 iterations for the bootstrap approach in our simulation studies but as the number of iteration increases the inflation in type error is expected to reduce. Nevertheless, there will still be some inflation regardless of the number of bootstrap samplings and as the number of bootstrap iteration increases the method becomes more time consuming and the improvement is not significant, so we adhered to 5000 iterations. Summing up, the bootstrap approach is giving power improvement by 6–10% over the other approaches across all the scenarios.
We further observe from Table 17 that we can gain in power by choosing an unbalanced design with more sample size allocation in the combination doses compared to the component doses. In S3 the power performance dropped as more sample size is allocated to the monotherapies of Drug A compared to the dose combinations, whereas in S4, the power across all the methods are becoming better when more sample size is allocated to higher dose combinations compared to the monotherapies. The marginal improvement of Hung's method over the LFC approach is due to the approximate nature of the first.
6 Discussion
We observe from our simulation experiments that both the bootstrap method and the LFC approach, proposed in this article, meet the nominal level for attaining the global null hypothesis if per group sample sizes are not too small (e.g. 50 or more). They also strongly control the FWER at the desired significance level. Since the LFC approach is conservative across all sample sizes, the bootstrap approach is providing more power compared to the LFC. The LFC and Bonferroni approach performs surprisingly similar to each other. This is likely due to the fact that the least favorable null configuration will be the one where the test statistics are either independent or have low correlation. This follows from Slepian's inequality 25 which says that the type 1 error from a “max” test, like the ones discussed in this article, increases with the decrease in the correlation between the component test statistics that combine to generate the max test statistic. The ideal maxima will occur when all the test statistics are uncorrelated, which will lead to the similar type 1 error as the type 1 error under the Bonferroni adjustment. However, in reality when there are multiple dose combinations involved, it is improbable to achieve this ideal maxima and hence the LFC type 1 error will always be greater than or equal to the Bonferroni type 1 error. This is also evident in our simulations. Note that we have only tested for superiority in our null hypothesis in equation (3). In order to test for effectiveness, we only need to add one additional test per dose combination, namely the test against placebo, such that we have overall the union of an intersection of three (instead of two) tests. Moreover, it is unlikely that we have non-efficacy but superiority with regard to both monotherapies. Hence, we have only considered superiority in our testing problem.
Resampling-based bootstrap approaches have already been suggested by other authors.15,26 Soulakova 15 proposed a resampling based framework for a multiple dose factorial design where she identified all the effective and superior combinations without any considerations of the role of the nuisance parameters (difference in monotherapies) in the resampling distribution. Accordingly, she observed family-wise error rate inflations in multiple situations. Frommolt and Hellmich 26 addressed this issue by a resampling-based bootstrap approach, where the nuisance parameters are estimated and accounted for in the resampling approximation of the test statistic's null distribution. But this bootstrap-based testing performed similar to the Hung's approach. The virtue of the parametric bootstrap approach suggested in this article is that, unlike the earlier approaches, it is performing better than the Hung's 7 approach under the alternative hypothesis. As one of the reviewers pointed out, a potential downside of the parametric bootstrap approach is that it relies on the normal distribution assumption, which may not be always true. However, it is only a concern for small sample sizes; for large sample sizes, one can easily show using the central limit theorem that the test statistics is approximately t distributed regardless of the underlying data distribution.
The methods suggested here only provide a set of superior dose combinations but do not propose an optimal dose for future use in the drug developments process. We also cannot infer anything beyond the observed doses if the nature of dose response relationship is not known a priori. Hence, there is a strong interest in estimating the dose–response relationship for the drug combination. Hung5,27 suggested a response surface methodology approach, where after attaining global superiority one can utilize the biological information on the drug combination study and apply a statistical model to estimate the relationship between the drug dosages and mean response. This approach helps us to obtain an optimal dose and make inference around this optimal dose in a multiple dose drug combination trial. But often it happens that the true dose–response pattern is not known and then choosing an appropriate dose response model becomes difficult. Hellmich and Lehmacher
8
proposed a closed testing procedure for estimating the minimum effective dose and highest effective dose levels in a dose–response bi-factorial design but they had to assume monotonicity properties to obtain the likelihood ratio tests and multiple contrast tests for their proposed hypotheses. To the best of our knowledge, there exists no approach where one can simultaneously control the FWER and infer on the dose–response relationship in a multiple dose drug combination study without the monotonicity assumption. Hence, it might be interesting to extend our bootstrap-based multiple testing approach to a modelling framework.
Distribution of critical value for the different methods under the set-up: Drug A and Drug B both have one active dose group with sample size per dose group = 25. The first effect size (δ1) is 0.5 and the second effect size (δ2) varies along X-axis. Note that A multiple dose drug combination factorial design.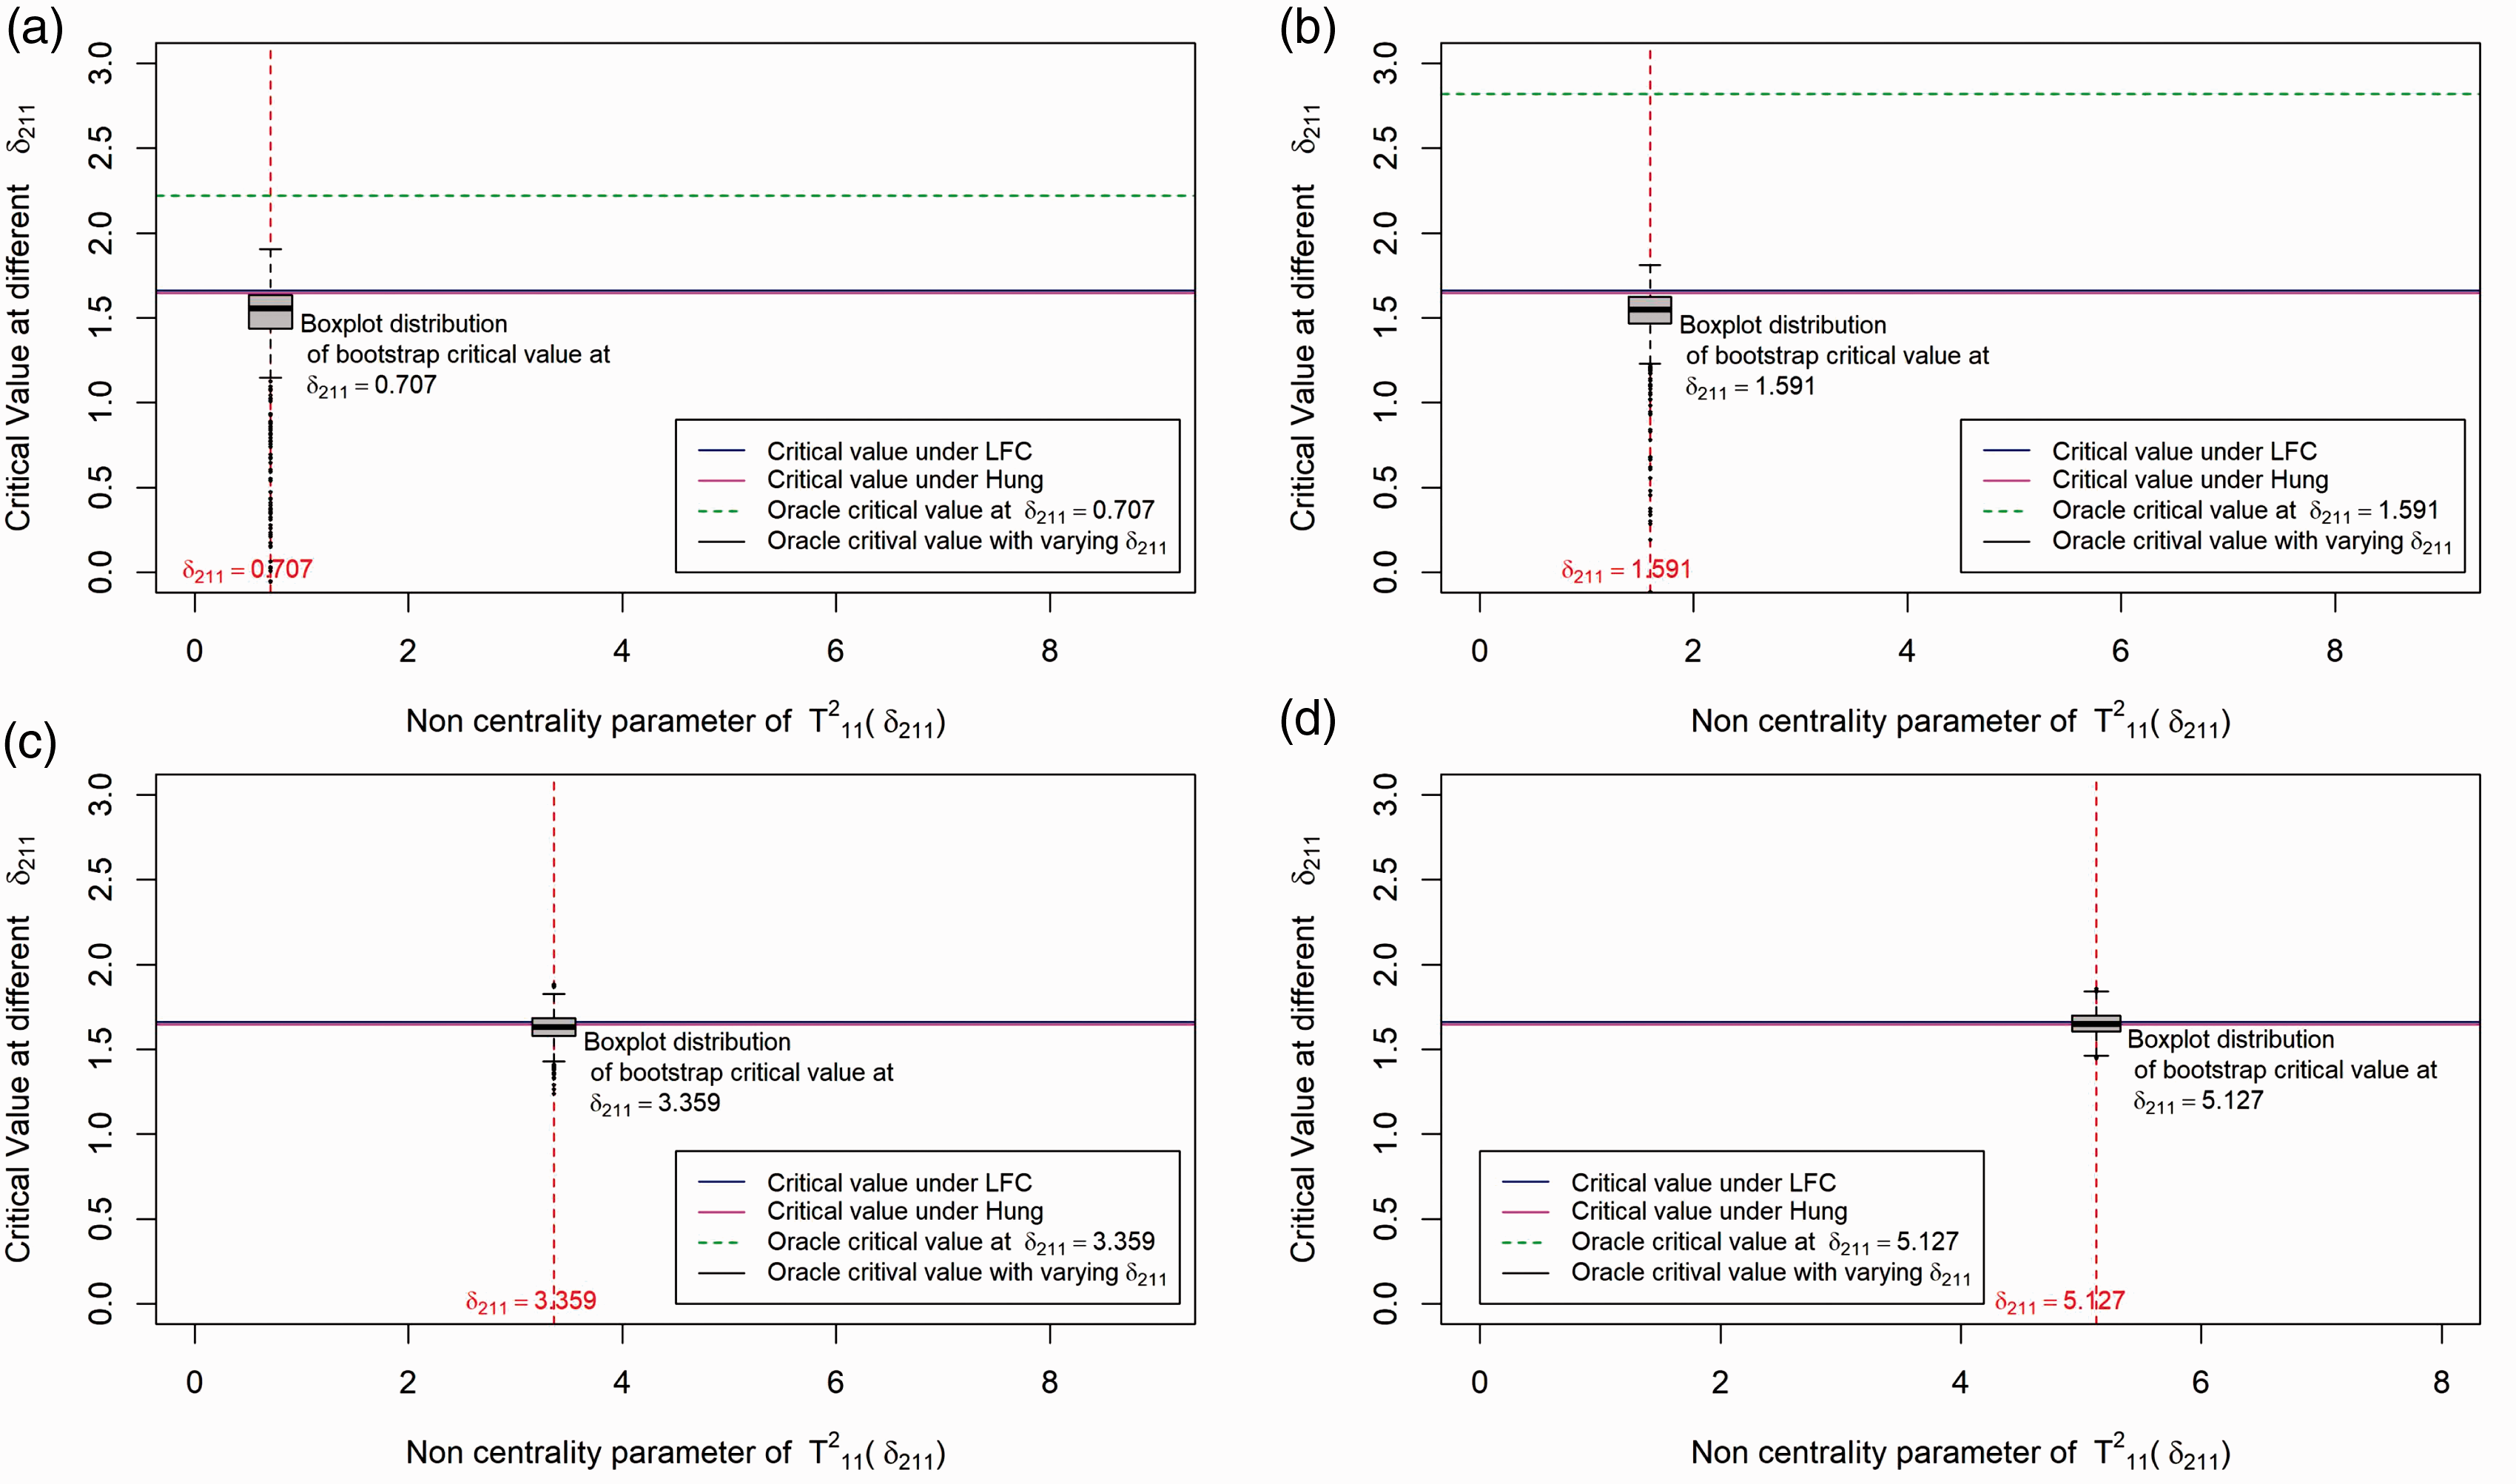
Supplemental Material
Supplemental material for Testing multiple dose combinations in clinical trials
Supplemental Material for Testing multiple dose combinations in clinical trials by Saswati Saha, Werner Brannath and Björn Bornkamp in Statistical Methods in Medical Research
Footnotes
Declaration of conflicting interests
The author(s) declared no potential conflicts of interest with respect to the research, authorship, and/or publication of this article.
Funding
The author(s) disclosed receipt of the following financial support for the research, authorship, and/or publication of this article: This project has received funding from the European Union’s Horizon 2020 research and innovation programme under the Marie Sklodowska-Curie grant agreement No 633567.
Supplemental material
Supplemental material for this article is available online.
References
Supplementary Material
Please find the following supplemental material available below.
For Open Access articles published under a Creative Commons License, all supplemental material carries the same license as the article it is associated with.
For non-Open Access articles published, all supplemental material carries a non-exclusive license, and permission requests for re-use of supplemental material or any part of supplemental material shall be sent directly to the copyright owner as specified in the copyright notice associated with the article.