
Abstract
Administrative healthcare databases are increasingly being used for research purposes. When used to estimate the effects of treatments and interventions, an important limitation of these databases is the lack of information on important confounding variables. The high-dimensional propensity score (hdPS) is an algorithm that generates a large number of empirically-derived covariates using administrative healthcare databases. The hdPS has been described as enabling adjustment by proxy, in which a large number of empirically-derived covariates may serve as proxies for unmeasured confounding variables. We examined the validity of this assumption using samples of patients hospitalized with acute myocardial infarction (AMI) and congestive heart failure (CHF), for whom both administrative data and detailed clinical data were available. We considered three treatments in AMI patients: angiotensin-converting enzyme inhibitors, beta-blockers, and statins, while the first two treatments were also considered in CHF patients. We considered three propensity scores: (a) one derived using detailed clinical data; (b) the hdPS derived from administrative data; and (c) one derived from administrative data using expert opinion. Using each propensity score, we estimated inverse probability of treatment (IPT) weights. For each sample and treatment combination, and for each of the two propensity scores derived using administrative data, there were clinical variables not measured in administrative data that remained imbalanced after incorporating the IPT weights. However, the propensity score derived using clinical data always resulted in all clinical variables being balanced. When estimating hazard ratios, for some samples and treatment combinations, the hazard ratios estimated using the hdPS were more similar to those obtained using the clinical propensity score than were those obtained using the expert-derived propensity score. However, for other combinations, the effects estimated using the expert-derived propensity score were more similar to those obtained using the clinical propensity score than were those derived using the hdPS.
Keywords
1 Introduction
Observational data are increasingly being used for comparative effectiveness research, which involves comparing the relative safety and effectiveness of treatments and interventions. In observational research, treatment selection is not assigned at random. Consequently, patients receiving a specific treatment or intervention frequently differ systematically from those receiving no treatment or from those receiving a comparator treatment or intervention. Statistical methods must therefore be used to reduce or minimize the effects of confounding so that accurate estimates of treatment efficacy and safety can be obtained. Statistical methods based on the propensity score are increasingly being used to minimize the effects of confounding when estimating treatment effects using observational data.1,2 These methods are popular in pharmacoepidemiological research. While propensity score methods are being applied with increasing frequency, they do not necessarily circumvent the problem of unmeasured confounding. 3
In medical research, when designing observational studies, prospective clinical registries and the use of clinical data obtained using retrospective chart review by trained abstractors is considered the gold standard. The use of prospective registries and data collected by reviewing patients' medical records allows for documenting patient risk factors, vital signs, presenting signs and symptoms, disease-specific anatomy, and results of laboratory investigations. However, there are several limitations to the use of prospective clinical registries and clinical data obtained using chart review. First, these data can be very expensive to obtain. Second, the collection of these data is time consuming. Third, these data frequently do not provide population coverage—that is, they frequently do not contain information on all patients with a specific clinical condition in a given region or jurisdiction. Due to these limitations, researchers are increasingly using administrative healthcare data to estimate the effects of interventions and treatment. Administrative healthcare data frequently provide coverage of entire populations. Furthermore, they are often available at a nominal cost, and the time required to obtain the data is often minimal. However, concerns have been raised as to whether administrative healthcare data contain sufficient information on patient characteristics to permit adequate statistical adjustment to account for confounding. In one study, it was shown that propensity score models estimated using data from administrative data did not balance key clinical variables that were not present in administrative data. 3
The high-dimensional propensity score (hdPS) is an automated data-driven or empirical approach to deriving variables from administrative data for inclusion in propensity score models. 4 The use of the hdPS algorithm appears to be increasingly popular in the field of pharmacoepidemiology. The first step in the hdPS algorithm is to identify different data dimensions. These can consist of inpatient diagnoses, outpatient diagnoses, medical or surgical procedures, and medications dispensed. In the case study below, we will consider five different dimensions: (a) procedures and interventions performed in hospital; (b) diagnoses made on hospitalized patients; (c) diagnoses made on patients using physician billing claims; (d) fee codes submitted by physicians for consultations, assessments, or procedures; and (e) unique medications dispensed to patients by outpatient pharmacies. Schneeweiss et al. 4 described a seven-step algorithm for defining and implementing the hdPS: Step 1: identify p different data dimensions to be used (p = 4 or 5 in our case study below). A temporal window prior to the cohort entry date must be defined (they suggest that a frequent choice is the 6 or 12 months preceding the cohort index date). Only those healthcare records that occurred during this temporal window are retained. One also specifies investigator-identified covariates for inclusion in the hdPS model (e.g., age, sex, or specific comorbid conditions of interest); Step 2: within each of the p data dimensions, sort by prevalence of the fee code, procedure code, or diagnosis code (e.g., when using the dimension consisting of all in-hospital diagnosis codes, sort the list of all observed in-hospital diagnosis codes according to their prevalence). Within each dimension, select the n most common codes (they suggest n = 200 in the base case); Step 3: assess the recurrence of each identified code or diagnosis by categorizing the frequency with which the given code or diagnosis occurs for each subject in the cohort. Create three binary variables denoting the frequency of these codes or diagnoses; Step 4: across the p×n×3 covariates (p data dimensions × n codes per dimension × 3 covariates defined based on frequency of each code), prioritize the identified covariates according to the amount of confounding for which each covariate could account after adjusting for demographic covariates (assuming a binary outcome and exposure). Across the p×n×3 identified covariates, rank the selected covariates according to this criterion; Step 5: select empirical covariates for inclusion in the hdPS model. These include the investigator-specified covariates identified in Step 1 and the top k covariates identified in Step 4; Step 6: estimate the hdPS by regressing the binary exposure on the selected covariates; Step 7: estimate the effect of treatment using an appropriate propensity score method. The reader is referred to the original paper for greater details on the specific steps of the algorithm.
The developers of the hdPS algorithm have described it as permitting adjustment by proxy, suggesting that the empirically-derived covariates may serve as proxies for unmeasured confounding variables.4,5 The developers suggested that “if we could measure a battery of proxies, we would increase the likelihood that in combination they are a good overall proxy for relevant unobserved confounding factors” 4 (p. 513). Despite the frequency with which the hdPS algorithm is used, its ability to construct empirically-derived covariates that permit the balancing of unmeasured confounding variables has not been fully explored.
The objective of the current study was threefold: first, to examine whether, in two specific clinical settings, propensity scores developed from administrative data using the hdPS algorithm balanced clinical characteristics that were not recorded in administrative data. Second, in these two clinical settings, to compare estimated treatment effects when the hdPS algorithm was used with administrative data with estimated treatment effect estimates obtained using propensity scores derived from detailed clinical data. Third, in these two clinical settings, to compare the performance of propensity scores developed using the hdPS algorithm with propensity scores developed from administrative data when expert opinion was used to select the variables for inclusion in the propensity score model. These objectives will be achieved using samples of cardiovascular patients for whom both detailed clinical data and administrative data were available.
2 Data sources
The current study used samples of patients hospitalized with either acute myocardial infarction (AMI) or congestive heart failure (CHF) for whom both detailed clinical data obtained using retrospective chart review and administrative data from multiple electronic administrative databases were available.
2.1 Detailed clinical data obtained using retrospective chart review
The Enhanced Feedback for Effective Cardiac Treatment (EFFECT) study was an initiative to improve the quality of care for patients with cardiovascular disease in Ontario. During the first phase, detailed clinical data were collected on patients hospitalized with AMI or CHF between 1 April 1999 and 31 March 2001 at 86 hospital corporations in Ontario, Canada, by retrospective chart review. During the second phase, data were abstracted on patients hospitalized with these conditions between 1 April 2004 and 31 March 2005 at 81 Ontario hospital corporations. Data on patient demographics, vital signs, and physical examination at presentation, medical history, and results of laboratory tests were collected by trained cardiovascular research nurses for these samples. For the purposes of the current study, for each of the two cardiovascular diseases, data from the two phases of the EFFECT study were combined to create an AMI sample and a CHF sample. All subsequent analyses are conducted separately in the AMI sample and in the CHF sample.
Mortality was determined by linking the two study samples to the Registered Persons Database (RPDB) using encoded versions of the patients' health insurance numbers. The RPDB contains basic demographic information on all Ontarians who were ever eligible for Ontario's universal healthcare insurance program. The RPDB contains information on each resident's date of birth, sex, and date of death (if applicable). For the current study, the outcome of interest was time from hospital discharge to death, with patients being censored after five years of follow-up.
2.2 Administrative data sources
In the Canadian province of Ontario, all medically-necessary services are provided within a single-payer public healthcare system, with no parallel private system. The Ontario Health Insurance Plan (OHIP) is a government-funded universal health insurance program that funds physician services, while hospital services are funded by the Ministry of Health and Long-Term Care (MOHLTC). These services are provided to all residents of Ontario, without deductibles or co-payments. Furthermore, prescription drug coverage is provided to all residents over the age of 65 years.
We used three different population-based administrative healthcare databases that were linked by encoded versions of patients' health insurance number. First, the OHIP physician claims database contains billing claims submitted by Ontario physicians to the provincial universal health insurance program. Each claim contains a fee code describing the type of service provided and a diagnosis code describing a reason for the service. Both of these fields must be completed for the physician to be reimbursed financially for the services provided. The diagnosis field is coded using a truncated version of the International Classification of Disease, 9th Revision (ICD-9) coding scheme. Second, the Canadian Institute for Health Information (CIHI) Discharge Abstract Database (DAD) contains information on all inpatient hospitalizations in the province of Ontario. Prior to 2002, diagnoses were coded using the ICD-9, and there were 16 fields for recording diagnoses made on the patient during the course of hospitalization. Since 2002, diagnoses have been coded using the ICD-10th Revision coding scheme, and there are 25 fields. The coding algorithms in the CIHI DAD permit one to differentiate between diagnoses that arose prior to the hospital admission from those that arose during the patient's stay in hospital. Furthermore, there are 10 fields for recording procedures that were carried out on the patient during the hospitalization. Prior to 2002, these were classified using the Canadian Classification of Procedures coding system, while the Canadian Classification of Interventions system has been used since 2002. Third, the Ontario Drug Benefit (ODB) database documents prescriptions dispensed to Ontario residents over the age of 65 years. For each prescription dispensed under the ODB program, the database documents the patient who received the medication, the date that the prescription was filled, and the unique drug identification number identifying the medication that was dispensed. These three electronic administrative healthcare databases can be deterministically linked using an encoded version of the patient's health insurance number.
We also used four disease-specific databases that had been previously constructed using these electronic administrative healthcare databases: the Ontario Diabetes Database, the Ontario Hypertension Database, the Ontario Chronic Obstructive Pulmonary Disease (COPD) Database, and the Ontario Myocardial Infarction Database. These databases identify patients in the province of Ontario who had been diagnosed with diabetes, hypertension, COPD, and AMI, respectively. Details on the construction and validation of these databases are provided elsewhere.6–9
2.3 Study sample
For each of the two disease groups, the study sample was restricted to those subjects in the EFFECT sample who survived to hospital discharge (since the exposures we are studying are prescribing of medications at hospital discharge). Patients were excluded if they were discharged to another acute care hospital, complex continuing care hospital, or a rehabilitation hospital. Thus, each sample was restricted to subjects who were discharged home (with or without home care services) or to a long-term care facility. Subjects who had missing data on important clinical variables were excluded from the analyses. The final AMI sample consisted of 11,311 subjects, while the final CHF sample consisted of 13,509 subjects.
3 Statistical methods
The outcome of interest for this study was the occurrence of death within five years of hospital discharge. In the AMI sample, we estimated the effect of the prescription of three different medications at hospital discharge on the hazard of death within five years of discharge: angiotensin-converting enzyme (ACE) inhibitors, beta-blockers, and statin lipid-lowering agents. In the CHF sample, we restricted our focus to the first two of these medications. Exposure to a prescription of each of the medications was determined through an examination of the EFFECT database, which documents prescriptions given to the patient at hospital discharge. We conducted two separate sets of analyses. First, we estimated the effect of treatment in all subjects. Second, we estimated the effect of treatment in those subjects aged 66 years and older (while the ODB provides information on medication prescribing to those over the age of 65 years, we used a one-year “look-back window” to determine medication use in the year prior to the index hospitalization. Thus, in this set of analyses, we restricted the sample to those over the age of 66 years).
3.1 Estimating the propensity score
For each disease sample (AMI and CHF) and for each treatment (ACE inhibitors, beta-blockers, and statins), we estimated four different propensity scores. Each was estimated using a logistic regression model in which an indicator variable denoting treatment status was regressed on a set of baseline covariates (e.g., when considering statin use, we fit a logistic regression model modeling prescribing of statins at discharge vs. non-prescribing of statins at discharge). Continuous variables were assumed to have a linear relationship with the log-odds of exposure. Once we had estimated a given propensity score, we computed stabilized inverse probability of treatment (IPT) weights. Let e denote the propensity score, which is the predicted probability of treatment assignment conditional on the included baseline covariates. Stabilized IPT weights were defined as
The first propensity score model incorporated only variables that were measured in the EFFECT dataset. We will refer to this as the clinical propensity score model. This propensity score model consisted of variables measured in clinical data that are plausible predictors of mortality subsequent to hospitalization with an AMI or CHF. The clinical propensity score will serve as the gold standard in the current study. The second propensity score model incorporated variables that were available in administrative data and that were specified prior to the analyses by two co-authors who are cardiologists (JVT and DSL). We refer to this model as the “administrative expert-selected model” (or the “expert-selected model” when the context makes it clear that administrative data were used). The third propensity score model incorporated variables that were selected from administrative data by the hdPS algorithm. We refer to this as the “hdPS” propensity score model. The fourth combined the variables in the hdPS model together with those from the administrative expert-selected model. We will refer to this as the “hdPS + expert-selected” model.
3.1.1 AMI sample
The following variables were included in the clinical propensity score model: demographic characteristics: age and sex; presenting signs and symptoms: cardiogenic shock and heart failure or pulmonary edema; vital signs on admission: systolic and diastolic blood pressure, heart rate, and respiratory rate; classical cardiac risk factors: diabetes, history of hyperlipidemia, hypertension, family history of heart disease, and smoking history; co-existing medical conditions and comorbid conditions: cerebrovascular accident or transient ischemic attack, angina, cancer, dementia, peptic ulcer disease, previous AMI, asthma, depression, peripheral arterial disease, previous revascularization, chronic CHF, hyperthyroidism, and aortic stenosis; laboratory test results (hematology): hemoglobin, white blood count; laboratory test results (chemistry): sodium, potassium, glucose, urea, and creatinine; cardiac measures: raised cardiac enzymes; results of echocardiogram: presence of ST segment depression; and whether the patient underwent a percutaneous coronary intervention (PCI) during the initial hospitalization. Thus, the clinical propensity score model consisted of 36 variables derived from detailed clinical data sources. Of note, nine of these variables (age, history of CHF, history of MI, creatinine, elevated cardiac enzymes, PCI during initial hospitalization, heart rate, systolic blood pressure, and ST segment depression) comprise the Global Registry of Acute Coronary Events (GRACE) score for predicting medium-term mortality in patients with acute coronary syndromes.10,11 All of the variables for the clinical propensity score model were derived from the EFFECT data obtained from review of the patients' hospital medical records.
The variables for inclusion in the administrative expert-selected model were those 11 variables in the Ontario AMI mortality prediction model in addition to 5 supplemental variables. The Ontario AMI mortality prediction model is a model for predicting both short- and long-term mortality following hospitalization with an AMI. 12 The variables comprising the prediction model consist of age, sex, cardiac severity (CHF, cardiogenic shock, arrhythmia, and pulmonary edema), and comorbid status (diabetes mellitus with complications, stroke, acute and chronic renal disease, and malignancy). These variables are derived from the secondary diagnostic fields of the hospitalization database. To these 11 variables were added the following 5 variables: hypertension, diabetes, COPD, number of prior hospitalizations for AMI, and history of prior cardiac revascularization (coronary artery bypass graft (CABG) surgery or coronary angioplasty). The first four of these variables were identified using the appropriate disease-specific databases identified above. The fifth additional variable was identified using physician billing claims (OHIP) and the CIHI DAD. Thus, the administrative a priori expert-selected propensity score model consisted of 16 variables obtained from administrative data sources. While some variables were included in both the clinical propensity score model and the administrative expert-selected propensity score model, the source of these variables differed. All variables in the clinical propensity score model were obtained by retrospective review of the patients' hospital medical records, while all variables in the administrative expert-selected propensity score model were obtained from electronic administrative databases (CIHI DAD and OHIP physician billing claims database).
3.1.2 CHF sample
CCCHF sample
The variables for inclusion in the clinical propensity score model were as follows: demographic characteristics: age and sex; vital signs on admission: systolic blood pressure, heart rate, and respiratory rate; presenting signs and symptoms: neck vein distension, S3, S4, and rales > 50% of lung field; findings on chest X-ray: pulmonary edema and cardiomegaly; past medical history: diabetes, cerebrovascular accident or transient ischemic attack, previous AMI, atrial fibrillation, peripheral vascular disease, COPD, dementia, cirrhosis, and cancer; electrocardiogram—first available within 48 hours: left bundle branch block; laboratory tests: hemoglobin, white blood count, sodium, potassium, glucose, blood urea nitrogen, and creatinine. Thus, the clinical propensity score model consisted of 28 variables derived from detailed clinical data.
The variables for inclusion in the administrative expert-selected propensity score model were those identified by Krumholz et al. for use with administrative data to predict mortality in patients with CHF. These included history of (all within one year prior to index CHF hospitalization) CABG, heart failure, AMI, angioplasty, peripheral vascular disease, unstable angina, chronic atherosclerosis, cardiopulmonary-respiratory failure and shock, COPD, dementia, diabetes, hypertension, chronic liver disease, protein-calorie malnutrition, metastatic cancer, hemiplegia (or paraplegia, paralysis, or functional disability), pneumonia, major psychotic disorders, renal failure, stroke, trauma, and valvular heart disease. To these variables, we added two additional variables: history of dialysis use within the previous two years and history of transient ischemic attack in the previous two years. These variables in the administrative expert-selected propensity score model were all derived from the CIHI DAD and the OHIP physician billing claims database.
3.1.3 hdPS
For the hdPS, we used four different data dimensions when estimating the effect of treatment in all subjects: (a) diagnoses recorded in physician billing claims (source: OHIP database); (b) fee codes denoting procedure and consultations recorded in physician billing claims (source: OHIP database); (c) diagnoses recorded in the inpatient hospitalization database (source: CIHI DAD); and (d) procedures and interventions recorded in the inpatient hospitalization database (source: CIHI DAD). When estimating the effect of treatment in subjects aged 66 years and older, we added a fifth dimension: outpatient prescription medications dispensed to the patient (source: ODB database). When using the ODB dimension, we removed any prescriptions for the medication currently under consideration (e.g., when estimating the effect of discharge prescribing of statins, we removed any prescriptions for statins from this dimension in the year prior to hospital admission). For each dimension, we used all healthcare claims in the 365 days prior to the index hospitalization for either AMI or CHF. We used the SAS macro provided by the developers of the hdPS method to select the variables for inclusion in the hdPS. All macro parameters were set to their defaults. Age and sex were added to the set of variables identified by the hdPS macro. Thus, the hdPS used two administrative data sources (CIHI DAD and OHIP physician billing claims) when using patients of all ages and three administrative data sources (CIHI DAD, OHIP physician billing claims, and ODB drug claims) when using patients over the age of 66 years.
The fifth data dimension is only available for patients over the age of 66 years. Restricting all of the analyses to these elderly patients would result in a reduction in sample size for all analyses. For this reason, we decided to conduct two parallel analyses: (a) use four data dimensions and include subjects of all ages and (b) use all five data dimensions and restrict the analysis to subjects over the age of 66 years. Restricting the sample to those under the age of 66 when using the four dimensions would have been inefficient, as these data are available for all subjects. Guertin et al. 14 found that in one specific setting, using an hdPS constructed using hospitalization data was able to balance some variables derived from medication data.
3.2 Estimating covariate balance between treatment groups
We examined the extent to which weighting the sample using the IPT weights balanced patient characteristics contained in the clinical dataset between treated and untreated subjects in the weighted sample. To do so, we estimated the weighted standardized difference comparing the mean or prevalence of each of the covariates in the clinical propensity score model between treated and untreated subjects. 15 This was done for the weighted samples constructed using each of the four different propensity scores.
3.3 Estimating the effect of treatment
We used IPT weighting, with weights derived from the propensity score, to estimate the effect of receipt of a prescription for a given medication at hospital discharge on the hazard of death within five years of hospital discharge. 16 The effect of treatment on the hazard of post-discharge mortality was estimated using a Cox proportional hazards regression model in which survival was regressed on an indicator variable denoting treatment status. The sample was weighted by the IPT weights, and a robust variance estimator was used. 16
3.4 Estimating the effect of treatment in eligible patients
The use of detailed clinical data not only permits comprehensive adjustment for baseline differences between treated and control subjects but also permits the identification of subjects who are eligible for specific therapies. In the AMI sample, patients were defined to be eligible for ACE inhibitors at hospital discharge if they were documented as having poor left ventricular function. Similarly, in the CHF sample, patients were defined to be eligible for either ACE inhibitors or beta-blockers at hospital discharge if they were documented as having poor left ventricular function. Variables in the EFFECT database permitted identifying subjects who were candidates for each of these therapies (the documentation of left ventricular function is not reported in administrative data but was only available in the EFFECT database). We repeated the above analyses, restricting the samples to AMI patients who were eligible for ACE inhibitors, CHF patients who were eligible for ACE inhibitors, and CHF patients who were eligible for beta-blockers.
4 Results
4.1 AMI sample
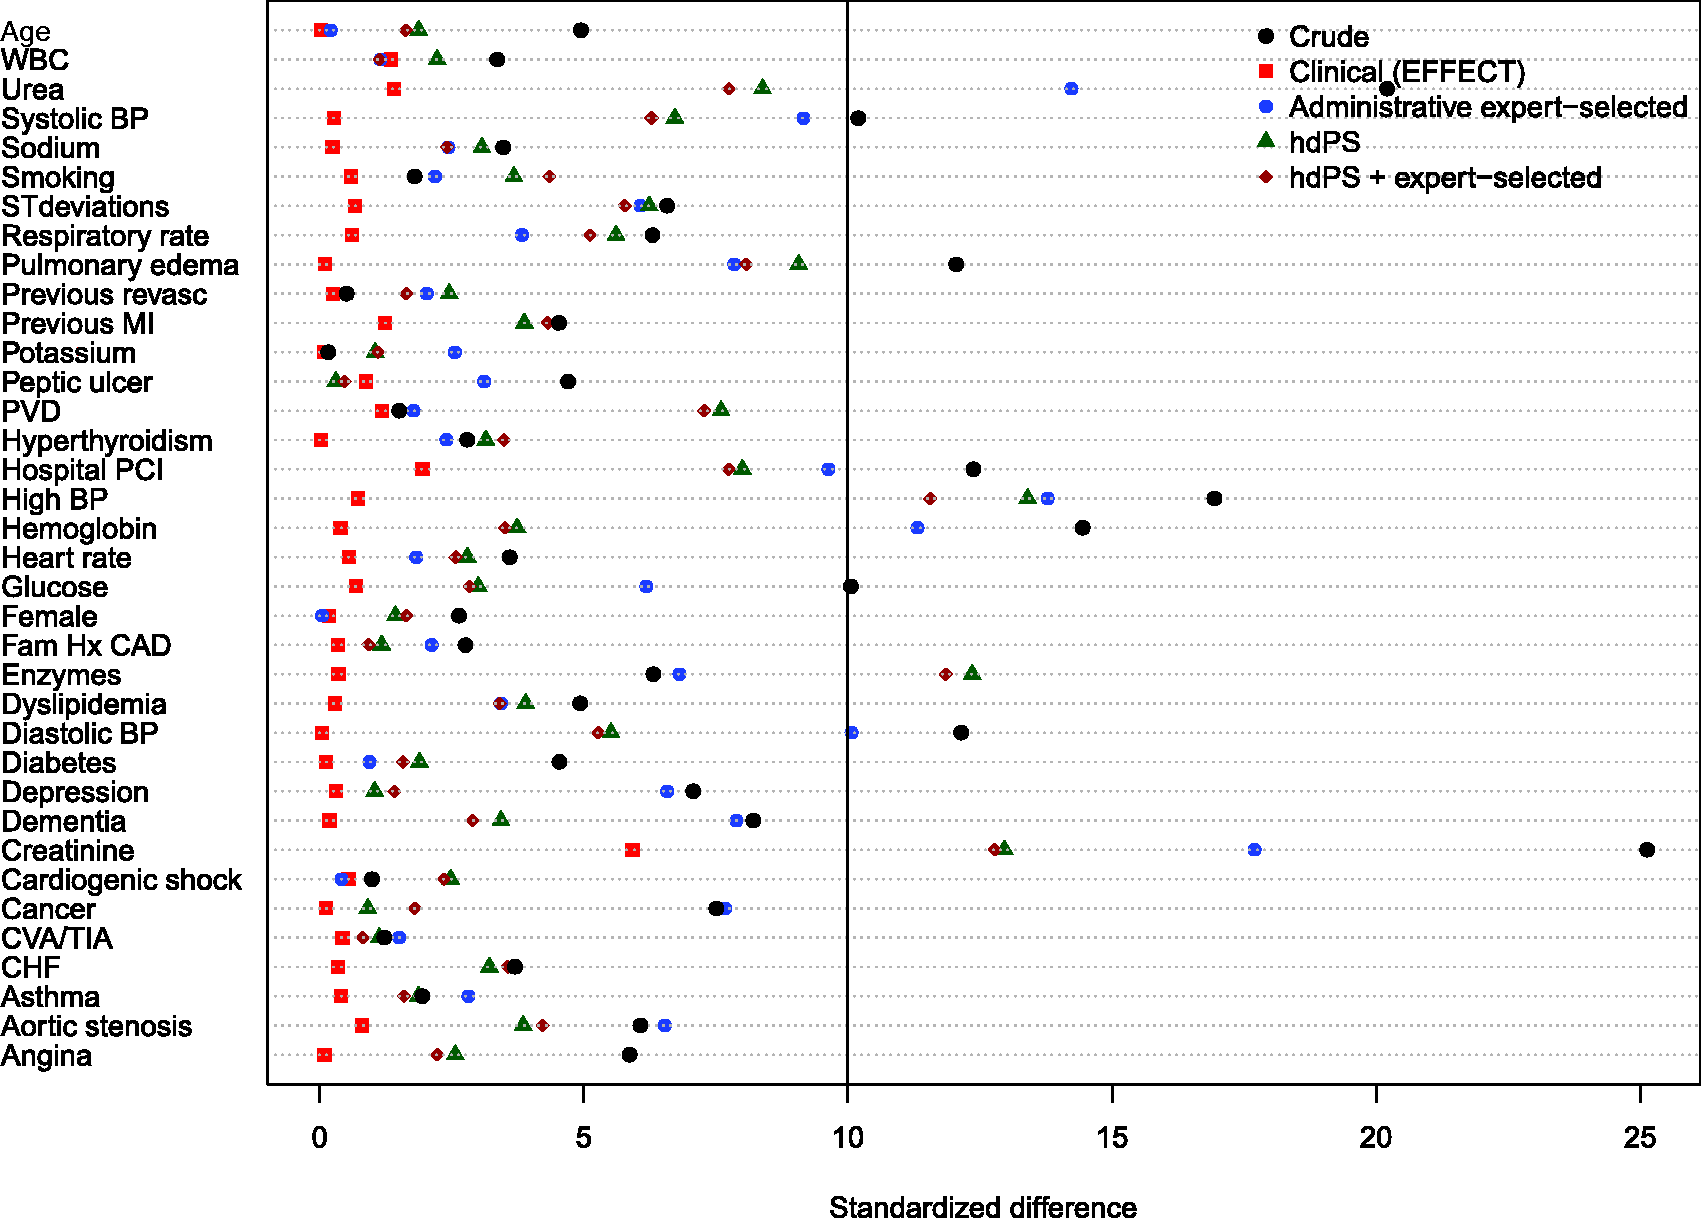
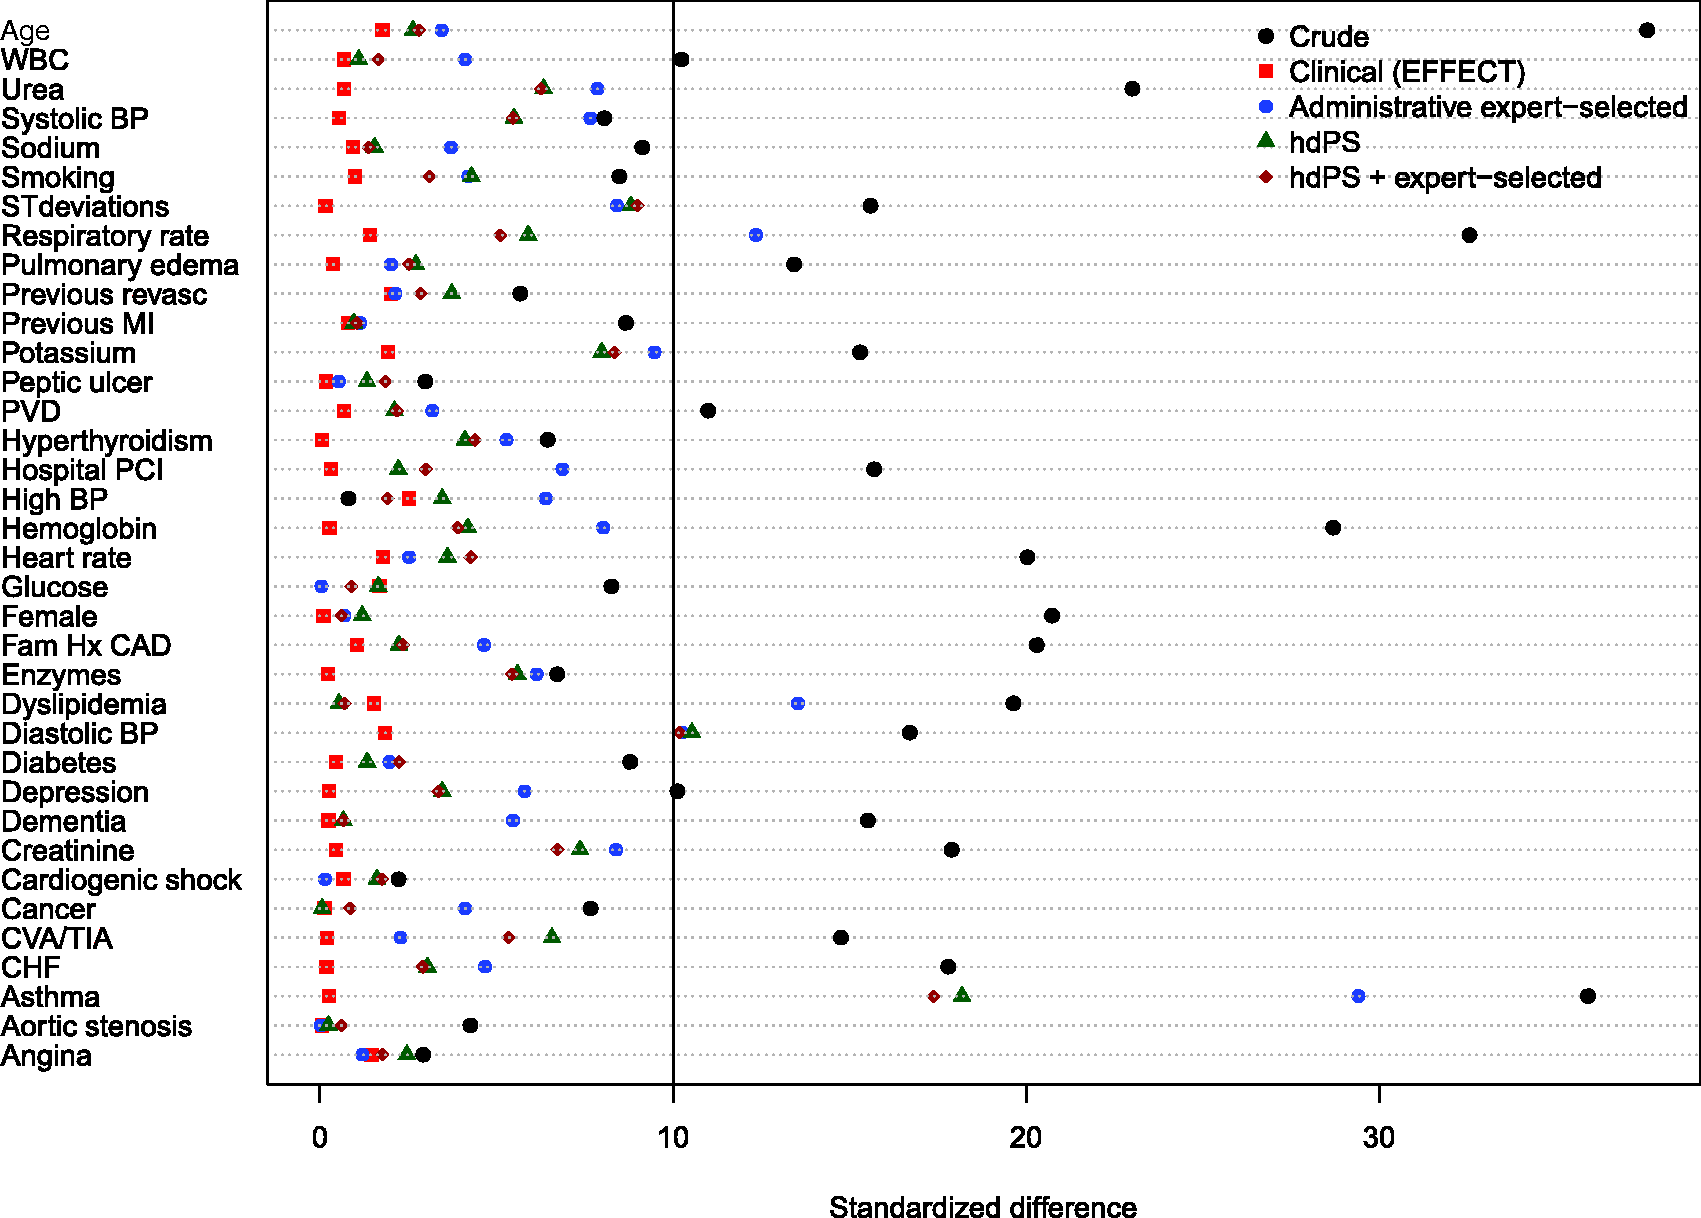
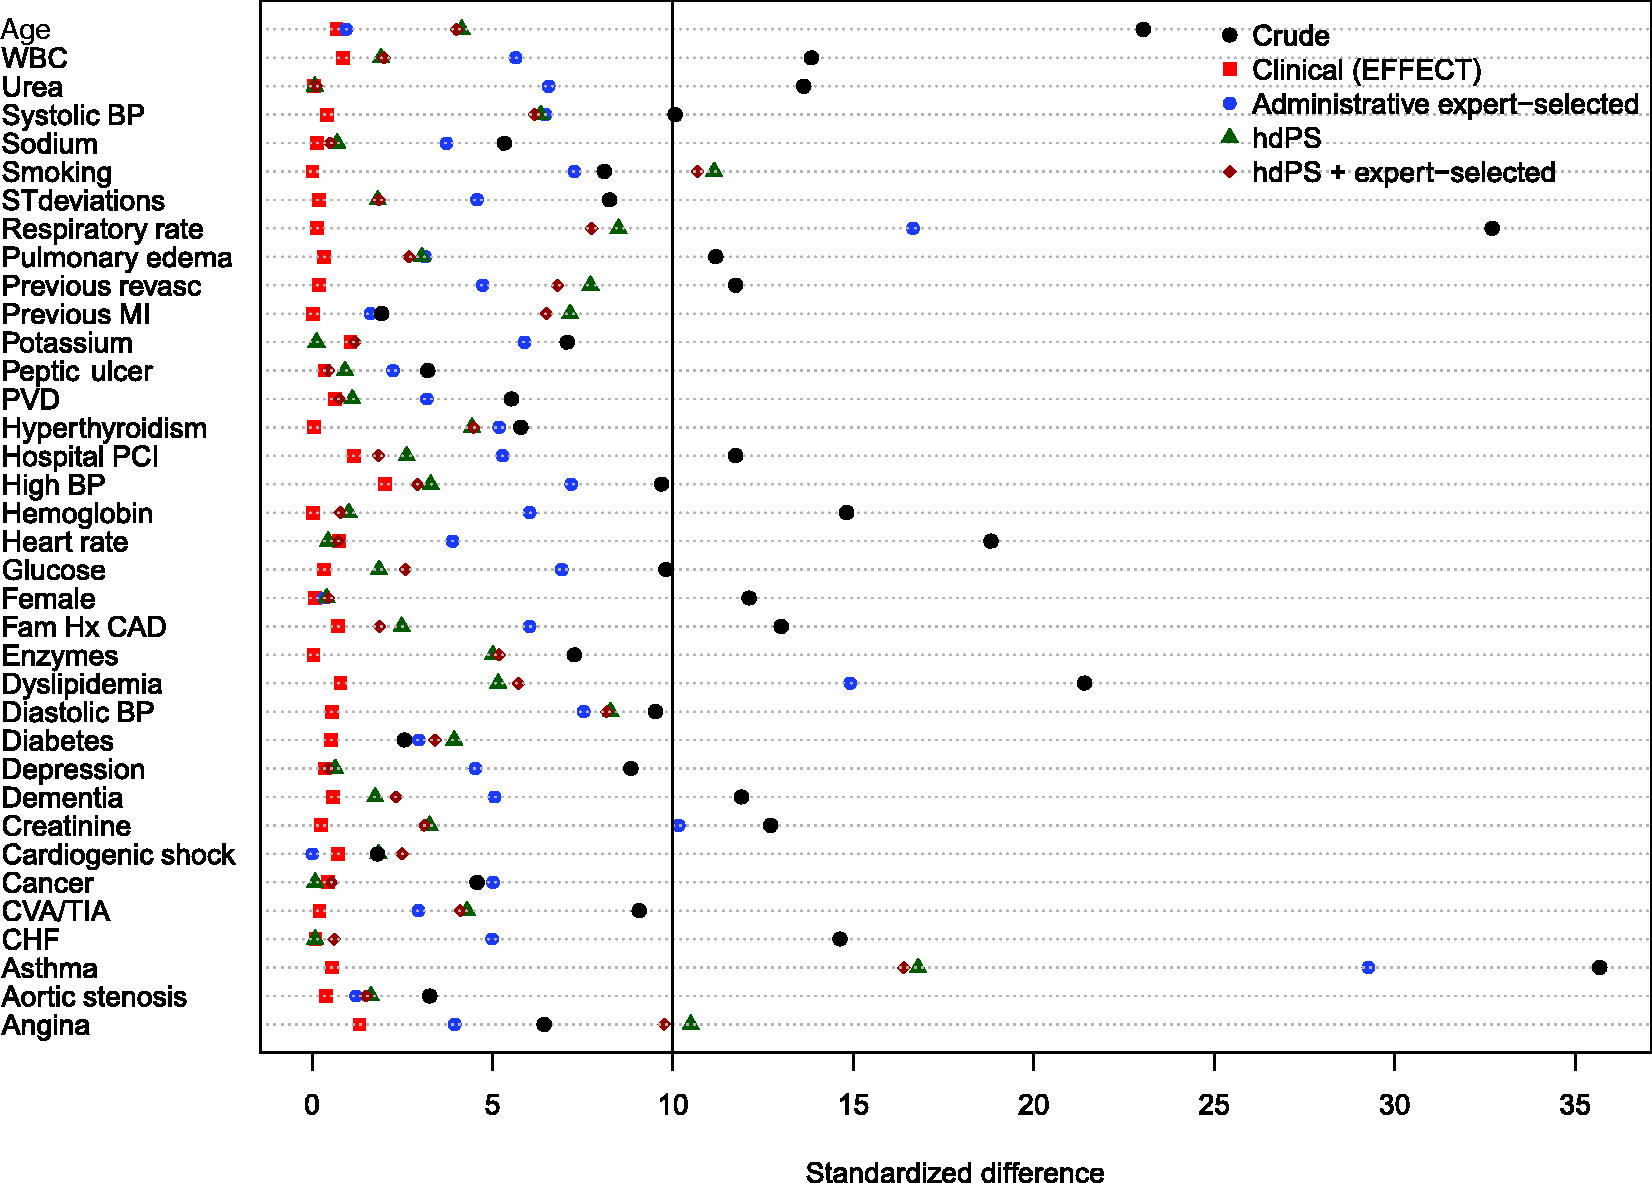
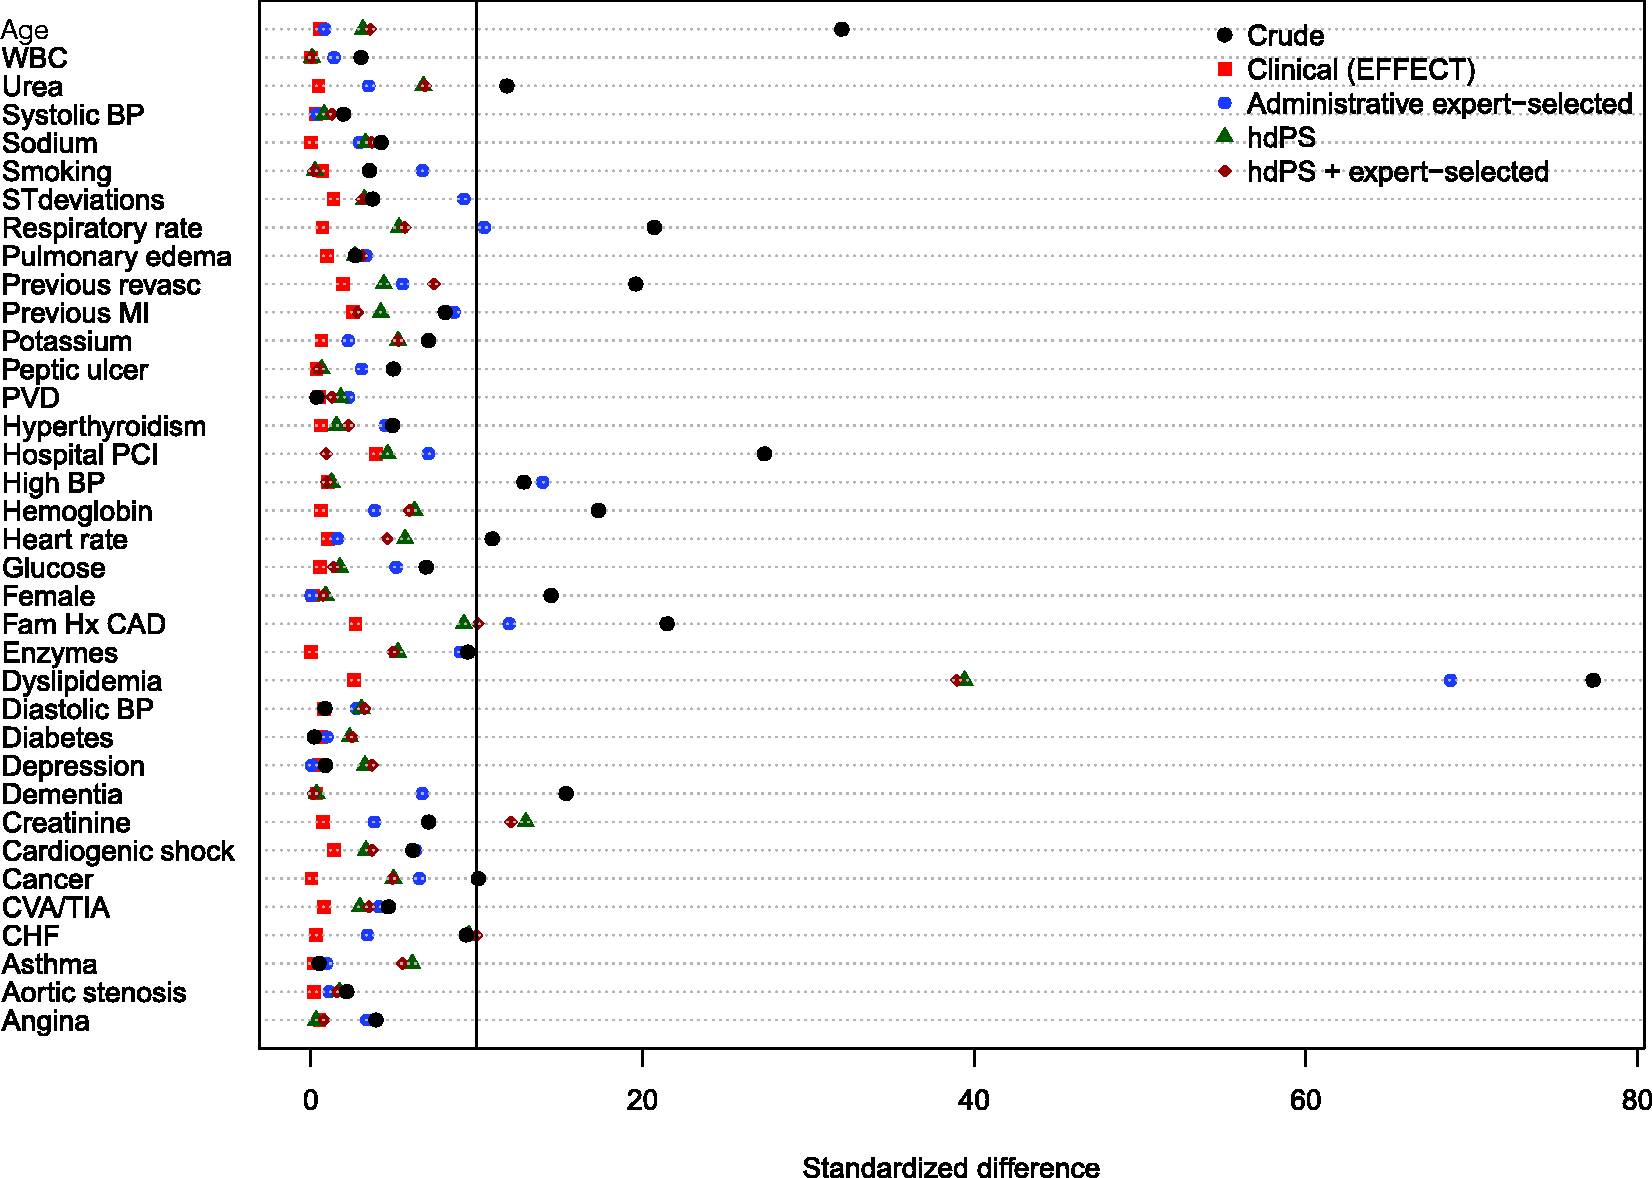
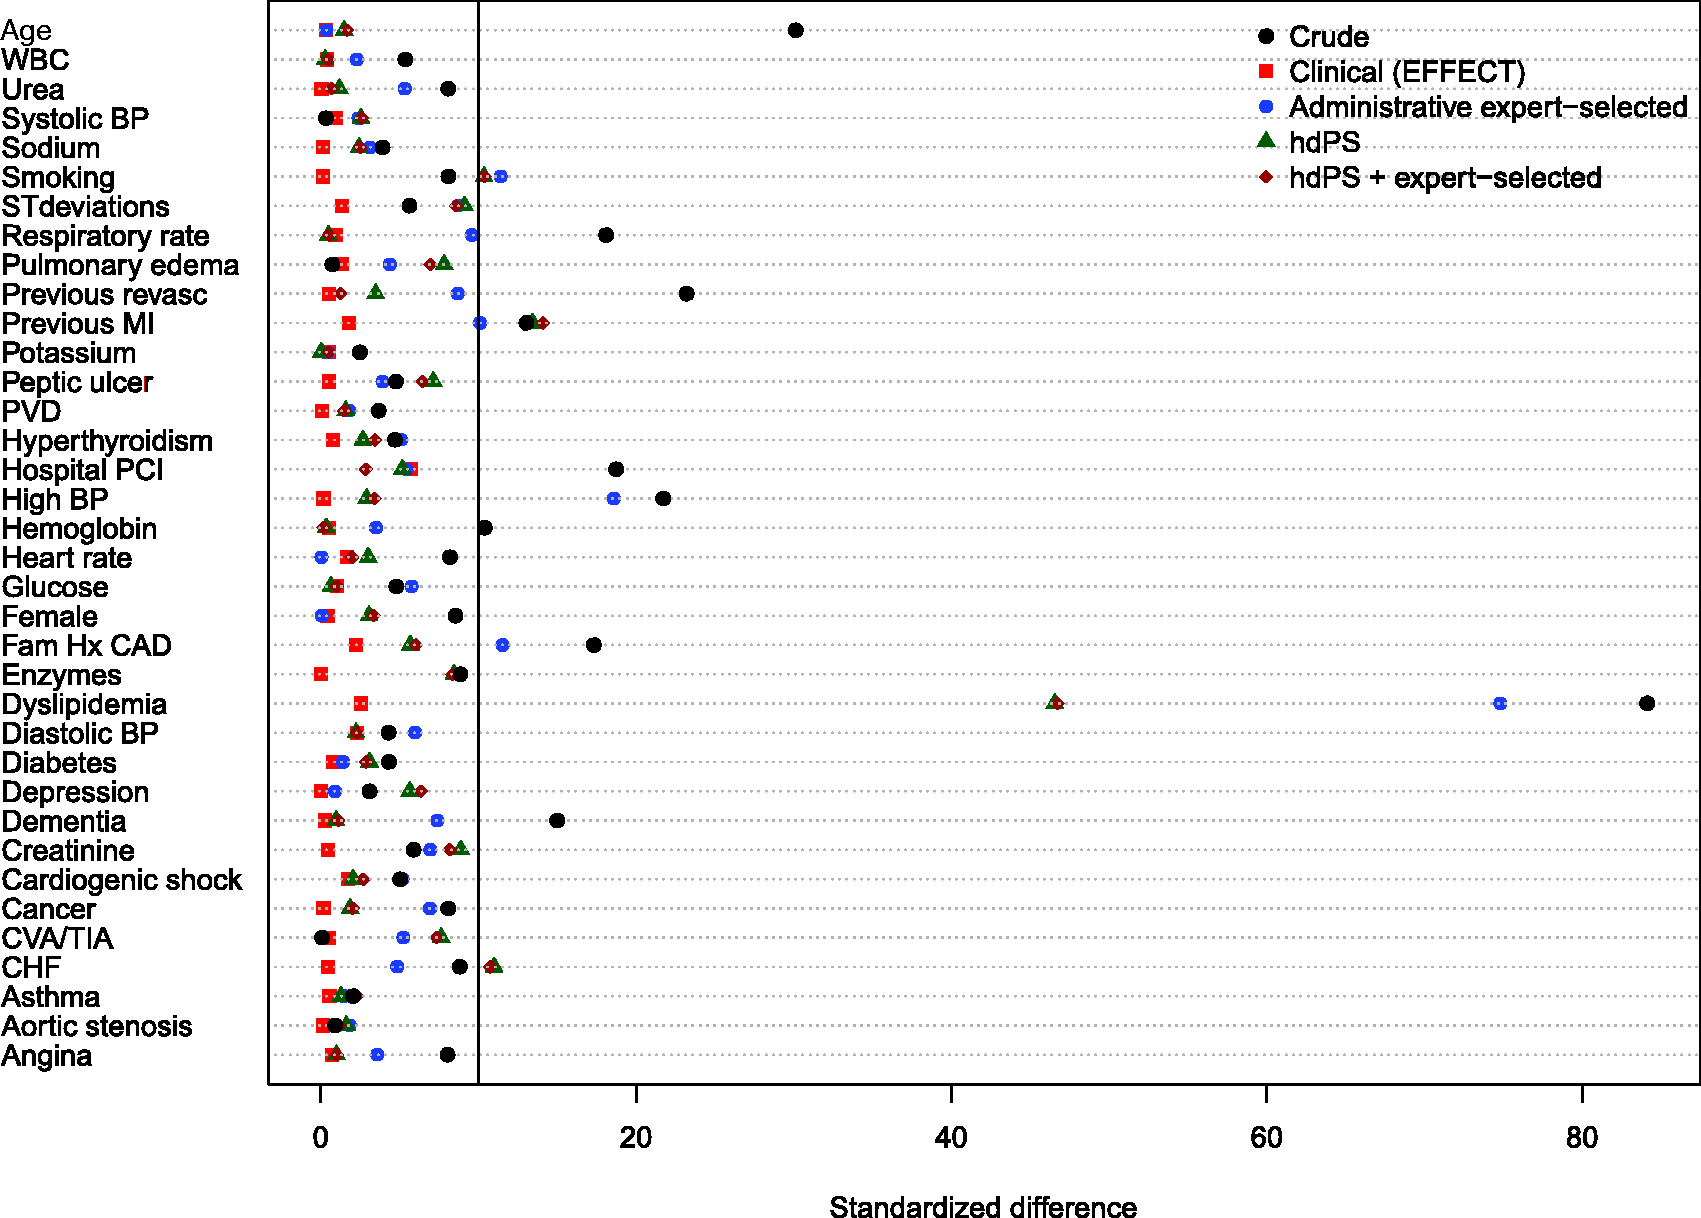
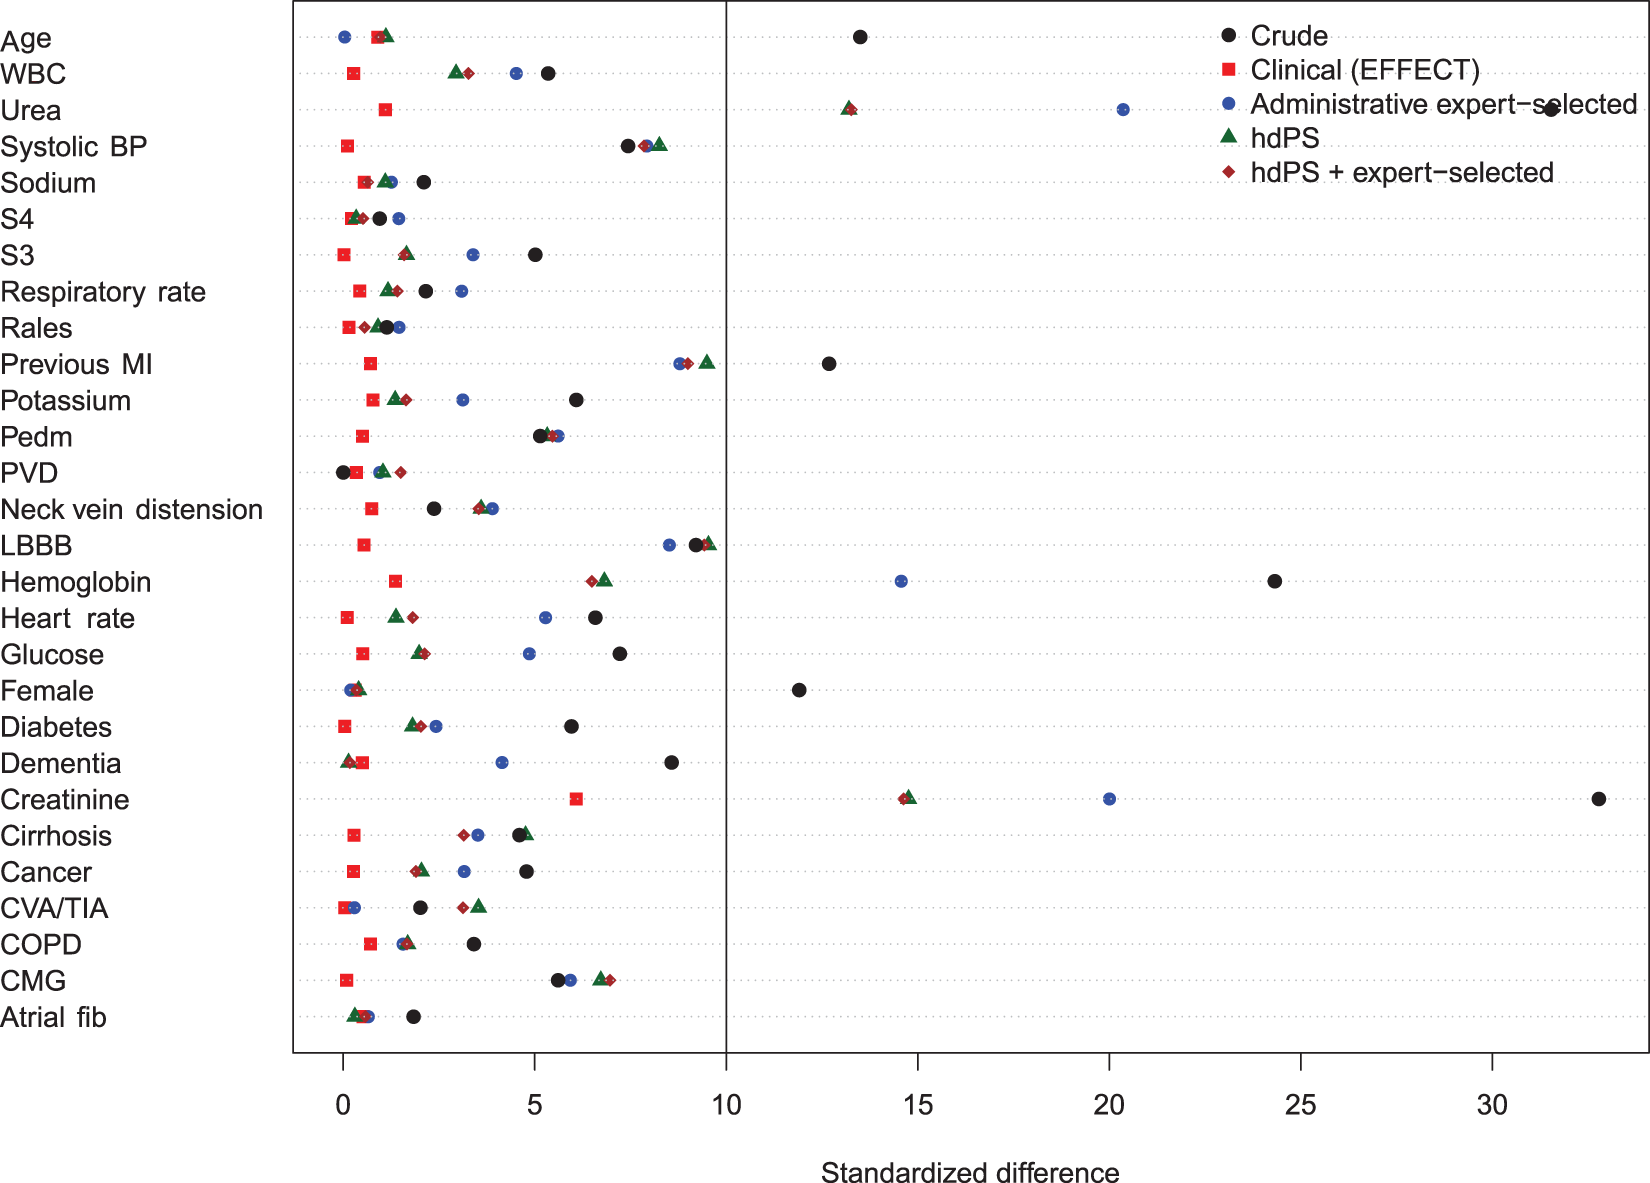
Balance of baseline clinical variables (measured in the EFFECT dataset) between treated and control subjects after weighting using the different propensity scores are reported in Figures 1 to 6. There are two figures for each drug (ACE inhibitors, beta-blockers, and statins)—one for balance in the overall sample when four dimensions were used for the hdPS algorithm and one for balance in the sample of those over the age of 66 years when five dimensions were used for the hdPS algorithm. On each figure, we have superimposed a vertical line denoting a standardized difference of 10%, which we have used as a threshold for acceptable imbalance.
17
In all six figures, weighting using the clinical propensity score (i.e., the gold standard) derived from the EFFECT data resulted in all of the EFFECT variables being balanced between treatment groups. However, in each of the six figures, there was at least one variable which remained imbalanced after weighting using the administrative expert-selected model propensity score derived from administrative data. Similarly, in each of the six figures, there was at least one variable which remained imbalanced after weighting using the empirical variables obtained using the hdPS. Importantly, none of the propensity scores derived from administrative data balanced all of the clinical covariates measured in the EFFECT database. The numeric values of the standardized differences that are reported in Figures 1 to 6 are reported in Tables 1 to 6 in the online appendix.
Balance between ACE inhibitor groups (AMI: full sample). Balance between ACE inhibitor groups (AMI: > 66 years). Balance between beta-blocker groups (AMI: full sample). Balance between beta-blocker groups (AMI: > 66 years). Balance between statin groups (AMI: full sample). Balance between statin groups (AMI: > 66 years).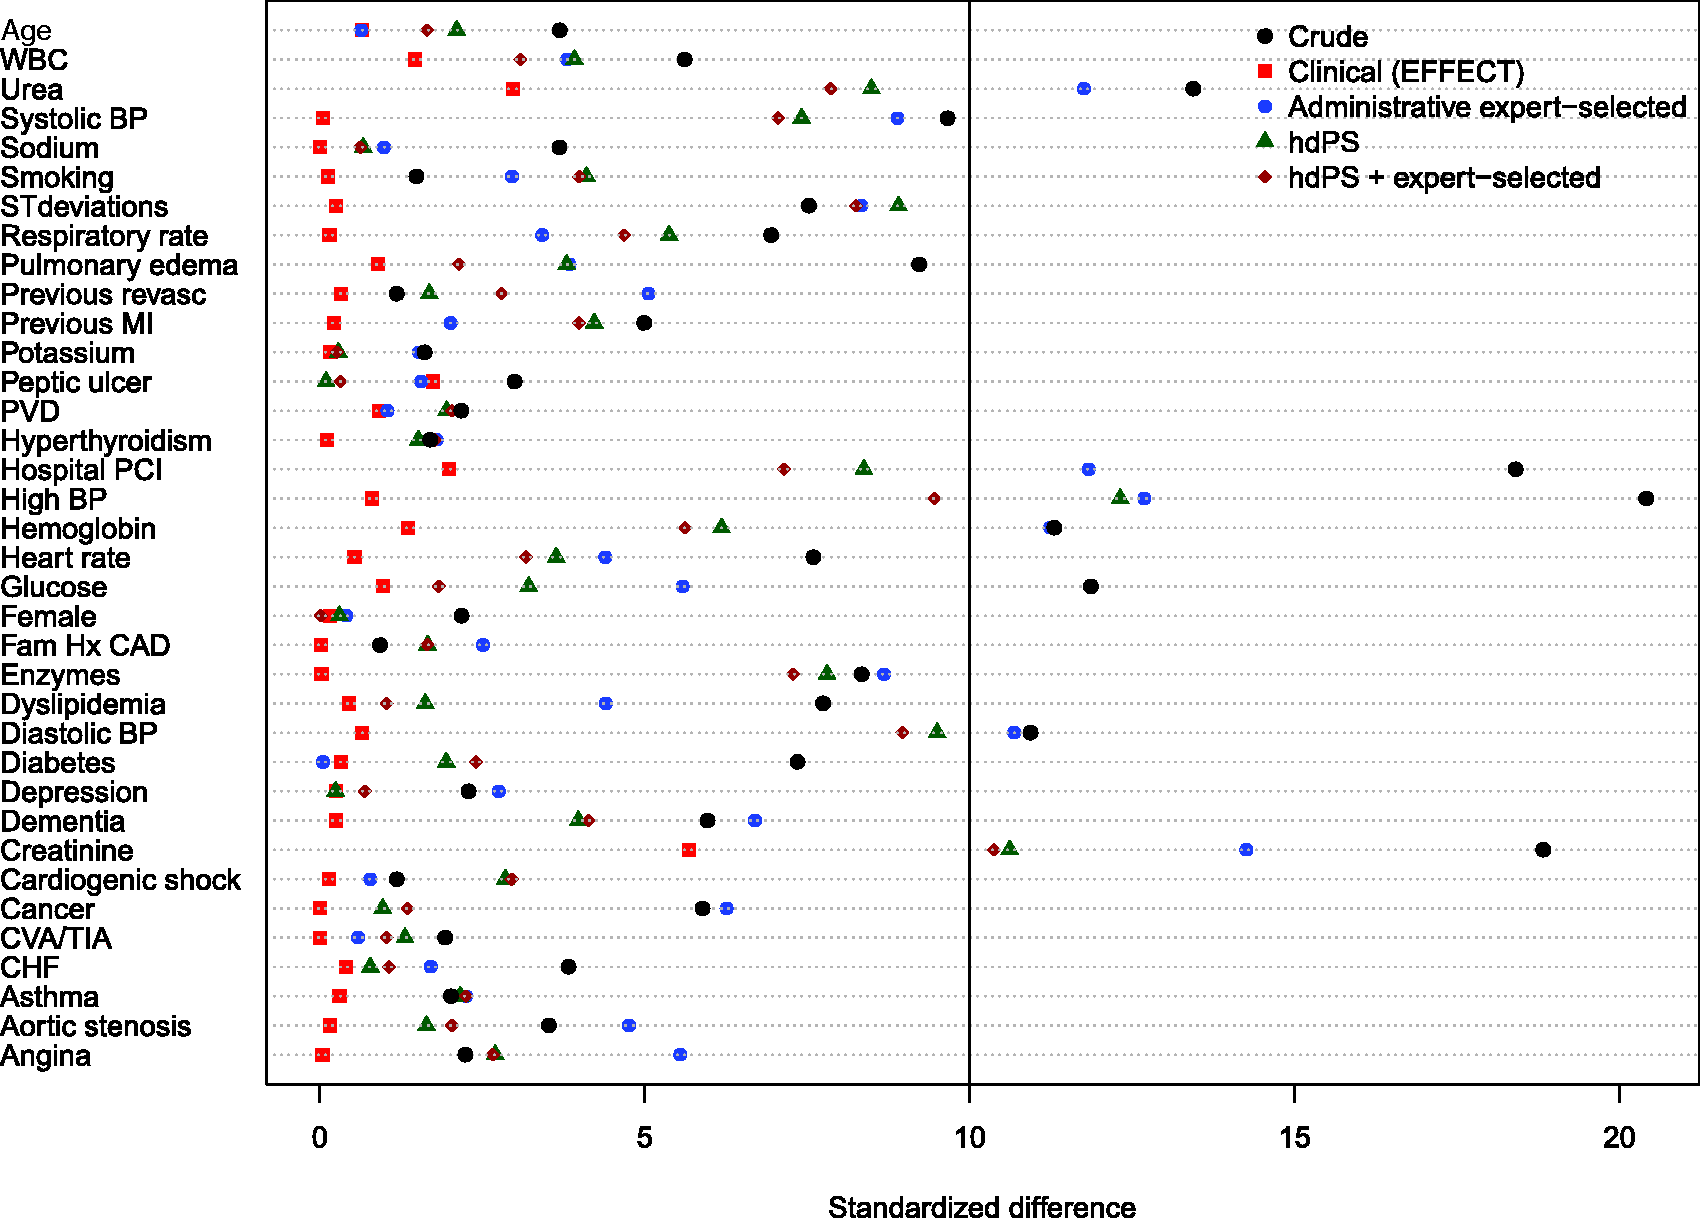
The hazard ratios for the effect of ACE inhibitors (upper-left panel), beta-blockers (upper-right panel), and statins (lower-left panel) on the hazard of post-discharge mortality in patients hospitalized with AMI are reported in Figure 7. For ACE inhibitors, there were four patient populations: all ages, age ≥ 66 years, patients of all ages eligible for ACE inhibitor treatment, and patients aged ≥ 66 years who were eligible for ACE inhibitor treatment. For beta-blockers and statins, there were two patient populations: all ages, and patients aged 66 years and older. For each of the three treatments, for each of the four propensity score models, and for the different patient populations, we report an estimated hazard ratio along with an associated 95% confidence interval. On each panel, we have superimposed a vertical line denoting a null effect.
Estimates of effect in AMI patients.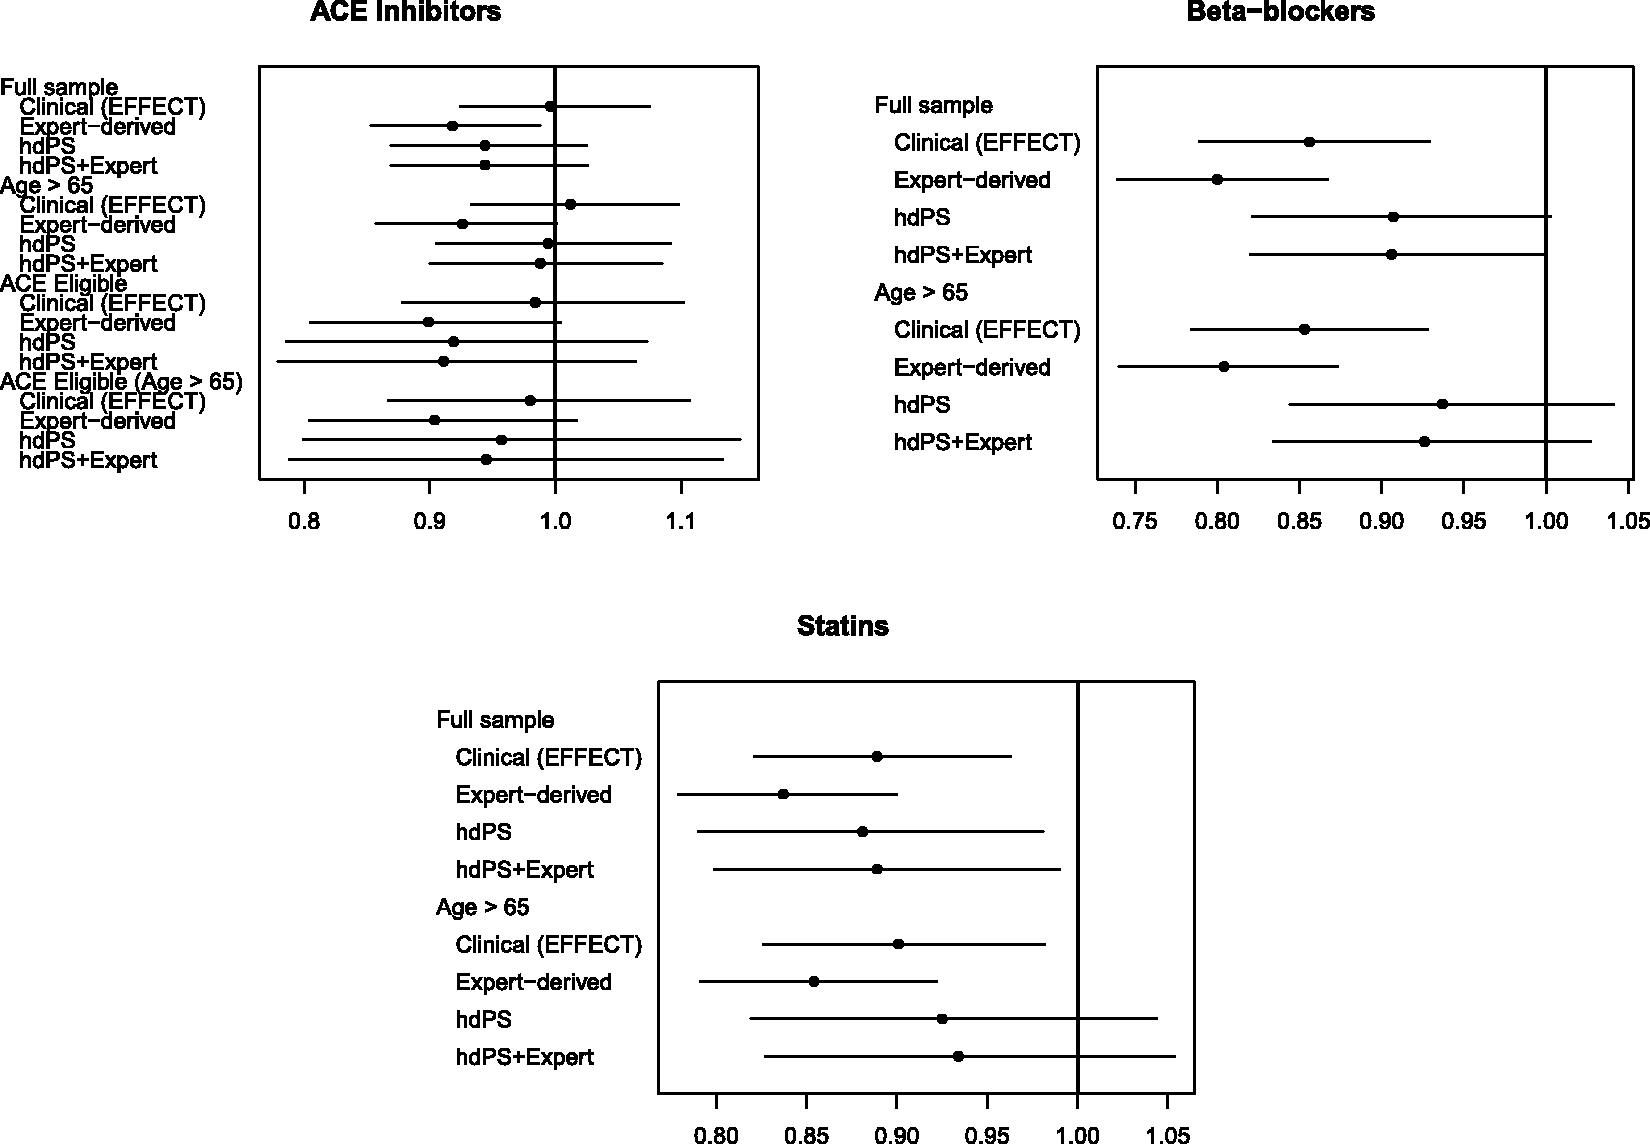
In comparing estimated treatment effects between the different propensity scores, our focus is on comparing the point estimates of the treatment hazard ratio. There are three reasons for this. First, clinical readers frequently focus on the point estimate as the most likely value of the treatment effect. Second, interpretations about the magnitude of risks and benefits are often based on the point estimate. Third, our focus on comparing point estimates reflects what has been done in prior studies that compared estimates obtained using the hdPS with estimates obtained using pre-specified propensity score models derived from administrative data.4,18
For ACE inhibitors in patients with AMI, in the overall population, the estimated hazard ratios derived from the two models that incorporated the hdPS lay between the hazard ratio derived from the clinical propensity score model and the hazard ratio obtained from the administrative expert-selected propensity score model (but were closer to that of the administrative expert-selected propensity score). However, in patients aged 66 years and older, the hazard ratios obtained using the two models that incorporated the hdPS were similar to that obtained using the clinical propensity score model. When restricted to the sample consisting of those patients who were eligible for ACE inhibitors, the three hazard ratios derived from administrative data were similar to one another and differed from that obtained using the clinical propensity score model. In elderly patients eligible for ACE inhibitors, results similar to those in the entire patient population were observed.
For beta-blockers in patients with AMI, the estimated hazard ratio from the hdPS model and the hdPS + expert-selected model were qualitatively different from those of the clinical propensity score and the administrative expert-selected propensity score model for both patient populations (all ages and those aged 66 years and older). In both patient populations, estimates derived from the hdPS model and the hdPS + expert-selected model were not statistically significantly different from the null hazard ratio, while estimates derived from the other two propensity score models were statistically significantly different from the null hazard ratio. The hazard ratio obtained using the clinical propensity score model was approximately halfway between those obtained using the administrative expert-selected propensity score model and those obtained using the hdPS.
For statins in patients with AMI, the hazard ratios obtained using the hdPS algorithm were closer to those obtained using the clinical propensity score than were those obtained using the administrative expert-selected propensity score model. However, in the elderly population, the hazard ratios obtained using the hdPS were not statistically significantly different from the null, while those obtained using other methods were statistically significantly different from the null.
As noted above, our interpretation of differences between the different effect estimates is based on the estimated hazard ratios. It should be noted that in each of the different patient populations, the 95% confidence intervals for the four estimated hazard ratios overlapped with one another.
4.2 CHF sample
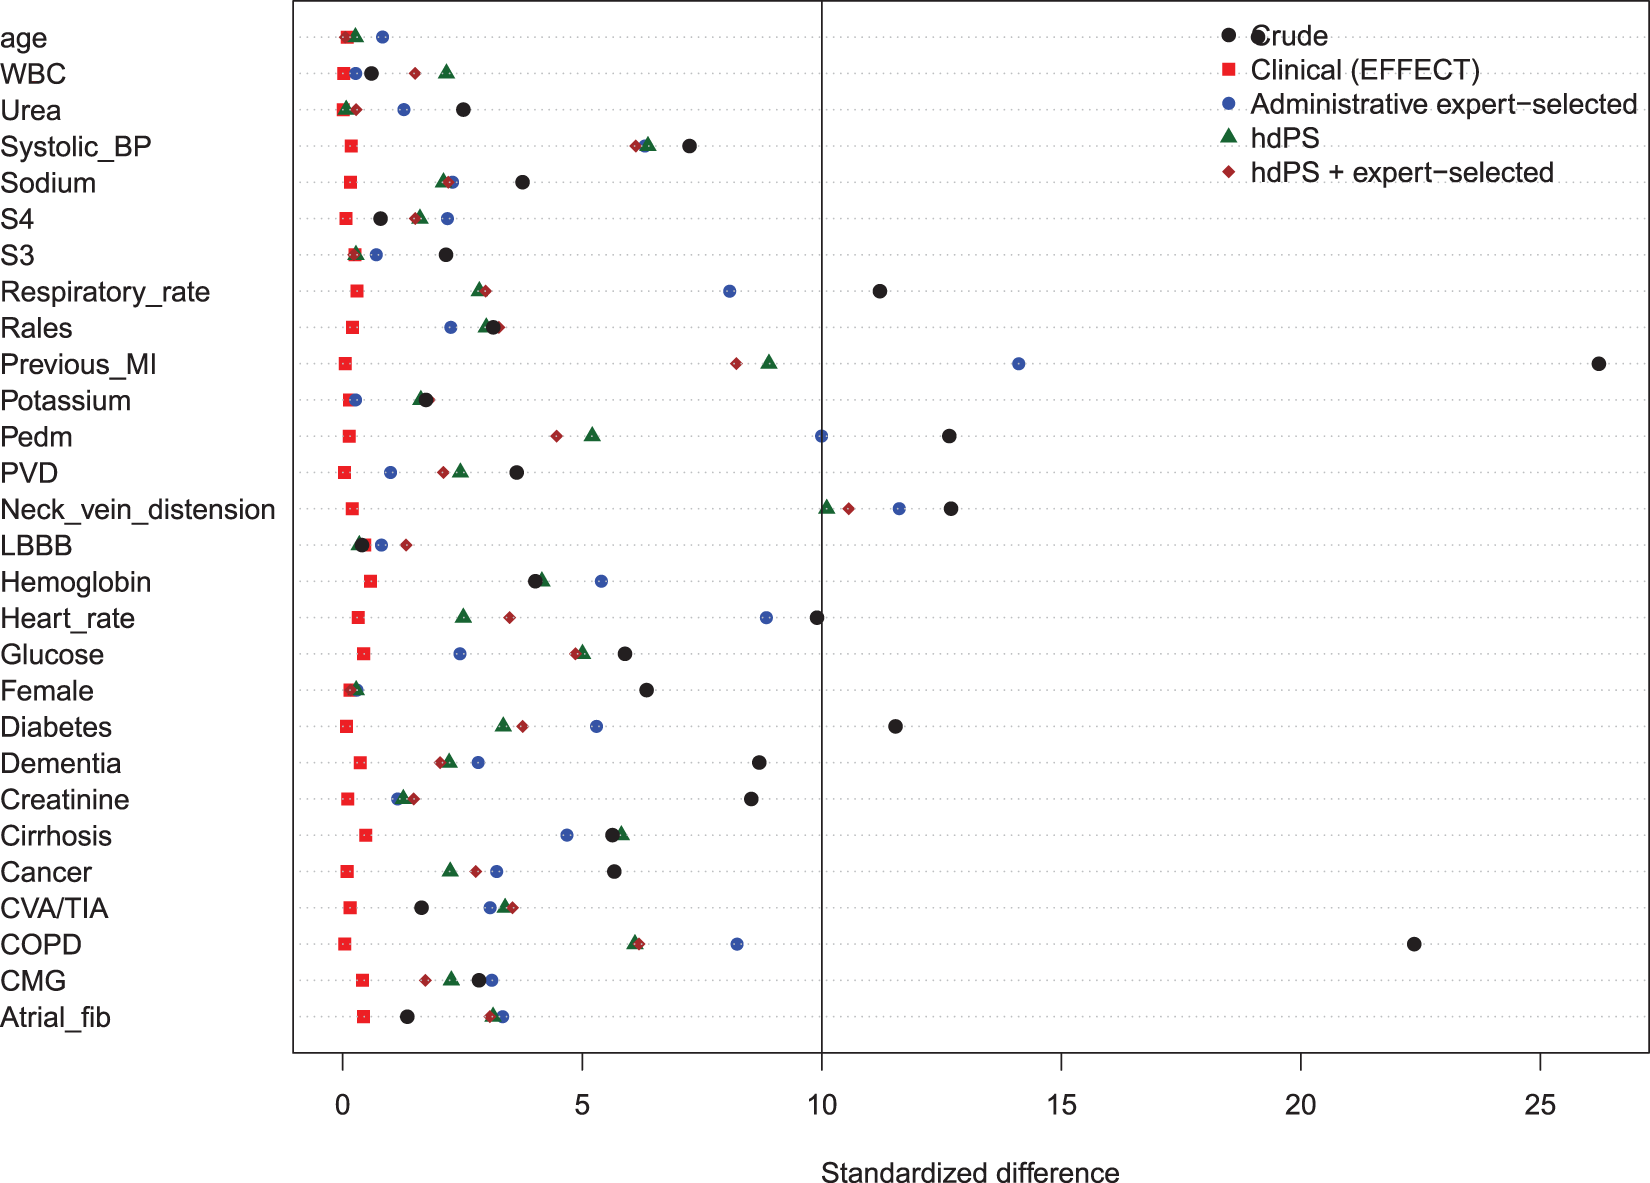
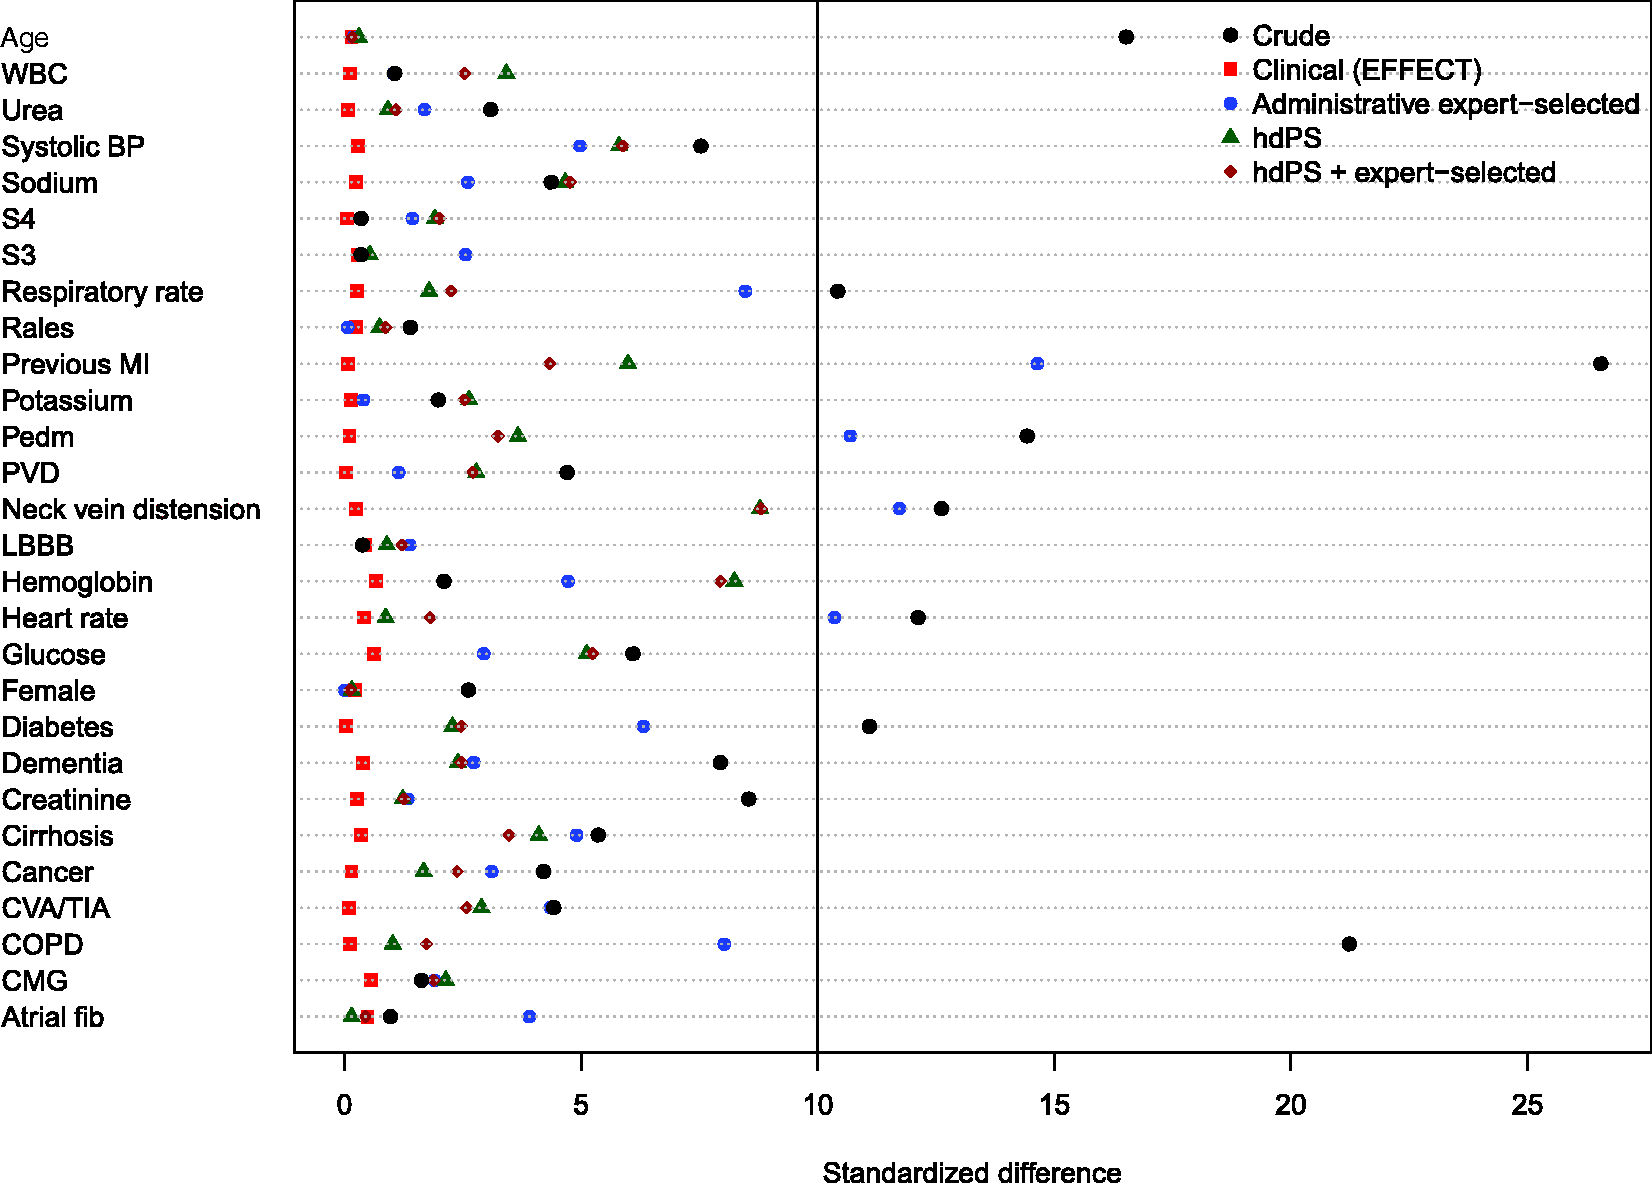
Balance of the clinical variables (measured in the EFFECT dataset) between treated and control subjects after weighting using the different propensity scores are reported in Figures 8 to 11. There are two figures for each drug (ACE inhibitors and beta-blockers)—one for balance in the overall sample when four dimensions were used for the hdPS algorithm and one for balance in the sample of those over the age of 66 years when five dimensions were used for the hdPS algorithm. In all four figures, weighting using the clinical propensity score derived from the EFFECT data resulted in all of the EFFECT covariates being balanced between treatment groups. In each of the four figures, there was at least one clinical variable which remained imbalanced after weighting using the expert-derived propensity score derived from administrative data. Similarly, in each of the four figures, there was at least one clinical variable which remained imbalanced after weighting using the hdPS derived from administrative data. Importantly, none of the propensity scores derived from administrative data balanced all of the clinical variables measured in the EFFECT database. The numeric values of the standardized differences that are reported in Figures 8 to 11 are reported in Tables 7 to 10 in the online appendix.
Balance between ACE inhibitor groups (CHF: full sample). Balance between ACE inhibitor groups (CHF: > 66 years). Balance between beta-blocker groups (CHF: full sample). Balance between beta-blocker groups (CHF: > 66 years).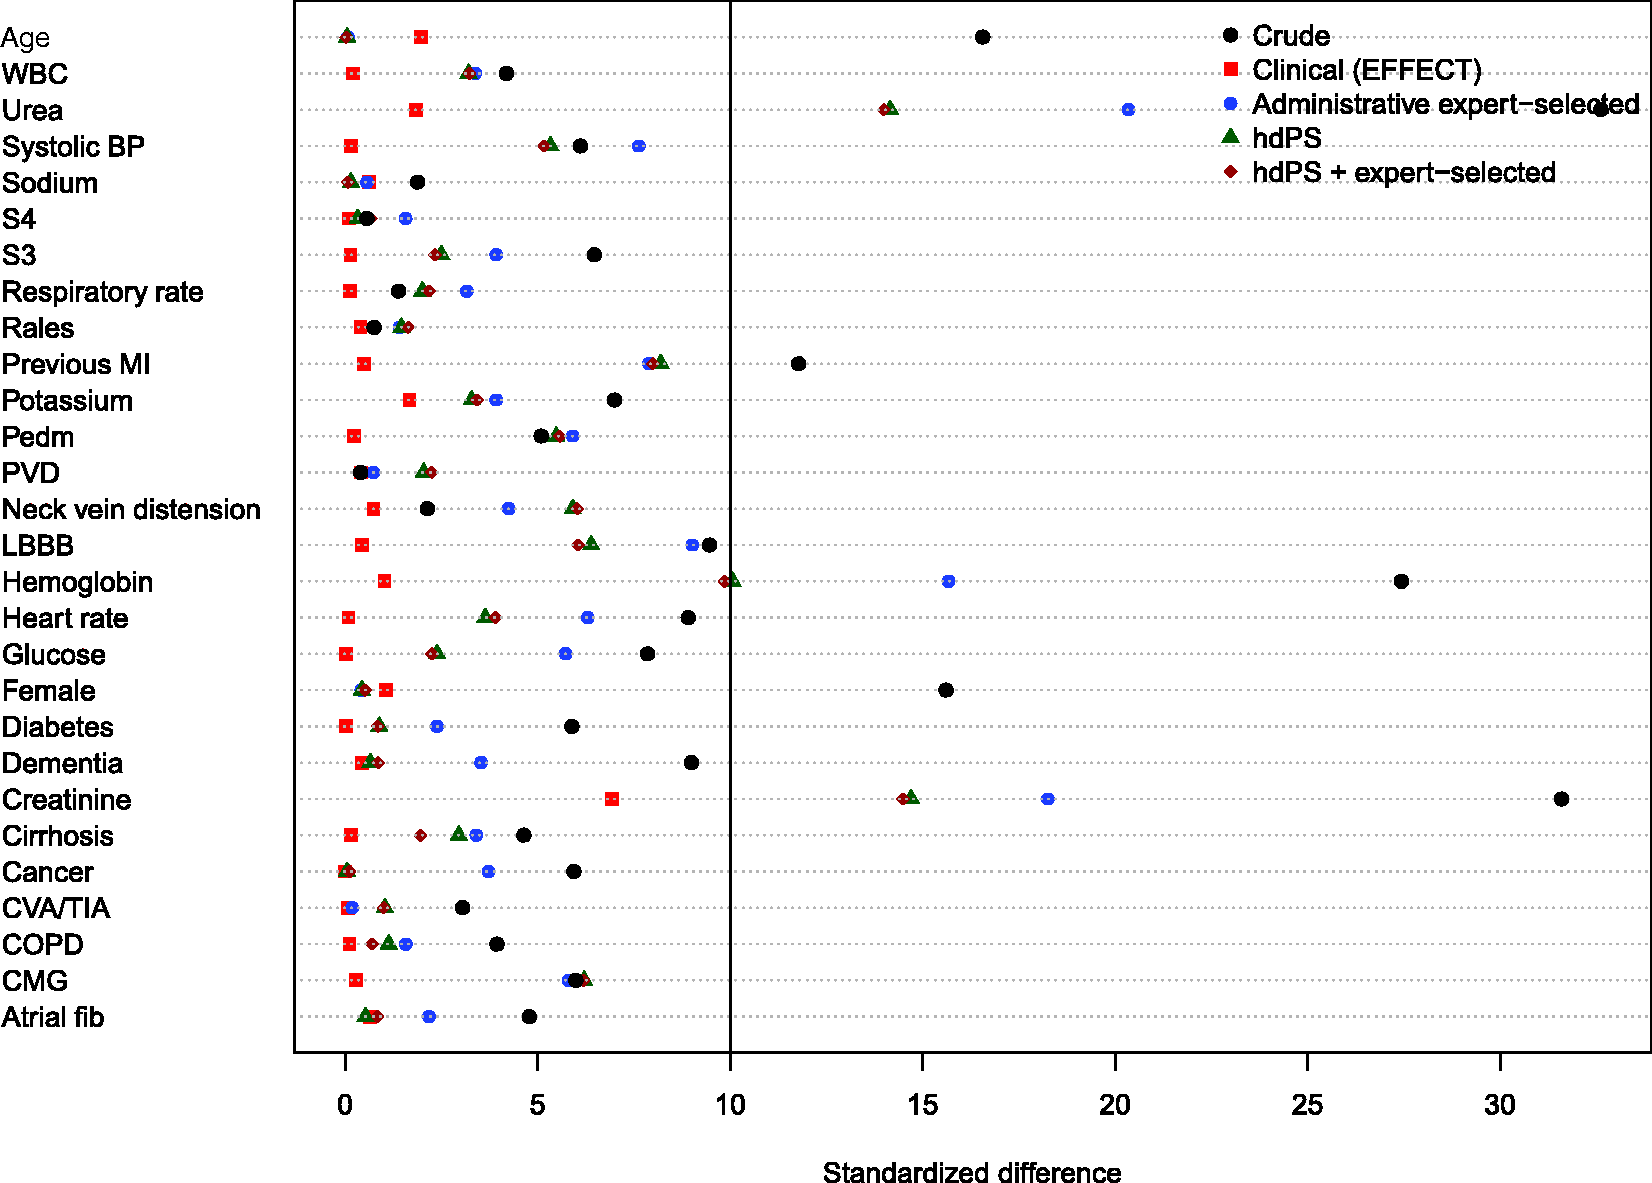
The hazard ratios for the effect of ACE inhibitors (left panel) and beta-blockers (right panel) on mortality in patients hospitalized with CHF are reported in Figure 12. For each of the two treatments, each of the four propensity score models, and for the different samples (all ages, age 66 years and older, patients eligible for the treatment, and elderly patients eligible for the treatment), we report an estimated hazard ratio along with an associated 95% confidence interval.
Estimates of effect in CHF patients.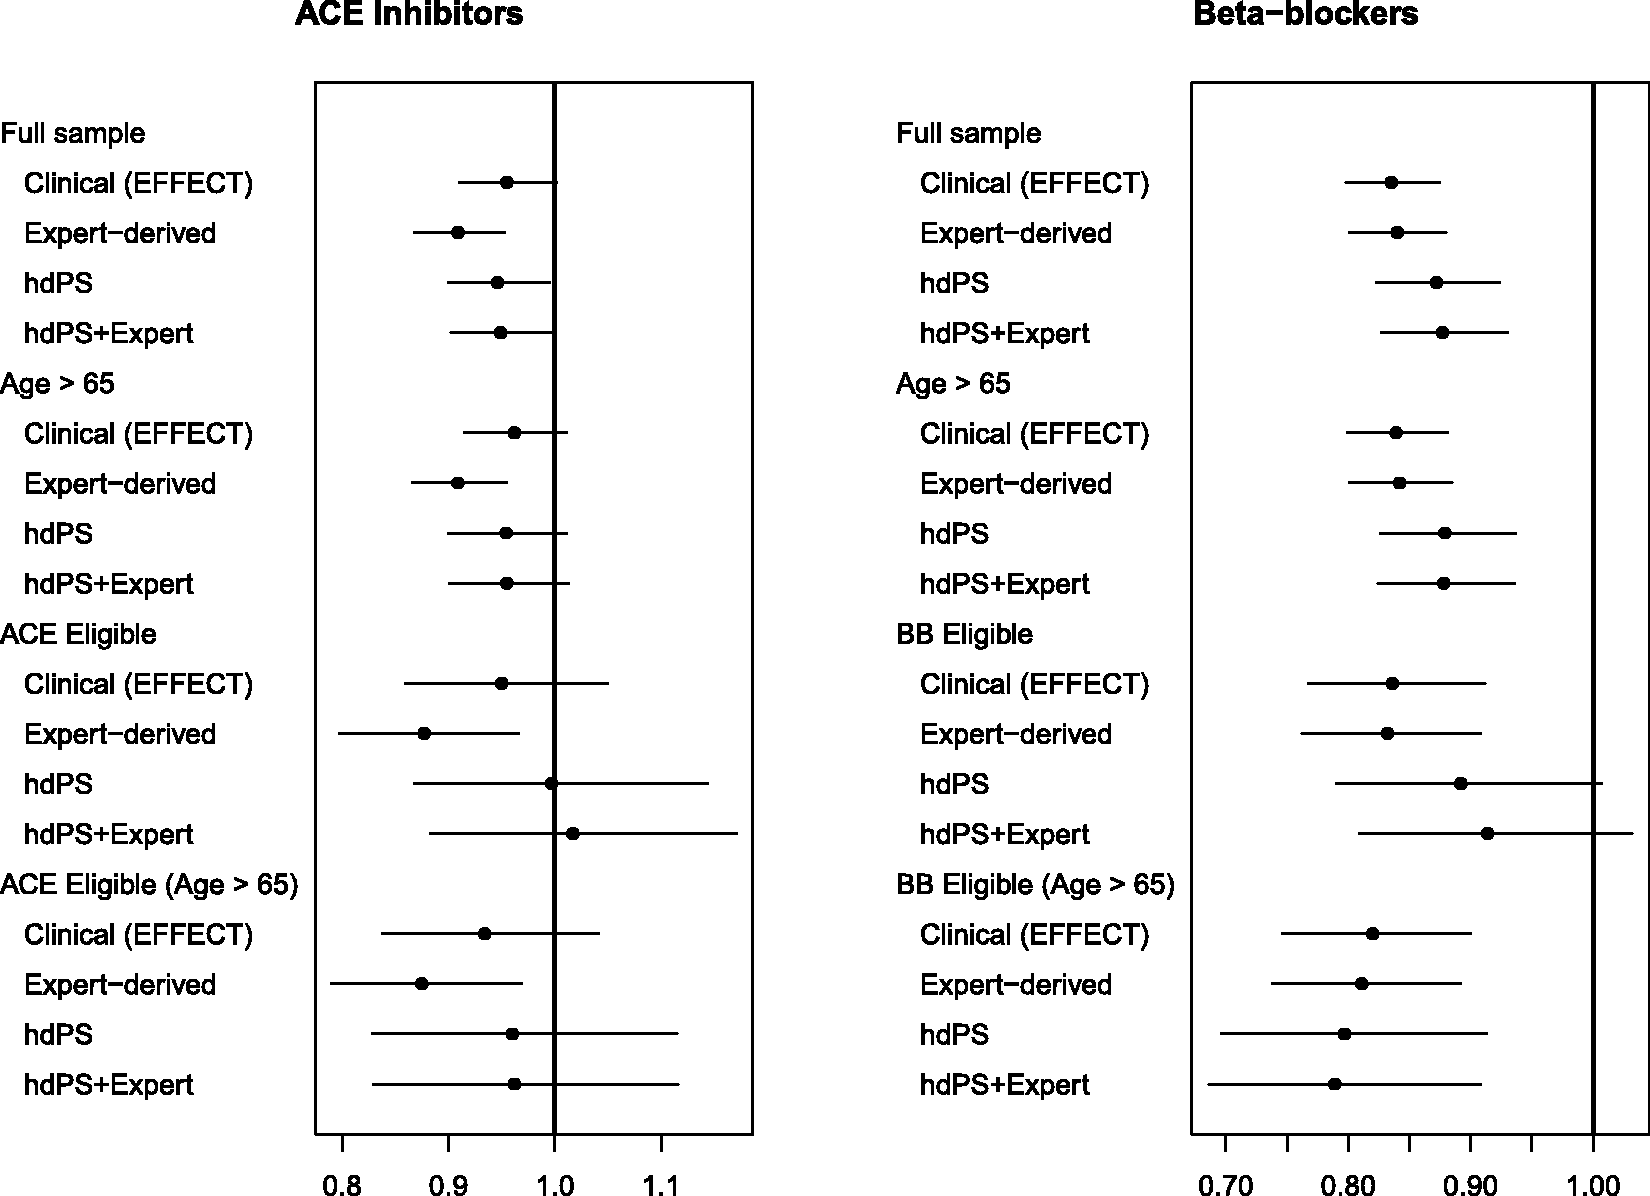
For ACE inhibitors in patients with CHF, the estimated hazard ratios for the hdPS and hdPS + expert-selected propensity score models were closer to the hazard ratio obtained using the clinical propensity score than was the hazard ratio obtained using the administrative expert-selected propensity score model; however, differences between the administrative expert-selected propensity score and the hdPS were attenuated when the sample was restricted to those patients eligible for ACE inhibitors.
For the effect of beta-blockers in patients with heart failure, the opposite was observed, with a qualitatively different picture emerging. For all four patient populations, the estimated hazard ratio from the administrative expert-selected propensity score model was very similar to that obtained using the clinical propensity score model. In contrast to this, the hazard ratios obtained using the hdPS model and the hdPS + expert-selected model were further from the hazard ratio obtained using the clinical propensity score model.
As in the AMI sample, it should be noted that in all four patient populations, the 95% confidence intervals for the four estimated hazard ratios overlapped with one another. Our interpretation of differences between the different effect estimates is based on the estimated hazard ratio.
5 Discussion
We compared the performance of propensity scores derived from administrative healthcare databases using the hdPS algorithm with the performance of propensity scores containing pre-specified covariates available in administrative databases that were identified by subject-matter experts. We compared the ability of these different propensity scores to balance clinically-important variables that were not recorded in administrative data and the ability to estimate treatment effects that were similar to those obtained after adjustment for clinical variables. We considered two different samples of patients (those with AMI and those with CHF) and two or three different exposures in each sample. The observation that was consistent across both disease groups and across the different exposures was that none of the propensity scores derived from administrative data were able to balance all of the clinical variables that were not recorded in administrative data. Results were inconsistent as to which of the two propensity scores derived from administrative data produced estimates of treatment effects most comparable to those obtained when using a propensity score that incorporated clinical variables. For some settings (e.g., use of ACE inhibitors in patients with CHF), hazard ratios obtained using the hdPS were very similar to those obtained when clinical variables were incorporated in the propensity score model. In other settings (e.g., use of beta-blockers in patients with CHF), hazard ratios obtained using variables selected from administrative data by expert opinion were much closer to the hazard ratios obtained when clinical variables than were hazard ratios obtained using the hdPS algorithm.
The hdPS algorithm has not undergone rigorous assessment of its ability to balance covariates not typically contained in administrative healthcare databases. The initial paper describing the hdPS algorithm presented three empirical case studies comparing effect estimates obtained using a pre-specified propensity score model derived from administrative data with effect estimates obtained using the hdPS algorithm. The authors found that the use of the hdPS algorithm resulted in effect estimates closer to what would be expected compared to when using a propensity score model that contained pre-specified covariates selected by the investigators. The authors acknowledged that their empirical comparisons lacked a true gold standard (p. 521). 4 The current study includes such a gold standard, as it reports the estimates of treatment effect that were obtained using high-quality clinical data.
There are a small number of studies that used empirical case studies to compare the performance of the hdPS algorithm with that of other methods for confounder control. Li et al. 19 used administrative healthcare data to compare the performance of conventional regression adjustment with conventional propensity score methods and the hdPS algorithm for estimating the effect of asthma controller medication on asthma-related adverse outcomes. All three methods used the same electronic administrative healthcare databases. The first two approaches used a pre-specified list of covariates for covariate adjustment or for inclusion in the propensity score model. The authors concluded that the three methods yielded similar results, stating that “these 3 adjustment approaches gave essentially equivalent results with no consistent differences in point estimates and highly overlapping confidence intervals” (p. 654). Guertin et al. 20 used electronic healthcare administrative databases to compare the performance of a conventional propensity score analysis using pre-specified covariates with that of the hdPS algorithm when estimating the effect of high potency versus moderate potency statins on the risk of developing diabetes. Matching on each of the estimated propensity scores induced excellent balance on 18 covariates measured in administrative data (standardized differences < 10% for all covariates). While the hdPS algorithm induced marginally better balance compared to the conventional propensity score approach, absolute differences between the two approaches were negligible (mean standardized difference of 1.5% for the conventional approach vs. mean standardized difference of 0.8% for the hdPS approach). Garbe et al. 21 used administrative healthcare databases to estimate the effect of Cox-2 inhibitors versus that of traditional nonsteroidal anti-inflammatory drugs (NSAIDs) on the risk of upper gastrointestinal complications (UGIC). The performance of a conventional propensity score approach that used 79 pre-specified covariates was compared with that of the hdPS algorithm. The relative risk for UGIC associated with Cox-2 use was 0.84 (95% CI: 0.56–1.26) using the conventional propensity score approach and ranged between 0.62 (0.43–0.91) and 0.68 (0.49–1.01) for the hdPS approach (depending on the number of empirically-derived covariates that were included). As large randomized controlled trials (RCTs) and meta-analyses of RCTs had previously demonstrated a 50% to 60% lower risk of upper gastrointestinal bleeding with Cox-2 compared to traditional NSAIDs, the authors suggested that the hdPS approach had reduced confounding to a greater degree than did the conventional propensity score approach (although the authors acknowledged that it is not clear whether the findings of the previous trials were applicable to their study population, as their observational study was less strictly controlled in terms of its composition and adherence (p. 556). Polinski et al. 18 used administrative healthcare databases to estimate the effect of Medicare Part D coverage gap entry on death and cardiovascular outcomes. The authors compared estimates obtained using a propensity score that included 52 pre-specified covariates with those obtained using the hdPS algorithm. The estimated hazard ratios for mortality comparing exposed subjects (those responsible for medication costs during the gap) with unexposed subjects (those receiving some form of financial assistance) were 1.29 (95% CI: 0.99–1.66) for the conventional propensity score analysis and 1.11 (95% CI: 0.86–1.42) for the hdPS analysis. The authors suggested that use of the hdPS resulted in estimates that were more clinically plausible, as well as being stable across sensitivity analyses. Finally, in a methodologically-oriented study, Rassen et al. 5 reanalyzed four previous pharmacoepidemiological studies. In three of the studies, estimates obtained using a propensity score with pre-specified covariates were compared with those obtained using the hdPS. The authors concluded that the hdPS performed as well or better than did the conventional propensity score approach, as the estimated effects from the former were closer to values obtained from published trials and previous observational studies. In doing so, the authors acknowledged that they had to “rely on subject matter expertise to judge whether the hd-PS-adjusted point estimates were closer to the true value of the association than was the conventionally adjusted point estimate” (p. 1411). Finally, Guertin et al. 14 compared the performance of an hdPS constructed using six dimensions (both inpatient and outpatient data sources) with that of an hdPS constructed using two dimensions (restricted to inpatient data sources). Performance was assessed by the ability to balance 18 covariates, of which 7 were derived from information present only in the outpatient data sources. While better balance was achieved when using the hdPS constructed using 6 dimensions, both models were able to balance all 18 covariates. Guertin et al. suggested that, in this specific setting, the hdPS was able to control for some unmeasured confounders. It should be noted that the “unmeasured” covariates balanced by the hdPS constructed using only two dimensions consisted of six variables related to medication use (either use of a specific medication or use of at least five different medications) or to having at least five medical outpatient visits. The ability to balance unmeasured physiological parameters (e.g., blood pressure or results of laboratory tests) was not considered. It is reasonable to assume that proxies measured using hospitalization data (e.g., diagnosis of heart failure) are more strongly correlated with binary indicators of medication use (e.g., use of loop diuretics) than with continuous physiological parameters.
A common element to all of the above studies comparing the hdPS algorithm with a pre-specified propensity score model is the lack of a true internal gold standard. When one approach was described as superior to a competing approach, the rationale for this conclusion either made reference to an external standard (i.e., results from existing RCTs) or was based on plausibility (i.e., which estimate was more plausible). Our current study is the only study in which there is a true internal gold standard with which the estimates obtained using administrative data can be compared. The developers of the hdPS algorithm have described it as identifying proxies for risk factors and clinical characteristics that are not contained in conventional administrative healthcare databases. Thus, the success of the method should be measured by two criteria: (a) the degree to which it balances these unmeasured characteristics and (b) the degree to which treatment effect estimates obtained using the hdPS are similar to those obtained using these unmeasured clinical characteristics. Using these two criteria, the hdPS approach is not uniformly superior to that of a propensity score consisting of pre-specified covariates derived from administrative data.
Rubin 22 has argued that one of the advantages to the use of propensity scores in the design and analysis of observational studies is that they permit the separation of the design of the study from the analysis of the study. This separation between design and analysis parallels the practice in the design and analysis of RCTs, in which the design phase is separated from the analysis phase. In particular, Rubin argues that the design phase of an observational study should be done blind to the study outcomes. An advantage to using baseline covariates specified by the investigator is that one can estimate the propensity score and assess covariate balance (after matching or weighting using the propensity score) without having observed the outcomes. A disadvantage to empirical covariate selection approaches that rely on observing the outcome is that they do not permit this separation. The fourth step of the hdPS procedure explicitly incorporates the outcome, by using the amount of confounding that can be explained by a given code to prioritize the codes.
An advantage to conventional propensity score methods is that they allow a transparent reporting of the degree to which matching or weighting using the propensity score has balanced measured covariates between treatment groups.15,23 The reporting of such balance diagnostics should be a key component of any propensity score analysis. 24 When the baseline covariates included in the propensity score model are selected by the investigator, it is simple to report balance diagnostics for these covariates. For instance, standardized differences can be reported for each of the included covariates. However, it is less clear how to proceed when covariates are selected using the hdPS algorithm. In their initial paper on the topic, the authors selected 500 covariates (in addition to a small set of pre-specified covariates). Reporting balance diagnostics on over 500 covariates is not a trivial task, and most journals do not provide space for a table with over 500 rows. Furthermore, since the covariates have been selected by an automated process, the relationship of the derived covariate with the outcome may not be immediately evident to some readers.
There is a subtle temptation faced by readers of papers that employed automated confounder identification algorithms. Due to the large number of empirical covariates that are typically selected for inclusion in the propensity score model, it is difficult to convey to the reader which covariates were used for confounder adjustment. When trying to judge the quality of confounder adjustment that was done, the reader is faced with the temptation of assuming that, because a complex automated algorithm was used, adequate control of confounding may have been achieved. Because of the opaqueness of the process (from the readers' perspective), there is a subtle temptation to assume that a greater degree of confounding was removed than may have been the case. Guertin et al. 20 suggest that an advantage of the hdPS approach is that it has the “potential to identify confounders which are unknown to the investigators” (p. 8). We would suggest that in many settings, it is not the confounders which are unknown to investigators that may be responsible for the greatest degree of unmeasured confounding. Rather, it may be the confounders which are known to the investigators but not measured in administrative data. For example, in cardiovascular research, physiological parameters (e.g., blood pressure), results of laboratory tests (e.g., cholesterol levels), smoking status, family history of heart disease, and disease anatomy are known confounding factors; however, these variables are rarely measured in conventional administrative databases. In many settings, it may be the inability to control for known but unmeasured confounding factors that is of greater concern rather than the inability to control for unknown and unmeasured confounding factors.
Control of confounding is a critical component of observational research. The ability to account for systematic differences in the distribution of baseline covariates between treatment groups is essential to obtaining accurate estimates of the safety and efficacy of treatments and interventions. The developers of the hdPS algorithm are to be lauded for their recognition of the importance of addressing confounding when using administrative data for research purposes. Their work reminds investigators and analysts that thinking about confounding and study design is as important as thinking about the statistical methods that will be employed to estimate treatment effects.
In the current study, we compared effect estimates obtained using administrative data (either using the hdPS algorithm or the expert-selected variables) with effect estimates obtained using high-quality clinical data. It is possible that the effect estimates obtained using high-quality clinical data are affected by residual confounding. In empirical studies such as these, the true value of the effect size is not known. Thus, we are unable to compare the different estimated effects with the true effect size. However, this was not the objective of the current study. It has been suggested that the hdPS algorithm permits adjustment by proxy, with the empirically-derived covariates serving as proxies for unmeasured confounding variables.4,5 Furthermore, it has been suggested that “if we could measure a battery of proxies, we would increase the likelihood that in combination they are a good overall proxy for relevant unobserved confounding factors” 4 (p. 513). By using high-quality clinical data, we were able to collect a comprehensive set of variables that were absent from the administrative data. We were able to empirically assess whether the propensity scores derived from administrative data were able to balance these “unmeasured” confounding variables. Furthermore, we were able to compare the effects estimated using administrative data to what would have been obtained had high-quality clinical data been used. In the current study, the use of clinical data was considered as the gold standard against which other methods of adjustment were compared. This is appropriate given the stated objective of the hdPS, which is to attempt to balance covariates that are not measured in administrative data. Note that the current analyses are not intended to address the question of whether the treatment effects estimated using clinical data are adequate estimates of effect. That question is beyond the scope of the current study.
The current study had a specific focus: can propensity scores derived using the hdPS algorithm balance clinical variables that are not present in administrative data and produce effect estimates comparable to those obtained using high-quality clinical data. Our results should not be construed as suggesting that it is not possible to balance clinical characteristics using some high-dimensional technique. This broader question is beyond the scope of the current study, which had a focus on one particular high-dimensional representation of administrative data.
In the current study, we examined the ability of the hdPS, derived using administrative data, to balance clinical covariates not measured in administrative data. We also examined the ability of the hdPS to produce estimates of treatment effect comparable to those obtained after adjustment for an extensive set of clinical covariates. An interesting question is whether, in settings in which both administrative and clinical data are available, the clinical variables should be used in combination with variables constructed using the hdPS algorithm. The stated intent of the hdPS algorithm is that it permits adjustment by proxy. One is trying to create a large set of proxy covariates that permit the analyst to adjust for those variables that one has not measured. Based on this motivation, it would seem redundant to include these proxy covariates when the desired clinical covariates are available. From an analytic perspective, it would be difficult to assess the benefit of combining the clinical covariates and the hdPS variables, since one would now require a new gold standard to which the use of the combined set of variables would be compared.
The current study was not intended be exhaustive, nor was it intended to provide mathematical proof that comorbidities identified using administrative data will never balance clinical characteristics not present in administrative data (indeed, we would suggest that such a proof is not possible). Instead, we examined the performance of different propensity scores derived using administrative data in a series of empirical case studies. Based on the results obtained in this series of empirical case studies, we summarize our conclusions as follows: (a) propensity scores estimated using administrative data, when either the hdPS algorithm was used to derive variables for inclusion in the propensity score model or expert opinion was used to identify variables for inclusion, may not balance all of the available clinical variables that are not present in administrative data; (b) in some scenarios, treatment effects obtained using the hdPS algorithm will be similar to estimates obtained after adjustment for detailed clinical data; (c) in some scenarios, treatment effects obtained using the hdPS algorithm will be different from estimates obtained after adjustment for detailed clinical data; (d) in some scenarios, treatment effects obtained using the variables selected from administrative data using expert opinion will be similar to estimates obtained after adjustment for detailed clinical data; (e) in some scenarios, treatment effects obtained using the variables selected from administrative data using expert opinion will be different from estimates obtained after adjustment for detailed clinical data; (f) in some scenarios, the use of the hdPS will result in estimates of treatment effect that are closer to those that would have been observed had adjustment for clinical covariates been possible, compared to when expert opinion was used to select the variables for the propensity score model; (g) in some scenarios, the use of the expert opinion to select the variables for the propensity score model will result in estimates of treatment effect that are closer to those that would have been observed had adjustment for clinical covariates been possible, compared to when the hdPS was used to select the variables for the propensity score model; (h) in the absence of clinical data, investigators will not be able to determine to which scenario their study belongs.
As noted in the Introduction, the hdPS has been described as permitting “adjustment by proxy.” The anticipated outcome of adjusting for a large number of empirically-derived covariates is that the analyst will have been able to account for confounding due to unmeasured variables. Our series of empirical analyses demonstrated that for both disease groups (AMI and CHF) and for the three treatments (ACE inhibitors, beta-blockers, and statins), there were always some “unmeasured” clinical variables that were not balanced by the application of the hdPS algorithm. In terms of estimating treatment effects, the success of this procedure varied across samples and treatments/exposures. For some samples and exposures, the use of the hdPS algorithm resulted in estimates of effect that were very similar to those obtained after adjustment for high-quality clinical data. For other samples and exposures, the use of the hdPS algorithm resulted in qualitatively different conclusions than were obtained after adjustment for high-quality clinical data. In some of these settings, using a pre-specified set of covariates in the propensity score model produced estimates much more similar to those obtained using high-quality clinical data.
Supplemental Material
Supplemental material for Comparing the high-dimensional propensity score for use with administrative data with propensity scores derived from high-quality clinical data
Supplemental Material for Comparing the high-dimensional propensity score for use with administrative data with propensity scores derived from high-quality clinical data by Peter C Austin, C Fangyun Wu, Douglas S Lee and Jack V Tu in Statistical Methods in Medical Research
Footnotes
Acknowledgements
The datasets used for this study were held securely in a linked, de-identified form and analyzed at ICES. Parts of this material are based on data and/or information compiled and provided by CIHI. However, the analyses, conclusions, opinions, and statements expressed in the material are those of the authors and not necessarily those of CIHI. We thank IMS Brogan Inc. for use of their Drug Information Database.
Declaration of conflicting interests
The author(s) declared no potential conflicts of interest with respect to the research, authorship, and/or publication of this article.
Funding
The author(s) disclosed receipt of the following financial support for the research, authorship, and/or publication of this article: This study was supported by ICES, which is funded by an annual grant from the Ontario MOHLTC. The opinions, results, and conclusions reported in this paper are those of the authors and are independent from the funding sources. No endorsement by ICES or the Ontario MOHLTC is intended or should be inferred. This research was supported by operating grant from the Canadian Institutes of Health Research (CIHR) (MOP 86508). Drs Austin and Lee are supported in part by Mid-Career Investigator Awards from the Heart and Stroke Foundation. Dr. Lee is supported by the Ted Rogers Chair in Heart Function Outcomes. The EFFECT data used in the study was funded by a CIHR Team Grant in Cardiovascular Outcomes Research (grant numbers CTP79847 and CRT43823).
Supplemental material
Supplementary material is available for this article online.
References
Supplementary Material
Please find the following supplemental material available below.
For Open Access articles published under a Creative Commons License, all supplemental material carries the same license as the article it is associated with.
For non-Open Access articles published, all supplemental material carries a non-exclusive license, and permission requests for re-use of supplemental material or any part of supplemental material shall be sent directly to the copyright owner as specified in the copyright notice associated with the article.