
Abstract
Receiver operating characteristic analysis is widely used for evaluating diagnostic systems. Recent studies have shown that estimating an area under receiver operating characteristic curve with standard cross-validation methods suffers from a large bias. The leave-pair-out cross-validation has been shown to correct this bias. However, while leave-pair-out produces an almost unbiased estimate of area under receiver operating characteristic curve, it does not provide a ranking of the data needed for plotting and analyzing the receiver operating characteristic curve. In this study, we propose a new method called tournament leave-pair-out cross-validation. This method extends leave-pair-out by creating a tournament from pair comparisons to produce a ranking for the data. Tournament leave-pair-out preserves the advantage of leave-pair-out for estimating area under receiver operating characteristic curve, while it also allows performing receiver operating characteristic analyses. We have shown using both synthetic and real-world data that tournament leave-pair-out is as reliable as leave-pair-out for area under receiver operating characteristic curve estimation and confirmed the bias in leave-one-out cross-validation on low-dimensional data. As a case study on receiver operating characteristic analysis, we also evaluate how reliably sensitivity and specificity can be estimated from tournament leave-pair-out receiver operating characteristic curves.
Keywords
1 Introduction
Diagnostic systems, such as binary classifiers, are used to predict outcomes that support decision making. In medicine, these systems help prognosis by predicting outcomes such as healthy or disease, follow-up treatment response or anticipated relapse. Diagnostic systems are usually built from data that combine events, test results and variables with the objective of discriminating between two alternatives. Often the quality of data used to generate a system is uncertain, affecting its accuracy. Hence, a good assessment of the system degree of accuracy is crucial. 1
To evaluate the discrimination ability of a binary classifier, the receiver operating characteristic (ROC) analysis is a popular approach. It allows visualizing, comparing and selecting classifiers based on their performance. The ROC curve depicts the performance of a classifier across various decision thresholds, while the area under the ROC curve (AUC) quantifies the classification error. The AUC value can be interpreted as the probability of the classifier ranking a randomly chosen positive unit (e.g. diseased subject or case) higher than a randomly chosen negative unit (e.g. healthy subject or control). 2 In contrast to many other performance measures, AUC is invariant to skewed class distribution and unequal classification error costs. 3
In medical studies, classifiers are usually obtained from data sets where variables are measured from relatively small numbers of sample units and the classes are often highly imbalanced. These data sets are challenging when training and testing classifiers and ROC analysis must be used with caution in this scenario. 4 Ideally, the performance of a classifier should be evaluated on independent data (i.e. data not used for training the classifier). In practice, large enough independent data may not be available or cannot be spared when building the classifier. Therefore, in many cases, cross-validation methods such as leave-one-out (LOO) and K-fold are used to estimate the performance of a classifier. However, several experimental studies have shown that LOO and many other cross-validation methods are biased for AUC estimation. This bias is caused by the pooling procedure, where predictions from different rounds of cross-validation are pooled together in order to compute the ROC curve and AUC. The pooling thus violates the basic assumption that the predictions are made by a single classifier, often leading to systematic biases.5–9 As an alternative, a leave-pair-out (LPO) cross-validation that results in an almost unbiased AUC estimation was proposed and tested. 7 Moreover, a study that used real-world clinical data sets also examined LPO and confirmed it being a reliable cross-validation method for estimating AUC. 9 However, LPO only produces AUC estimate without providing the ranking of the data needed for performing full ROC analysis.
In this study, we propose a variant of LPO cross-validation, the tournament leave-pair-out (TLPO) cross-validation. TLPO constructs a tournament from paired comparisons obtained by carrying out LPO cross-validation over all sample unit pairs. The ROC analysis can be then subsequently carried out on the scores determined by the tournament.10,11 In the literature, it is shown that such tournament scores are guaranteed to produce a good ranking for the data (see e.g. Coppersmith et al. 12 for a formal analysis and proof). Furthermore, through experiments on both synthetic and real medical data, we evaluate LOO, LPO, and TLPO AUC estimates from two well-established classification methods: ridge regression and k-nearest neighbors (KNN). The experimental results show that the TLPO is as reliable as LPO for estimating AUC, while enabling full ROC analysis.
2 Preliminaries
ROC analysis is commonly used to assess the accuracy of classifiers that produce real-valued outputs. We assume a set of m sample units, divided into the so-called positive and negative classes. In a typical application, the sample units would correspond to patients and the classes to absence or presence of a certain disease. We denote by
Let
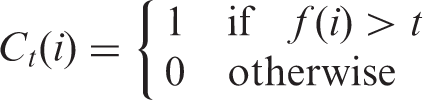
The classification performance of Ct is often evaluated by measuring the true positive rate (TPR), also known as sensitivity or probability of detection, and the false positive rate (FPR) as t is varied. Formally, these are defined as the probabilities of a positive unit getting correctly identified as positive and a non-positive unit getting wrongly identified as positive, that is

These can be considered either as empirical estimates on finite samples or as the actual probabilities on the population level, e.g. on all future observations by letting
The ROC curve plots the TPR versus FPR of a classifier for all possible values of t. A curve that represents a perfect classifier is the one with a right angle at (0, 1), which means that there is a t that perfectly separates positive units from negative ones. Likewise, a classifier that makes random predictions is represented by a diagonal line from (0, 0) to (1, 1). The area under the curve or AUC is the metric that quantifies the performance of the classifier independently of t. A perfect classifier has AUC of 1.0, while a classifier that makes random predictions or predicts a constant value has AUC of 0.5.
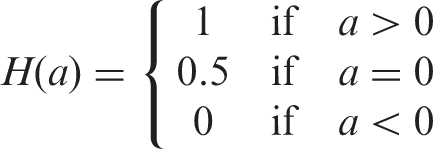
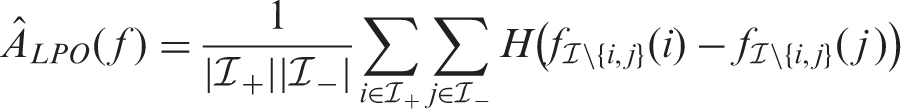
There are different approaches for computing the AUC.2,4,13 A common approach is to plot the ROC curve by connecting the points (TPR, FPR) with straight lines and then estimating the AUC using the trapezoid rule. An equivalent way is through Wilcoxon-Mann-Whitney (WMW) statistic,
14
which consists of making all possible comparisons between pairs of positive and negative units and scoring each comparison according to the Heaviside step function. Then, the WMW statistic can be computed on a finite sample

Performing ROC analysis of machine learning-based classifiers is simple when having access to large amounts of data. The prediction function is learned from a training set, and the ROC curve and AUC are computed on an independent test set. Usually in small sample settings, a separate test set cannot be afforded. Testing a prediction function directly on the same data it was learned from (i.e. resubstitution) leads to highly overoptimistic results. Rather, methods such as bootstrapping and cross-validation are used in order to provide reliable performance estimates in small sample settings.
Bootstrapping methods, such as the one described by Harrell et al. 15 or the .632 16 and .632+17 estimates, allow adjusting the optimistic bias present in the resubstitution estimate. It consists of estimating the amount of bias by using a large number of bootstrap samples drawn with replacement from the original sample and correcting the resubstitution estimate accordingly. Bootstrap methods may be expected to provide reliable performance estimates when using classical statistical approaches, such as generalized linear models, with modest amount of features. However, they are known to be vulnerable to overoptimism when high-dimensional data or complex non-linear models are used. This is because they are partly based on the resubstitution estimate, which can become arbitrarily biased when using flexible enough models that can always be fitted to predict their own training data almost perfectly, such as the KNN method. Previously, Kohavi 18 and Smith et al. 9 have experimentally confirmed the optimistic bias of bootstrap compared to cross-validation. This is further confirmed in our study by experimental results presented in the supplementary materials.
Cross-validation involves splitting the available data repeatedly into two non-overlapping parts, training and test set. The training set is used to train or build the classifier and the test set to evaluate its performance. In K-fold cross-validation, the data are split in K mutually disjoint parts (i.e. folds) of equal size. Then, in turns, each fold is held out as test data, while the rest of folds (K-1) are used to train a classifier for performing predictions on the test data. In the so-called pooled K-fold cross-validation, the predictions for all the folds are combined together, and the AUC is then computed using the combined set of predictions. In averaged K-fold cross-validation, a separate AUC is computed for each test fold, and the final AUC is the average of these fold-wise estimates. While a full ROC analysis is possible in pooled K-fold, the averaged K-fold only provides an AUC estimate. A disadvantage shared by both the pooled and averaged K-fold is that with large fold sizes they are negatively biased, because a substantial part of the training set is left out in each round of cross-validation.
In the case of LOO cross-validation, each unit constitutes its own fold, and the AUC estimate is calculated using the pooling approach. Formally, the AUC estimated by LOO is
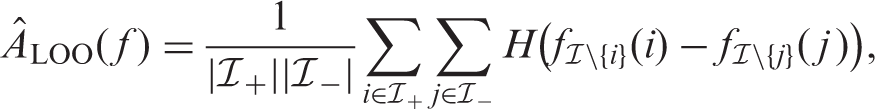
In the pooling approach, the predictions for the ith and the jth sample units may originate from different prediction functions. This may produce biased AUC estimates with unstable learning algorithms—the ones whose predictions functions undergo major changes in response to small changes in the training data.
Many learning algorithms produce prediction functions that can be decomposed into two components, that is
An analogous negative bias can also emerge, when the learning algorithms tend to produce prediction functions whose values correlate with the class proportions. 8 In addition, experiments performed on synthetic and real-data sets have shown that both pooled K-fold and LOO cross-validation estimates suffer from a high negative bias when used for AUC estimation.5,7,9 Hence, using pooling for AUC estimation is very risky as it may produce arbitrarily badly biased results.
When using averaging to estimate the AUC, as in averaged K-fold cross-validation, the negative bias caused by pooling disappears. 5 However, it has been shown that averaging leads to high variance in the AUC estimates when using small data sets. 7 Another issue in K-fold is that the value of K is constrained by the number of units in the minority class. For example, if there are more folds than positives units, the AUC for the folds without positives cannot be calculated affecting the averaged AUC.
For a more reliable AUC estimate, LPO cross-validation has been proposed.
7
This cross-validation method combines the strengths of pooling and averaging approaches. In LPO, each positive-negative pair is held as test data, and the cross-validation AUC is computed by averaging over all these pairs predictions, as in equation (2). This ensures that only pairs from the same round of cross-validation are compared, while it makes maximal use of the available training data. Formally, the LPO cross-validation estimate is defined as
3 TLPO cross-validation
In order to perform ROC analysis, we need a predicted ranking for the data set, where the sample units ranked higher are considered more likely to belong to the positive class. As indicated previously, LPO cross-validation produces an almost unbiased AUC estimate, but it does not provide such ranking. In this section, we describe the proposed TLPO cross-validation method, a variant of LPO that applies pair comparison method 10 and round robin tournament theory 11 to produce a ranking over the data set.
A tournament is a complete asymmetric directed graph, that is, a graph containing exactly one directed edge between each pair of vertices. In TLPO, we consider a round robin tournament in which the vertices correspond to sample units and the directions of the edges are obtained from a complete LPO cross-validation—where every possible pair of sample units is held out as test data at the time, including those pairs that belong to the same class. The edge connecting sample units i and j goes from the former to the latter if
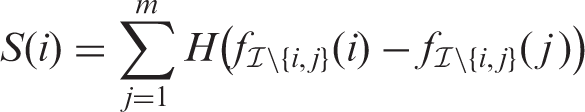
Given the tournament graph, the tournament score S(i) for the ith sample unit is computed by counting the number of outgoing edges (i.e. out-degree) in the tournament graph starting from the corresponding vertex
The TLPO ranking is generated by ordering the sample units according to their scores or number of wins. It has been shown in the literature concerning tournaments that the above considered tournament scores provide a good ranking of the data. For the theoretical results backing this claim, we refer to literature.12,19 This ranking can then be used for ROC analysis to evaluate the classifier performance, as described in the previous section. In Figure 1, we present an example of a ROC curve obtained using TLPO cross-validation on a randomly selected sample of 30 units (15 positives and 15 negatives) from the real medical data set (described in section 4.3) and an ROC curve using the rest of this data set as test data. The classification method used in this example was ridge regression.
Example of ROC curves of a classifier evaluated by tournament cross-validation (TLPO) and by a large test data set (Test). The TLPO curve was obtained from 30 random sample units (15 positives and 15 negatives) and the rest of the data was used for the Test curve. The real medical data set and ridge regression were used.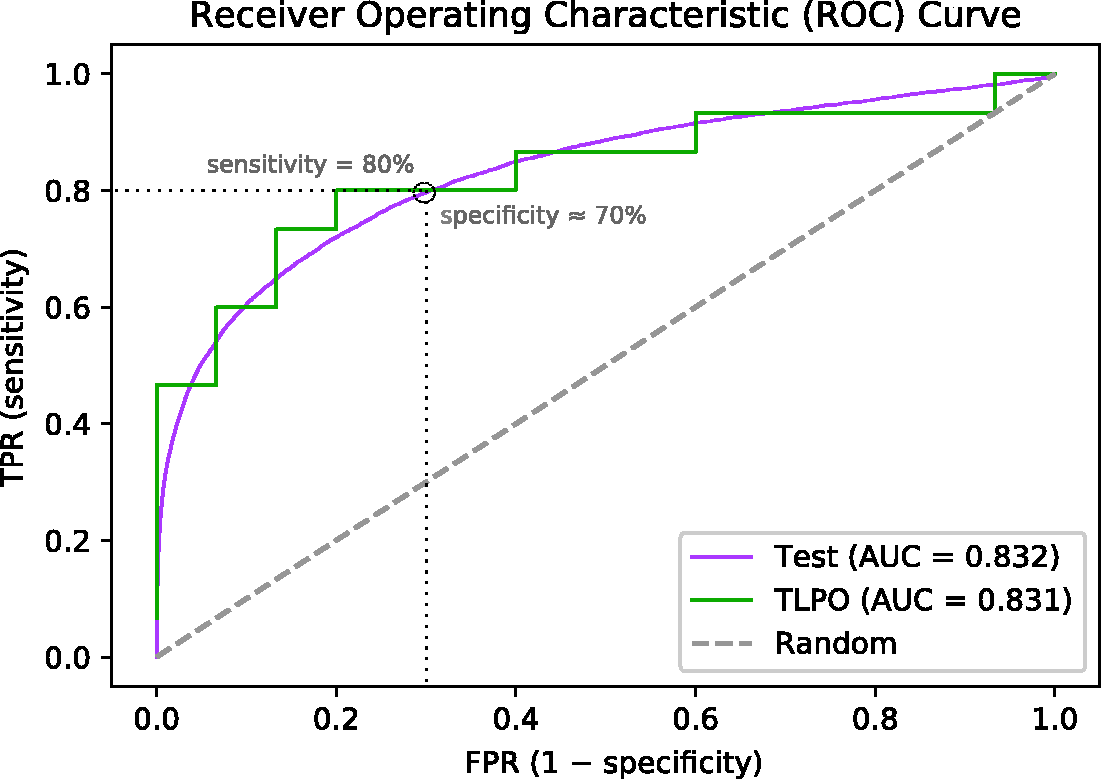
We next analyze the TLPO and compare it to the ordinary LPO. It is said that a tournament is consistent if the corresponding graph is acyclic. Otherwise, it is inconsistent, indicating that there are at least one circular triad (i.e. cyclic triple) of sample units h, i and j such that
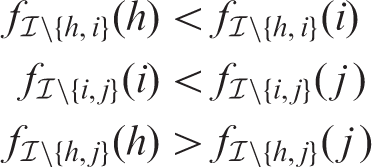
In TLPO cross-validation, this inconsistency rises when the learning algorithm is unstable on the sample. From the three above cases, we can see that the training data sets differ from each other only by a single sample; however, this is enough to make the three learned prediction functions so different from each other that a circular triad emerges.
The level of inconsistency can be measured by counting the number of circular triads in the tournament graph, as explained in literature.10,11,20 Based on the number of circular triads, a coefficient of consistency (ξ) was proposed by Kendall and Babington Smith. 10 This coefficient takes a value between 1 and 0. If ξ = 1, then the tournament has no circular triads; as the number of circular triads increases, ξ tends to zero. If ξ = 0, the tournament has as many circular triads as possible. The equations for computing number of circular triads and coefficients of consistency are provided in the supplementary material.
A typical example of a perfectly stable learning algorithm, which produces a consistent tournament, is the one that always outputs the same real valued prediction function, that is,
The instability of the learning algorithm depends on the combination of the learning algorithm and the available data. Therefore, the behavior of even the standard learning methods may drift towards one of the previous extreme examples with certain type of data.
The ordinary LPO and TLPO produce exactly the same AUC value, if the tournament in TLPO is consistent. This is obvious as a consistent tournament determines a strict total order on the sample by the edge directions and expressed by the score sequence
In the next section, the accuracy of the AUC estimated by LOO, LPO, and TLPO in different settings are presented. Moreover, through our experiments, we study to which extent inconsistencies in tournaments affect the reliability of TLPO AUC estimates.
4 Experimental study
We performed a set of experiments on synthetic and real medical data to evaluate the quality of
4.1 Classification methods
In our experiments, the classification methods used were ridge regression and KNN. These methods are widely used learning algorithms due to their simple implementation and high performance. Ridge regression is a representative example of linear and parametric methods, whereas KNN is both a non-linear and non-parametric method. Both methods have the advantage of very fast computation of cross-validation estimates, which makes running the large number of repetitions needed in the simulations computationally feasible. Previously, Airola et al. 7 compared the behavior of ridge regression and support vector machine in cross-validation-based AUC estimation and showed that the methods behaved very similarly.
Ridge regression, also known as regularized least-squares (RLS), is a method that minimizes a penalized version of the least-squared function.22,23 This method has a regularization parameter that controls the trade-off between fitting the data and model complexity. The prediction function inferred by this method can be presented in vectorized form as f(x) = wTx + b, where
KNN is perhaps the simplest and most intuitive of all nonparametric classifiers.25,26 It was originally studied by Fix and Hodges 25 and Cover and Hart, 26 and it continues to be a popular classifier. Its classification output is based on the majority votes or the average value of the k nearest neighbors. In our experiments, a weighted version of KNN was implemented using the Neighbors and the KDtree modules in the scikit-learn library. 27 The number of neighbors (k) was set to three, and the output was computed by subtracting the sum of the inverse distance of the negative neighbors from the sum of the inverse distance of the positive neighbors.
4.2 Synthetic data set
In the experiments performed on synthetic data, we generated data that reflected the following characteristics: small sample size, class imbalance, low or high dimension, and large number of irrelevant features. The sample size for training the classifier was set to 30 units. The fraction of positives and negatives units in the sample was varied between 10% and 50% in steps of 10%. We considered low-dimensional data with 10 and high-dimensional data with 1000 features. Moreover, both non-signal and signal data were considered.
In the simulations where no signal occurs in the data, sample units for both positive and negative class were drawn from a standard normal distribution. In the signal data simulations, we considered 10 features with one or four containing signal, and 1000 features with 10 or 50 containing signal. For the discriminating features, the sample units belonging to the positive class were drawn from normal distribution with 0.5 mean and variance one, while for the negative class the mean was −0.5.
The A(f) of a classifier trained on non-signal data is always 0.5, as this classifier can do neither better nor worse than random chance. In contrast, with signal data, the A(f) of a classifier trained on a given training set is not known in advance, but it can be estimated from a large test set drawn from the same distribution using equation (2). Therefore, in our signal experiments, we used a test set of 10,000 units (5000 positives and 5000 negatives) to compute A(f). Moreover, in order to obtain stable estimates, corresponding mean and variance of
Figure 2(a) presents mean Mean ΔÂ
cv
of each cross-validation method over 10,000 repetitions as class fraction balanced on (a) non-signal data (b) signal data. ΔÂ
cv
: difference between estimated and true AUC; LOO: leave-one-out; LPO: leave-pair-out; TLPO: tournament leave-pair-out; Ridge: ridge regression; KNN: k-nearest neighbors; F-signal: signal features.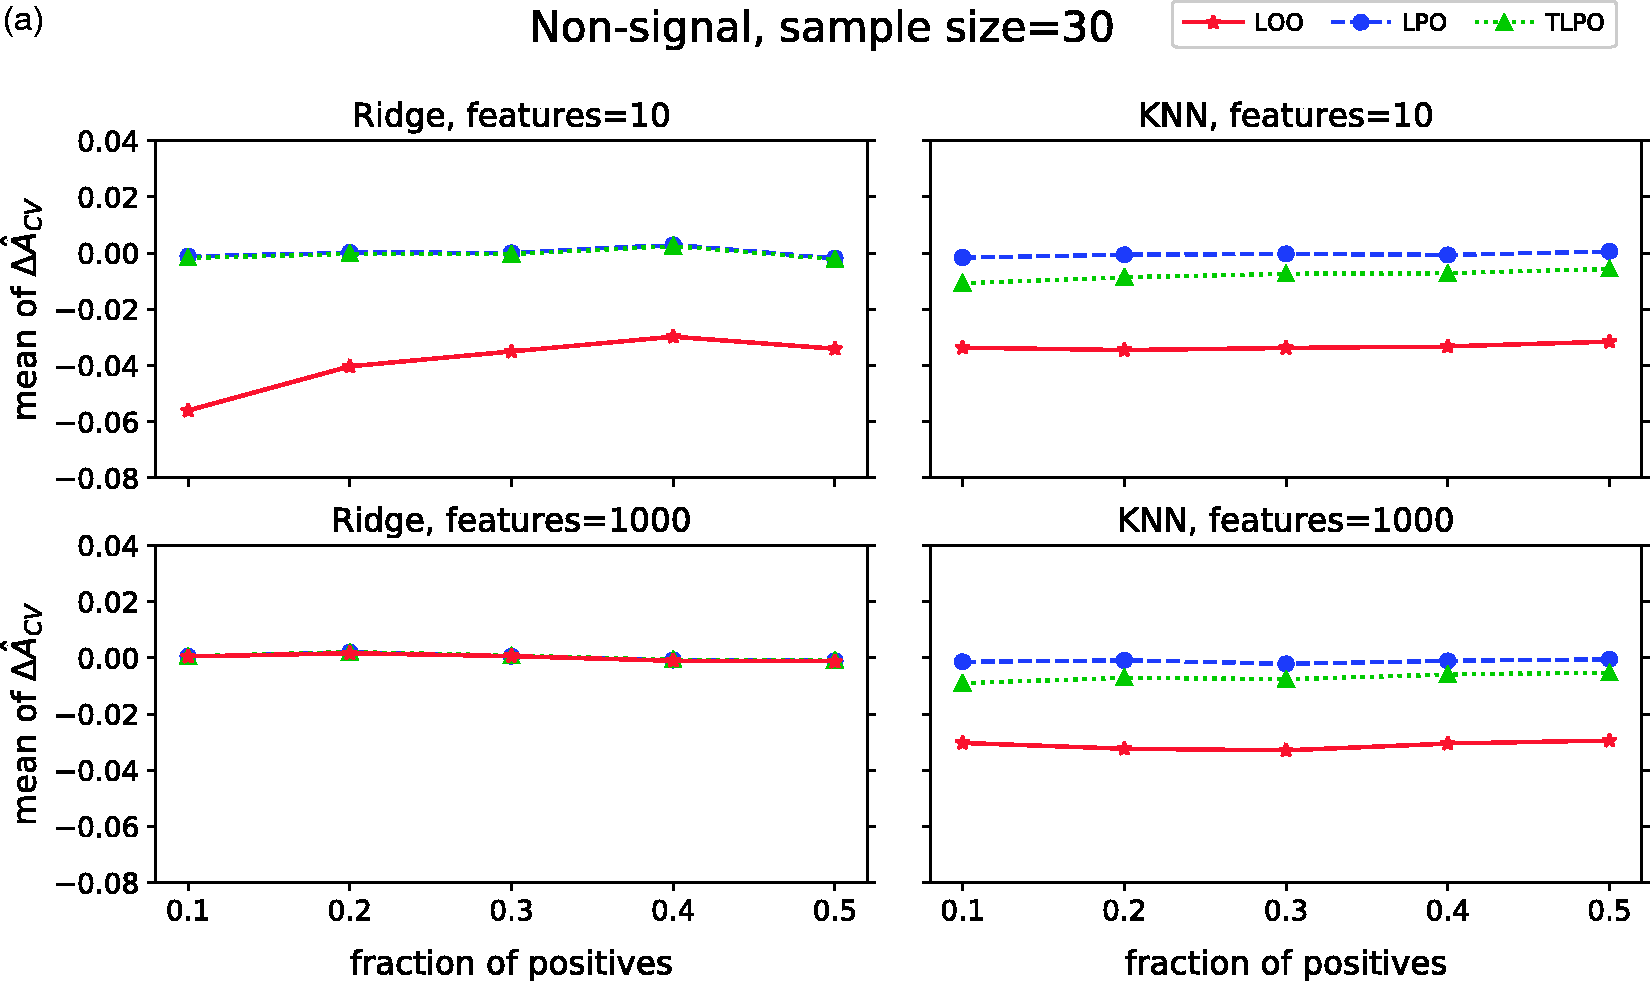
Figure 2(b) displays the mean
The variances of ΔÂ
cv
variance of each cross-validation method over 10,000 repetitions as class fraction balanced on (a) non-signal data (b) signal data. ΔÂ
cv
: difference between estimated and true AUC; LOO: leave-one-out; LPO: leave-pair-out; TLPO: tournament leave-pair-out; Ridge: ridge regression; KNN: k-nearest neighbors; F-signal: signal features.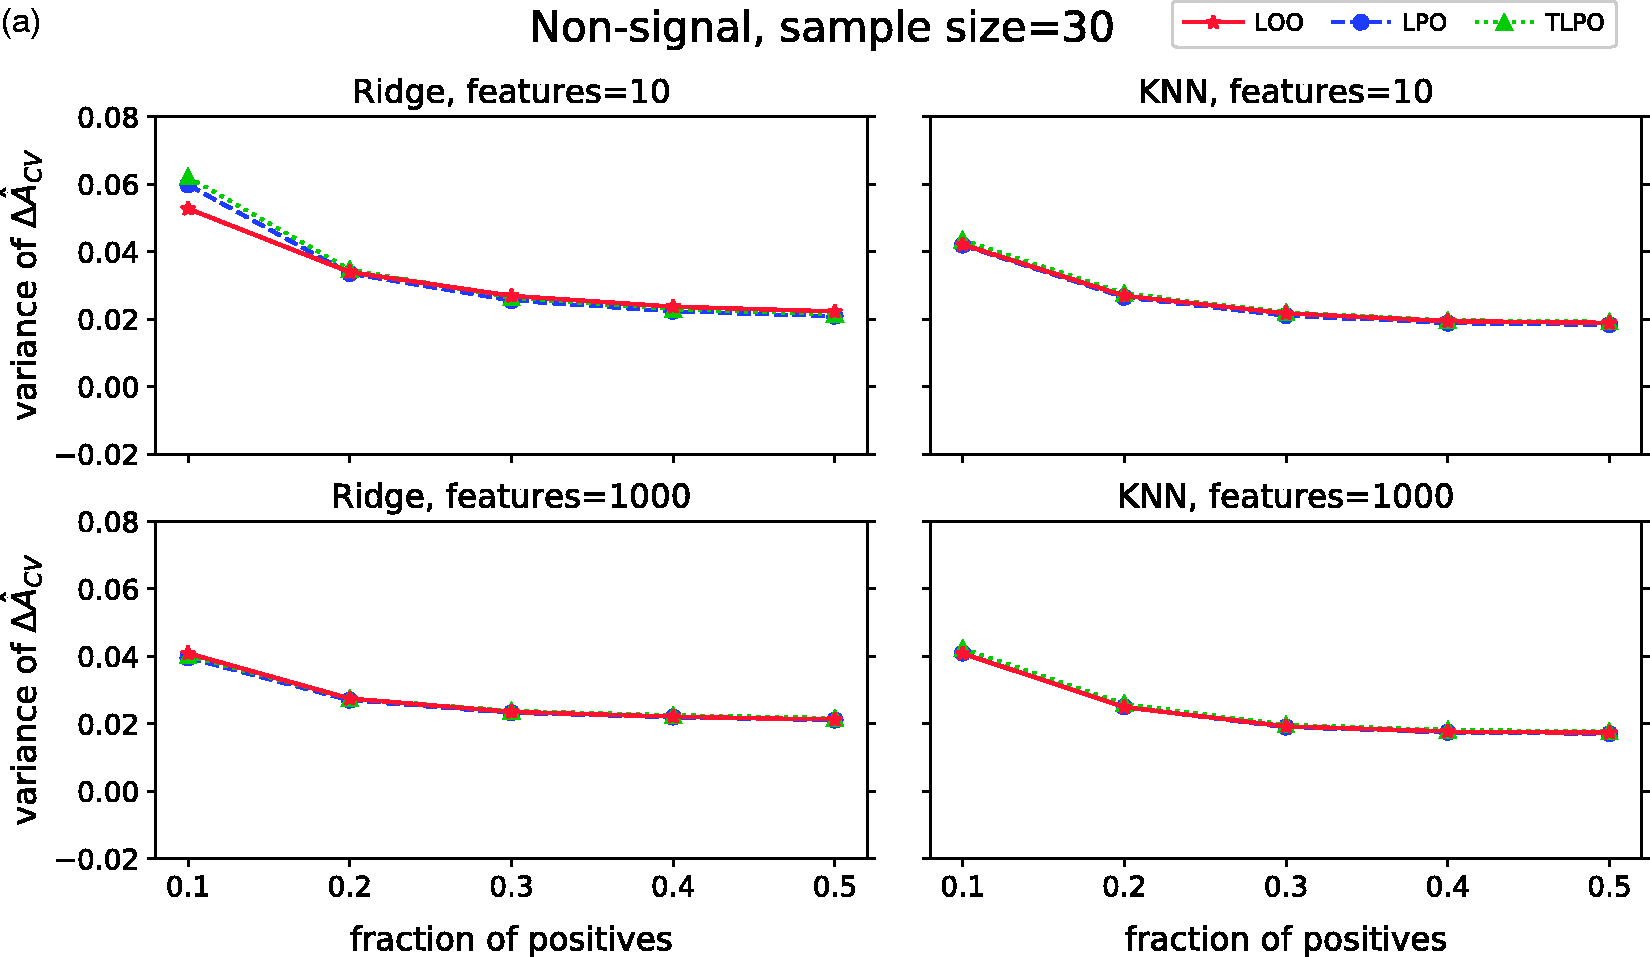
Figure 3(b) shows the variances of
To summarize our results on synthetic data, LPO and TLPO AUC estimates are similar on non-signal and signal data when using ridge regression as classification method. When using KNN, TLPO estimates slightly deviate from LPO estimates, showing some negative bias. LOO estimates compared to LPO and TLPO present a much larger negative bias in most of our simulations settings. The variance of the estimates shown in all three cross-validation methods decrease when the class fraction increases.
4.3 Real data set
In addition to synthetic data, we have performed experiments using prostate magnetic resonance imaging (MRI) data to compare A(f) against
Characteristics of the patients included in the real medical data set. The tumors are located in the prostate peripheral zone.
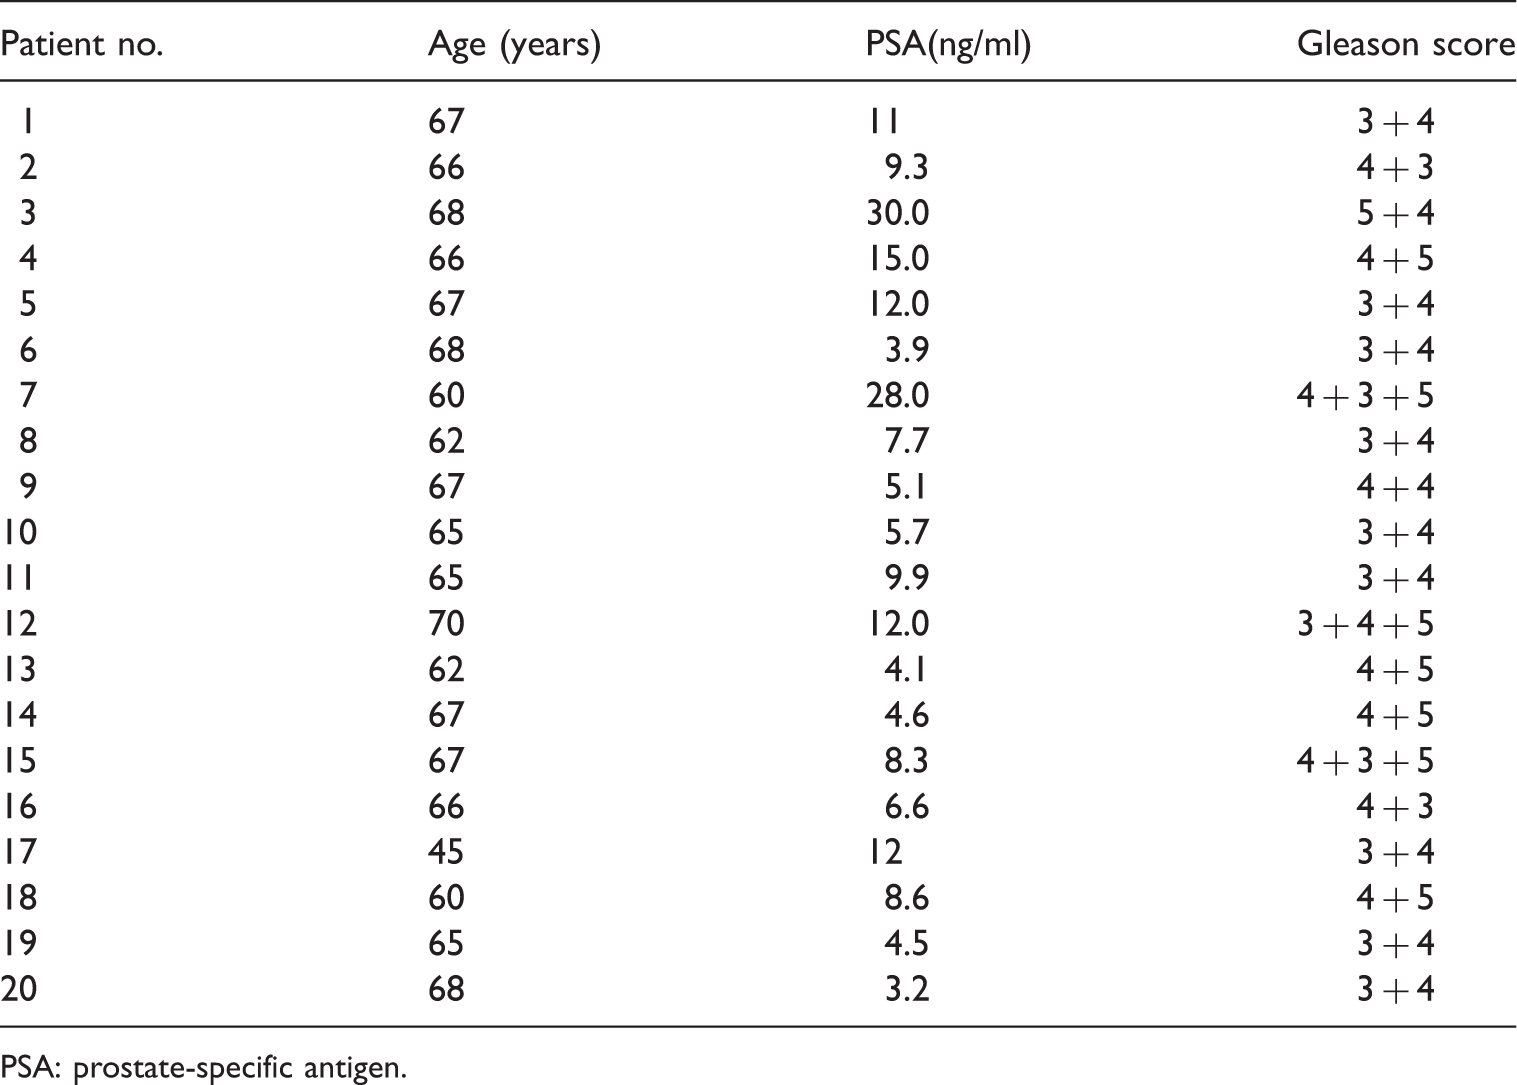
PSA: prostate-specific antigen.
With this data set, we performed experiments varying the class fraction as we did in the synthetic data set simulations. To compute
The results of these experiments allow us to compare the A(f) to Mean and standard deviation of A(f), 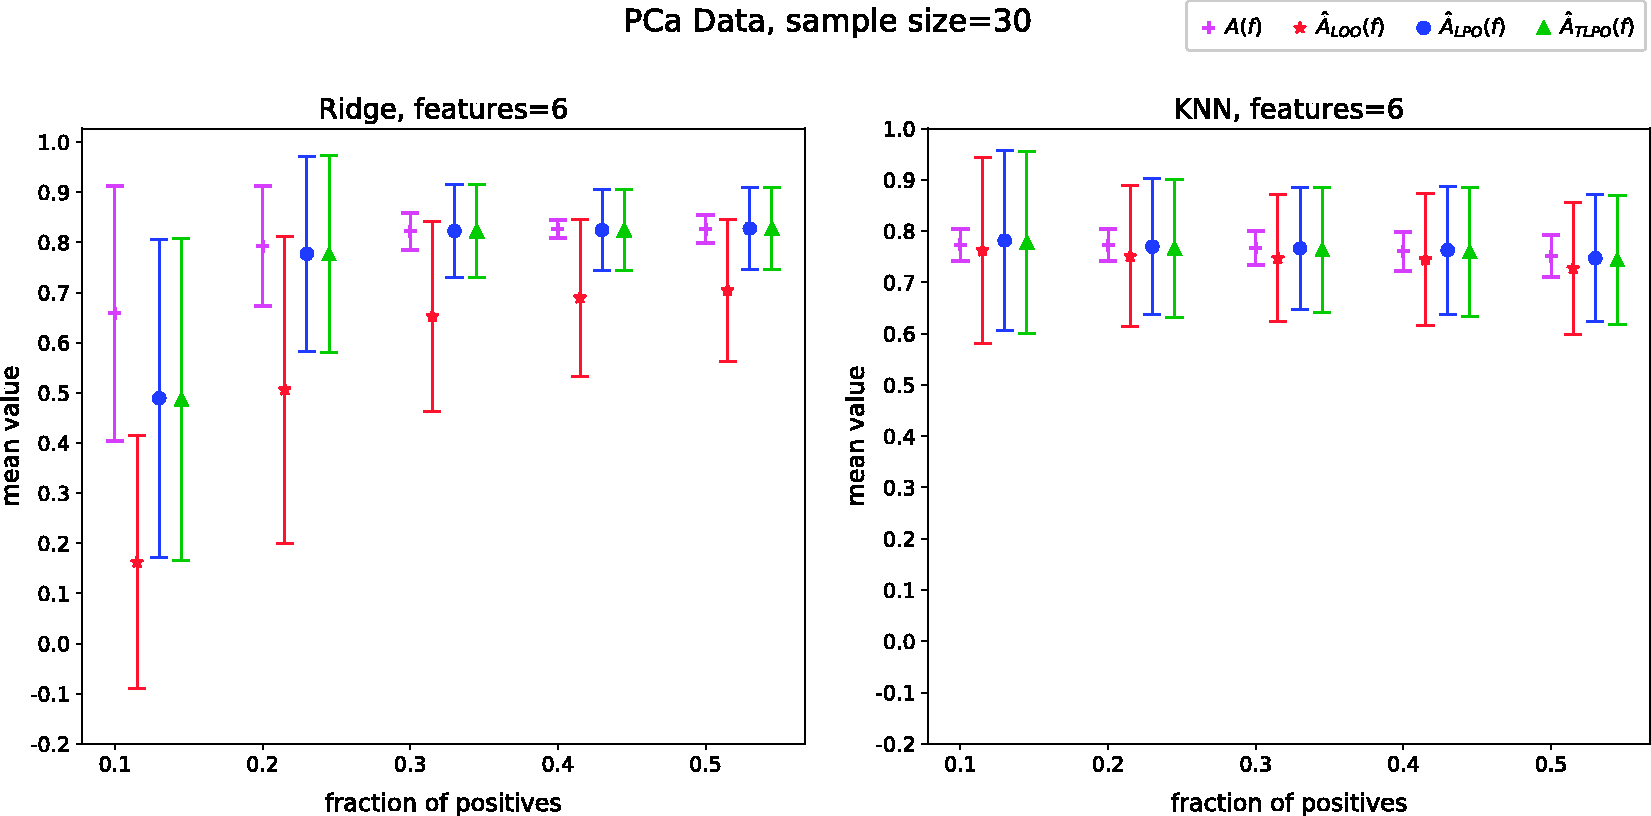
The mean (a) Mean 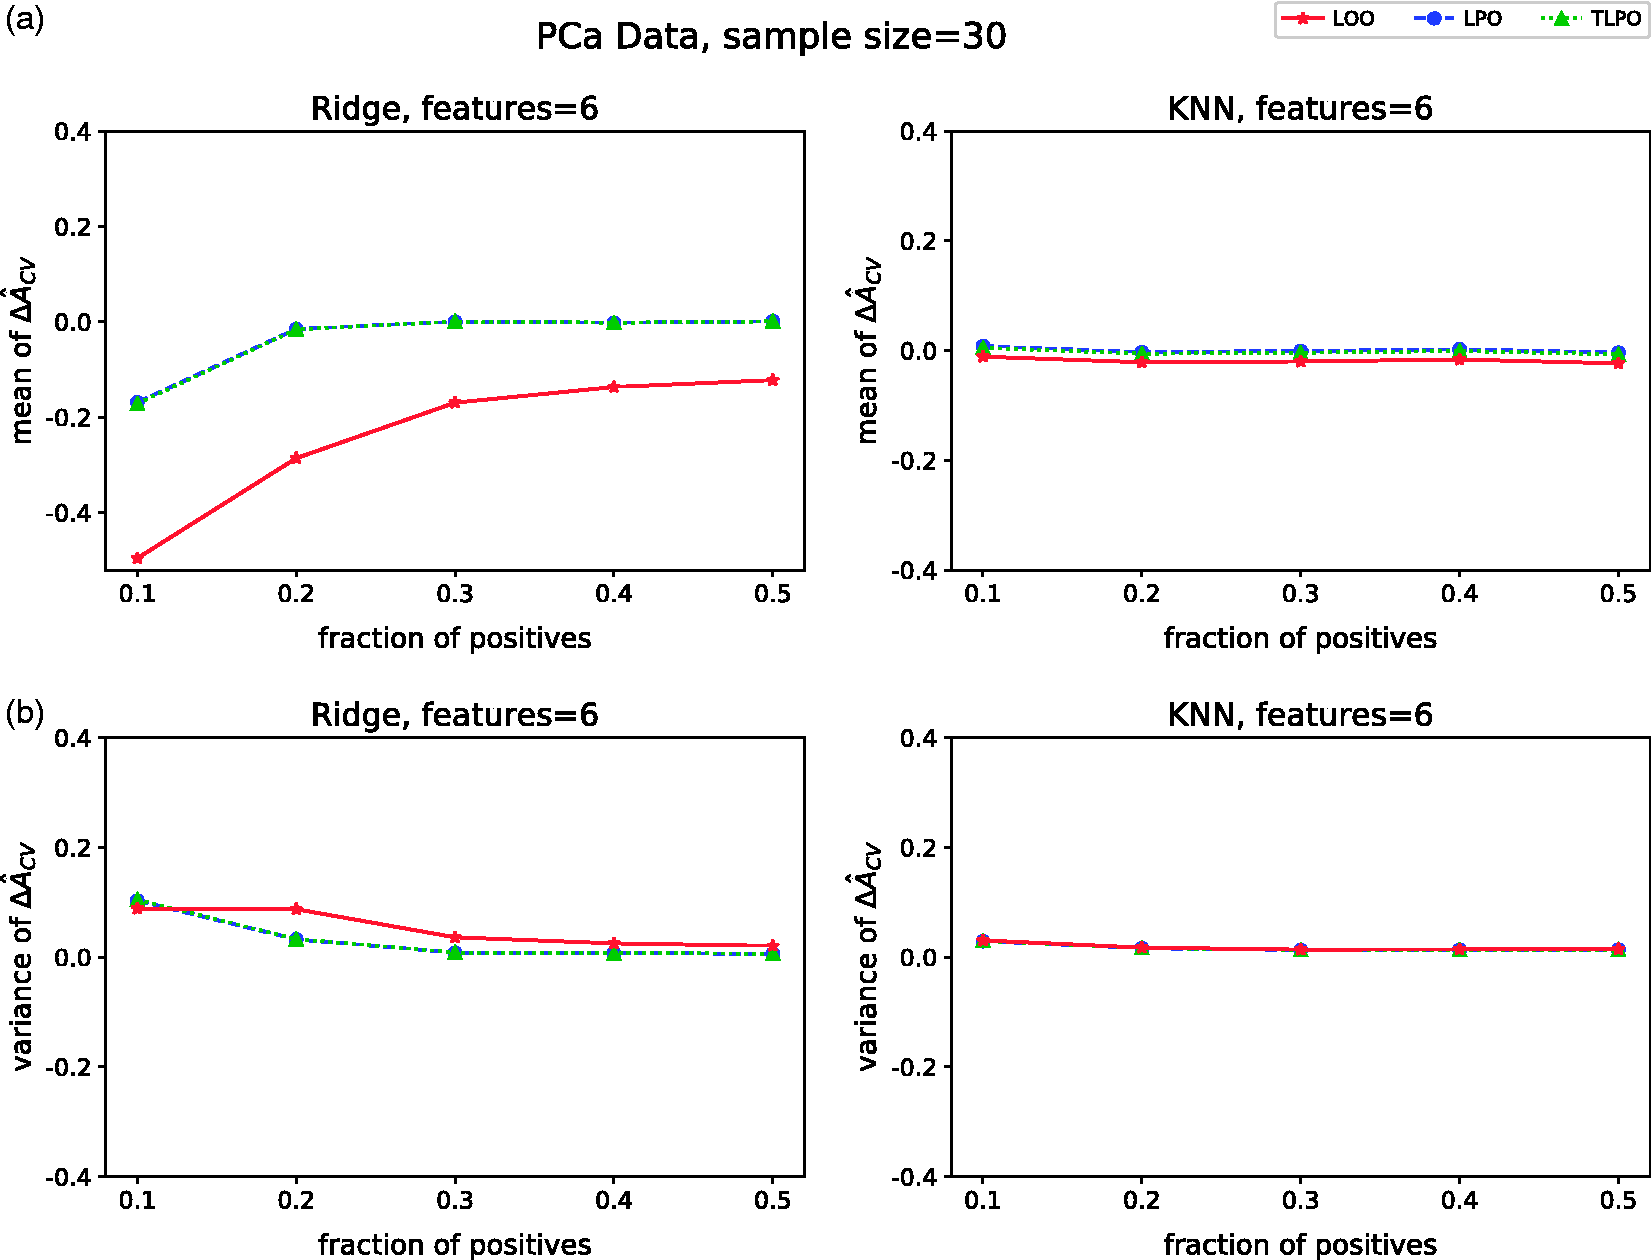
4.4 Sensitivity at a given specificity
To demonstrate a typical case of ROC analysis made possible by the tournament scores, we considered the estimation of sensitivity of a classifier at given specificity. We studied the TLPO sensitivity (
Figure 6(a) presents the mean of Mean ΔŜe at a given specificity for Ridge and KNN on (a) non-signal data with 10 or 1000 features, (b) signal data with 10 features (one or four have signal) and with 1000 features (10 or 50 have signal) and (c) PCa data with six features for positive class fraction equal to 30% and 50%. For (a) and (b) the classes are balanced and the mean value is computed over 10,000 repetitions. In (c), the number of repetitions is 617. ΔŜe: TLPO and true sensitivity difference; Ridge: ridge regression; KNN: k-nearest neighbors; Class-fraction: proportion of positive units; F-Signal: number of features with signal; PCa: prostate cancer.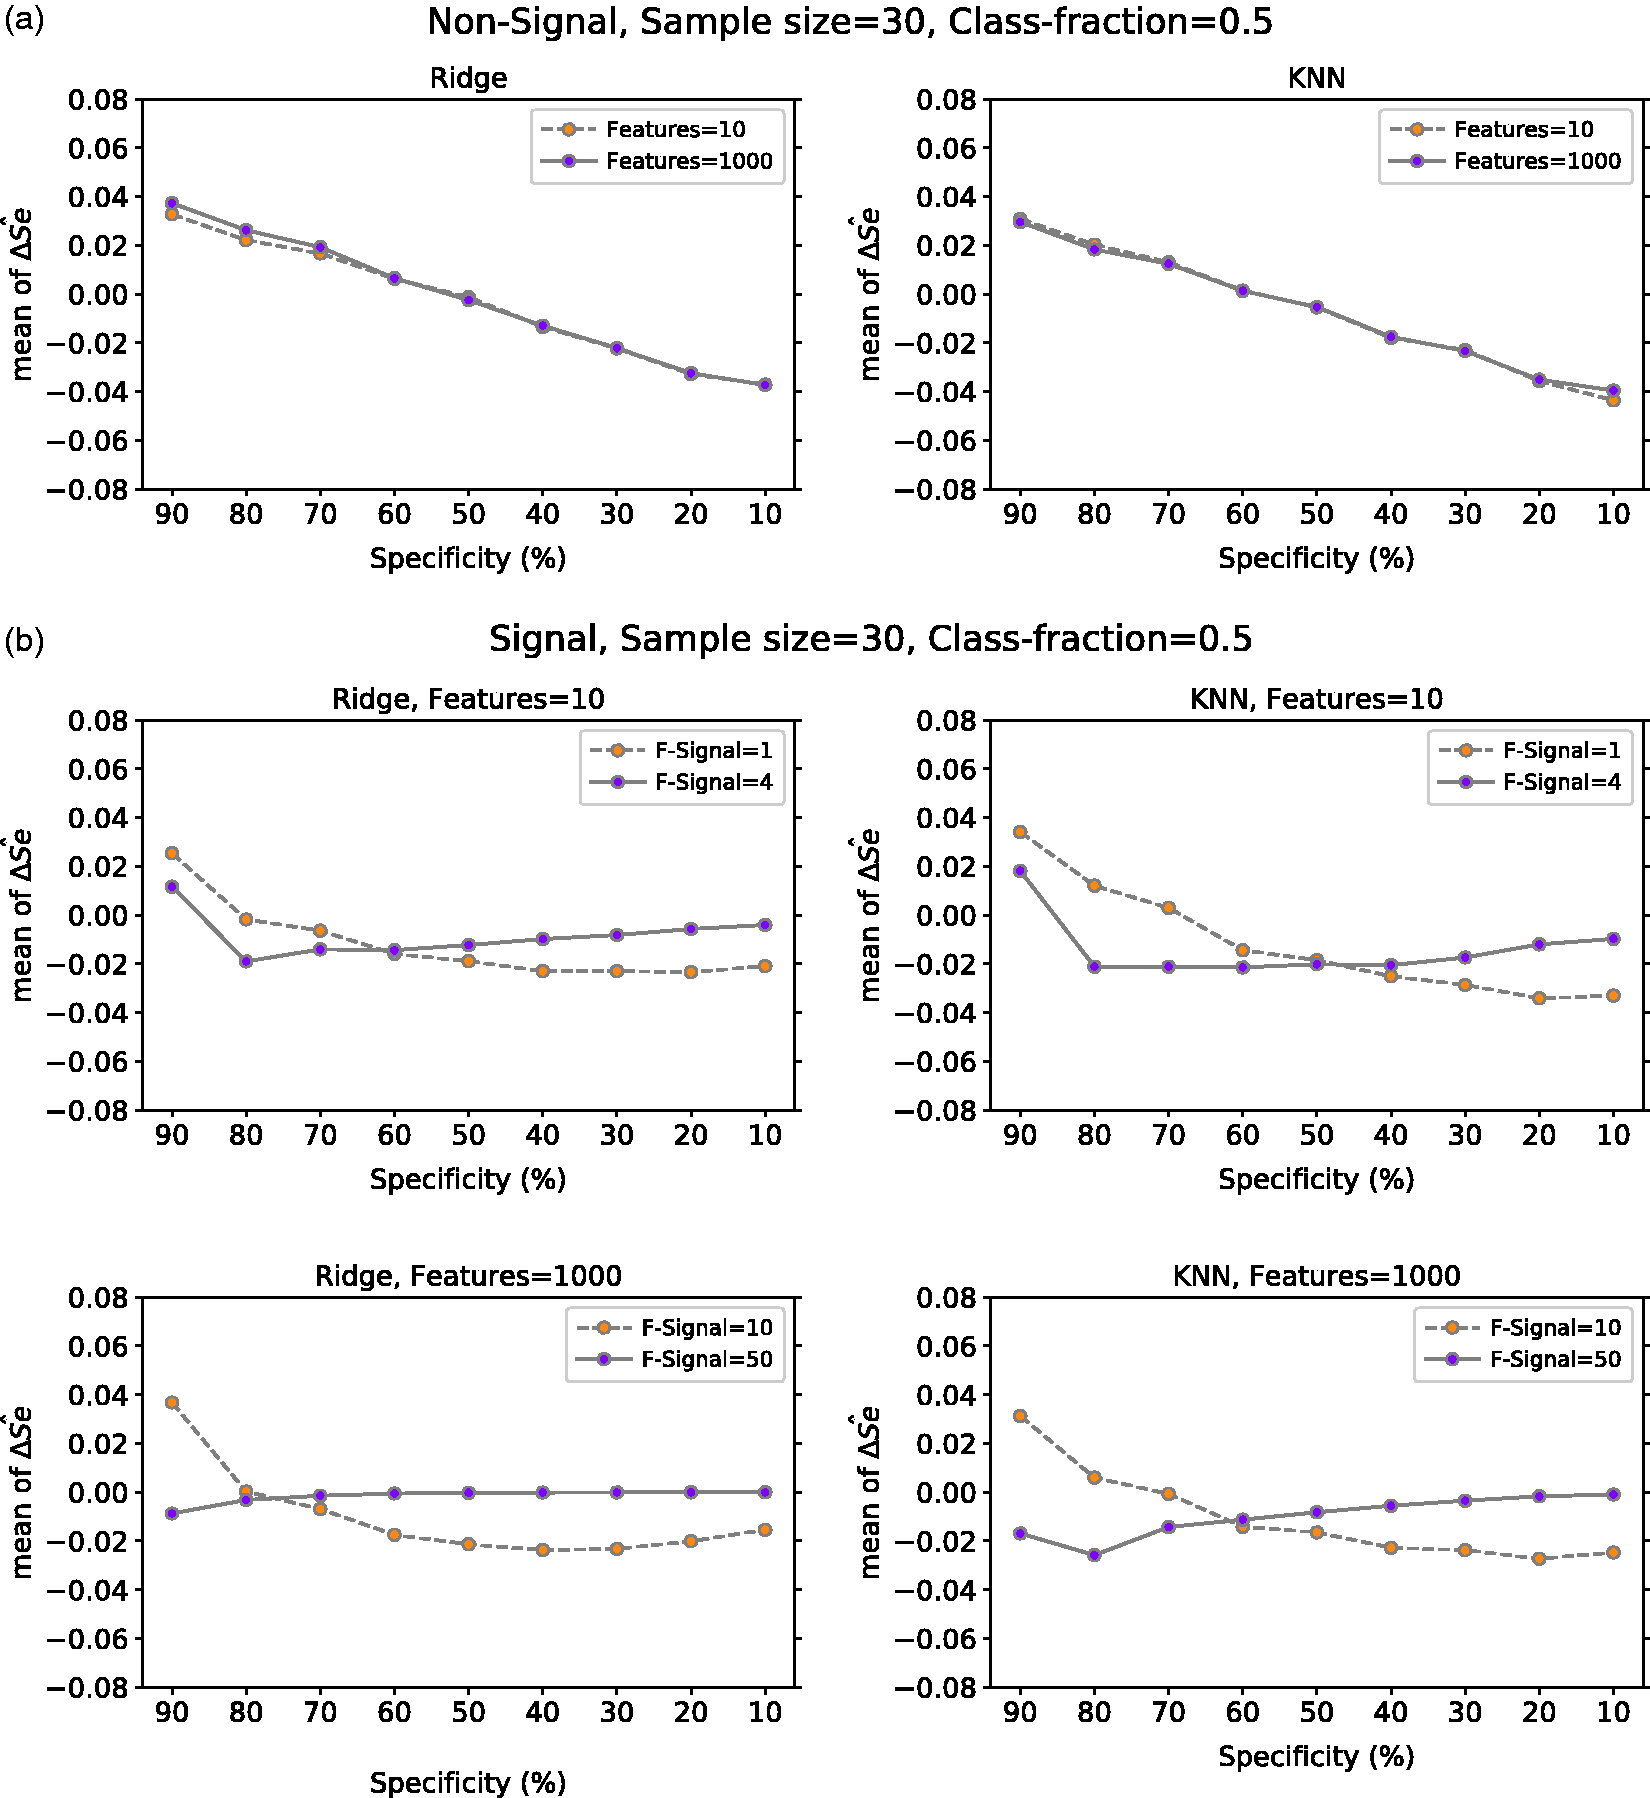
The mean of
Figure 6(c) displays the mean of
The variance of ΔŜe variance at a given specificity for Ridge and KNN on (a) non-signal data with 10 or 1000 features, (b) signal data with 10 features (one or four have signal) and with 1000 features (10 or 50 have signal) and (c) PCa data with six features for positive class fraction equal to 30% and 50%. For (a) and (b), the classes are balanced and the mean value is computed over 10,000 repetitions. In (c), the number of repetitions is 617. ΔŜe: TLPO and true sensitivity difference; Ridge: ridge regression; KNN: k-nearest neighbors; Class-fraction: proportion of positive units; F-Signal: number of features with signal; PCa: prostate cancer.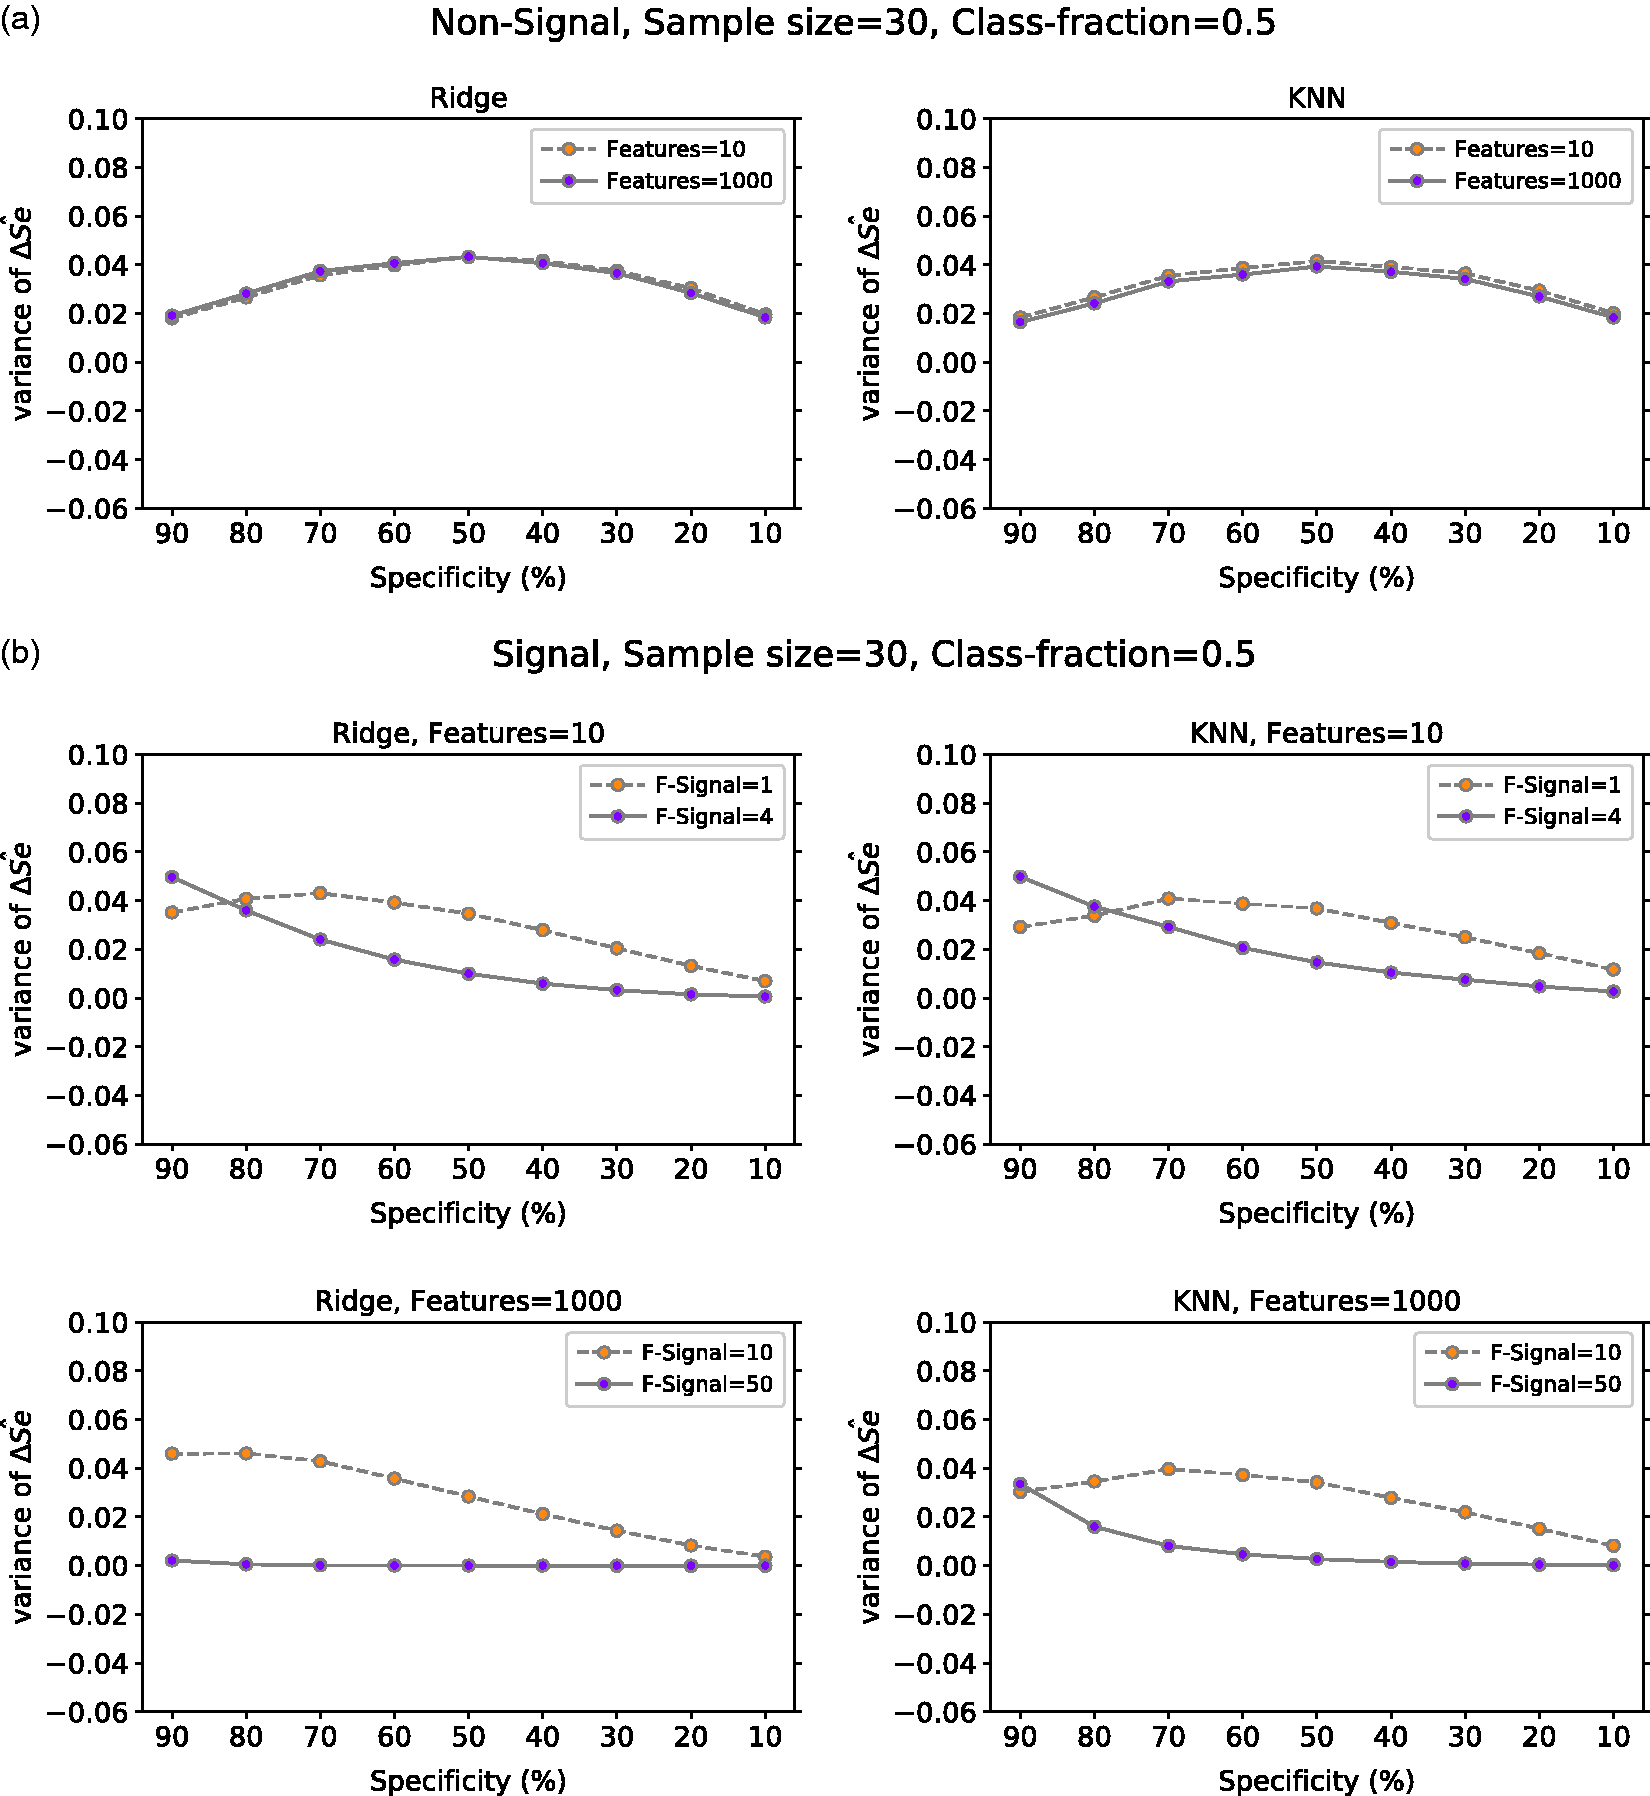
From all results, we observe that sensitivity tends to be more biased near the ends of the ROC curve. This is easily seen from the experiments with the non-signal data, in which the sensitivity is positively biased for large specificity values and negatively for the small ones. This is a property of ROC curves calculated from a small sample, which can be easily observed from the example case in Figure 1. There, sensitivity of the true ROC always approaches zero for 100% specificity in the limit, but it can be considerably larger for finite samples depending on how many positive units are in the top of the ranking that determines the ROC curve. Accordingly, the amount and direction of the bias depend considerably on how much room for variability there is below and above the true ROC curve.
5 Discussion and future work
This study proposes TLPO cross-validation for performing ROC analysis and estimating AUC. Our experiments on synthetic data and real data showed that TLPO provides close to unbiased AUC estimates, similarly to the previously proposed LPO method. The advantage of TLPO over LPO is that the former produces also ranking of the data, necessary for computing the ROC curve. Further, our experiments confirmed the substantial negative bias in LOO AUC estimates. Thus, our results suggest that TLPO provides the most reliable cross-validation method for performing ROC curve analysis. This is further backed by an experimental evaluation on computing sensitivity for a given specificity value.
In contrast to using only the positive–negative pairs as when computing AUC with ordinary LPO, we used a complete round robin tournament (or all-play-all tournament) to compute scores for TLPO. This was done for the following reasons. Firstly, it provides simple and convenient consistency analysis tools enabling us to investigate the stability properties of the learning algorithms with respect to LPO by counting the circular triads in the tournament graph. Secondly, the recent theoretical results 19 provide good guarantees for determining a bipartite ranking from a possibly inconsistent tournament. However, in ROC analysis literature, the so-called placement values39,40 that are based only on the positive–negative pairs have been traditionally used for estimating the variance of AUC, comparing two ROC curves or calculating confidence interval for the estimated AUC.41–43 This type of use of placement values together with LPO would be an interesting study of its own, as the effects of the possible inconsistencies in LPO results on these tools is not yet well known. Especially so, since deriving proper confidence intervals for cross-validation is known to be a challenging problem. 44
Future work is required to ascertain to what extent our results generalize to different methods, data distributions, and learning methods than those considered in this work. Yet, we find it encouraging that similar behavior was observed for the cross-validation methods both on the real and the simulated data. Further, our results about the bias and variance of the LOO and LPO methods are similar to those presented in earlier works,7,9 where similar results were shown also for larger sample sizes.
Overall, our signal data and real data experiments suggest that if the available data have strong signal TLPO is highly consistent; thus, LPO and TLPO AUC estimates tend to be the same regardless of the classification method. However, it is a good practice to compute both estimates and verify their similarity before performing ROC analysis with TLPO scores.
Supplemental Material
Supplemental material for Tournament leave-pair-out cross-validation for receiver operating characteristic analysis
Supplemental material for Tournament leave-pair-out cross-validation for receiver operating characteristic analysis by Ileana Montoya Perez, Antti Airola, Peter J Boström, Ivan Jambor and Tapio Pahikkala in Statistical Methods in Medical Research
Footnotes
Acknowledgements
The authors thank Jussi Toivonen for computing the texture features for the medical data set, and the anonymous reviewers for constructive comments, especially regarding the connection of tournament scores to placement values in ROC analysis.
Declaration of conflicting interests
The author(s) declared no potential conflicts of interest with respect to the research, authorship, and/or publication of this article.
Funding
The author(s) disclosed receipt of the following financial support for the research, authorship, and/or publication of this article: This work was supported by Turku University Foundation (Pentti ja Tyyni Ekbomin Rahasto grant 13757) and by the Academy of Finland (grants 289903, 311273, 313266).
References
Supplementary Material
Please find the following supplemental material available below.
For Open Access articles published under a Creative Commons License, all supplemental material carries the same license as the article it is associated with.
For non-Open Access articles published, all supplemental material carries a non-exclusive license, and permission requests for re-use of supplemental material or any part of supplemental material shall be sent directly to the copyright owner as specified in the copyright notice associated with the article.