
Abstract
Agreement studies are of paramount importance in various scientific domains. When several observers classify objects on categorical scales, agreement can be quantified through multirater kappa coefficients. In most statistical packages, the standard error of these coefficients is only available under the null hypothesis that the coefficient is equal to zero, preventing the construction of confidence intervals in the general case. The aim of this paper is triple. First, simple analytic formulae for the standard error of multirater kappa coefficients will be given in the general case. Second, these formulae will be extended to the case of multilevel data structures. The formulae are based on simple matrix algebra and are implemented in the R package “multiagree”. Third, guidelines on the choice between the different mulitrater kappa coefficients will be provided.
1 Introduction
Reliability and agreement studies are of paramount importance in medical and behavioral sciences. They provide information about the amount of error inherent to any diagnosis, score or measurement. Using unreliable measurement instruments and procedures can lead to incorrect conclusions from scientific studies and unreproducible research while disagreement between physicians can lead, in clinical decision making, to different treatments for the patient. Reliability is classically defined as the ratio between the true score variance and the total variance and is quantified through different versions of the intraclass correlation coefficient (ICC), depending on the study design. 1 When several observers rate subjects, ICCs for consistency are obtained if the systematic shifts between the observers are ignored while ICCs for agreement are obtained if they are taken into account. In parallel to the ICCs, scaled agreement coefficients2–4 were developed outside the classical test theory and were found to be closely related to ICCs for agreement.
While it is easy to define the agreement between two observers on a categorical scale for a given object (they agree or they don’t agree), this is not the case when agreement is searched between several observers (R > 2). In this latter case, the agreement can be defined by an arbitrary choice along a continuum ranging from agreement between a pair of observers to agreement among all the R observers, i.e. a concordant classification between g observers (
The two pairwise agreement coefficients considered in this paper pertain to the kappa coefficient family and were shown to be asymptotically equivalent to ICCs for agreement when the scale is binary. The first agreement coefficient is commonly named Fleiss kappa. It was developed by Fleiss 7 and was shown to be asymptotically equivalent to the ICC for agreement based on a one-way ANOVA design. 8 In a one-way setting, each object is rated by a different set of observers, randomly selected in a population. Therefore, the variation due to the observers cannot be separated from the error variation and only ICC for agreement can be determined. 1 The second coefficient is the pairwise kappa coefficient developed by Conger 5 and equivalently by Davies and Fleiss, 9 Schouten 10 and O’Connell and Dobson. 11 This second coefficient will be referred to as ‘Conger kappa’ to differentiate it from ‘Fleiss kappa’. When all objects are classified on a binary scale by the same set of observers randomly selected in a population, Conger kappa is asymptotically equivalent to the ICC for agreement under a two-way ANOVA setting including the observers as systematic source of disagreement.9,12
Fleiss kappa coefficient is popular, as assessed by more than 4000 citations of his original paper in Google scholar as compared to the 350 citations of Conger’s paper and 300 citations of Davies and Fleiss’ paper. The three following issues were identified with the use of multirater kappa coefficients in the literature. First, Fleiss kappa is used independently of the design of the study. The misuse of Fleiss kappa in the two-way ANOVA setting is likely to result in an underestimation of the agreement level, 13 as Fleiss kappa coefficient gives on average smaller values than Conger kappa. In the same way, the misuse of Conger kappa in one-way ANOVA settings is likely to overestimate the agreement level. It is therefore important to use the appropriate multirater kappa coefficient, based on the study design and the corresponding ANOVA model.
Second, main statistical packages (e.g. R package ‘irr’, STATA, SAS macro MAGREE, SPSS extension STATS_FLEISS_KAPPA) only provide the standard error of Fleiss kappa under the hypothesis that it equals zero, despite the existence of a formula for the general case derived by Schouten. 10 Worse, with the exception of the R package ‘magree’, Conger kappa coefficient, when available (e.g. R package ‘irr’, STATA), is reported without standard error, although an asymptotic formula based on the delta method was also provided by Schouten 14 and O’Connell and Dobson. 11
Finally, there is a need to define multirater kappa coefficients and provide statistical inference in the presence of multilevel data. Multilevel data are commonly encountered in medical and behavioural sciences, where measures are often obtained on persons nested in organisations (e.g. patients in health care centers), on different parts of the body or by repeated measurements over time. For example, in the study motivating this paper, seven groups of four medical observers with different experience levels were asked to assess the presence of crackles and wheezes (yes/no) on the lung sounds of 20 subjects. The lung sounds were recorded with a stethoscope at three locations on each side of the thorax, leading to six observations per subject. The aim of the study was to evaluate the level of agreement within each group of observers. Specific statistical techniques need to be used to account for the dependency between the objects of the same cluster. It was shown in various contexts that ignoring the hierarchical structure of the data can lead to incorrect conclusions (e.g. Hox 15 ). Therefore, Barlow et al. 16 and Oden, 17 among others, proposed stratified agreement coefficients. They use a weighted average of the agreement coefficients obtained on each cluster. These coefficients, however, are not asymptotically equivalent to ICCs and possess a less straightforward interpretation than the coefficients considered here.
The aim of this paper is therefore threefold. First, the formula of the standard error derived with the delta method by Schouten10,14 and O’Connell and Dobson 11 for Fleiss and Conger kappa will be presented in a unified framework using simple notations. Second, these formulas will be extended to the case of multilevel data structures, based on recent work.18–20 Third, the paper will emphasise the appropriate use and interpretation of Fleiss and Conger kappa depending on the study design. The standard error formulae derived by the delta method are based on simple algebra, easy to program and implemented in the R statistical package ‘multiagree’ available on Github. As an alternative, the clustered bootstrap method will also be considered and the statistical performances of the two methods will be compared using simulations.
In Section 2, the two multirater kappa coefficients, Fleiss and Conger kappa coefficients are reviewed and the general formula derived by the delta method for their standard error is given. These definitions are generalised to multilevel data in Section 3. The standard error of the multilevel multirater kappa coefficients are derived using the delta method and the clustered bootstrap method in Section 4. Then, the statistical properties of the delta and the bootstrap methods are studied using simulation in Section 5. The methods are illustrated on psychological and medical data in Section 6. Finally, the results are discussed in Section 7.
2 Definition of the classical pairwise agreement coefficients
Suppose that a sample of N objects is classified by several observers on a K-categorical scale. Two situations can be distinguished and will lead to different agreement coefficients: (1) each object i (
Let the random variable

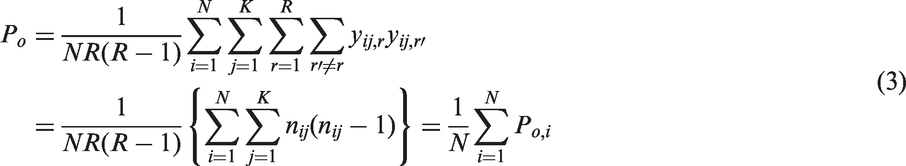
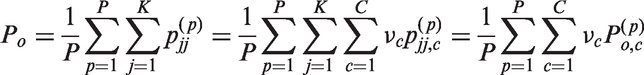
The proportion Po is the observed agreement. It is defined as the mean proportion of agreement between all possible pairs of observers. In the case of Fleiss kappa coefficient, we have

For Conger kappa, the same expression is obtained, namely
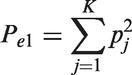
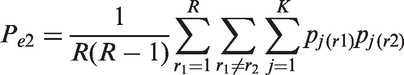
The proportion Pel (l = 1, 2) is the agreement expected under the assumption of statistical independence between any two observers. Its expression differs for the two multirater kappa coefficients
2.1 Fleiss kappa coefficient
The expected agreement was defined by Fleiss
7
under a one-way ANOVA setting, i.e. when the Ri observers are not the same for all objects, as

The asymptotic sampling variance of

Under the null hypothesis that

2.2 Conger kappa coefficient
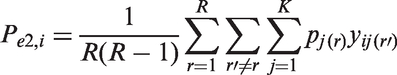
The expected agreement is defined as the mean proportion of expected agreement between all

For binary scales, Davies and Fleiss
9
have shown that

3 Definition of multilevel multirater pairwise kappa coefficients
Multilevel multirater pairwise kappa coefficients will be defined similarly to the case of two observers.18–20 Suppose that the population
In order to be able to define an overall kappa coefficient, two assumptions are made. First, it is assumed that the objects are homogeneous in each cluster, in the sense that the probability
Let
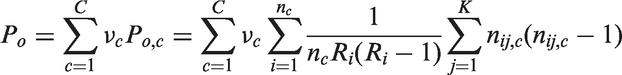
The expected agreement for multilevel data is then defined by
In the case of a two-way ANOVA setting, if
In the same way, if the proportion of objects classified in category j is denoted by
The multilevel counterpart of Fleiss kappa coefficient (
4 Sampling variability
4.1 Delta method
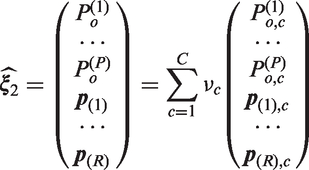
We will consider the vector
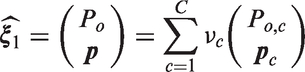
We will consider the vector
Similarly to Yang and Zhou18,19 and to Vanbelle,
20
it can be shown that asymptotically, under mild regularity conditions,
The delta method will be applied on successive functions of the vector
4.1.1 Multilevel Fleiss kappa
When the objects are not all classified by the same set of observers, the vector
4.1.2 Multilevel Conger kappa
When the objects are all classified by the same set of observers, the expected agreement is the average of the expected agreement over all pairs of observers. In matrix notation, the agreement expected under the independence assumption of the two observers of pair p is given by
In the same way, the overall observed agreement and expected agreement Po and
4.1.3 Multilevel Fleiss and Conger kappa
Finally, the multilevel multirater kappa coefficient

When there is only one unit per cluster (
4.2 The clustered bootstrap method
The clustered bootstrap method was applied by Kang et al.
25
to derive the standard error of the Cohen’s kappa coefficient in the presence of multilevel data and by Vanbelle
20
to derive the variance–covariance matrix when comparing several kappa coefficients. The clustered bootstrap consists of three steps:
Draw a random sample with replacement of size C from the cluster indexes. For each cluster, take all observations belonging to the cluster. If the cluster sizes are different, the sample size of the bootstrap sample could be different from the original sample size N. Repeat steps 1 and 2 to generate a total of B independent bootstrap samples.
Depending on the study design, the multilevel Fleiss or Conger kappa coefficient is determined for each bootstrap sample
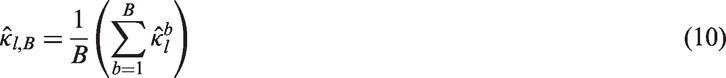
Alternatively, percentiles can be considered to construct confidence intervals.
5 Simulations
To study the behavior of the type I error rate (α), multilevel-dependent binary variables with fixed marginal distribution and dependency between pairs of variables were simulated following the algorithm of Emrich and Piedmonte.
26
Data were simulated under a two-way ANOVA setting, leading Conger kappa coefficient as the appropriate agreement measure. That is, we supposed that R observers each classified C clusters with each nc = n subjects. For each cluster, a
The assessment on a binary scale of C = 25, 50 and 100 clusters with each
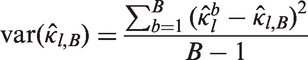
To allow a wide range of possible agreement values, all observers were assumed to have a uniform marginal probability distribution. This implies that κ1 and κ2 reduce to the correlation coefficient for the binary case, namely the φ coefficient. 2 For each simulation scheme, the mean squared error, the mean standard error, and the coverage probability, defined as the number of times the 95% confidence interval covers the theoretical agreement value, were recorded. For the clustered bootstrap method, the coverage was determined for the 95% confidence interval based on mean and standard error and based on percentiles. The clustered bootstrap method was based on B = 5000 bootstrap samples. A total of 1000 simulations were performed for each parameter configuration. Therefore, the 95% confidence interval for the nominal coverage level is [0.936; 0.963].
5.1 Simulation results for nc = 1 (no multilevel data)
The coverage levels obtained for Conger kappa coefficients when there is no multilevel structure are presented in Figure 1 for observers with uniform marginal probability distribution using the delta and the percentile-based clustered bootstrap method. The complete results are given as supplemental material.
Simulations. Coverage for Conger’s kappa coefficient against the number of clusters obtained with the delta method (black) and the percentile-based bootstrap method (gray) in the presence of 2 (dotted), 5 (dashed) and 10 (plain) observers with uniform marginal probability distribution. The number of objects per cluster is equal to 1.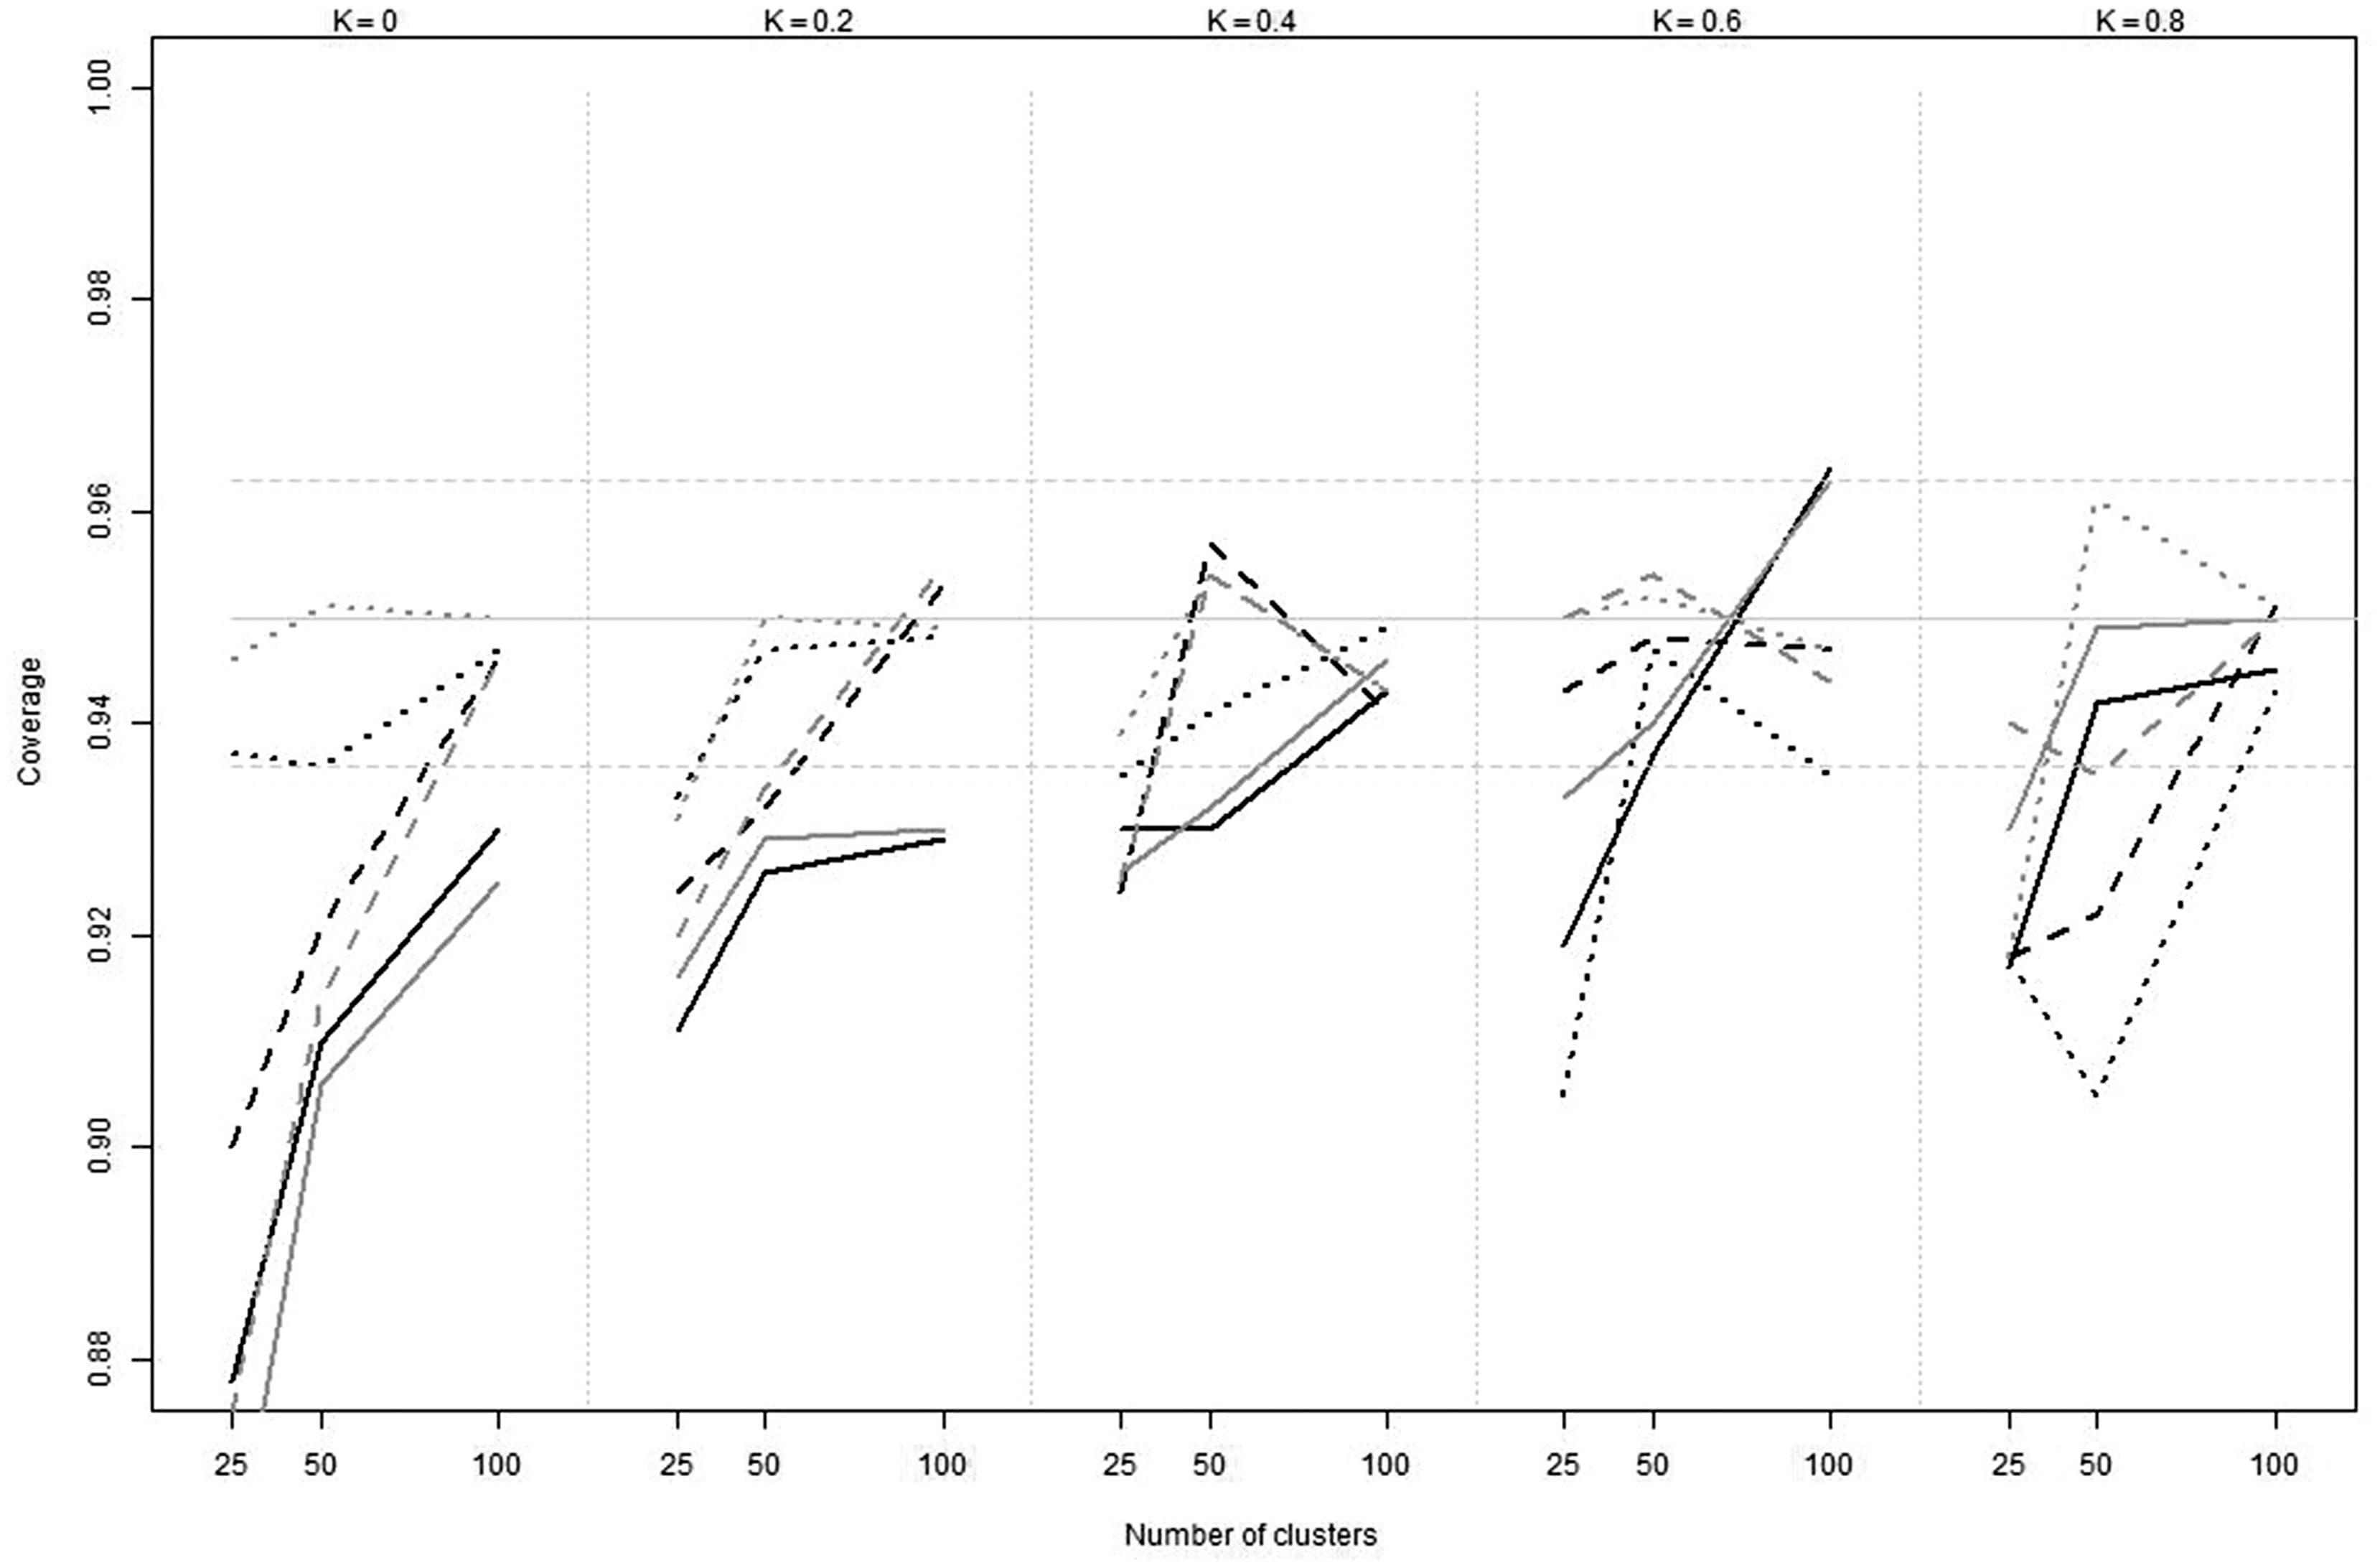
The coverage levels obtained with the delta and the percentile-bootstrap methods are very similar, except for high agreement values where the percentile-bootstrap method performs better. The percentile-bootstrap confidence intervals (CIs) are left-skewed in that case and provide better coverage levels. An important finding is that the coverage is too low when the sample size is small (C = 25) and the kappa coefficient is small (
5.2 Simulations results for nc = 2, 5, 10 (multilevel data)
The results obtained with the delta and the clustered bootstrap methods were very similar and stable across the different number of objects per cluster. Therefore, only the results obtained with the delta method for five objects per cluster (nc = 5) are presented in Figure 2. The complete results can be found in the supplemental material.
Simulations. Coverage for Conger’s kappa coefficient according to the delta method in the presence of 2 (dotted), 5 (dashed) and 10 (plain) observers with uniform marginal probability distribution, 25 (up), 50 (middle) and 100 (bottom) clusters and five objects per cluster.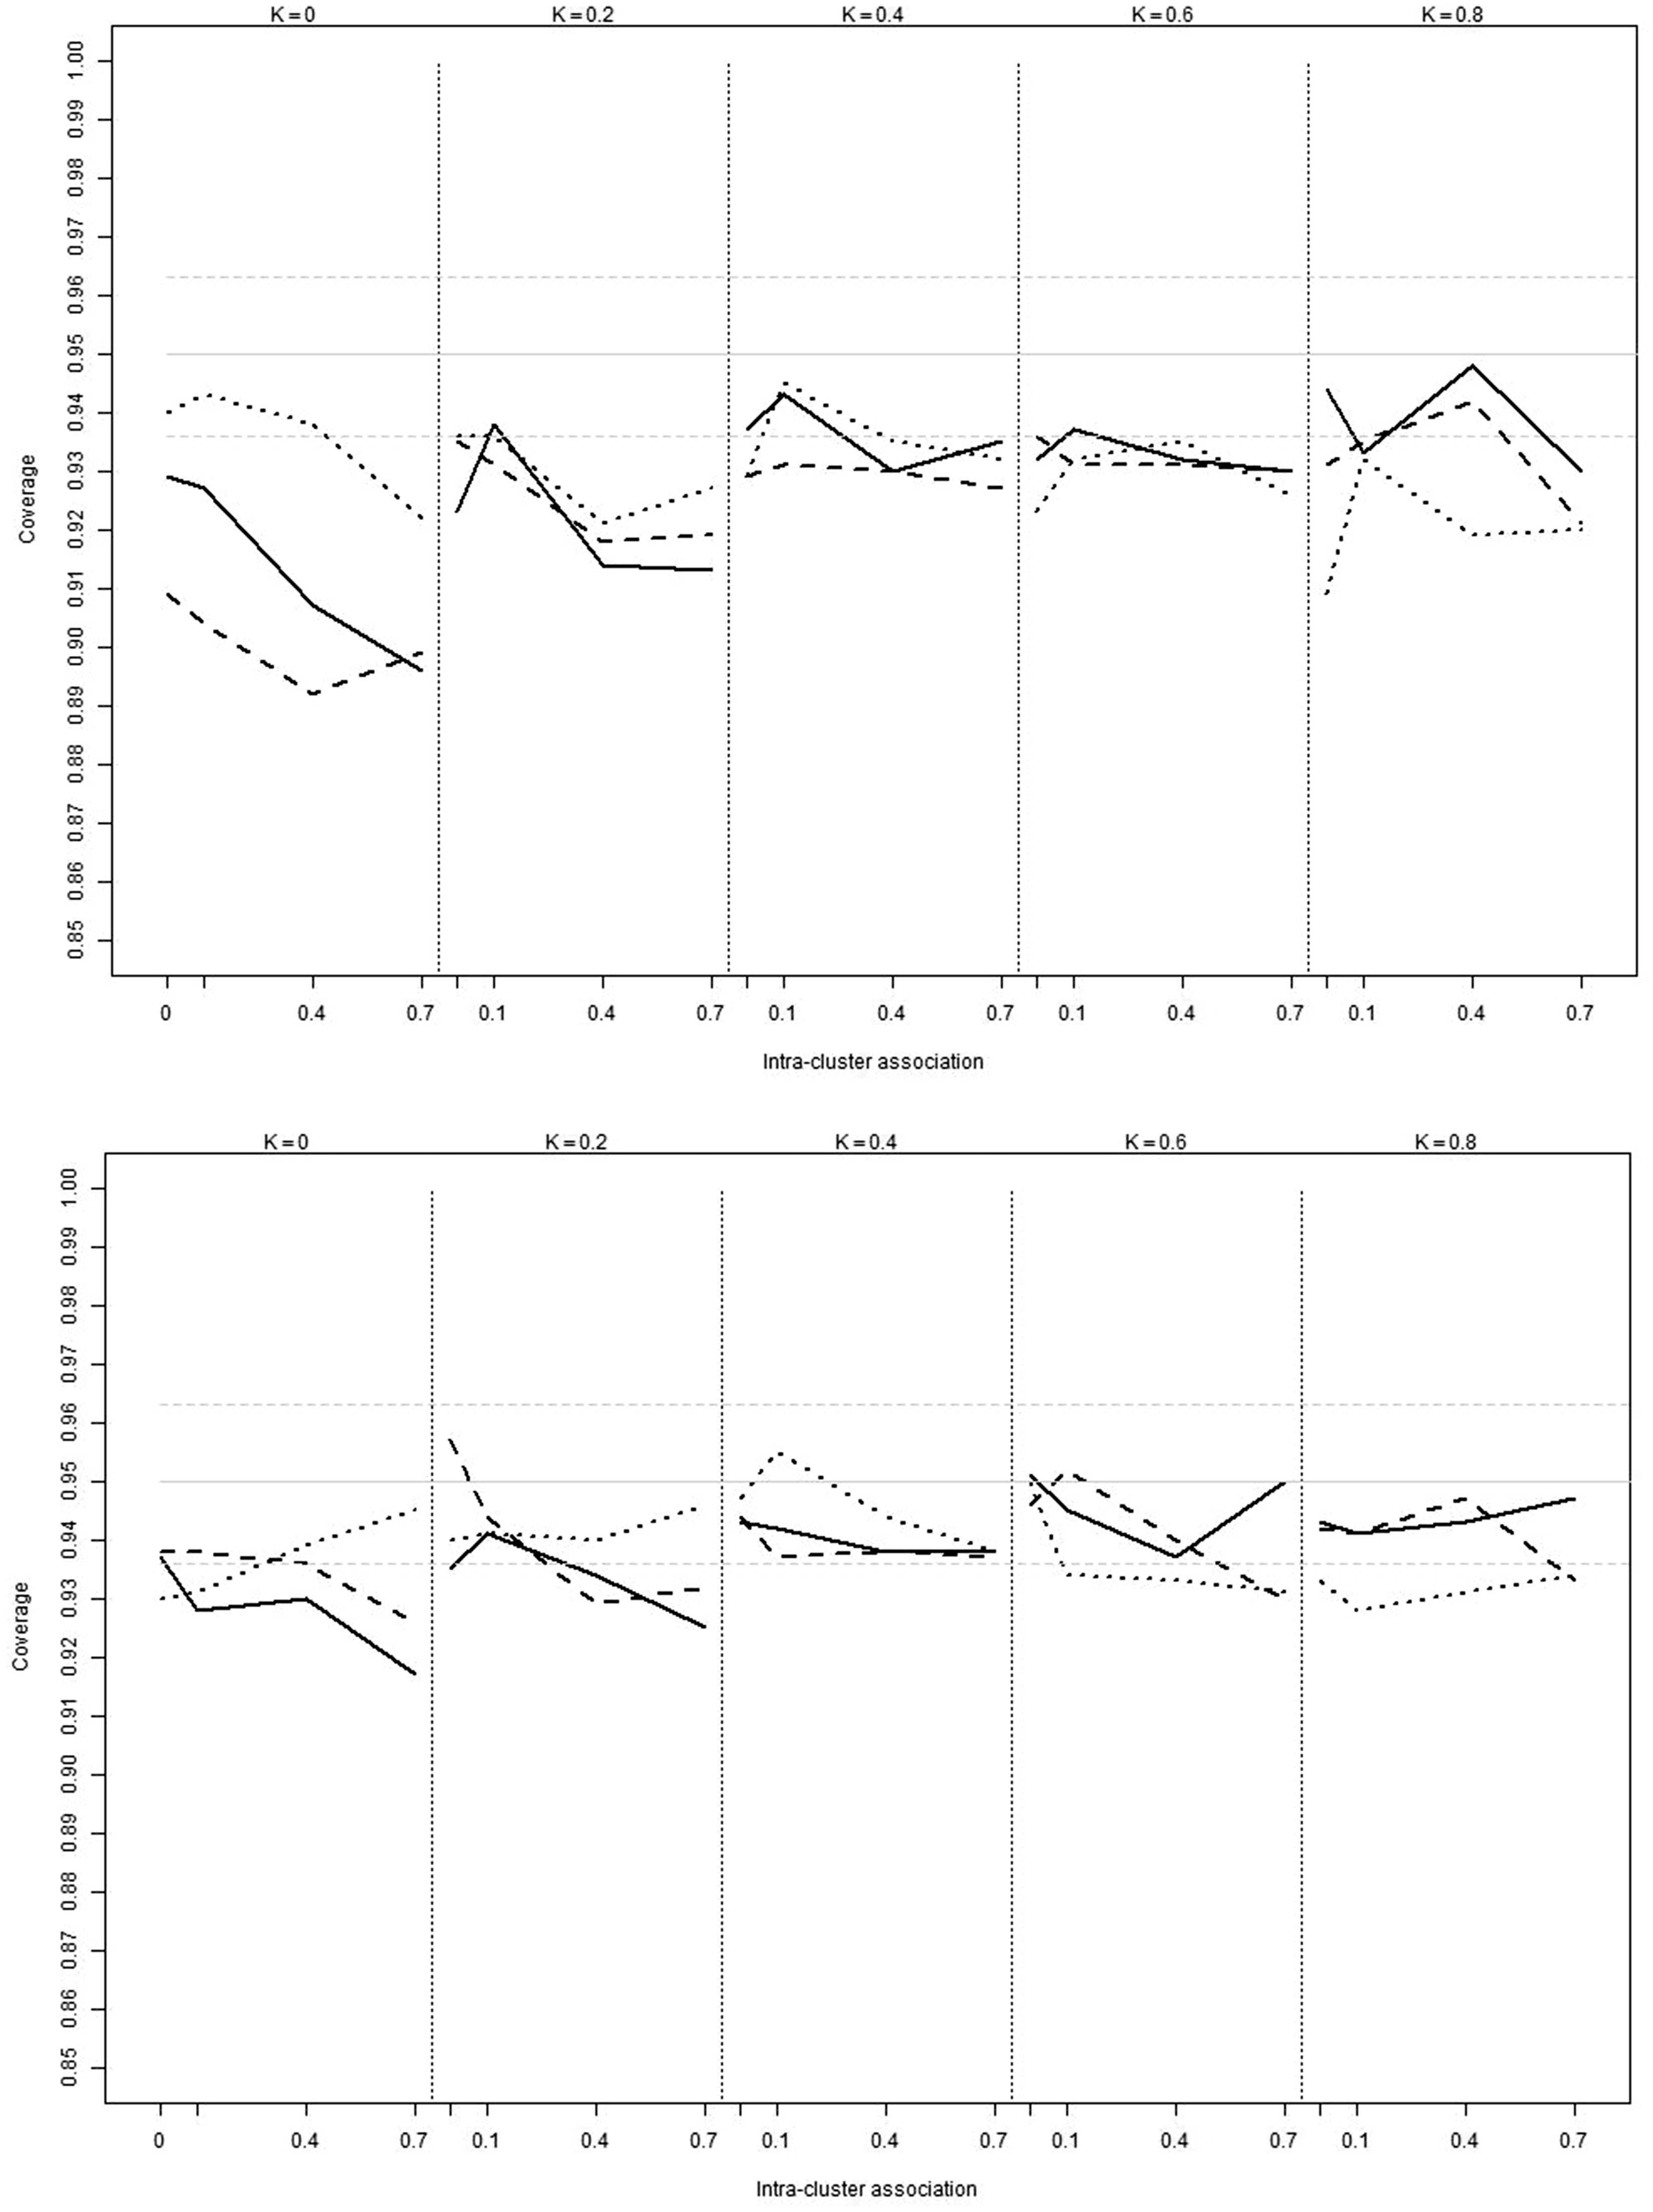
As seen in Figure 2, the coverage level becomes closer to the nominal level when the value of Conger coefficient increases, when the intra-cluster association level decreases and when the number of observers decreases. The coverage level was generally within the 95% confidence interval for kappa values above 0.4 and a number of clusters larger than 50. Here too, the percentile cluster bootstrap method provides better coverage levels for high agreement values when the number of clusters is small (see Supplemental material, C = 25).
6 Examples
6.1 Psychiatric diagnosis
Fleiss example.
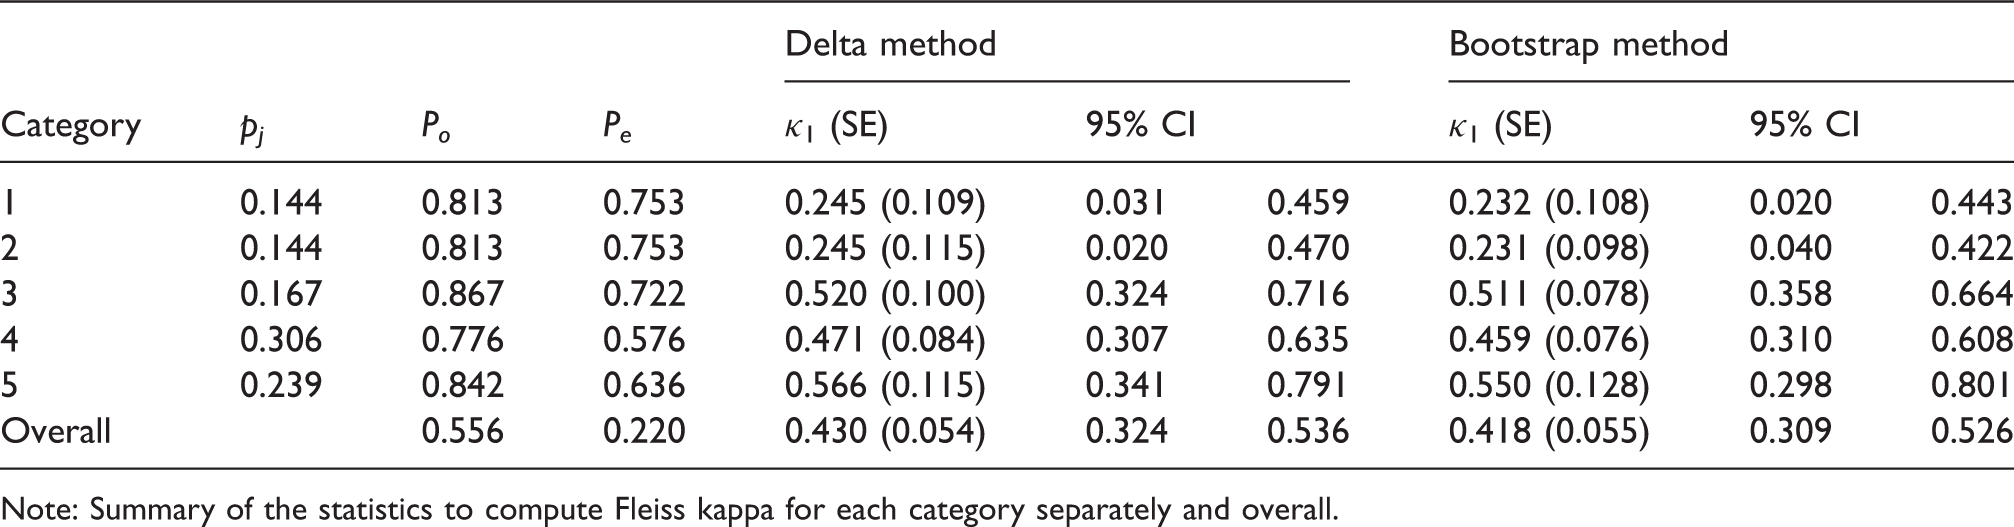
Note: Summary of the statistics to compute Fleiss kappa for each category separately and overall.
Fleiss’ conclusion was that agreement was better than chance for all categories. While 0 is indeed not included in the confidence interval for each of the five categories, the lower confidence bound is close to 0 for categories 1 and 2 (see Table 1). The observed agreement Po varies between 0.78 and 0.87, meaning that when isolating one category, pairs of observers agree, on average, on 78–87% of the patients. However, when considering the five diagnostic categories together, this percentage drops to 56%. This suggests that agreement, when isolating one category, does not mainly occur on the isolated category but rather in the category mixing the other four diagnostic categories. If we focus on the interpretation of the confidence interval for Fleiss kappa coefficient (0.33–0.53), it can be concluded that we are 95% confident that the actual proportion of disagreement is between (1–0.53)100 = 47% and (1–0.33)100 = 67% lower than the proportion of disagreement expected under the independence assumption of the observers. Both observed agreement and Fleiss kappa coefficients therefore indicate a non-negligible variability in the psychiatric diagnostic within groups of observers.
6.2 Tromsø study (multilevel)
Lung auscultation is routinely used in daily clinical practice by health professionals. While new methodology of chest imaging such as MRI, CT scans and portable ultrasound are now available, the stethoscope remains advantageous when it comes to costs, availability, patient care and training of health professionals to use it. Lung auscultation has proven to be helpful in the diagnosis of several lung and heart related conditions as a part of routine physical examination. However, there is a lack of information about how the presence of wheezes or crackles relates to common heart and lung diseases and the prognostic value these findings might have.
The Tromsø study is a population-based study designed to evaluate abnormal auscultation findings against a wide range of clinical and epidemiological endpoints. Due to the subjective nature of evaluating sounds, the inter-observer agreement among medical professionals in classifying lung sounds was studied before the implementation of the Tromsø study. 27
Seven groups of four observers were asked to assess the presence of crackles and wheezes on the lung sounds of 20 subjects: general practitioners (GPs) from The Netherlands (NLD), Wales (WAL), Russia (RUS), and Norway (NOR), pulmonologists working at the University Hospital of North Norway (PLN), sixth year medical students (STU) at the Faculty of Health Sciences in Tromsø and an international group of experts (researchers) in the field of lung sounds (EXP). Lung sounds were recorded at six different locations, three locations on each side of the thorax (Anterior thorax (A), upper posterior thorax (U) and lower posterior thorax (L)), leading to a multilevel data structure. A more detailed description of the study can be found in Aviles et al. 27
Tromsø example.
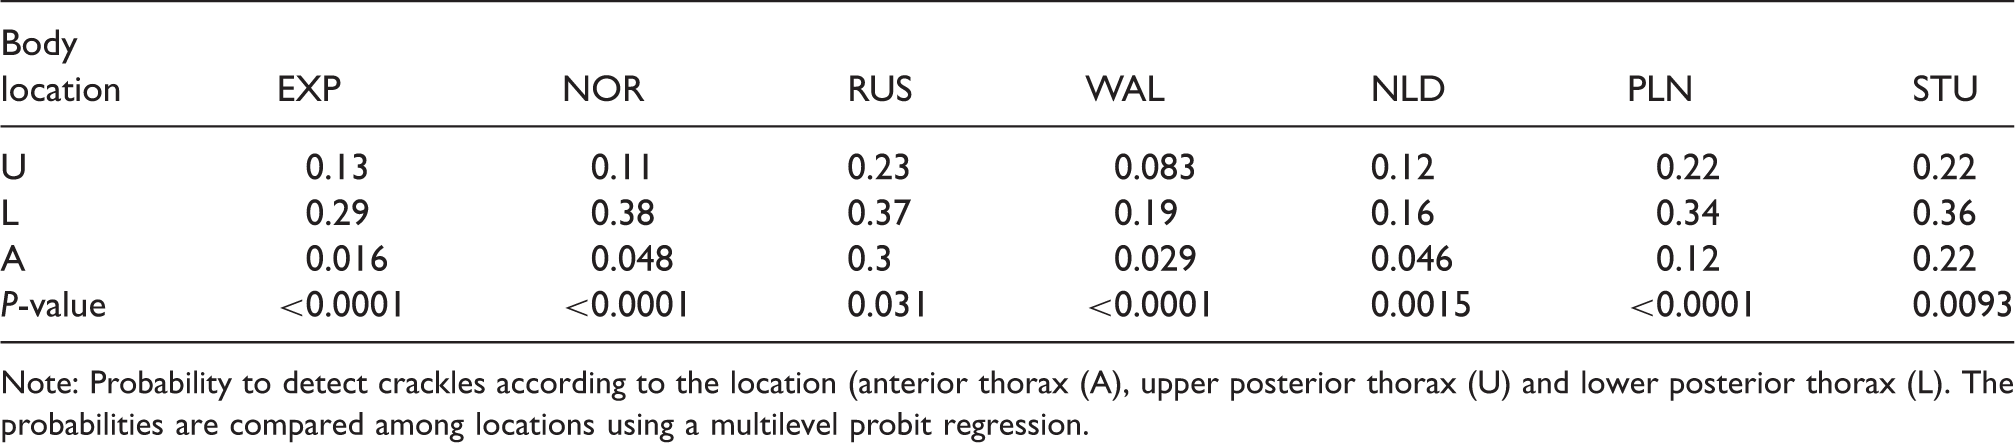
Note: Probability to detect crackles according to the location (anterior thorax (A), upper posterior thorax (U) and lower posterior thorax (L). The probabilities are compared among locations using a multilevel probit regression.
Tromsø example.
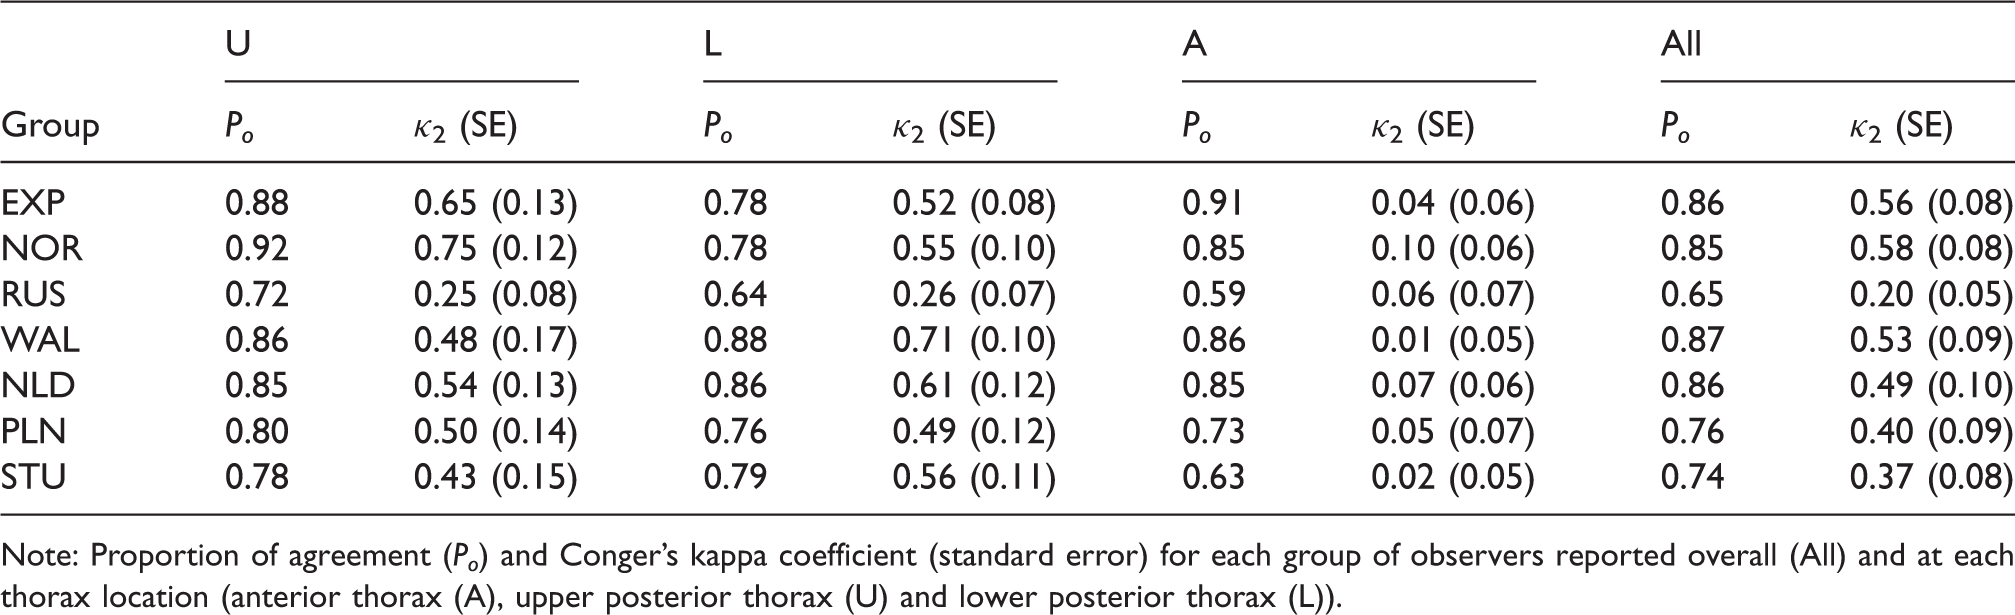
Note: Proportion of agreement (Po) and Conger’s kappa coefficient (standard error) for each group of observers reported overall (All) and at each thorax location (anterior thorax (A), upper posterior thorax (U) and lower posterior thorax (L)).
When looking at the individual thorax locations, it can be seen in Table 3 that on average, pairs of general practitioners (NOR, WAL, NLD) agree on the classification of more than 78% of the sounds, independently of the thorax location except for Russian GPs (RUS) where pairs agree, on 59% to 72% of the sounds. This lower agreement level might partially be explained by a confusion with the English nomenclature around the term crackles (see Aviles et al. 27 for more details). The experts agree on average on 78–91% of the sounds, the pulmonologists on 73–80% and the students on 63–79%, depending on the location of the auscultation. These agreement proportions translate to relatively low Conger kappa coefficients, especially in the anterior thorax location. This can be explained by the low probabilities of detecting crackles (see Table 2) combined with the small sample size. The misclassification of one sound in fact represents a disagreement on 5% of the sounds. The overall and per location multirater agreement levels within groups of GPs were considered satisfactory by the researchers for using lung auscultation in the Tromsø study.
7 Discussion
In this paper, the asymptotic formula of the standard error of Fleiss and Conger kappa coefficients using the delta method was presented in a unified framework. The formula was extended to account for multilevel data structures. The formula only involves simple matrix calculations and can be easily implemented in practice. A
The scope of this paper was limited to Fleiss and Conger kappa coefficients for two reasons. First, they cover two study designs frequently encountered in practice. Second, both are asymptotically equivalent to ICCs for agreement. Fleiss kappa coefficient was developed as an agreement measure under a one-way ANOVA model, i.e. when the objects are rated by different sets of observers. On the other hand, Conger kappa was developed as an agreement measure under a two-way ANOVA model, i.e. when all objects are rated by the same set of observers. The choice between these two agreement coefficients should therefore be primarily based on the study design.
Two assumptions were made to ensure the existence of an overall multirater multilevel kappa coefficient, i.e. the homogeneity of the members of a cluster and the existence of a common kappa coefficient across the clusters. When there is evidence that the assumptions do not hold, as discussed by Yang and Zhou, 18 a separate multirater multilevel kappa coefficient should be computed for each sub-population identified. In the same way, if sub-groups of observers are identified, it is better to compute agreement separately within the different groups. 14
The multilevel delta method, although asymptotic, showed similar coverage levels than the clustered bootstrap method. In the presence of more than two observers, good statistical performances of the delta method were observed for moderate number of clusters (e.g. C = 50) and multilevel kappa coefficients higher than 0.4, disregarding the cluster size. For two observers, good statistical properties were observed already for small sample sizes (C = 25). When the sample size is small, confidence intervals based on the percentile clustered bootstrap method provide better coverage levels for high kappa coefficients (
One extension of the methods presented in this paper is also implemented in the R package ‘multiagree’. The results in this paper were combined with the results in Vanbelle 20 to allow the comparison of several (multilevel) multirater agreement coefficients. A further extension could be the inclusion of agreement weights when computing multilevel multirater agreement coefficients.
To summarise, this paper provides two simple methods to compute the standard error of the multirater kappa coefficients that perform well when the number of clusters is moderate (C = 50). Only the percentile clustered bootstrap method provided satisfactory coverage levels when the number of clusters was small (C = 25) and the agreement was high (
Supplemental Material
Supplemental Figures - Supplemental material for Asymptotic variability of (multilevel) multirater kappa coefficients
Supplemental material, Supplemental Figures for Asymptotic variability of (multilevel) multirater kappa coefficients by Sophie Vanbelle in Statistical Methods in Medical Research
Supplemental Material
Supplemental material1 - Supplemental material for Asymptotic variability of (multilevel) multirater kappa coefficients
Supplemental material, Supplemental material1 for Asymptotic variability of (multilevel) multirater kappa coefficients by Sophie Vanbelle in Statistical Methods in Medical Research
Supplemental Material
Supplemental material2 - Supplemental material for Asymptotic variability of (multilevel) multirater kappa coefficients
Supplemental material, Supplemental material2 for Asymptotic variability of (multilevel) multirater kappa coefficients by Sophie Vanbelle in Statistical Methods in Medical Research
Footnotes
Acknowledgments
The author is grateful to Dr. Juan Carlos Aviles (Department of Community Medicine, Tromsø university) and Pr. Hasse Melbye (General practice research unit, Tromsø university) for providing the data of the Tromsø example. The author thanks the two anonymous reviewers whose constructive remarks improved the manuscript.
Declaration of conflicting interests
The author(s) declared no potential conflicts of interest with respect to the research, authorship, and/or publication of this article.
Funding
The author(s) disclosed receipt of the following financial support for the research, authorship, and/or publication of this article: This research is part of project 451-13-002 funded by the Netherlands Organisation for Scientific Research.
Supplemental material
Supplemental material for this article is available online.
Appendix 1. Multilevel Fleiss kappa coefficient
References
Supplementary Material
Please find the following supplemental material available below.
For Open Access articles published under a Creative Commons License, all supplemental material carries the same license as the article it is associated with.
For non-Open Access articles published, all supplemental material carries a non-exclusive license, and permission requests for re-use of supplemental material or any part of supplemental material shall be sent directly to the copyright owner as specified in the copyright notice associated with the article.