
Abstract
Attrition is a common occurrence in cluster randomised trials which leads to missing outcome data. Two approaches for analysing such trials are cluster-level analysis and individual-level analysis. This paper compares the performance of unadjusted cluster-level analysis, baseline covariate adjusted cluster-level analysis and linear mixed model analysis, under baseline covariate dependent missingness in continuous outcomes, in terms of bias, average estimated standard error and coverage probability. The methods of complete records analysis and multiple imputation are used to handle the missing outcome data. We considered four scenarios, with the missingness mechanism and baseline covariate effect on outcome either the same or different between intervention groups. We show that both unadjusted cluster-level analysis and baseline covariate adjusted cluster-level analysis give unbiased estimates of the intervention effect only if both intervention groups have the same missingness mechanisms and there is no interaction between baseline covariate and intervention group. Linear mixed model and multiple imputation give unbiased estimates under all four considered scenarios, provided that an interaction of intervention and baseline covariate is included in the model when appropriate. Cluster mean imputation has been proposed as a valid approach for handling missing outcomes in cluster randomised trials. We show that cluster mean imputation only gives unbiased estimates when missingness mechanism is the same between the intervention groups and there is no interaction between baseline covariate and intervention group. Multiple imputation shows overcoverage for small number of clusters in each intervention group.
Keywords
1 Introduction
In cluster randomised trials (CRTs), identifiable clusters of individuals such as villages, schools, medical practices – rather than individuals – are randomly allocated to each of intervention and control groups, while individual-level outcomes of interest are observed within each cluster. The number of clusters and/or the cluster sizes in each intervention group might be different. CRTs with equal number of clusters in each intervention group with constant cluster size are known as balanced CRTs. One important characteristic of CRTs is that the outcomes of individuals within the same cluster may exhibit more similarity compared to the outcomes of individuals in the other clusters, which is quantified by the intraclass correlation coefficient (ICC), denoted by ρ. In practice, the value of ICC typically ranges from 0.001 to 0.05 and it is rare for clinical outcomes to have ICC above 0.1. 1 Small values of ICC can lead to substantial variance inflation factors and should not be ignored.2,3 CRTs are being increasingly used in the fields of health promotion and health service research. Reasons for such popularity include the nature of intervention that itself may dictate its application at the cluster level, less risk of intervention contamination and administrative convenience. 4 It is well known that the power and precision of CRTs are lower relative to trials that individually randomise the same number of individuals. 2 In spite of this, the advantages associated with CRTs are perceived by researchers to outweigh the potential loss of statistical power and precision in some situations.
Attrition is a common problem for CRTs, leading to missing outcome data. This not only reduces the statistical power of the study but may result in biased intervention effect estimates. 5 Handling missing data in CRTs is complicated by the fact that data are clustered. Inadequate handling of the missing data may result in misleading inferences. 6 A systematic review 7 revealed that, among all CRTs published in English in 2011, 72% of trials had missing values either in outcomes or in covariates or in both. Among them only 34% of CRTs reported how they handled missing data. One of the reasons may be that the methodological development for dealing with missing data in CRTs has been relatively slow in spite of the increasing popularity of CRTs. Cluster mean imputation has been suggested as a valid approach for handling missing outcome data in CRTs. 8
The impact of missing data on estimation and inference of a parameter of interest depends on the missing data mechanism, the method used to handle the missing data, and the choice of statistical methods used for data analysis. In this paper, we study the validity of three analysis methods – unadjusted cluster-level analysis, adjusted cluster-level analysis and linear mixed model (LMM) – when there is missingness in the continuous outcome, and this missingness depends on baseline covariates, and conditional on these baseline covariates, not on the outcomes itself. We compare the performance of these methods on complete records and multiply imputed datasets. In addition, we investigate the validity of cluster mean imputation, as proposed by Taljaard et al., 8 under the same missingness assumption.
This paper is organised as follows. Section 2 presents a brief review of the approaches to the analysis of CRTs with complete data. In Section 3, the assumed missingness mechanism for CRTs is described. Section 4 describes methods of handling missing data in CRTs. In Section 5, we investigate the validity of complete records analysis of CRTs. Section 6 describes a simulation study and presents the results. We conclude the study with some discussion in Section 7.
2 Analysis of CRTs with complete data
We begin by describing the two broad approaches to the analysis of CRTs in the absence of missing data. These are cluster-level analysis and individual-level analysis.
2.1 Cluster-level analysis
Cluster-level analysis can be done in two ways: unadjusted cluster-level analysis and baseline covariate adjusted cluster-level analysis. This approach can be explained as a two-stage process. In the first stage of unadjusted analysis, a relevant summary measure of outcomes is calculated for each cluster. Then, in the second stage, the cluster-specific summary measures of the control and intervention groups obtained in the first stage are compared using appropriate statistical methods. The most common one is the standard t-test for two independent samples (here referred to as cluster-level t-test) with degrees of freedom (DF) equal to the total number of clusters in the study minus two. The basis of using this test is that the resulting summary measures are statistically independent, which is a consequence of the clusters being independent of each other. In the case of baseline covariate adjusted analysis, an individual-level regression analysis is carried out at the first stage including all covariates as explanatory variables, except for the intervention indicator, and ignoring the clustering of the data.4,9 The individual level residuals from the first-stage model are then used to calculate the cluster-specific summary measures for the control group and the intervention group, which are then compared using cluster-level t-test in the second stage of analysis to evaluate the intervention effect adjusted for baseline covariates. The main purposes of adjusting for baseline covariates are to increase the credibility of the trial findings by demonstrating that any observed intervention effect is not attributed to the possible imbalance between the intervention groups in term of baseline covariates and to improve the statistical power. 10
2.2 Individual-level analysis
In individual-level analysis, a regression model is fitted to the individual-level outcomes, allowing for the fact that observations within the same cluster are correlated. LMM is widely used as individual-level analysis for CRTs with continuous outcomes. The LMM takes into account between-cluster variability using cluster-level effects which are assumed to follow a specified probability distribution. The parameters of that distribution are estimated using maximum likelihood methods together with intervention effect and other covariates effects. Generalised estimating equations are an alternative approach, but for continuous outcomes and an exchangeable correlation matrix, estimates are identical to those from LMM with a random intercept. 11
The adjusted t-test, proposed by Donner and Klar, 2 is an alternative approach to test the intervention effect for quantitative outcomes, which involves calculating the mean of the individual outcome values in each intervention group. These means are then compared using a t-test in which the standard error (SE) is adjusted to account for the intracluster correlation. The adjusted t-test and the cluster-level t-test are identical for balanced CRTs.
3 Missingness mechanism assumptions for CRTs
In this paper, we will consider the common setting where the outcomes are continuous, and only outcomes are missing. In statistical analysis, if there are missing values, an assumption must be made about the missingness mechanism, which refers to the relationship between missingness and the underlying values of the variables in the data. 12 According to Rubin’s framework, 13 a missingness mechanism can be classified as (i) missing completely at random (MCAR), where the probability of a value being missing is independent of the observed and unobserved data; (ii) missing at random (MAR), where conditioning on the observed data, the probability of a value being missing is independent of the unobserved data; and (iii) missing not at random (MNAR), where the probability of value being missing depends on both observed and unobserved data.
In CRTs, an assumption that may sometimes be plausible is that missingness in outcomes depends on covariates measured at baseline and conditional on these baseline covariates, not on the outcome itself. We refer to this as covariate dependent missingness (CDM). For example, blood pressure outcome data could be CDM if missingness in blood pressure measurement depends on covariates (e.g. age, BMI or weight), but given these, not on the blood pressure measurement itself. CDM is an example of a MAR mechanism when covariates are fully observed.
Let Yijl be a continuous outcome of interest for the lth

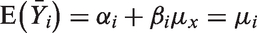
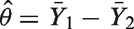
With complete data, this estimator is unbiased for the true intervention effect, that is
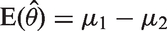
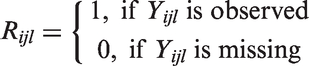
Suppose there are some missing values for outcome Y. Define a missing data indicator Rijl such that

4 Methods of handling missing data in CRTs
Common approaches for handling missing data in CRTs include complete records analysis (CRA), single imputation and multiple imputation (MI). This section describes these approaches. In this paper, we focused on CRA and MI since they are the most commonly used methods for handling missing data.
4.1 CRA
In CRA, often referred to as complete case analysis, only individuals with outcome observed are considered in the analysis, while individuals with missing outcome are excluded. It is widely used because of its simplicity and is usually the default method of most statistical packages. It is well known that CRA is valid if data are MCAR or if missingness is independent of the outcome, conditional on covariates. 12 Likelihood-based CRA is valid under MAR, if missingness is only in the outcome and all predictors of missingness are conditioned on in the model. 12 CRA is also valid under MNAR mechanisms where missingness in a covariate is dependent on the value of that covariate, but is conditionally independent of outcome.14,15
4.2 Single imputation
Single imputation imputes a single value for each missing outcome and creates a complete dataset. In general, single imputation is not recommended, since estimates of uncertainty are biased downwards, leading to anti-conservative inferences. However, for CRTs two choices for single imputation are group mean imputation and cluster mean imputation. 8 In the first case, missing outcomes in each intervention group are replaced by the mean outcome calculated using complete records pooled across clusters of that group. This approach reduces the variability among the clusters means and, therefore, gives inflated Type I error. 8 In cluster mean imputation, missing outcomes in each cluster are replaced by the mean outcome calculated using complete records of that cluster. This approach has been suggested as a good approach for handling missing outcomes by Taljaard et al. 8 They showed that cluster mean imputation gives Type I error close to nominal level under MCAR, using adjusted t-test with balanced CRTs. However, under MAR or CDM, adjusted t-test with cluster mean imputation may not be valid. We note that, with balanced CRTs, the cluster-level t-test and the adjusted t-test are identical with cluster mean imputation since after imputation the cluster sizes become constant and the cluster means remain unchanged by the imputation. Consequently, our later results for the validity of cluster level t-test can also be applied to infer the validity of results after using cluster mean imputation. One additional problem with cluster mean imputation is that it distorts the estimates of between-cluster variability and within-cluster variability, which often are of interest.
4.3 MI
MI, first proposed by Rubin,
16
is a method of filling in the missing outcomes multiple times by simulating from an appropriate model. The aim of imputing multiple times is to allow for the uncertainty about the missing outcomes due to the fact that the imputed values are sampled draws for the missing outcomes. A sequence of Q imputed datasets is obtained by replacing each missing outcome by a set of

In CRTs,
When


Taljaard et al. 8 examined the performance of MI in a simple setup considering balanced CRTs where there are no covariates except intervention indicator using standard regression imputation, which ignores clustering, and random effects MI which does account for intraclass correlation. They also considered the Approximate Bayesian Bootstrap (ABB) procedure, proposed by Rubin and Schenker, 19 as a non-parametric MI. In ABB, sampling from the posterior predictive distribution of missing data is approximated by first generating a set of plausible contributors drawn with replacement from the observed data, and then imputed values are drawn with replacement from the possible contributors. Two possible uses of ABB in CRTs are pooled ABB and within-cluster ABB, where the set of possible contributors are sampled from all observed values across the clusters in each group or from observed values in the same cluster, respectively. They showed that none of these four MI procedures tend to yield better power compared to the power of adjusted t-test using no imputation and cluster mean imputation under MCAR.
We note that in the case of missing outcome under MAR for individually randomised trials, Groenwold et al. 20 showed that CRA with covariate adjustment and MI give similar estimates so long as the same set of predictors of missingness is used. It can be anticipated that similar result holds for CRTs. An obvious advantage of CRA over MI is that it is much easier to apply, and therefore in situations where they are equivalent, CRA is clearly preferable.
5 Validity of CRA of CRTs
In this section, we describe the unadjusted cluster-level analysis, baseline covariate adjusted cluster-level analysis and LMM analysis methods using complete records, and derive conditions under which they give valid inferences under the CDM assumption.
5.1 Unadjusted cluster-level analysis using complete records
The mean of the observed outcomes in the ith intervention group can be calculated as


A sufficient condition for equation (8) to hold is that
5.2 Adjusted cluster-level analysis using complete records
Recall that the first step of the adjusted cluster-level analysis involves fitting a regression model for Y with X as covariate, but ignoring the intervention indicator and clustering of the data. The residual


The variance of the estimator (9) can be written as (see Appendix 2 for derivation)

This shows that when
5.3 LMM using complete records
Let Z be the intervention indicator which is zero for control group and is one for intervention group. When it is assumed that the two intervention groups have the same covariate effects on outcome, we fit a LMM with fixed effects of X and Z, and a random effect for cluster. Then the estimate of the coefficient of Z will be the estimated intervention effect accounting for X.
If one thinks that the baseline covariate effects on outcome could be different in the two intervention groups and there are missing outcome values, an interaction of X and Z must be included in the model. This implies that the intervention effect varies with X. Then the estimate of the intervention effect at the mean value of X is an estimate of the average intervention effect. Let
In the general theory of LMM, the variances of the fixed effects parameter estimates, which are calculated based on their asymptotic distributions, are known to be underestimated for small sample sizes.
21
In this paper, we used quantiles from t-distribution with DF
6 Simulation study
A simulation study was conducted to investigate the performance of unadjusted cluster-level analysis, baseline covariate adjusted cluster-level analysis and LMM using CRA under baseline CDM in outcomes. We also investigated whether there is any gain using MI over CRA. The average estimate of intervention effect, its average estimated SE and coverage probability were calculated and compared. We considered balanced CRTs, where the two intervention groups have equal number of clusters
6.1 Data generation and analysis
For each individual in the study a single covariate value X was generated independently as


Four possible scenarios were considered:
In the first and third scenarios, there was 30% missing outcomes in both the intervention groups. In the second and fourth scenarios, there was 30% missing outcomes in the control group and 60% missing outcomes in the intervention group. Each generated incomplete dataset was then analysed using unadjusted cluster-level analysis, baseline covariate adjusted cluster-level analysis and LMM using complete records. We included the interaction between intervention and covariate into the LMM in the third and fourth scenarios, where the two intervention groups have different covariate effects on outcome in the data-generating model for outcome.
The R package jomo
24
was used to multiply impute each generated incomplete dataset using MI with number of imputations 20. A random intercept LMM was used as the imputation model so that the imputation model was correctly specified. We used 200 burn-in iterations and 10 iterations between two successive draws after examining, respectively, the convergence of the posterior distributions of the parameters estimates of the imputation model and the plots of their autocorrelation functions. The completed datasets were then analysed using LMM. An interaction between intervention and baseline covariate was included in both the imputation model and the analysis model when the two intervention groups have different covariate effects on outcome in the data-generating model. We always used restricted maximum likelihood estimation method to fit the LMM. The Wald t-test with adjusted DF, given in equation (3), with
6.2 Results
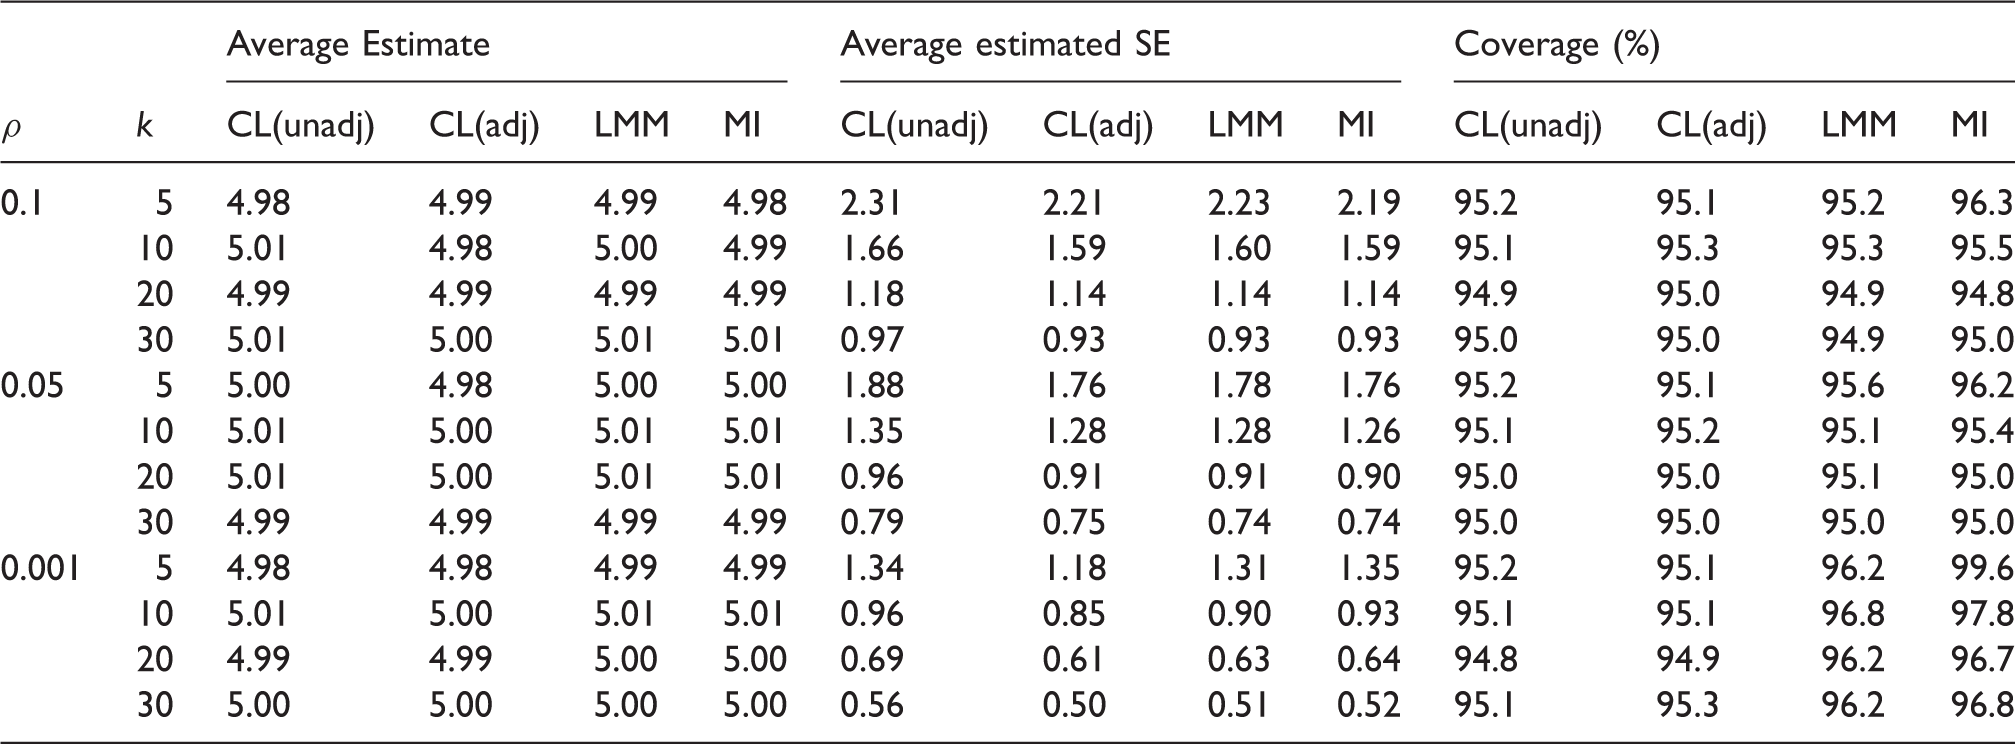
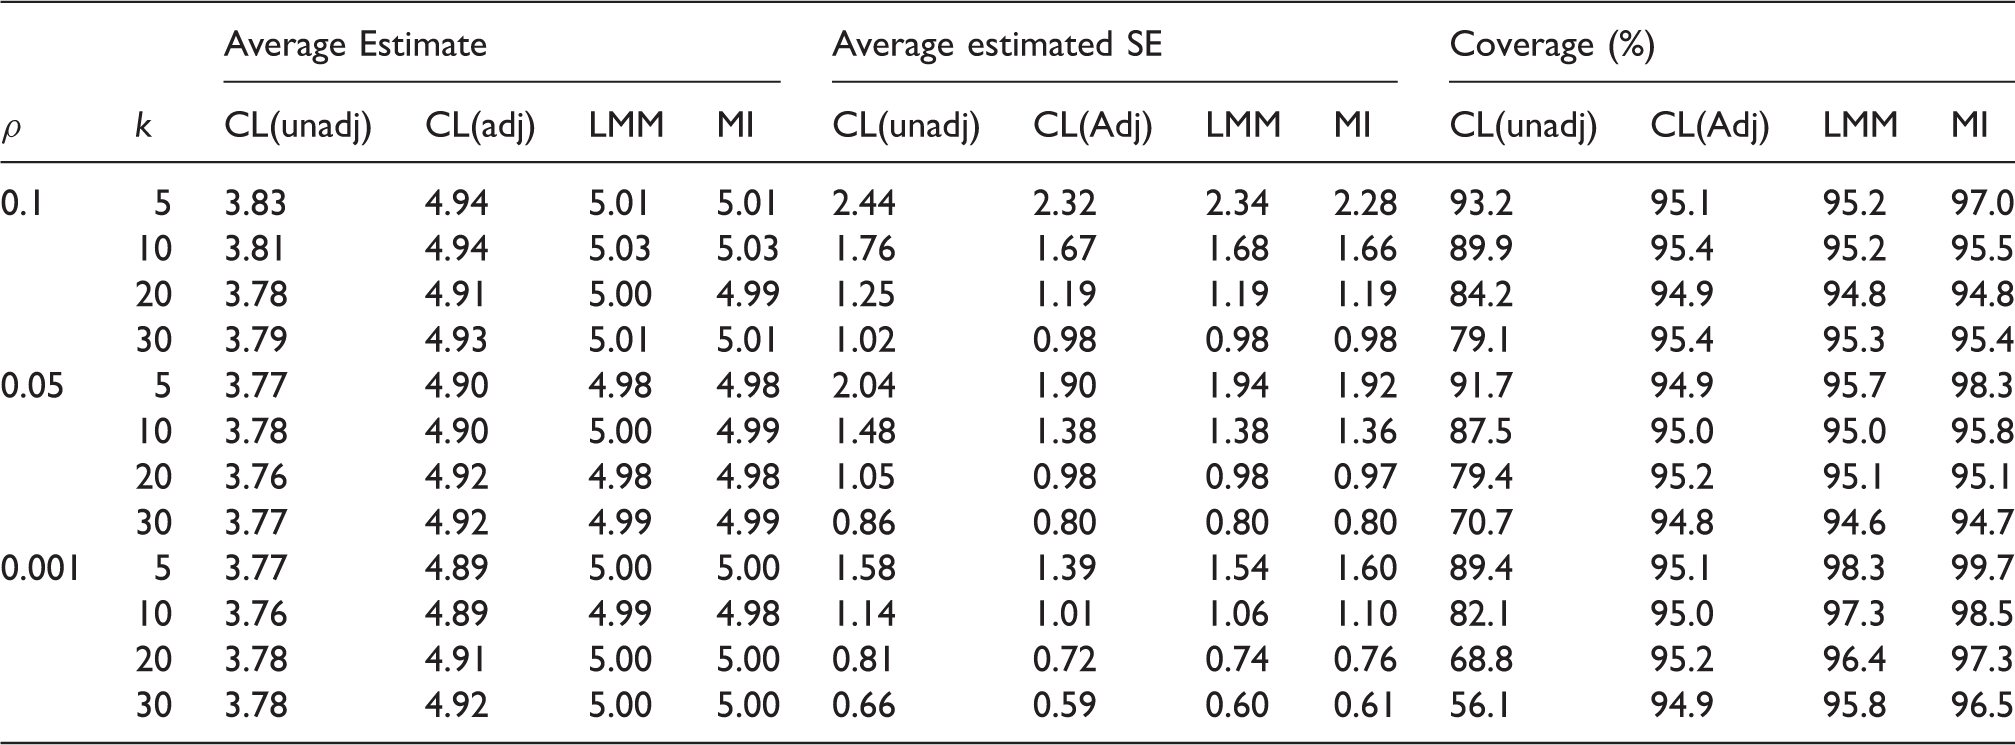
Simulation results-missingness mechanism is the same between the intervention groups and there is no interaction between intervention and baseline covariate in the data-generating model for outcome. Empirical average estimates of intervention effect, average estimated SEs and coverage probabilities of nominal 95% confidence interval over 10,000 simulation runs for unadjusted cluster-level analysis (CL(unadj)), baseline covariate adjusted cluster-level analysis (CL(adj)) and linear mixed model (LMM), using CRA and MI. Monte Carlo errors for average estimates and average estimated SEs are all less than 0.023 and 0.016, respectively. The true value of the intervention effect is 5.
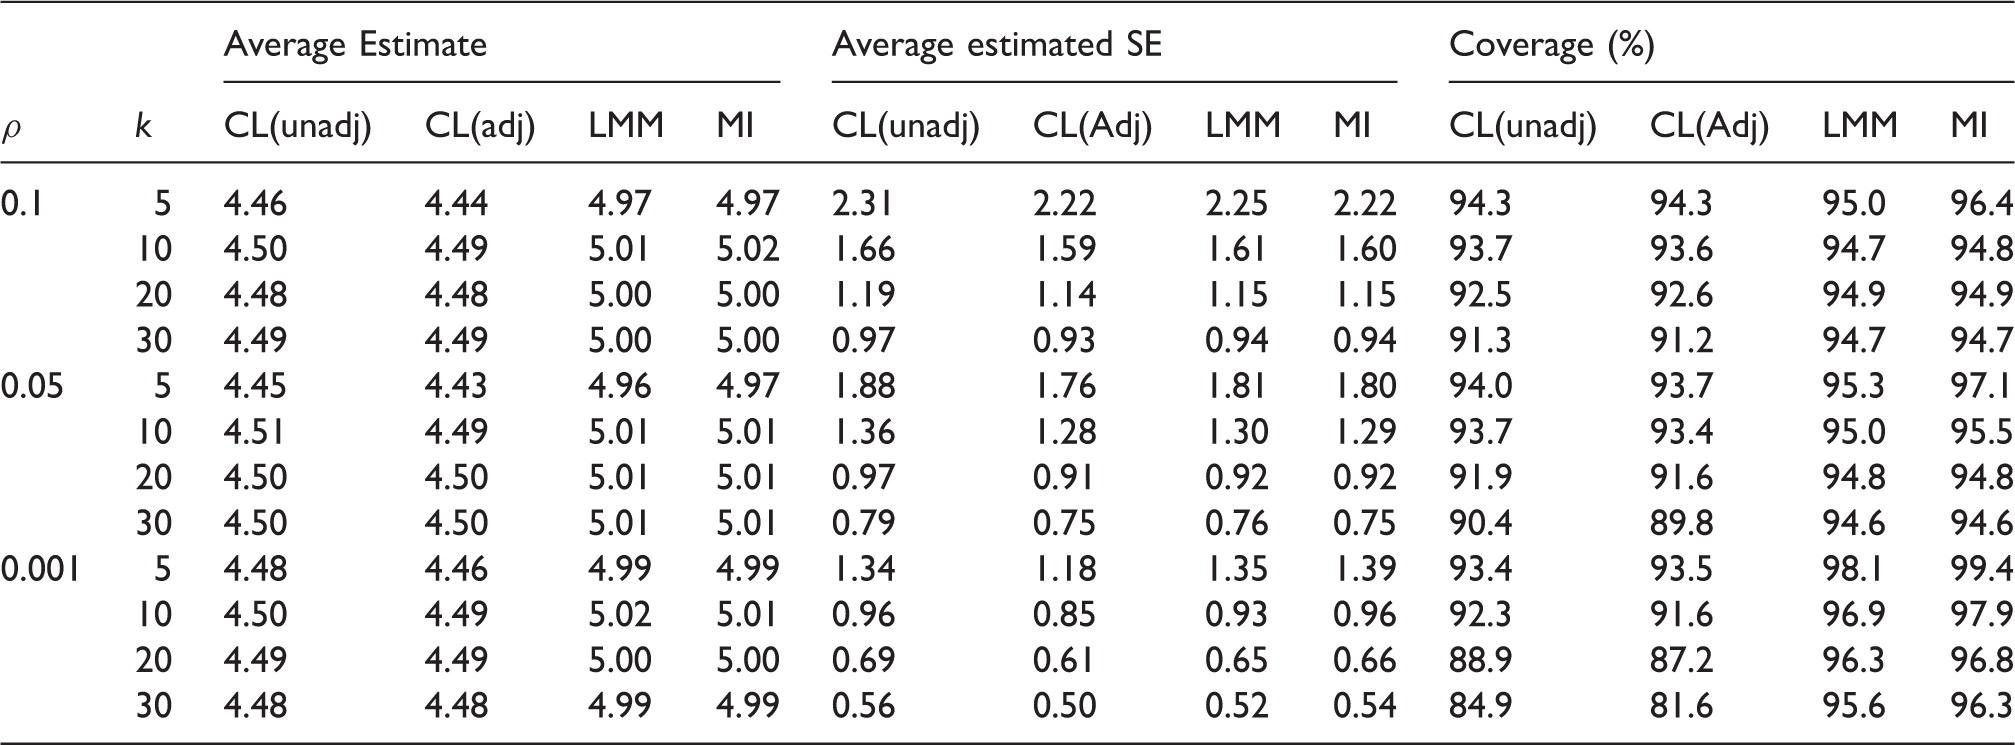
Simulation results-missingness mechanism is different between the intervention groups and there is no interaction between intervention and baseline covariate in the data-generating model for outcome. Empirical average estimates of intervention effect, average estimated SEs and coverage probabilities of nominal 95% confidence interval over 10,000 simulation runs for unadjusted cluster-level analysis (CL(unadj)), baseline covariate adjusted cluster-level analysis (CL(adj)) and linear mixed model (LMM), using CRA and MI. Monte Carlo errors for average estimates and average estimated SEs are all less than 0.025 and 0.017, respectively. The true value of the intervention effect is 5.
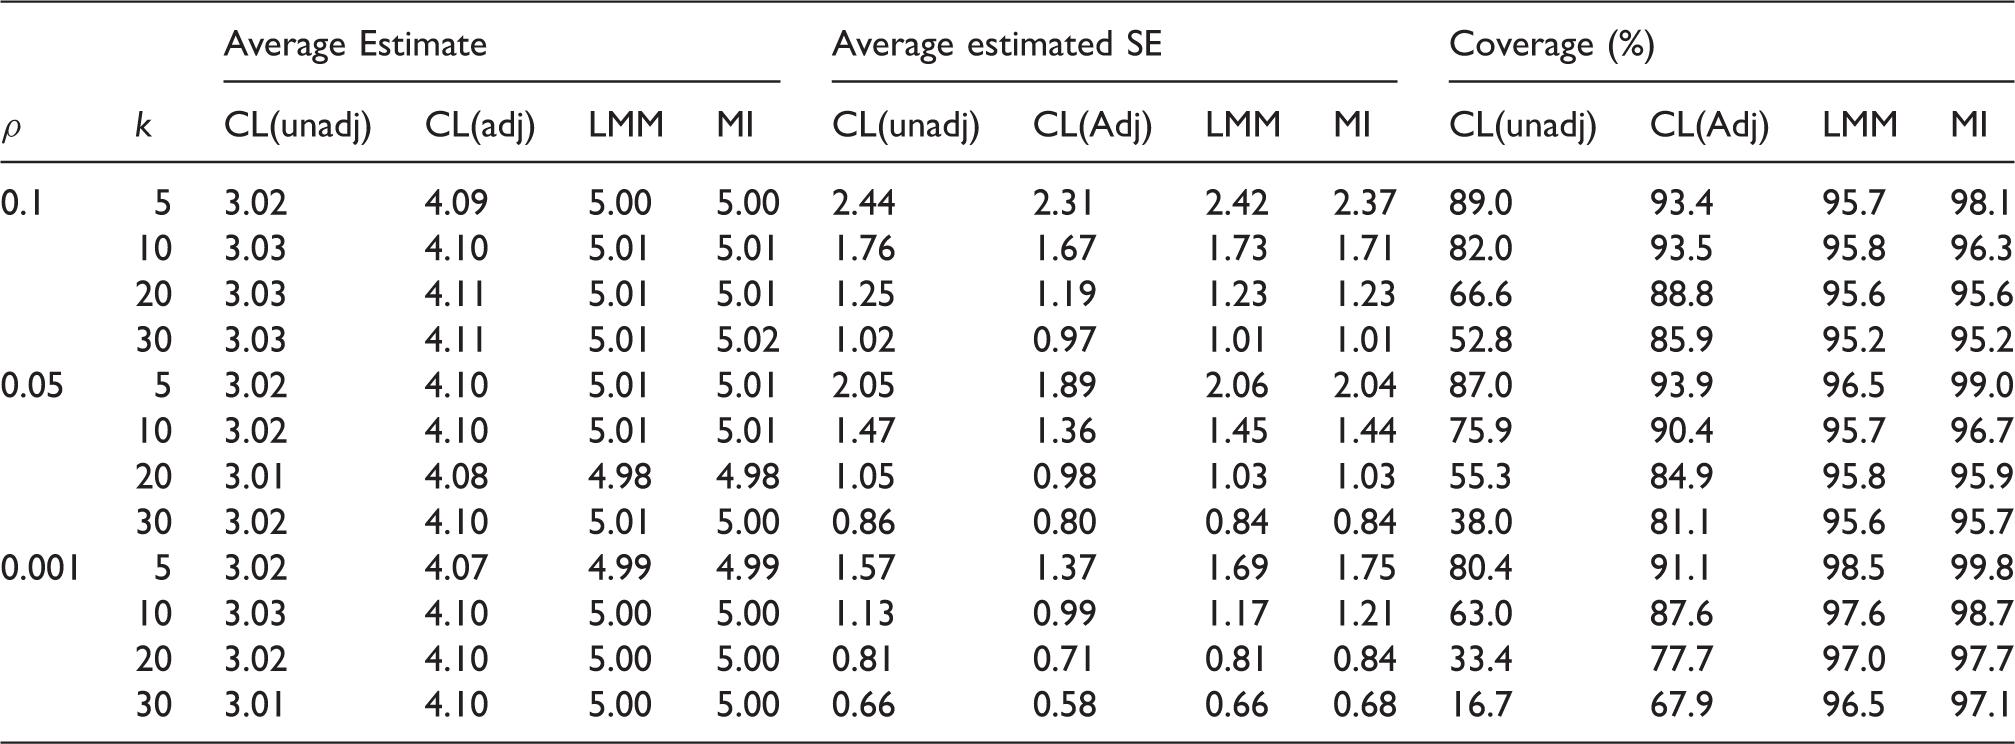
Simulation results-missingness mechanism is the same between the intervention groups and there is an interaction between intervention and baseline covariate in the data-generating model for outcome. Empirical average estimates of intervention effect, average estimated SEs and coverage probabilities of nominal 95% confidence interval over 10,000 simulation runs for unadjusted cluster-level analysis (CL(unadj)), baseline covariate adjusted cluster-level analysis (CL(adj)) and linear mixed model (LMM), using CRA and MI. Monte Carlo errors for average estimates and average estimated SEs are all less than 0.024 and 0.016, respectively. The true value of the intervention effect is 5.
Simulation results-missingness mechanism is different between the intervention groups and there is an interaction between intervention and baseline covariate in the data-generating model for outcome. Empirical average estimates of intervention effect, average estimated SEs and coverage probabilities of nominal 95% confidence interval over 10,000 simulation runs using unadjusted cluster-level analysis (CL(unadj)), baseline covariate adjusted cluster-level analysis (CL(Adj)) and linear mixed model (LMM), using CRA and MI. Monte Carlo errors for average estimates and average estimated SEs are all less than 0.025 and 0.018, respectively. The true value of the intervention effect is 5.
Comparison between the complete data DF
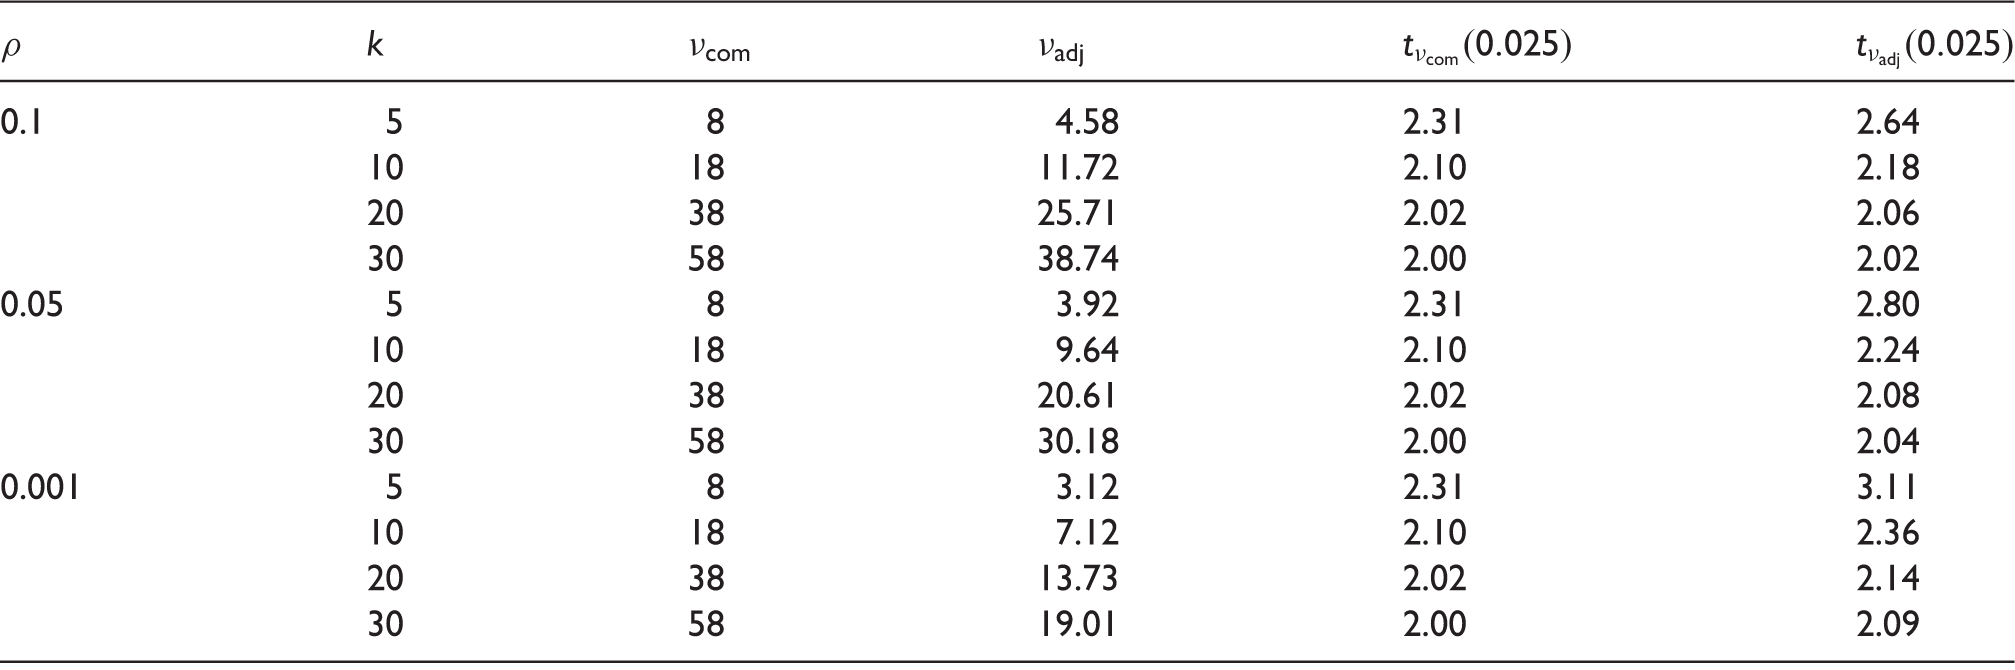
DF: degrees of freedom.
7 Discussion and conclusion
In this paper, we aimed to investigate the validity of the unadjusted and adjusted cluster-level analyses, and LMM for analysing CRTs, where the outcomes are continuous and only outcomes are missing under CDM assumption. We used CRA and MI for handling the missing outcomes. The contributions of the paper can be summarised as follows:
First, we found that both the unadjusted and adjusted cluster-level analyses are in general biased using CRA unless there is no interaction between intervention and baseline covariate in the data-generating model for outcome and the missingness mechanism is the same between the interventions groups, which is arguably unlikely to hold in practice. Cluster-level analysis is used by many researchers to analyse CRTs because of its simplicity. We therefore caution researchers that these methods may commonly give biased inferences in CRTs with missing outcomes. However, we note that these two methods are unbiased with full data, even when there is an interaction between baseline covariate and intervention in the true data-generating model for outcome.
Second, cluster mean imputation has been previously recommended as a valid approach for handling missing outcomes in CRTs. We found that cluster mean imputation gave invalid inferences under CDM assumption unless missingness mechanism is the same between the intervention groups and there is no interaction between intervention and baseline covariate in the data-generating model for outcome.
Third, the LMM using CRA gave unbiased estimates of intervention effect regardless of whether missingness mechanisms are the same or are different between the intervention groups and whether there is an interaction between intervention and baseline covariate in the data-generating model for the outcome, provided that an interaction between intervention and baseline covariate was included in the model when such interaction exists in truth.
Finally, we compared the results of LMM using CRA with the results of MI. As expected, we found that MI gave unbiased intervention effects estimates regardless of whether missingness mechanisms are the same or are different in the two intervention groups and whether there is an interaction between intervention and baseline covariate. The LMM and MI had similar empirical SEs of the estimates of intervention effects. However, MI using adjusted DF estimates gave overcoverage for the nominal 95% confidence interval. This is due to underestimation of adjusted DF used by MI compared to complete data DF. Groenwold et al. 20 showed that there is little to be gained by using MI over LMM in the absence of auxiliary variables. Moreover, when missingness is confined to outcomes, LMMs fitted using maximum likelihood are fully efficient and valid under MAR.
Throughout this paper, we have assumed CDM mechanism in a continuous outcome, which is an example of MAR as our baseline covariate was fully observed. In practice, we cannot identify on the basis of the observed data which missingness assumption is appropriate.14,26 Therefore, sensitivity analyses should be performed 26 (Ch. 10) to explore whether our inferences are robust to the primary working assumption regarding the missingness mechanism. Furthermore, we focused on studies with only one individual-level covariate; the methods described can be extended for more than one covariate.
In conclusion, in the absence of auxiliary variables, LMM using complete records can be recommended as the primary analysis approach for CRTs with missing outcomes if one is willing to make baseline CDM assumption for outcomes.
Footnotes
Acknowledgements
The authors thank the anonymous reviewers for their comments and constructive suggestions which led to an improvement over the earlier version of the manuscript.
Declaration of Conflicting Interests
The author(s) declared no potential conflicts of interest with respect to the research, authorship, and/or publication of this article.
Funding
The author(s) disclosed receipt of the following financial support for the research, authorship, and/or publication of this article: A Hossain was supported by the Economic and Social Research Council (ESRC), UK, via Bloomsbury Doctoral Training Centre (ES/J5000021/1). K Diaz-Ordaz was funded by Medical Research Council (MRC) career development award in Biostatistics (MR/L011964/1). J W Bartlett was supported by MRC fellowship (MR/K02180X/1) while a member of the Department of Medical Statistics, London School of Hygiene & Tropical Medicine (LSHTM).