
Abstract
This paper contributes to the understanding of spatiotemporal accessibility inequalities by exploring how the current public transport (PT) provision affects the time wealth of PT users living in two peripheral neighbourhoods in Malmö. The paper investigates time-related resources and constraints that concur in defining accessibility inequalities, identifies forms of temporal disadvantage and privilege and addresses the relevance of recognizing and meeting the multiple time-related needs of (potential) PT users. Adopting a mixed-methods approach, the study integrates results from a thematic analysis of interviews and from a GIS spatiotemporal accessibility analysis of PT schedules to understand whether and how the current PT provision (a) allows users to carry out the desired or needed activities by PT in the time available to them, (b) is harmonized with their spatiotemporal access needs and (c) supports or hinders the users’ ability to control their travel time. The paper suggests that, in the observed cases, the PT provision provides unequal opportunities for faster connections and information, exposing some users to time-related transport disadvantage. Also, the current PT provision does not always seem to be harmonized with the participants’ access needs, especially during off-peak hours. The findings highlight the importance of taking into consideration the time wealth of (potential) PT users with different access needs, resources, and constraints, with the aim to both tackle transport disadvantage and support the adoption of sustainable modal choices. The study provides directions for further spatiotemporal accessibility research and for urban time and mobility policies.
Introduction
Everyday (im)mobility practices are affected by the heterogeneous location, in space and time, of activities related to paid and unpaid work, education, care, consumption and leisure. Constraints and opportunities for access – emerging from the interplay of social obligations, individual needs and resources, land use and the transport system – contribute to defining forms of accessibility inequality. The individual’s ability to access relevant opportunities and conduct the desired or needed activities can be severely hindered when the locations and schedules of pacemakers (Parkes and Thrift, 1975) do not meet the needs of diverse actors. In contemporary polyrhythmic cities (Lefebvre, 2004; Muliček et al., 2014), access inequalities emerge from social and spatiotemporal processes that impact people’s access and participation potential. In particular, studies on post-industrial societies have shown how socio-temporal processes – such as acceleration, time pressure, desynchronization and the demands of the 24-hour society (Hassan and Purser, 2007; McArthur et al., 2019; Rosa and Scheuerman, 2009; Wajcman and Dodd, 2016) – contribute to the definition of complex access needs and challenge work–life balance.
In the last two decades, a sizeable body of interdisciplinary research has investigated the relation between mobility, accessibility, transport disadvantage and social inequalities (see Lucas, 2012). These studies identified accessibility as closely linked to social participation or exclusion (Kenyon et al., 2002) and as emerging from the three-fold relation between (1) the time–space organization of activities that generate access needs; (2) the characteristics of the transport system and (3) the multi-dimensional and unevenly distributed resources and constraints of individuals and households to meet their access needs (Church et al., 2000; Cass et al., 2005; Fol and Gallez, 2013; Shove, 2002). This relation can be observed through the lens of several dimensions, such as, among others, spatial, temporal, financial, physical and organizational (Cass et al., 2005).
Even if present and crucial in several definitions of access inequalities, the temporal dimension has not received extensive attention and spatial approaches have been instead favoured (Kwan, 2013; Neutens et al., 2010; Schwanen and Kwan, 2012). Research adopting a spatiotemporal approach to understand accessibility inequalities has, for instance, taken into consideration time use and access needs of different (im)mobile subjects (Neutens et al., 2014), the opening times of urban opportunities (Neutens et al., 2010) and public transport (PT) timetables (Farber et al., 2014; Widener et al., 2015; Xu et al., 2015). In doing so, it has addressed the interaction between the pacemakers’ characteristics (e.g. the location and opening times of destinations or PT’s spatial and temporal coverage) and the individuals’ possibility to organize access while juggling a multiplicity of fragmented activities (Couclelis, 2000; Shove, 2002; Schwanen and De Jong, 2008).
Drawing upon the concept of time wealth (Reisch, 2001; Rinderspacher, 2012), this paper intends to contribute to understanding how time-related factors play a role in facilitating or hindering spatiotemporal accessibility by PT. It does so by reflecting on the different dimensions of the interaction between (a) the spatiotemporal access needs, resources and constraints of PT users living in peripheral neighbourhoods in Malmö and (b) the spatiotemporal PT provision they (mostly) rely upon for their everyday accessibility needs. Public transport is often understood, within studies on transport-related inequalities, as the backbone of an inclusive and sustainable transport system. Temporal aspects (related, for instance, to speed, flexibility and availability of transport options) are crucial facets of both transport-related disadvantage and of unsustainable travel behaviours. This is especially true for residents in peripheral neighbourhoods, whose everyday access needs might require longer trips and whose modal options might be limited to motorized means of transport. We aim to answer the following research question: What aspects of the current PT provision in Malmö hinder or support time wealth for residents of peripheral neighbourhoods?
The results of the study aim to offer a theoretical and methodological contribution to research exploring spatiotemporal accessibility. By adopting the concept of time wealth to address spatiotemporal accessibility by PT, the paper suggests a way to conceptualize and operationalize the temporal dimensions of accessibility. In addition, the study proposes a mixed-methods approach allowing for the integration of time-related data and time-dynamic analyses in the study of accessibility. Furthermore, drawing upon the integrated spatiotemporal approach of local time policies, the results can support the definition of policy objectives and concrete measures to make PT more inclusive and attractive for users with heterogeneous temporal needs and resources. The paper is structured as follows: the first section presents the theoretical and analytical framework, defining time wealth, its connection to local time policies and its dimensions investigated in this study. The next section describes the study contexts and the methods. We then delineate the results, and finally, we discuss the integrated analyses presenting some concluding remarks.
Time wealth as a dimension of spatiotemporal accessibility
Time wealth, local time policies and spatiotemporal accessibility inequalities
To better understand the temporal resources and constraints involved in spatiotemporal accessibility, our study draws upon two main theoretical approaches: time geography and time inequalities studies. Time geographical studies (Hägerstrand, 1970; Parkes and Thrift, 1975) have drawn attention to the relation between quality of life in the city and the way in which space is timed by pacemakers (Parkes and Thrift, 1975). Pacemakers are the ‘metronomes of everyday life’ (Mückenberger, 2004), including ‘institutions, structures, technologies or activities that set the timing for a given urban environment’ (Muliček et al., 2014: 311), and are related to the fundamental areas of social participation (e.g. paid and unpaid work, leisure, consumption and public services). Studies on time inequalities have highlighted how time poverty – that is, ‘the situation when a household’s standard of living is subpar due to insufficient time available for subsistence levels of home production’ (Douthitt, 2000: 9; Vickery, 1977) – ‘time pressure or ‘time famine’ – that is, the perception of ‘having too much to do and not enough time to do it’ (Perlow, 1999: 57) – and time sovereignty – that is, the control on one’s own time (Garhammer, 1995) – are unequally distributed and often exacerbate already existing disparities, such as those related to class and gender (see, among others, Epstein, 2004; Goodin et al., 2005; Hochschild, 1997; Schor, 1991; Southerton, 2006; Warren, 2003).
In this paper, we resort to the concept of time wealth (Reisch, 2001; Rinderspacher, 1988, 2012), which appears adequate to bring together studies about time geography and about time inequalities, and to describe different dimensions of the complex interplay between pacemakers and actors’ time-related resources in the urban spacetime. The concept of time wealth has been first used to better understand the role of time in sustainable behaviour in the Global North, where acceleration of life is among the factors leading to unsustainable forms of consumption (Reisch, 2001); in this context, higher wealth in time is seen as a necessary (yet not sufficient) condition for more sustainable lifestyles, and environmentally friendly behaviours, such as the use of PT, are described as ‘time investments in the environment’ (Rinderspacher, 1996 in Reisch, 2001: 373). Time wealth is not only about possessing a certain amount of time. Instead, it emerges from a series of interrelated and overlapping conditions (Reisch, 2001; Rinderspacher, 2012; Warren, 2003), including the availability of: 1. Sufficient time to carry out the desired or needed activities (chronometric dimension); 2. Time at the right moment (i.e. adequate to one’s own rhythm) of the day, week and season (chronologic dimension); 3. A common time, that is, harmonized with the rhythms and temporal constraints of others (e.g. family and friends) and with society’s temporal institutions (e.g. services’ schedules) (synchronization dimension); 4. Time that can be self-determined (time sovereignty dimension); 5. A diluted, non-accelerated time (deceleration dimension); 6. An ‘enjoyable time’ (quality dimension) (Warren, 2003: 735); 7. Multiple public temporalities (dimension of the ‘plurality of timescapes’) (Reisch, 2001: 378); 8. Time that can be planned (planning dimension).
Increasing time wealth is the goal of local time policies, ‘policies intended to coordinate working times, public and private service times, and urban time schedules to the needs of human beings as individuals and in families and communities’ (Mückenberger, 2011: 66–67). Drawing upon the so-called ‘times-of-the-city approach’ or ‘chronotopic approach to urban planning’, local time policies were first developed in Italy during the 80s and then soon transferred to other European countries (Van Schaick, 2013). Local time policies promoted initiatives to enhance quality of life through interventions on the pacemakers of the city, including, among others, measures to improve spatiotemporal accessibility of public and private services (e.g. extending opening times of public services or promoting their digitalization), integrated spatiotemporal planning of urban spaces and ‘mobility pacts’ aimed at addressing traffic congestion and inaccessibility through collaboration between different stakeholders (Bonfiglioli et al., 1998; Mareggi 2002). Such policies ‘represent a political recognition of the multiplicity of social times’ by ‘tackl[ing] in particular the difficulties of certain populations to synchronize their times to the dominant social rhythms and to the temporal evolution of major and minor rhythms’ (Mallet, 2014: 15–16).
In Sweden, explicit time policies have never been implemented (Fernandes et al., 2015). There, according to previous research, ‘planners might address temporality as part of the planning process, but very seldom address the temporal consequences of plans or urban structures, nor do they seem to consider time-space association in any comprehensive way’ (Fernandes et al., 2015: 145). The lack of explicit local time policies might bring to overlooking crucial aspects of spatiotemporal accessibility, such as the need to plan pacemakers considering the ‘unequal distribution of resources and choices to organize daily time uses’ (Henckel and Thomaier, 2013: 99).
Time wealth and spatiotemporal accessibility by PT
From a local time policies angle, PT planning needs to consider time wealth to increase spatiotemporal accessibility and, thereby, to: (a) Reduce the risk of transport disadvantage
1
for PT users – especially for captive users (Krizek and El-Geneidy, 2007) that have no other choice than using PT.
2
Public transport is a mode entailing higher risks of time-related transport disadvantage than other modes. These risks are related, among others, to PT’s pre-defined schedules and calendars (which are mostly based on the pacemakers of the majority), to its demands in terms of temporal and organizational costs for the user (e.g. waiting and planning time) (Wardman, 2004) and to potential inequalities in accessing and using the information about the service. (b) Improve PT attractiveness facilitating the modal shift towards more sustainable mobility options. Making PT more attractive to increase ridership is necessary for achieving sustainability goals. Results from studies on modal choice and travel satisfaction have shown the relevance, for PT users, of temporal aspects such as frequency, punctuality and speed (Cats et al., 2015; De Oña, 2021; Ingvardson and Nielsen, 2019; Lunke, 2020). To attract more users, PT needs to contribute to (or at least not hinder) their time wealth.
In this paper, we focus on three dimensions of time wealth that we consider most relevant to understand its relation to spatiotemporal accessibility by PT (namely, the chronometric, synchronization and sovereignty dimensions), we re-interpret them in order to address the relationship between PT provision and PT users’ access needs and we investigate whether the current PT provision in Malmö contributes or hinders time wealth, combining geo-spatial analysis and the experiences of our informants. Specifically, in order to answer the main research question (What aspects of the current PT provision in Malmö hinder or support time wealth for residents of peripheral neighbourhoods?), we ask the following sub-questions: 1. Does the current PT provision allow users to carry out the desired or needed activities by PT in the time available to them, without requiring excessive temporal costs? (chronometric dimension). 2. Are PT networks and schedules harmonized with the spatiotemporal access needs of people (which vary also according to the schedules and calendars of the opportunities they need to reach)? (synchronization dimension). 3. Does PT service support or hinder the users’ ability to control their travel time? (sovereignty dimension).
Methods
To address the research questions, we adopt a mixed-methods approach, that is, we collect and analyse data using both quantitative and qualitative methods, and integrate the findings (Tashakkori and Creswell, 2007). By focussing on a group of participants living in two peripheral neighbourhoods in Malmö, we take into consideration (a) the spatiotemporal location of relevant opportunities they intend to access, (b) the spatiotemporal characteristics of the PT supply and (c) how both are experienced by our informants in relation to the selected dimensions of time wealth. The analyses aim at highlighting forms of spatiotemporal accessibility inequalities that might not be visible when considering exclusively the spatial dimension.
Description of the study areas
Malmö is a post-industrial city that, in recent years, is re-branding itself as a ‘sustainable’ and ‘knowledge city’ (Hamidi et al., 2019). Malmö, the third biggest city in Sweden and one of the fastest growing metropolitan areas (Malmö Stad, 2022a), is an increasingly relevant centrality in the Greater Copenhagen region and labour market, also thanks to its proximity to the Danish capital (approximately 35 min by train) and to Lund (approximately 10 min by train, site of the prestigious University and of major high-tech companies). In 2018, the modal share for trips within Malmö was distributed as follows: 34% by car, 25% by PT, 26% by bike and 14% by foot (Malmö Stad, 2022a). In line with its sustainability agenda, Malmö aims to decrease car use (Malmö Stad, 2016). At the moment of writing, Malmö’s PT system consists of city bus lines, regional buses and trains. The main train stations in the city (Malmö Central, Triangeln and Hyllie) connect Malmö to the rest of Skåne and Sweden, and, via the Öresund Bridge, to Denmark.
Population statistics about Malmö, Bunkeflostrand and Lindängen.
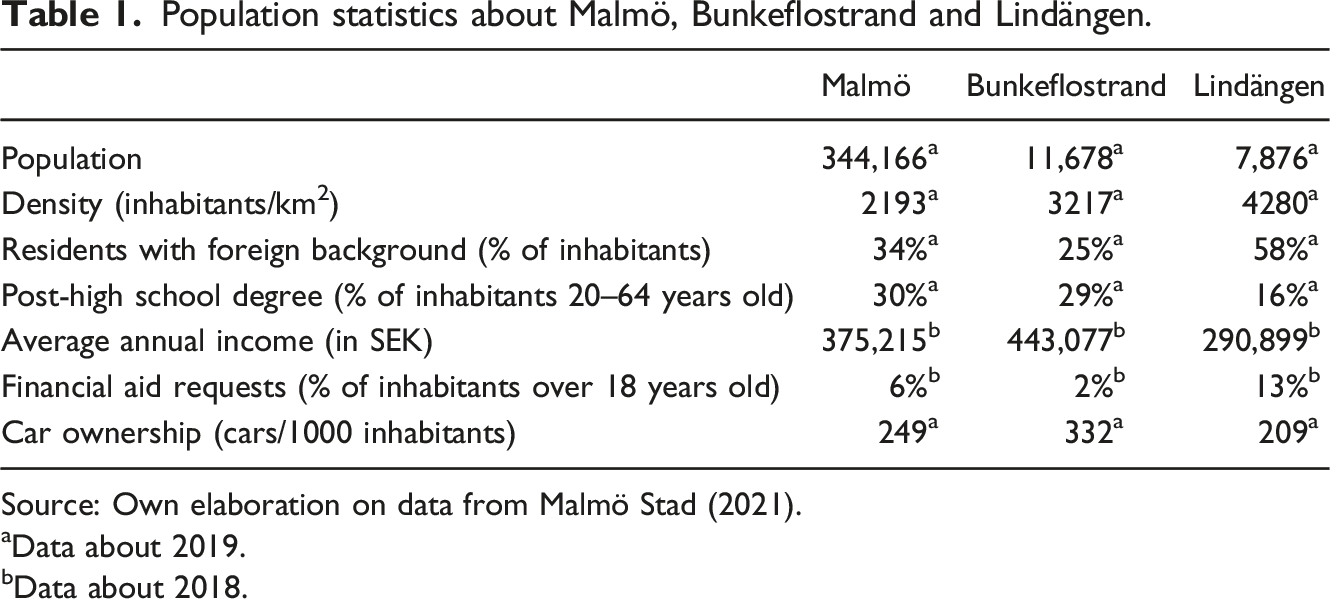
Source: Own elaboration on data from Malmö Stad (2021).
aData about 2019.
bData about 2018.
Bunkeflostrand
The residential area of Bunkeflostrand (Figure 1) is located in the south-west part of Malmö, on the coast. In comparison to Malmö’s average, Bunkeflostrand presents a higher average income, a lower percentage of residents with foreign background (who were born abroad or have two parents that were), a lower incidence of financial aid requests and higher car ownership (Table 1). The most common form of housing tenure is owned property (59%) (Malmö Stad, 2021). The neighbourhood is served by two urban bus lines, one of which reaches the closer train station (Hyllie, served, among others, by trains to Copenhagen, Malmö Central and Lund) in around 10 min, with a five-min rush-hour headway (Skånetrafiken, 2019). Map showing the borders of Bunkeflostrand (Malmö Stad, 2020), the bus lines reaching it (Trafiklab, 2019a) and the average waiting time in peak hours (Skånetrafiken, 2019; Trafiklab, 2019a). Own elaboration. Basemap: Light Gray Canvas (Basemap sources: Esri, HERE, Garmin, FAO, NOAA, USGS, © OpenStreetMap contributors, and the GIS User Community).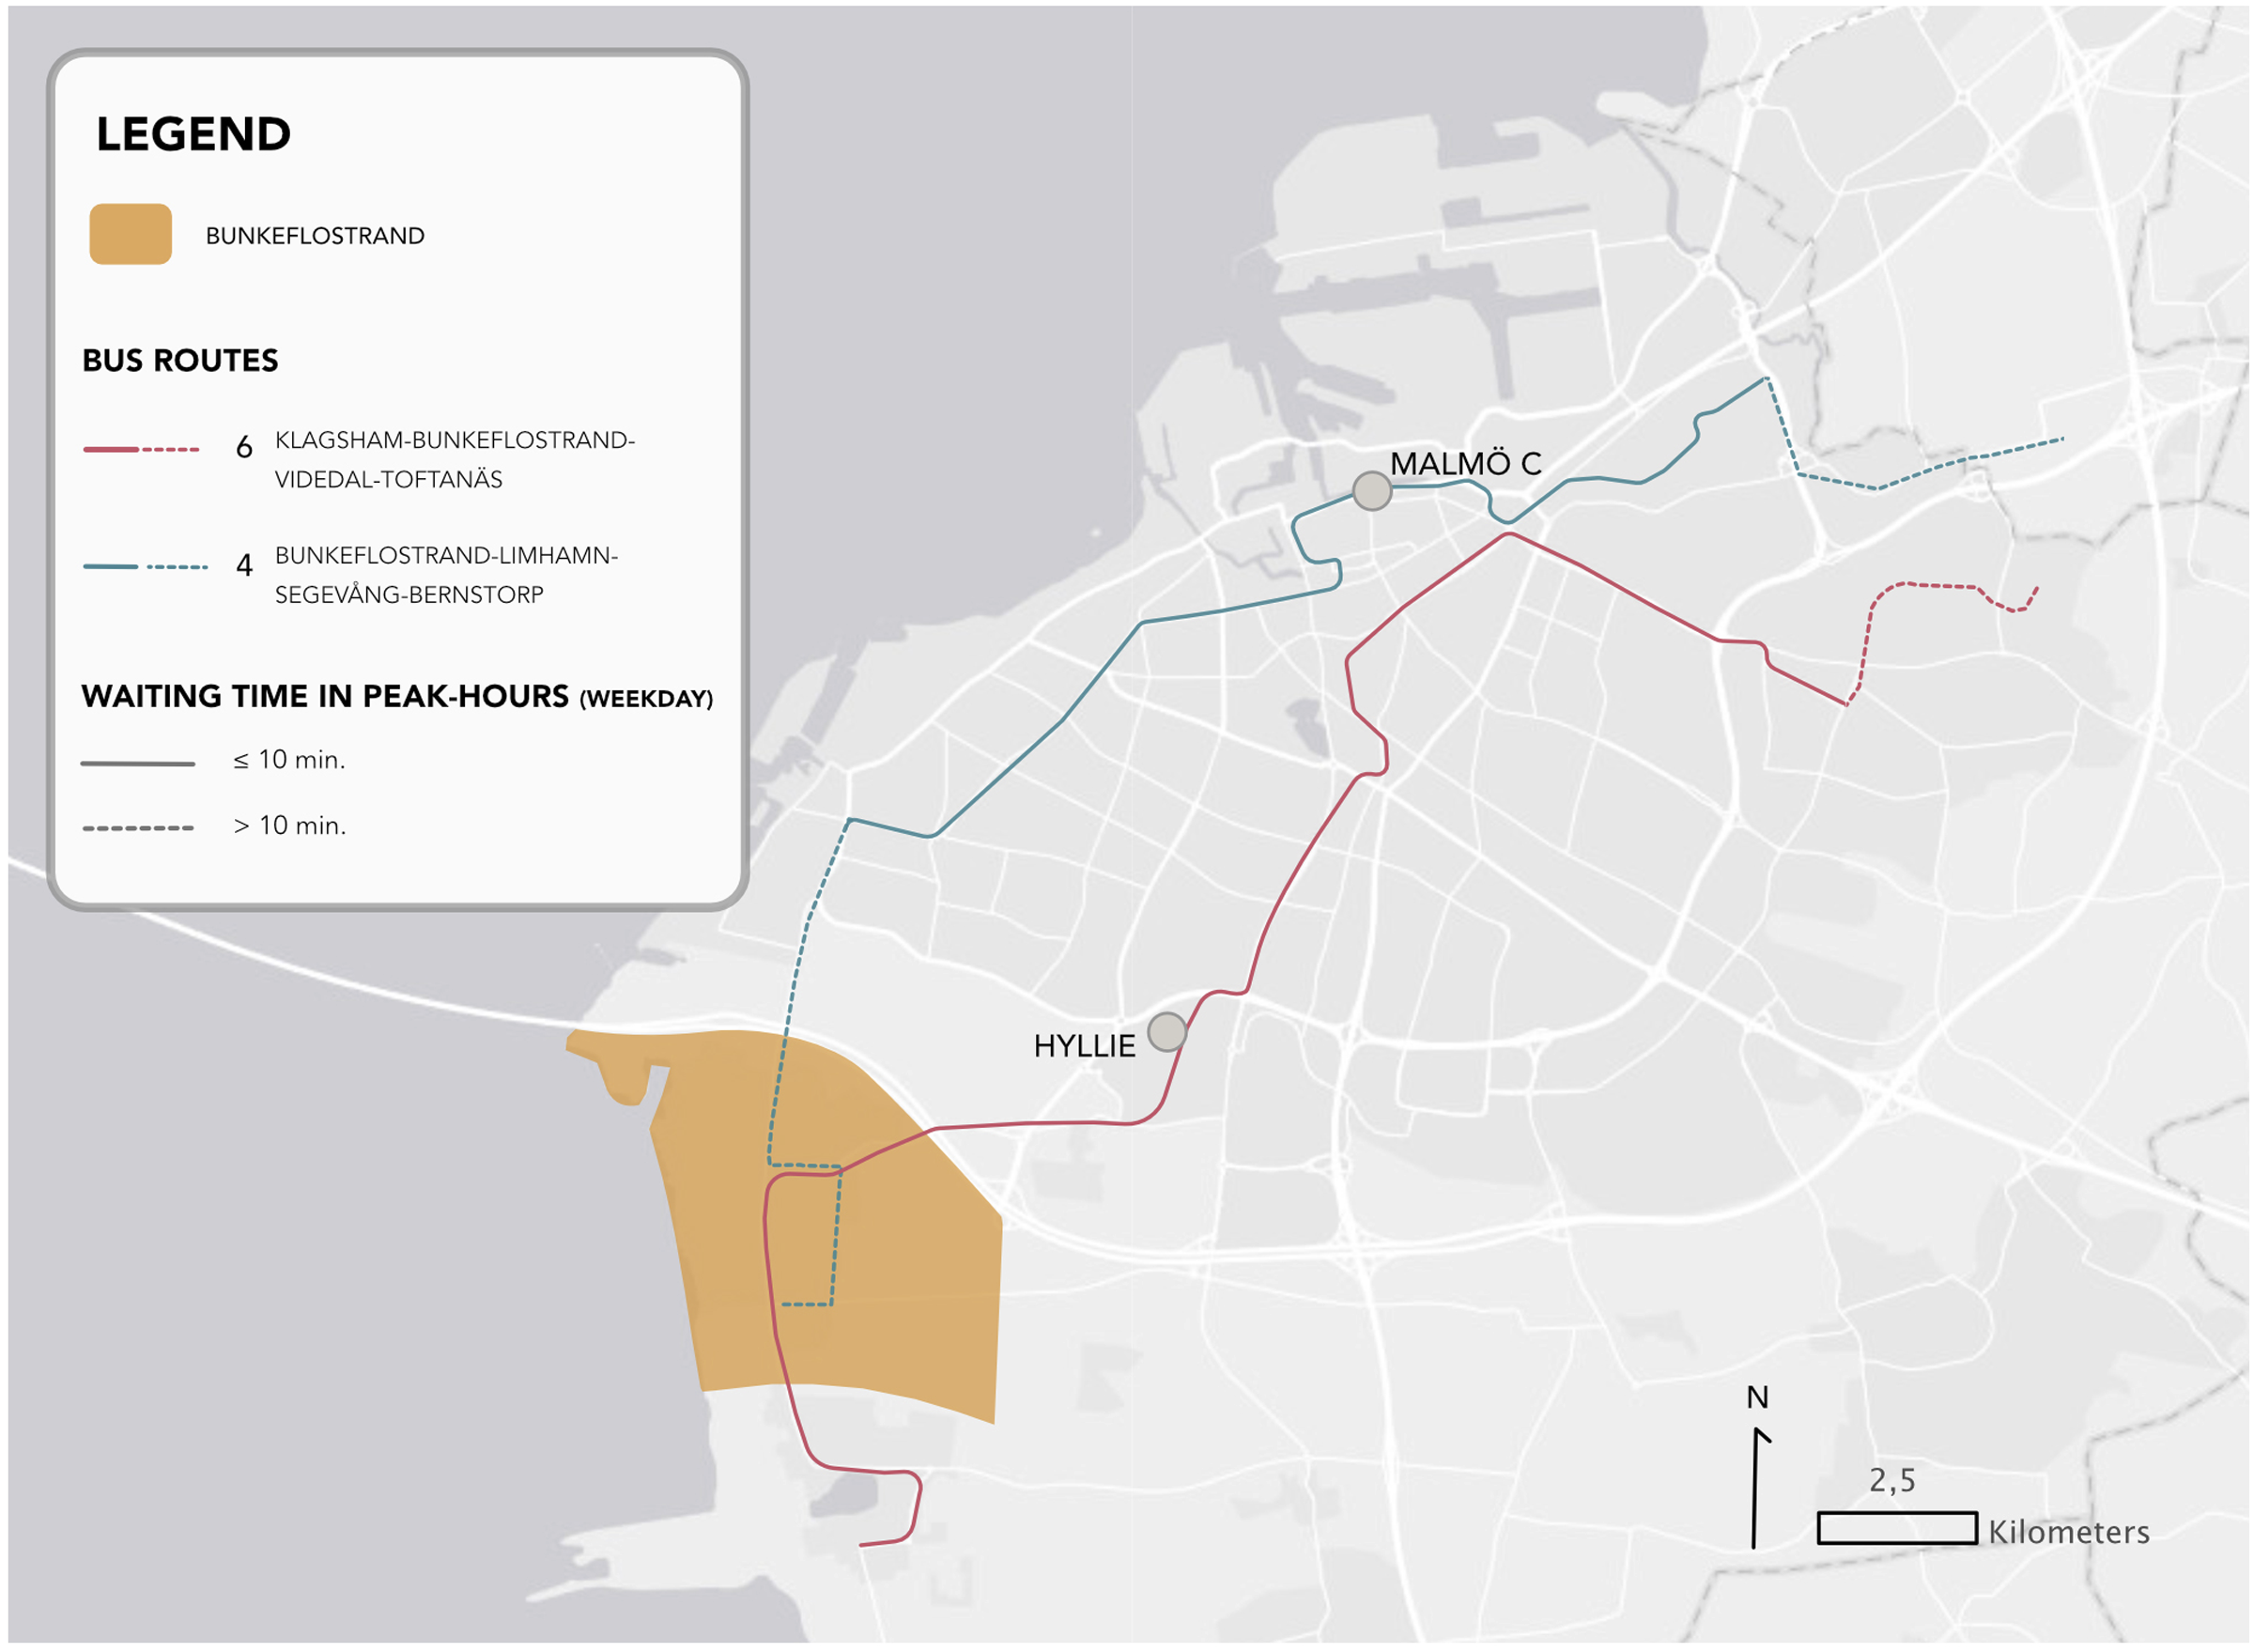
Lindängen
Lindängen (Figure 2), a residential area in the southern part of Malmö, presents lower average incomes, lower formal education levels and a higher percentage of residents with a foreign background than the Malmö average (Table 1). In Lindängen, which was developed during the million-program period
4
(Malmö Stad, 2022b), the most common form of housing tenure is rental apartments (61%) (Malmö Stad, 2021). Lindängen is listed as a ‘particularly vulnerable area’ by the Swedish Police Authority
5
(2017). The neighbourhood is served by four urban bus lines and one regional bus line, two of which reach Hyllie in around 10–14 min, with a 10- to 20-min rush-hour headway (Skånetrafiken, 2019). Based on the aforementioned literature, the lower socio-economic and car ownership levels in Lindängen suggest potentially lower resources for accessibility (e.g. transport disadvantage) and lower time wealth. Map showing the borders of Lindängen (Malmö Stad, 2020), the bus lines reaching it (Trafiklab, 2019a) and the average waiting time in peak hours (Skånetrafiken, 2019; Trafiklab, 2019a). Own elaboration. Basemap: Light Gray Canvas (Basemap sources: Esri, HERE, Garmin, FAO, NOAA, USGS, © OpenStreetMap contributors, and the GIS User Community).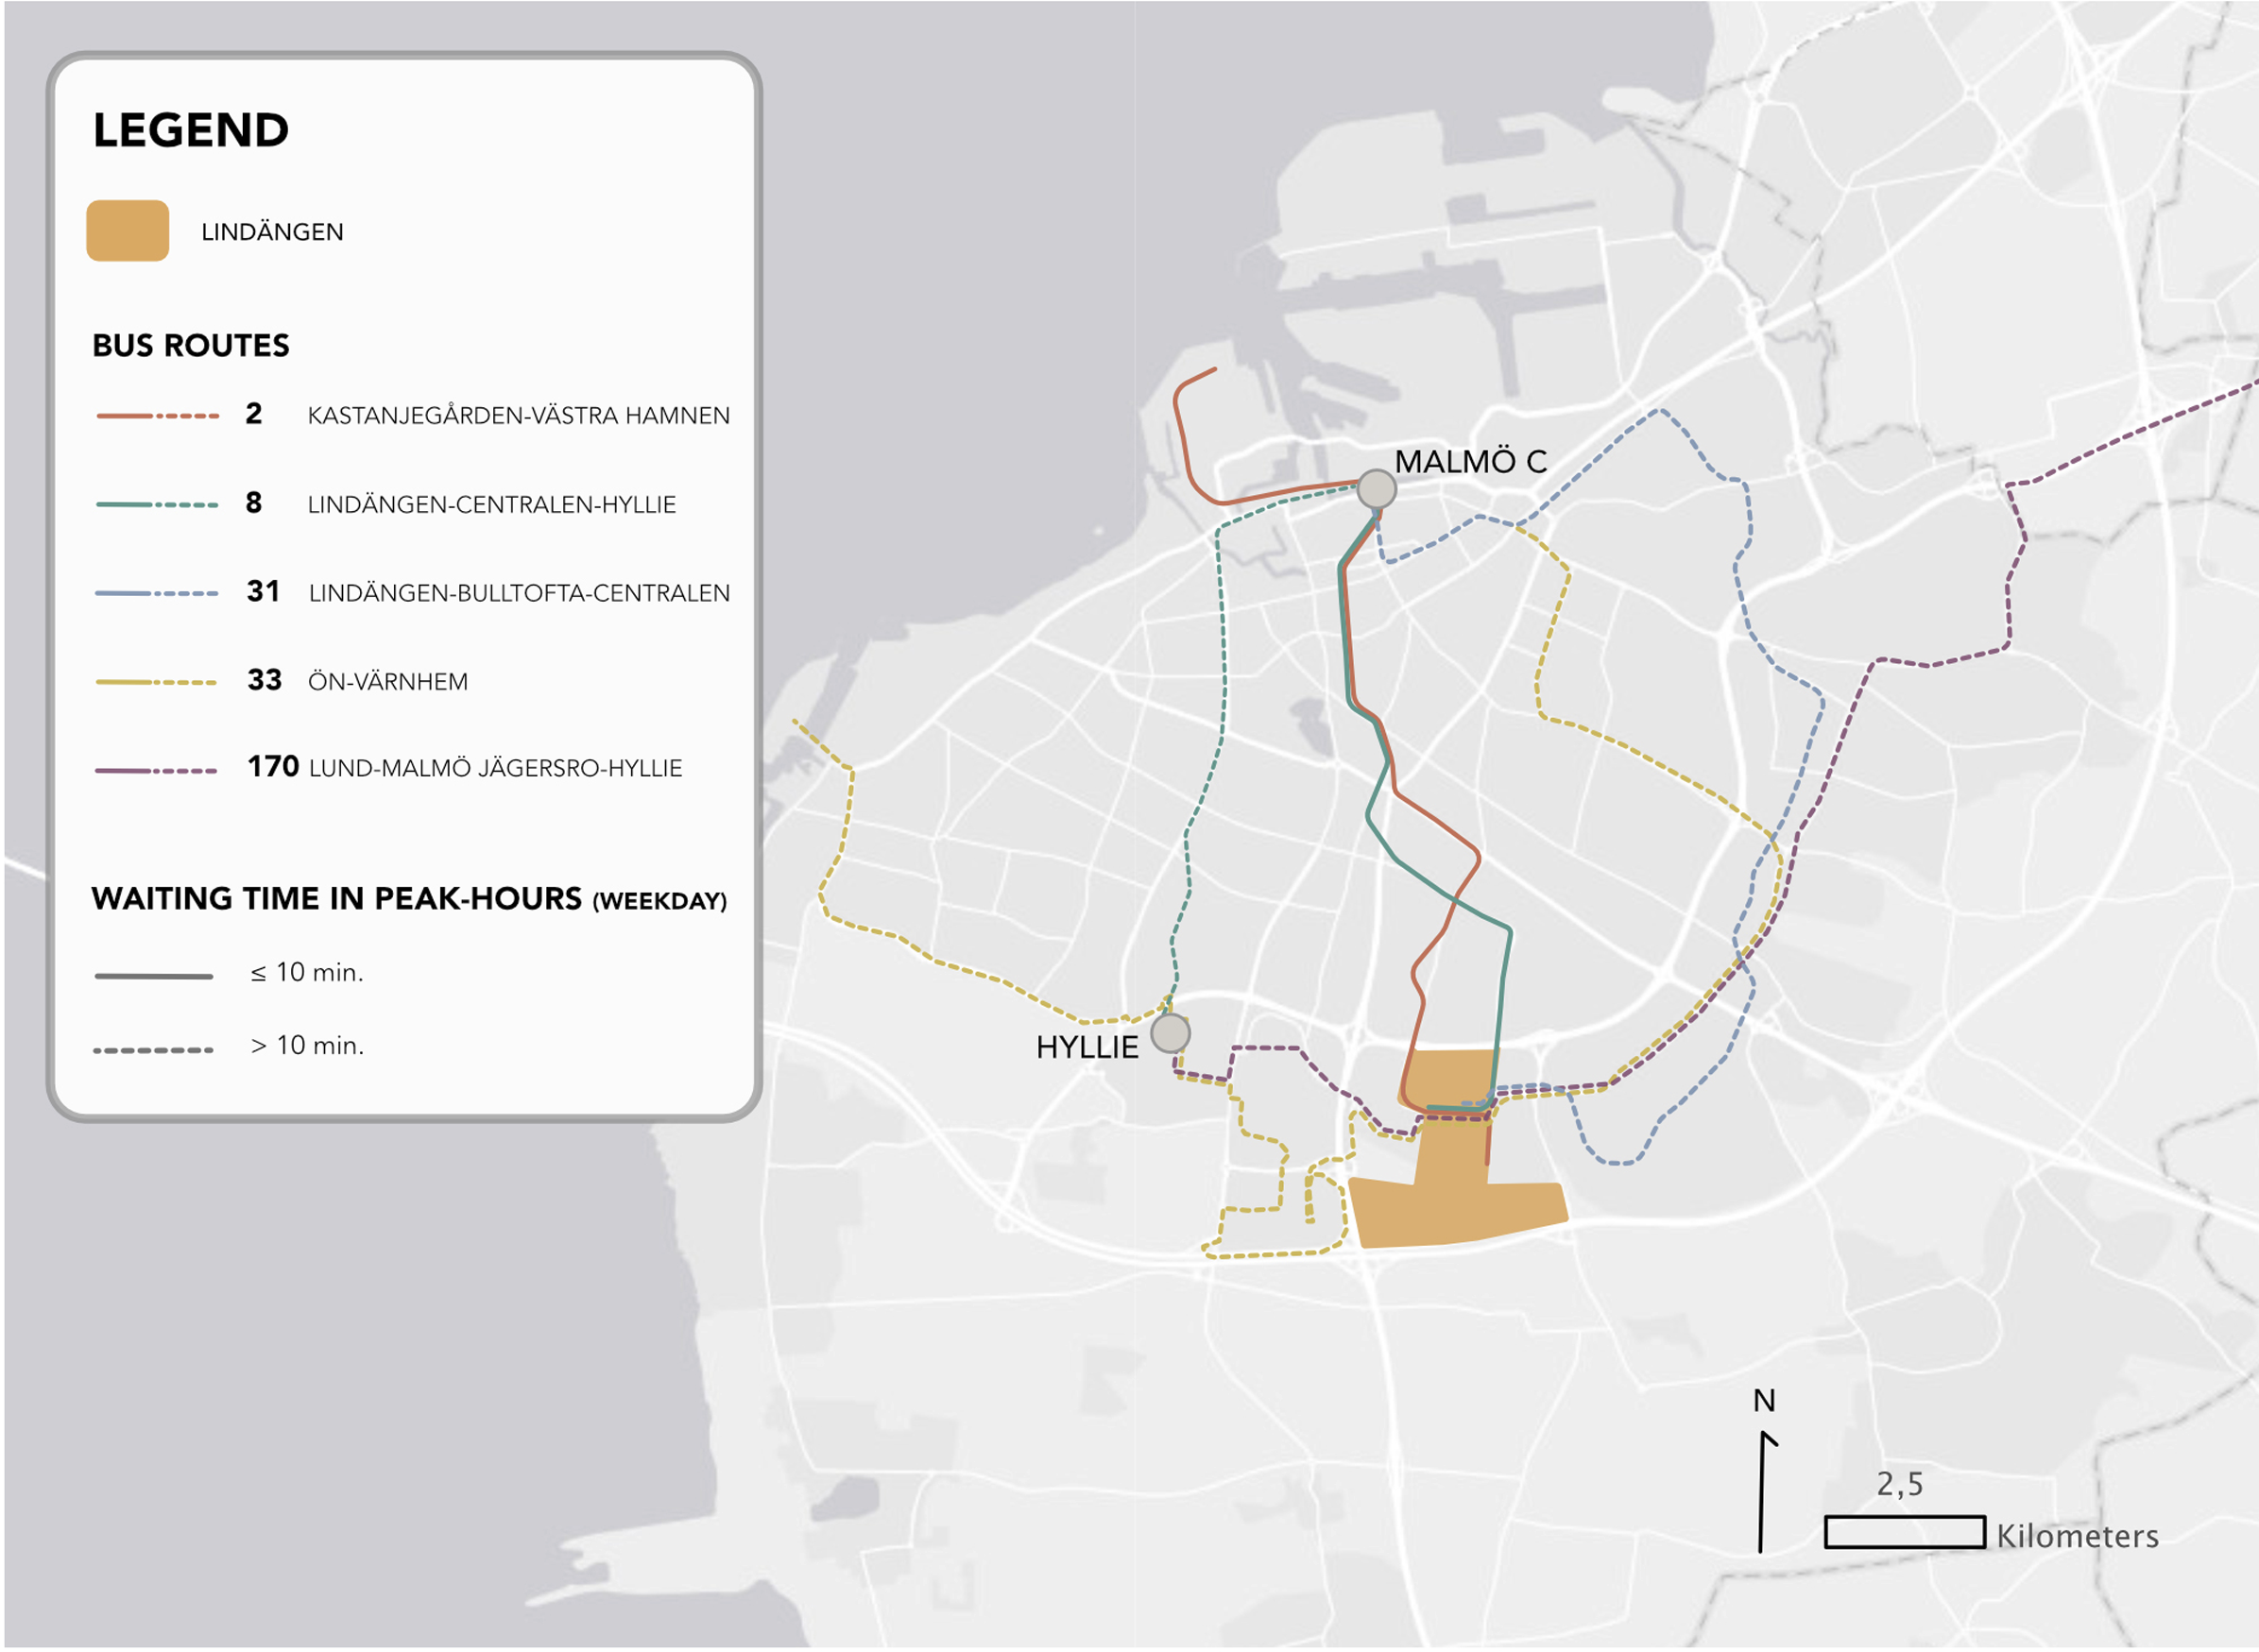
Data collection and analysis
Semi-structured interviews and thematic analysis
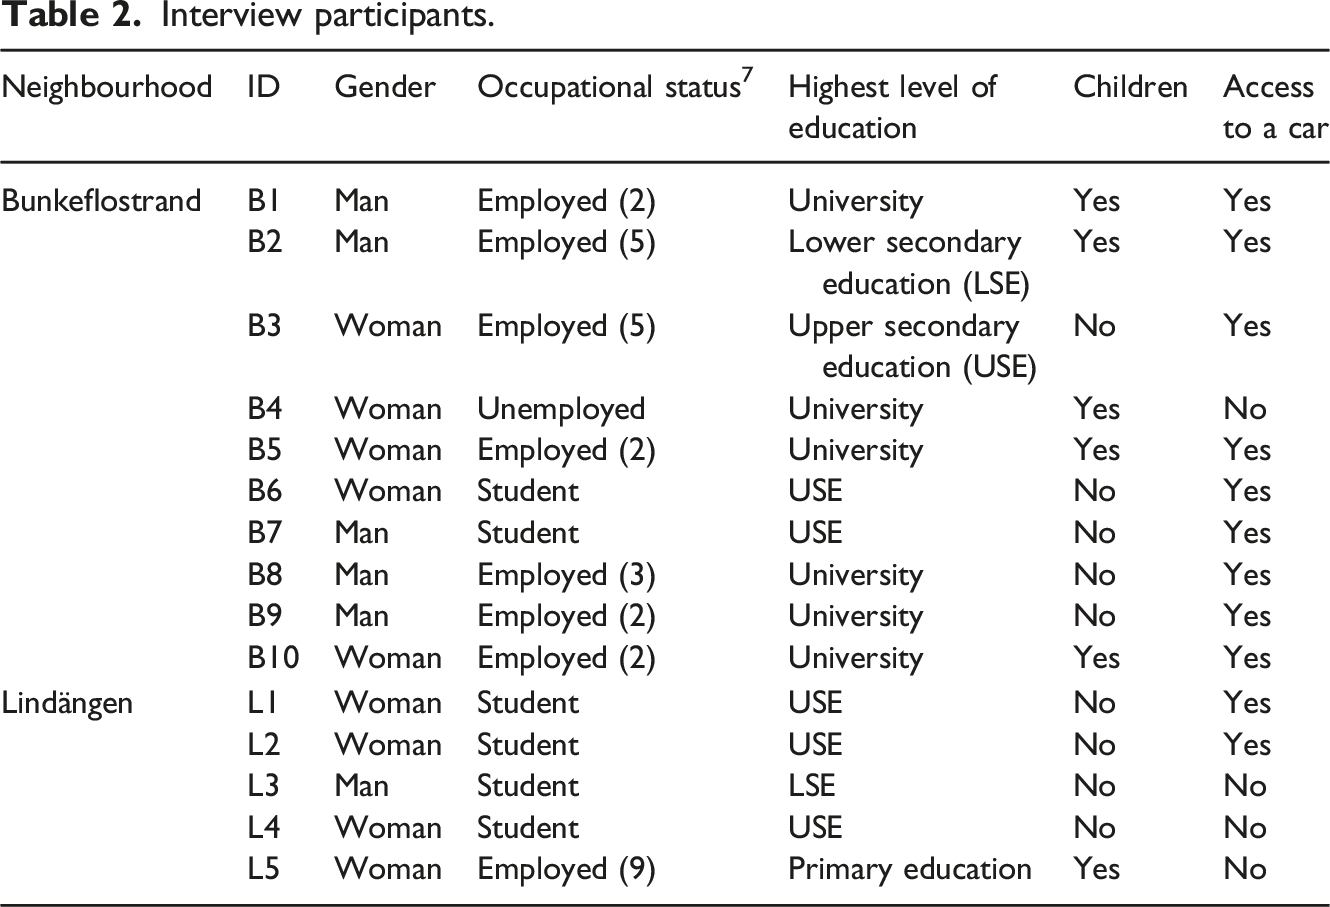
The participants were recruited between August 2019 and February 2020 among PT users aged between 20 and 40 years old living in the selected neighbourhoods. This age group was chosen with the aim to understand accessibility for persons with multiple access demands, social roles, and temporal and organizational challenges. Even if other age groups could have provided valuable information concerning accessibility (e.g. older adults), given the exploratory nature of our study we decided to focus on this age group to increase the probability of interviewing, in the time available, informants characterized by the overlapping of multiple social obligations. These obligations might be related to leaving the parental home, progressing in education and work and becoming parents, key events with a clear impact on mobility biographies (Lanzendorf, 2010) and on time wealth. Most of our informants belong to the Millennials generation, characterized by a higher use of PT in comparison to older generations and by a set of life circumstances that can make reliance on PT a crucial aspect of daily life, such as ‘increased singlehood, the upcoming of e-communication, higher car mobility costs, increased economic insecurity and changing lifestyles’ (Colli, 2020: 275). We recruited participants in person and online through purposeful criterion sampling (Omona, 2013) and research self-identification (Franz et al., 2019). Participants were required to read information about the study upon registration and when signing the consent form before the interview. Each participant received a gift card.
Interview participants.
GIS-based spatiotemporal analysis
The GIS-based spatiotemporal accessibility analysis has been conducted taking into consideration (1) the PT scheduled service, (2) the street network and (3) the relevant destinations indicated by the participants during the interviews and in the travel diaries, categorized according to their function and the time they needed to be accessed.
General Transit Feed Specification (GTFS) data on the PT scheduled service (Trafiklab, 2019b) and data on the road network (Geofabrik, 2020) have been elaborated using Esri’s ArcGIS Pro Transit Network Analysis toolbox to produce ‘access polygons’, that is, isochrones representing ‘the area reachable by transit across a time window.’ 8 This analysis assigns a percentage to the different output polygons, showing how frequently they can be reached by foot and PT leaving from a given origin in a specific time window. In our analysis, we consider two measures: the total reachable area (the sum of the different percentage polygons) and the polygons with a value of 75% or higher. The first produces an account of the total (maximum) reachable area by foot and PT in a specific time window; this value can account for a measure of the area reachable after previous and accurate planning, in a completely reliable system, since it does not take into consideration the possibility of missing a bus by 1 min (which might considerably change the reachable area). The second, instead, takes this possibility into consideration and shows the area which is reached at least 75% of the times there is a departure from the origin in a specific time window.
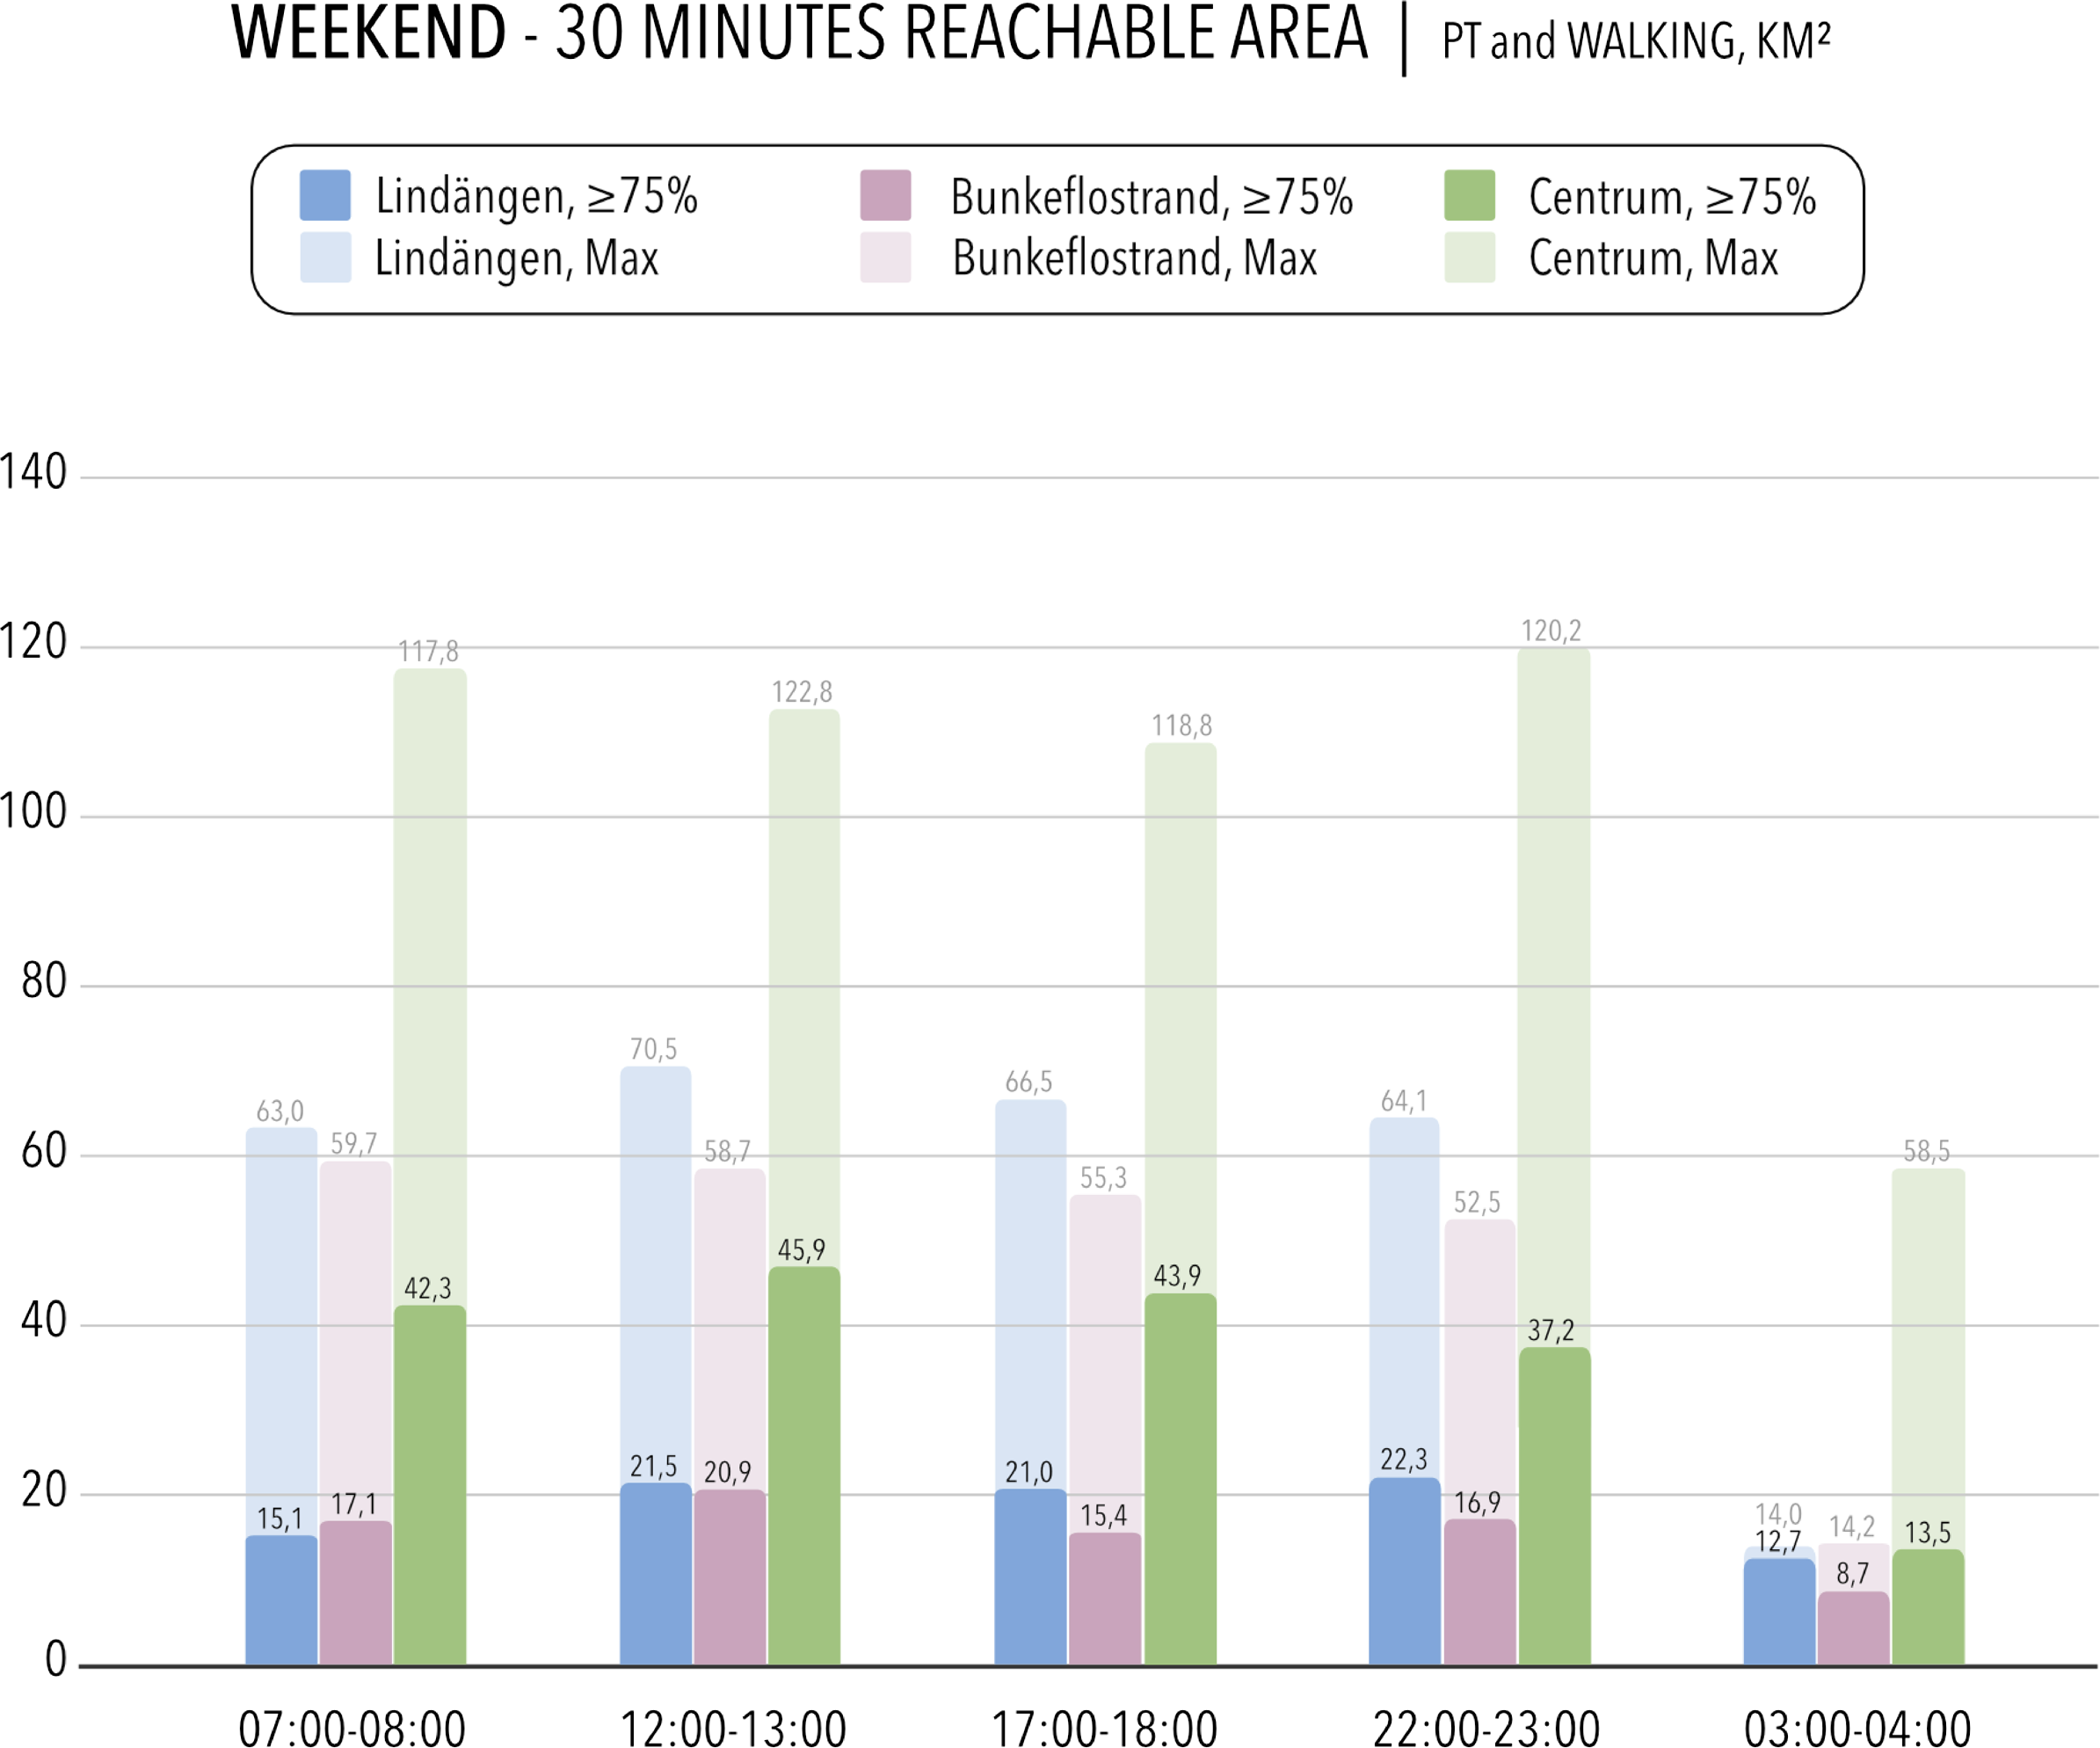
Percent access polygons have been calculated for different days of the week (a Tuesday and a Saturday). 9 A first analysis (see the section ‘The chronometric dimension’) considers the area reachable in 30 min 10 during five different timeslots 11 and from three different origins: the stops ‘Bunkeflostrand Centrum’, ‘Lindängen Centrum’ and ‘Gustav Adolfs Torg’ (a bus node in the city centre). A second analysis (see the section ‘The synchronization dimension’) allowed us to produce maps of the relevant destinations and of the areas reachable in different time intervals from ‘Bunkeflostrand Centrum’ and ‘Lindängen Centrum’ by foot and PT; in this case, access polygons have been created taking into consideration two different time windows (Day, from 06:00 to 17:59, and Evening/Night, from 18:00 to 05:59). 12 The relevant destinations are represented as points in space and time in the same time windows (according to the time and day the respondents needed to reach them) and categorized based on their function (i.e. work, education, chores, leisure and transport hubs).
Limitations
Our study presents three main limitations. First, as none of the interviewees mentioned living with a disability, we assume that our study lacks the point of view of PT users with disabilities and hence overlooks potential additional spatiotemporal constraints, resources and strategies. Second, the study would need to be expanded to include the experience of different users belonging to heterogeneous demographic and socio-economic groups. Also, most of our participants had access to a car (as drivers or passengers), a factor that could affect their attitude towards and use of PT as they have more transport options available. Third, some useful but not easily accessible and processable data were not included in the spatiotemporal analysis, such as GTFS real-time data – which could provide measures related to the system’s reliability and, hence, to the sovereignty dimension, and correct the risk of overestimating accessibility related to the use of static, schedule-based GTFS data (Wessel and Farber, 2019) – and data on the opening times of urban opportunities (workplaces, schools, and public and private services) for a richer and more rigorous measure of the synchronization dimension.
Results
In this section, results from the interviews and the spatiotemporal accessibility analysis are presented in connection with the different – although closely linked and partly overlapping – dimensions of time wealth.
The chronometric dimension
Concerning the ability of the PT provision to allow users to carry out activities by PT in the time available to them, without requiring excessive temporal costs, interviewees identified a series of constraints, mostly dealing with long door-to-door travel times: long routes with many stops and the lack of faster alternatives; the need to wait for the next bus in case of crowded vehicles; traffic congestion caused by cars when dedicated bus lanes are not in place and low frequency outside peak times and on some routes (e.g. regional busses), especially when combined with a lack of synchronization between routes. Also, low frequency requires trip planning strategies (e.g. take one/two busses earlier), which, on the one hand, might help minimizing time pressure but, on the other hand, require the allocation of more time to the journey.
Long travel times can lead to an increased temporal pressure and to the decision to opt for a different mode. Interviewee B1 claimed that it is convenient to use PT only when he does not have any specific time constraints; otherwise, in case of more stringent personal schedules, he doesn’t ‘have time for that’ and prefers taking the car. According to B10: ‘If I have plenty of time in the morning, I take the bus. If I’m a little stressed I obviously take the bike because it goes much smoother’ (our emphasis). According to L5, ‘if you learned to go by bus and you have to go by bus, then you become more patient. [...] Maybe public transport is only for the patient ones’ (our emphasis). Also, while for some of our informants, the time on-board is perceived as wasted time, spent scrolling through social media or consuming contents on mobile devices, some interviewees make use the time on PT to carry out activities or relax, hence reducing their sense of time pressure.
The main difference between the two neighbourhoods regarding the chronometric dimension is that Bunkeflostrand residents can reduce their travel time thanks to a mostly frequent bus connection to Hyllie station, where trains to the city centre run at high frequency. On the contrary, the same opportunity for reducing travel time is not guaranteed to those departing from Lindängen. Despite being the road distance to Hyllie even shorter than the one from Bunkeflostrand (ca. 3 km vs. ca. 4 km), the bus connection is not as frequent and fast: I don’t like the bus connection from Lindängen to Hyllie [train station]. [...] If I take the car, I can get there in 5 or 10 min if someone drives me [...]. I know that a lot of people who work in Denmark would get their parents or someone drive them to the station from Lindängen. I think it is very inconvenient to get to Hyllie [by bus], because it’s very near-by and the bus route is very long (L2).
The higher accessibility potential offered to those departing from Bunkeflostrand by the frequent and direct connection to Hyllie emerges also from our GIS analysis. Figures 3 and 4 show the reachable area in 30 min from Bunkeflostrand, Lindängen and the city centre. According to our results, the ≥75% area reachable from the two peripheral neighbourhoods is overall similar. This result – which might seem surprising, since Lindängen is served by more bus lines than Bunkeflostrand (see Figures 1 and 2) – is due to different factors: the low frequency of many of the routes serving Lindängen, their long routes and their less efficient connection to major transport hubs (e.g. Hyllie). The potential offered by the numerous bus lines transiting through Lindängen is evident for some timeslots if we consider the maximum reachable area. However, this second area is not broader for all timeslots considered. Lastly, as expected, both the ≥75% and the maximum reachable areas are (considerably) broader when the origin is the city centre. Reachable area in km2 from Bunkeflostrand, from Lindängen and from the city centre considering 30 min travel time, at different times during a weekday. Source: Own elaboration (Esri ArcGIS Pro - Percentage Access Polygons) on GTFS data (Trafiklab, 2019b) and road data (Geofabrik, 2020). Reachable area in km2 from Bunkeflostrand, from Lindängen and from the city centre considering 30 min travel time by PT and walking, at different times during a Saturday. Source: Own elaboration (Esri ArcGIS Pro – Percentage Access Polygons) on GTFS data (Trafiklab, 2019b) and road data (Geofabrik, 2020).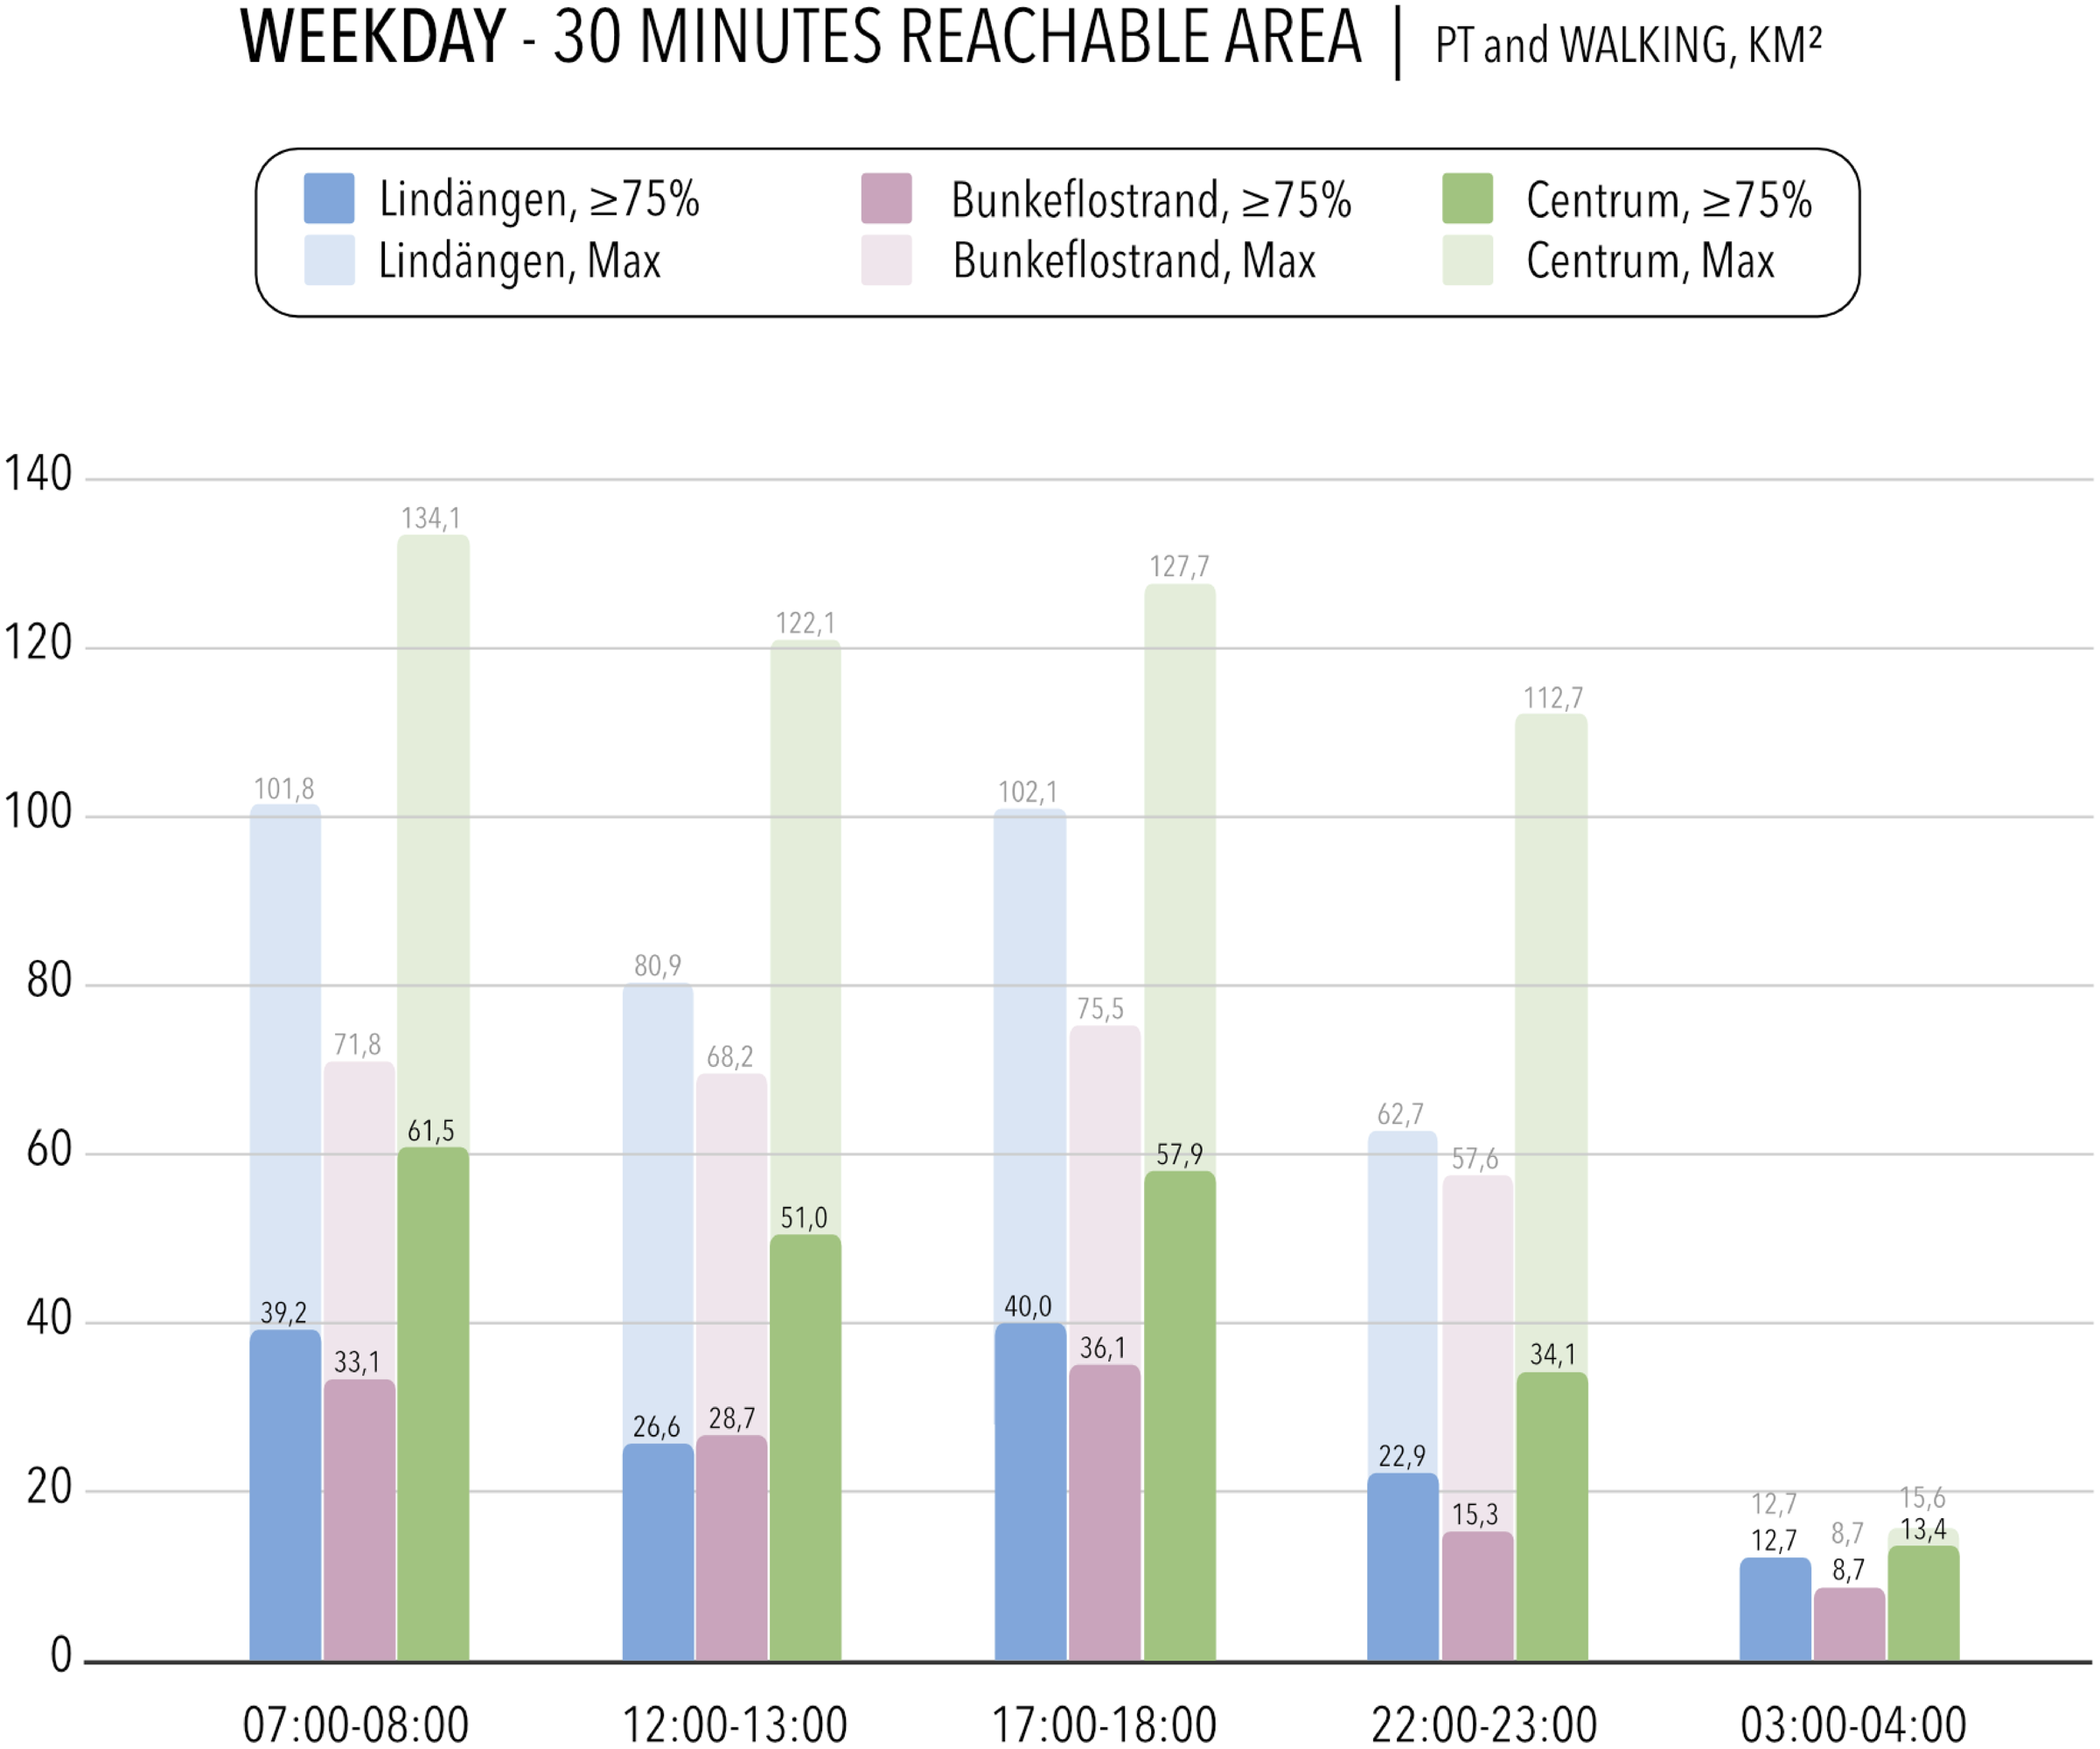
The results from the interviews and the GIS analysis indicate the unequal distribution of time-saving possibilities when travelling by PT, with higher resources for the chronometric dimension of time wealth in Bunkeflostrand. The lack of this opportunity for residents of Lindängen represents a potential hindrance to their time wealth, especially since the neighbourhood shows a lower average income and car ownership rate. Lower socio-economic status is often related to temporal disadvantage (Warren, 2003), and the lack of motorized alternatives to PT can create additional problems for those with less socio-economic resources (Belton Chevallier et al., 2018).
The synchronization dimension
The chronometric dimension can improve our understanding of the unequal distribution of temporal costs related to PT use from different origins and at different times, whereas the synchronization one can help us investigate whether the PT supply meets the users’ spatiotemporal access needs. The temporal extension of PT schedules in the two neighbourhoods does not present any remarkable differences. During weekdays, PT starts at approximately 04:30 and stops at 01:15 the following day; on Saturdays, it starts at approximately 05:30 and stops at 03:45 on the Sunday morning. However, the different routes’ start and end times vary significantly (Skånetrafiken, 2019). Interviewee B4 expressed satisfaction with the possibility of using PT at night, considering the peripherality of the neighbourhood. However, several critical aspects emerged about the inadequacy of PT supply in off-peak hours, especially early mornings, late evenings, nights and on weekends.
The gap in the service occurring between the last and the first trip forces, in some cases, adaptive behaviours and long waiting times. This is particularly critical for those working night shifts in other outskirt areas of the city or for early commuters: I know people who work in [a district in the eastern outskirts of Malmö] and it’s not convenient to go there by bus. They would drive or they would take the last bus and wait for their shift […], so sometimes they have to wait for a long time and that’s really inconvenient. […] (L2).
Additionally, the inadequacy of the PT service at night constitutes a problem of personal safety when the users are forced to walk: ‘It feels safer to use public transport than to walk alone in the middle of the night as a girl’ (L1). In order to avoid ‘unpleasant’ (B6) waiting times or night walks, the trips by PT are preceded by a constant concern over planning. The lack of PT at night brings some participants to opt for more expensive modes (e.g. taxi or private car). In a similar way, higher headways during the weekend pose further constraints for commuters, causing crowding or requiring reliance on (someone with) a car.
By overlaying percentage access polygons and the relevant destinations indicated by the participants, Figures 5, 6, 7, and 8 show a spatiotemporal visualization of both the access needs of interviewees and the access opportunities provided by PT. The visualization shows how, in the case of interviewees from both neighbourhoods, most of the indicated destinations are reachable in less than 30 min during the day on weekdays. However, during secondary temporalities, that is, outside the rhythms of the majority according to which the service is scheduled (especially weekday evenings and nights), some relevant destinations cannot be reached in less than 60 min, even when they are located within the city limits (Figures 6 and 8). Reachable area by PT and walking in different time frames (Percent access polygons, ≥75%) and relevant interviewees’ destinations during the day (06:00–17:59), in a weekday and in the weekend. Origin: Bunkeflostrand. Source: Own elaboration (Esri ArcGIS Pro – Percentage Access Polygons) on GTFS data (Trafiklab, 2019b), road data (Geofabrik, 2020), interviews and travel diaries (Collected in 2019–2020). Basemap: Light Gray Canvas (Basemap sources: Esri, HERE, Garmin, FAO, NOAA, USGS, © OpenStreetMap contributors, and the GIS User Community). Reachable area by PT and walking in different time frames (Percent access polygons, ≥75%) and relevant interviewees’ destinations during the evening and night (18:00–05:59), in a weekday and in the weekend. Origin: Bunkeflostrand. Source: Own elaboration (Esri ArcGIS Pro – Percentage Access Polygons) on GTFS data (Trafiklab, 2019b), road data (Geofabrik, 2020), interviews and travel diaries (Collected in 2019–2020). Basemap: Dark Gray Canvas (Basemap sources: Esri, HERE, Garmin, FAO, NOAA, USGS, © OpenStreetMap contributors, and the GIS User Community). Reachable area by PT and walking in different time frames (Percent access polygons, ≥75%) and relevant interviewees’ destinations during the day (06:00–17:59), in a weekday and in the weekend. Origin: Lindängen. Source: Own elaboration (Esri ArcGIS Pro – Percentage Access Polygons) on GTFS data (Trafiklab, 2019b), road data (Geofabrik, 2020), interviews and travel diaries (Collected in 2019–2020). Basemap: Light Gray Canvas (Basemap sources: Esri, HERE, Garmin, FAO, NOAA, USGS, © OpenStreetMap contributors, and the GIS User Community). Reachable area by PT and walking in different time frames (Percent access polygons, ≥75%) and relevant interviewees’ destinations during the evening and night (18:00–05:59), in a weekday and in the weekend. Origin: Lindängen. Source: Own elaboration (Esri ArcGIS Pro – Percentage Access Polygons) on GTFS data (Trafiklab, 2019b), road data (Geofabrik, 2020), interviews and travel diaries (Collected in 2019–2020). Basemap: Dark Gray Canvas (Basemap sources: Esri, HERE, Garmin, FAO, NOAA, USGS, © OpenStreetMap contributors, and the GIS User Community).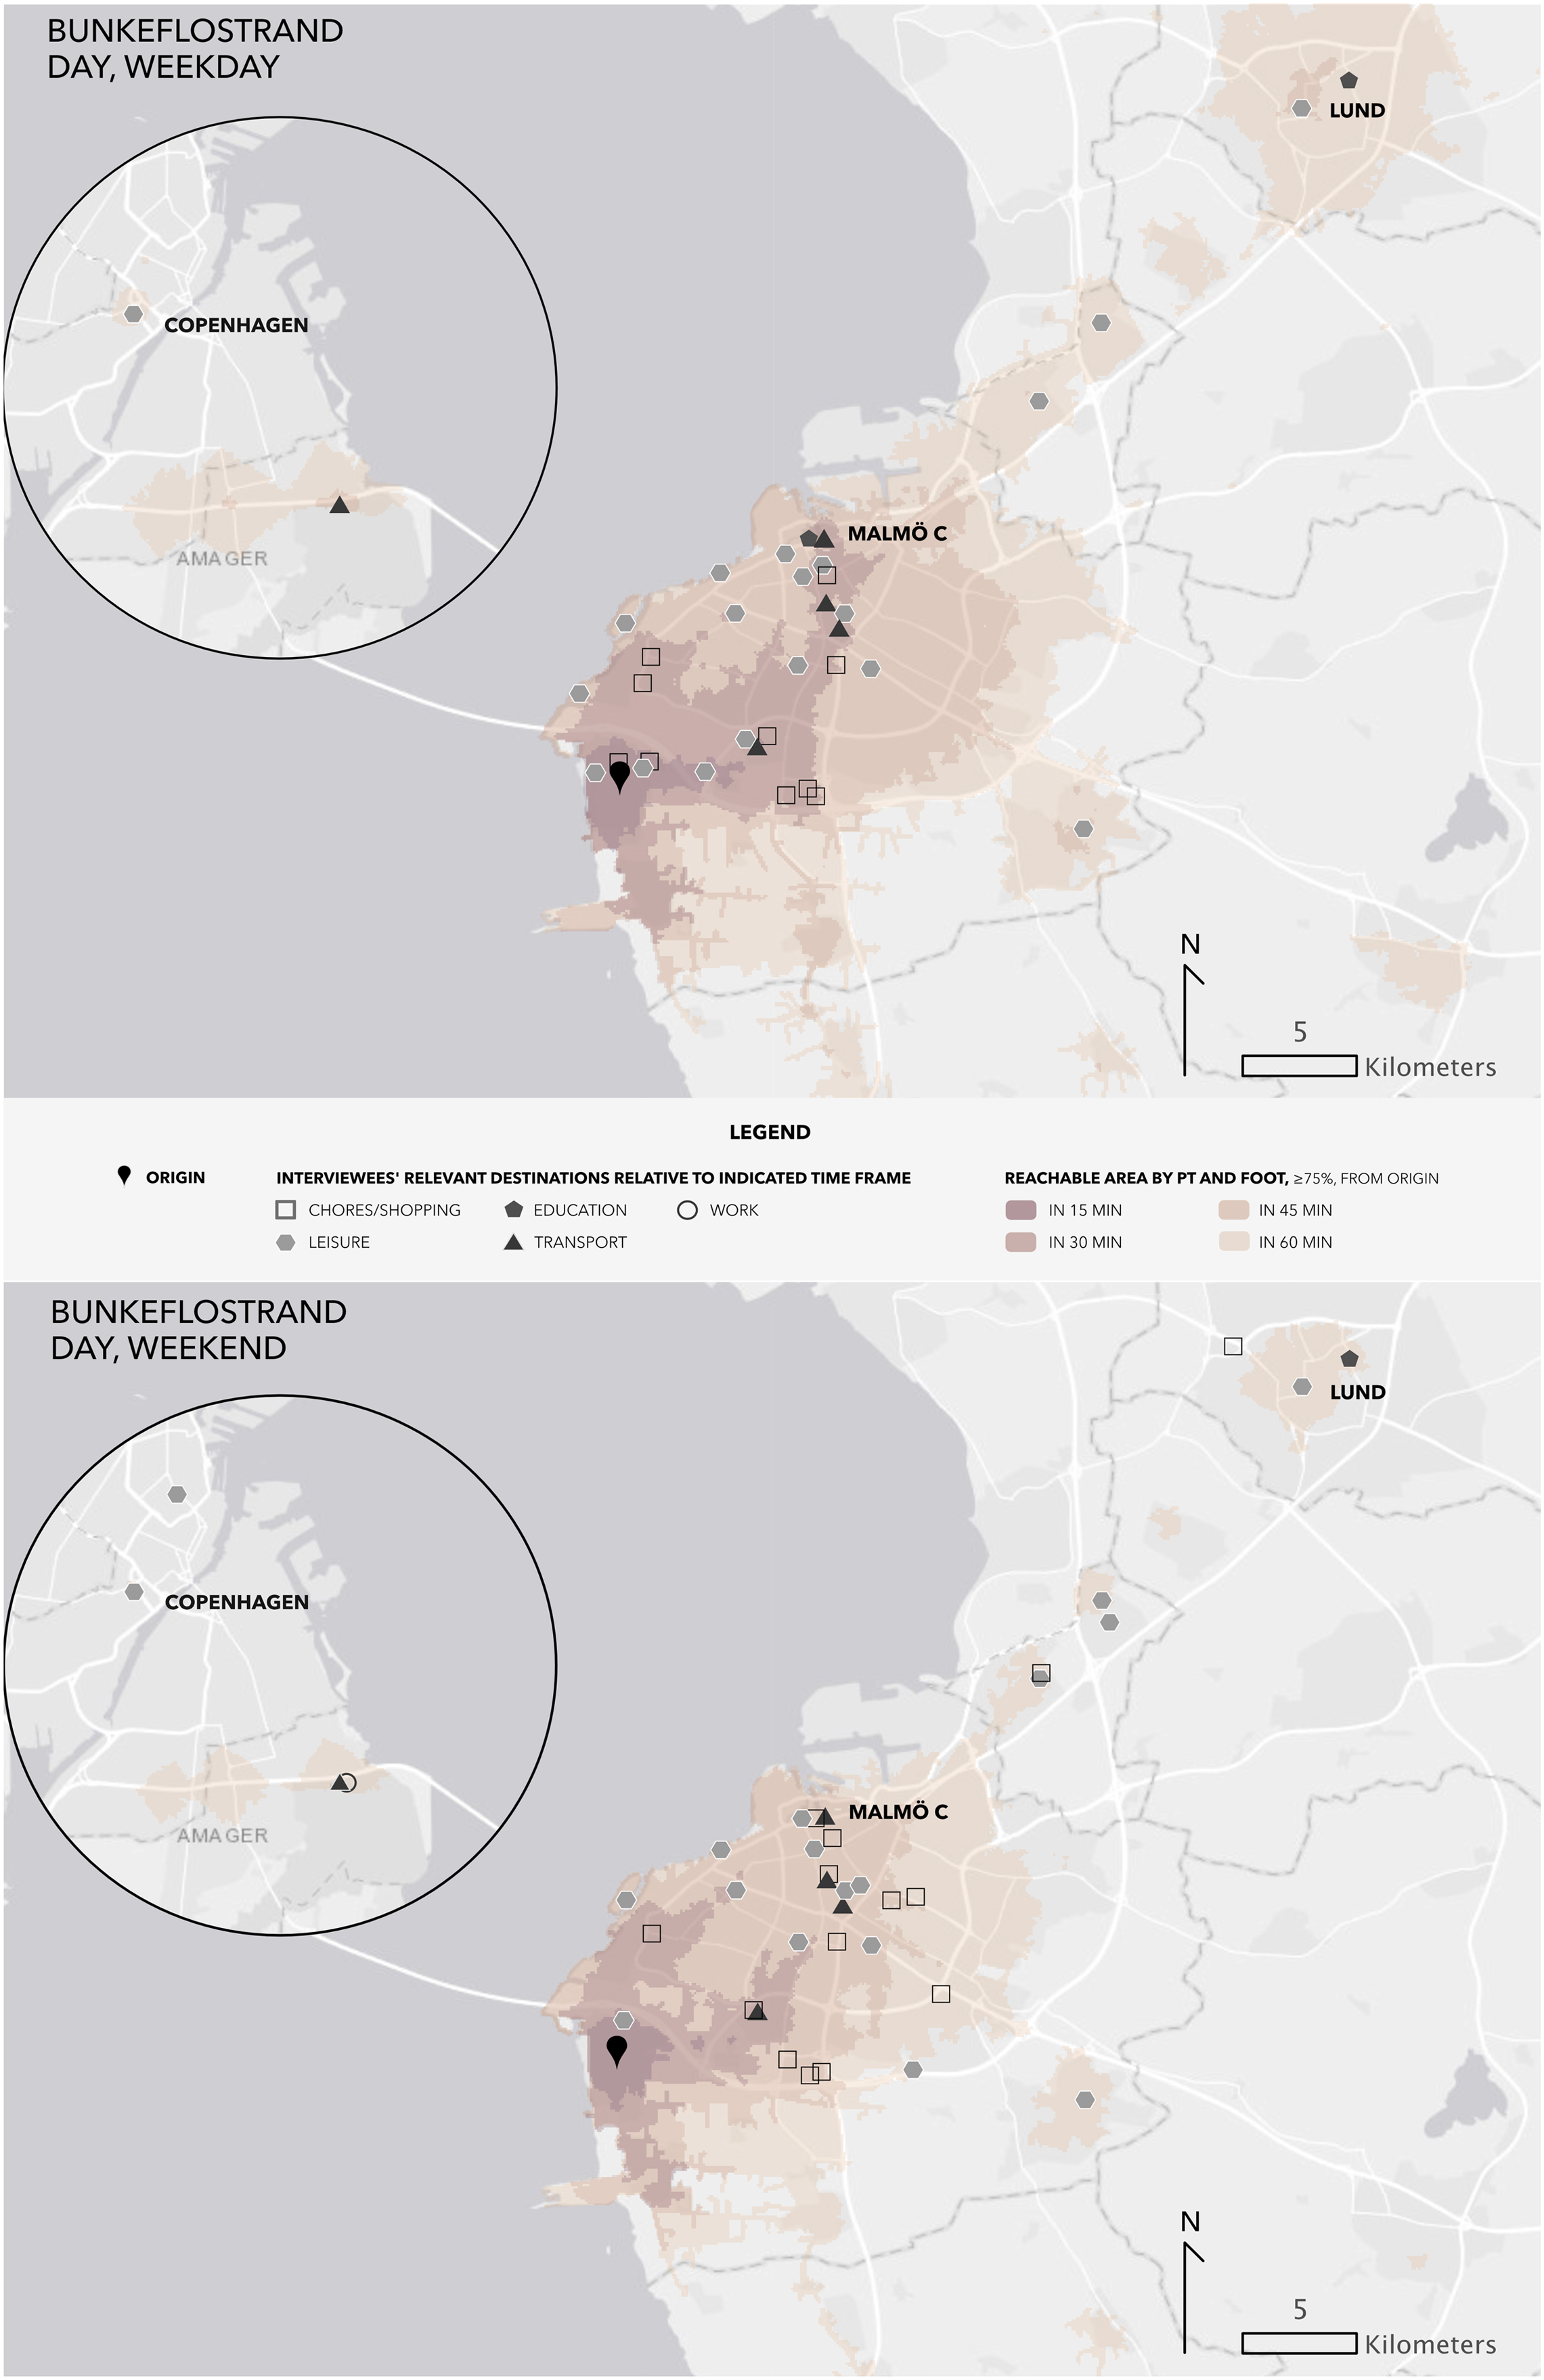
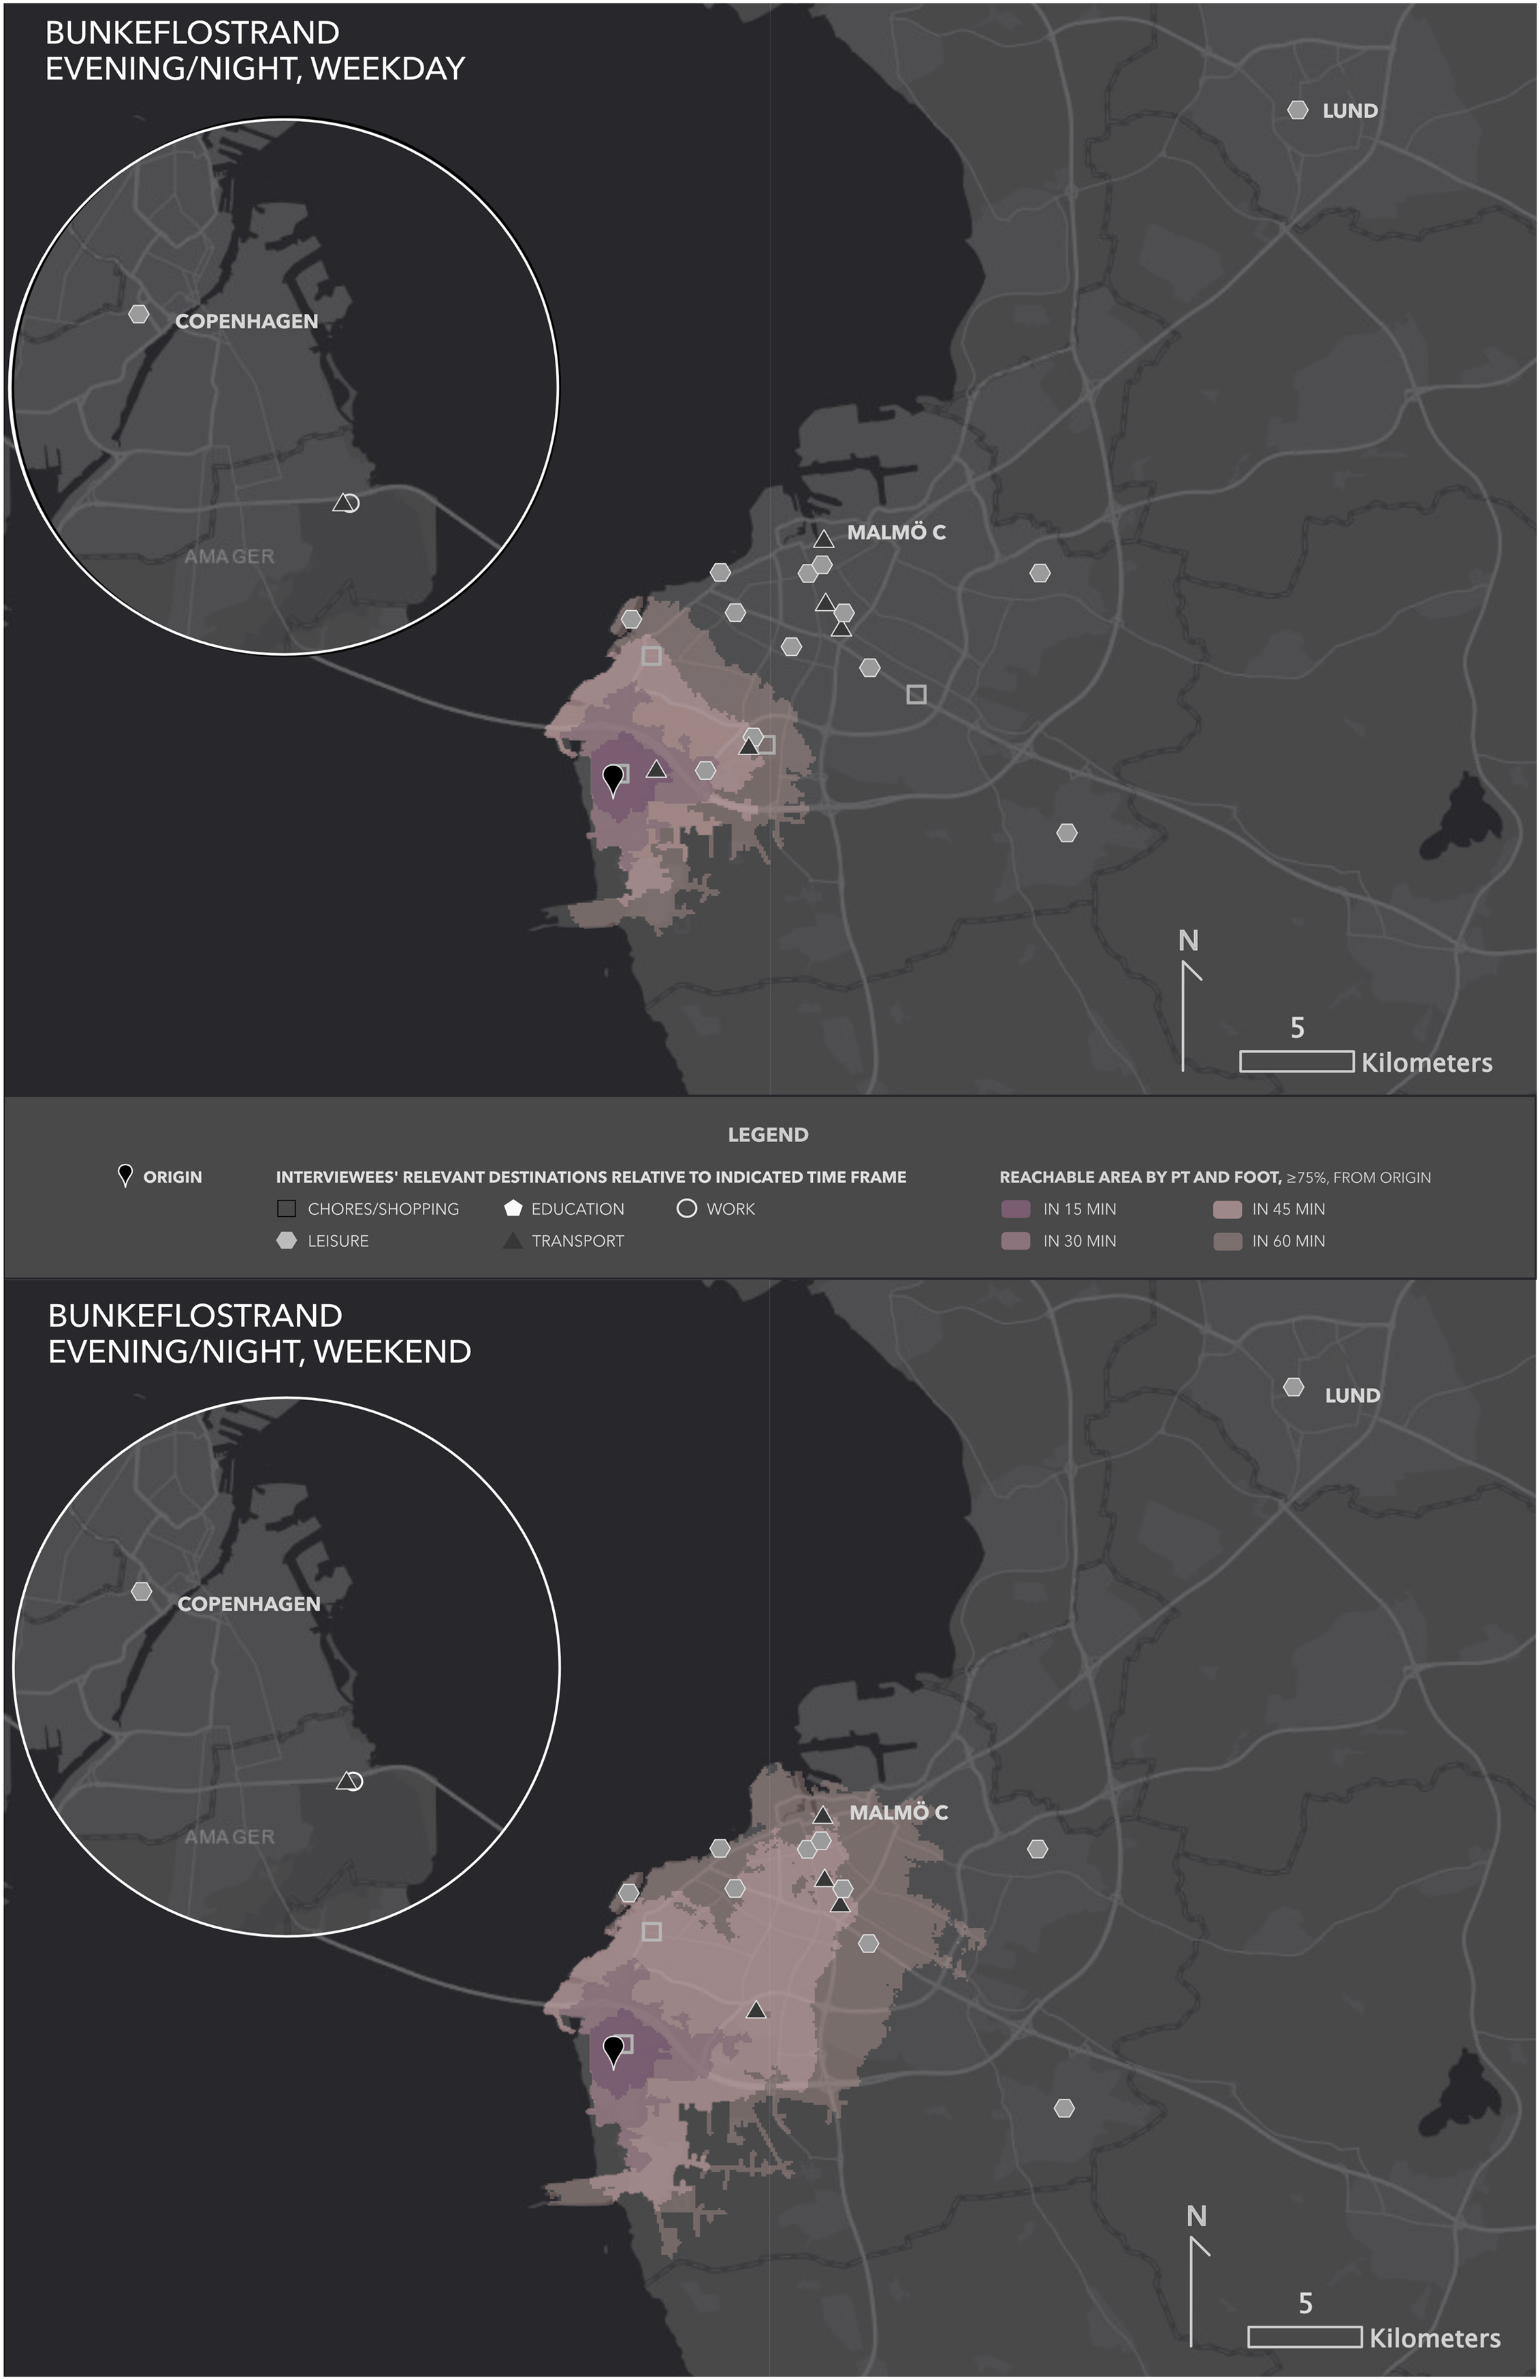
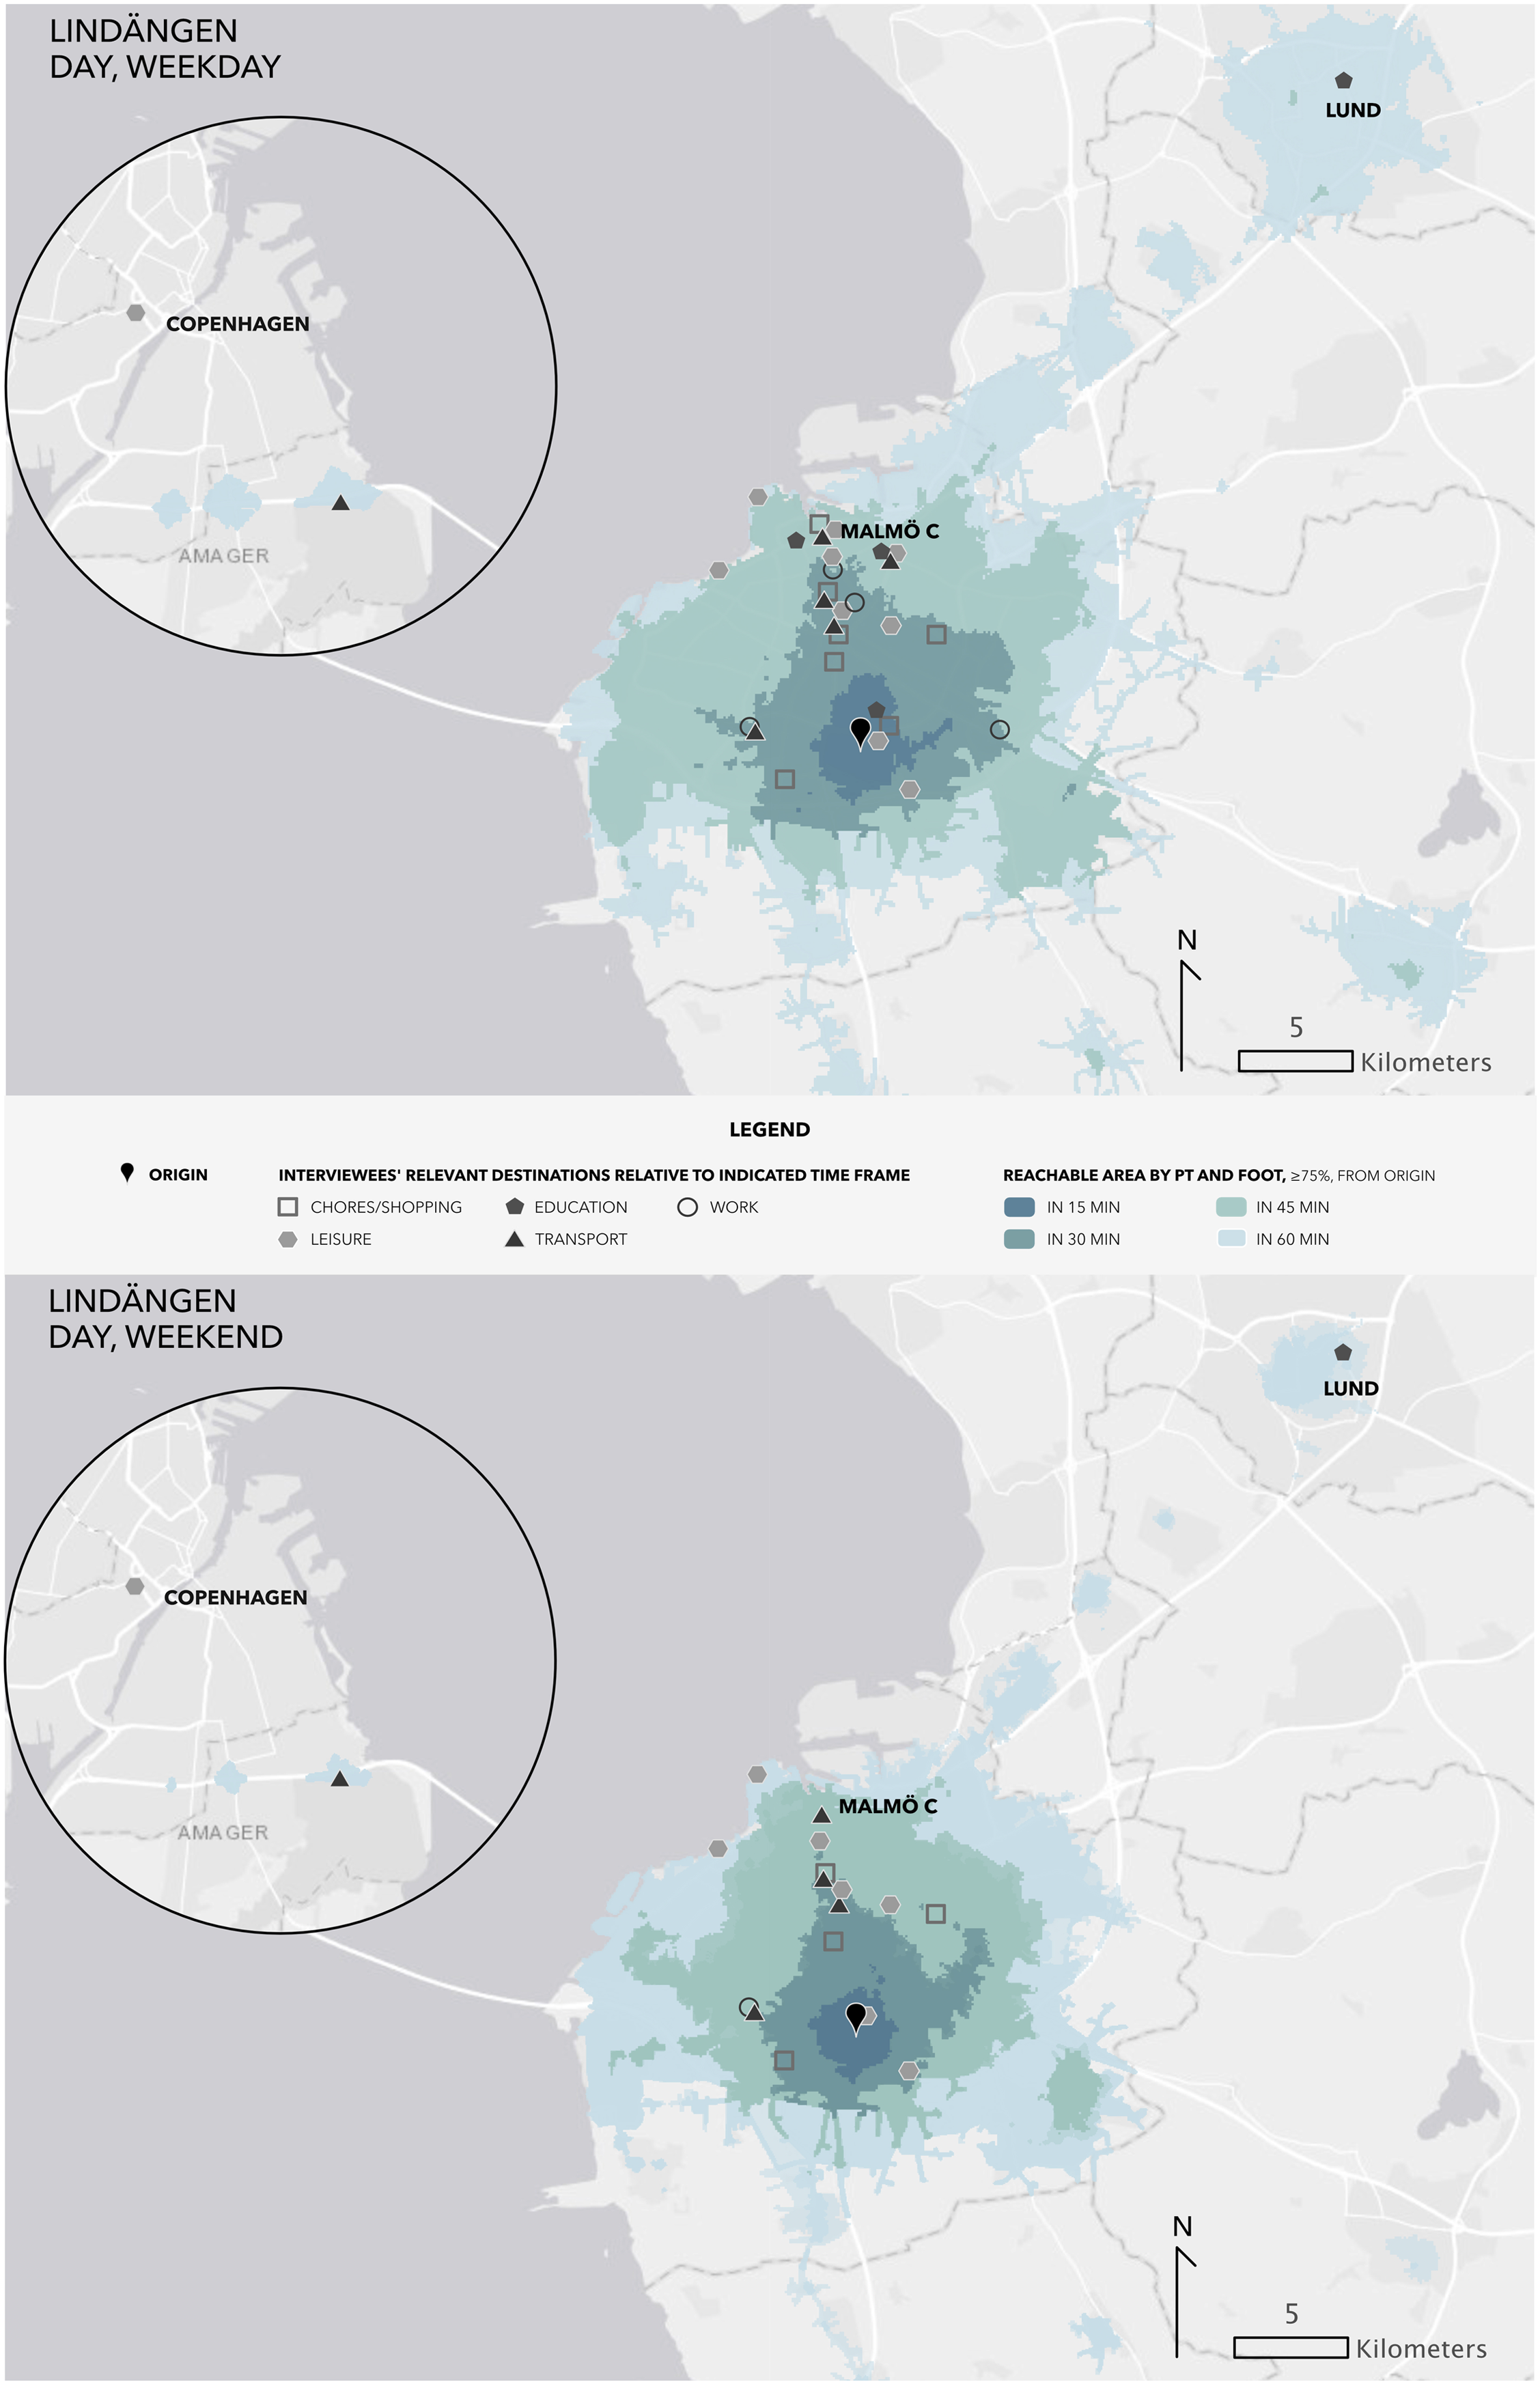
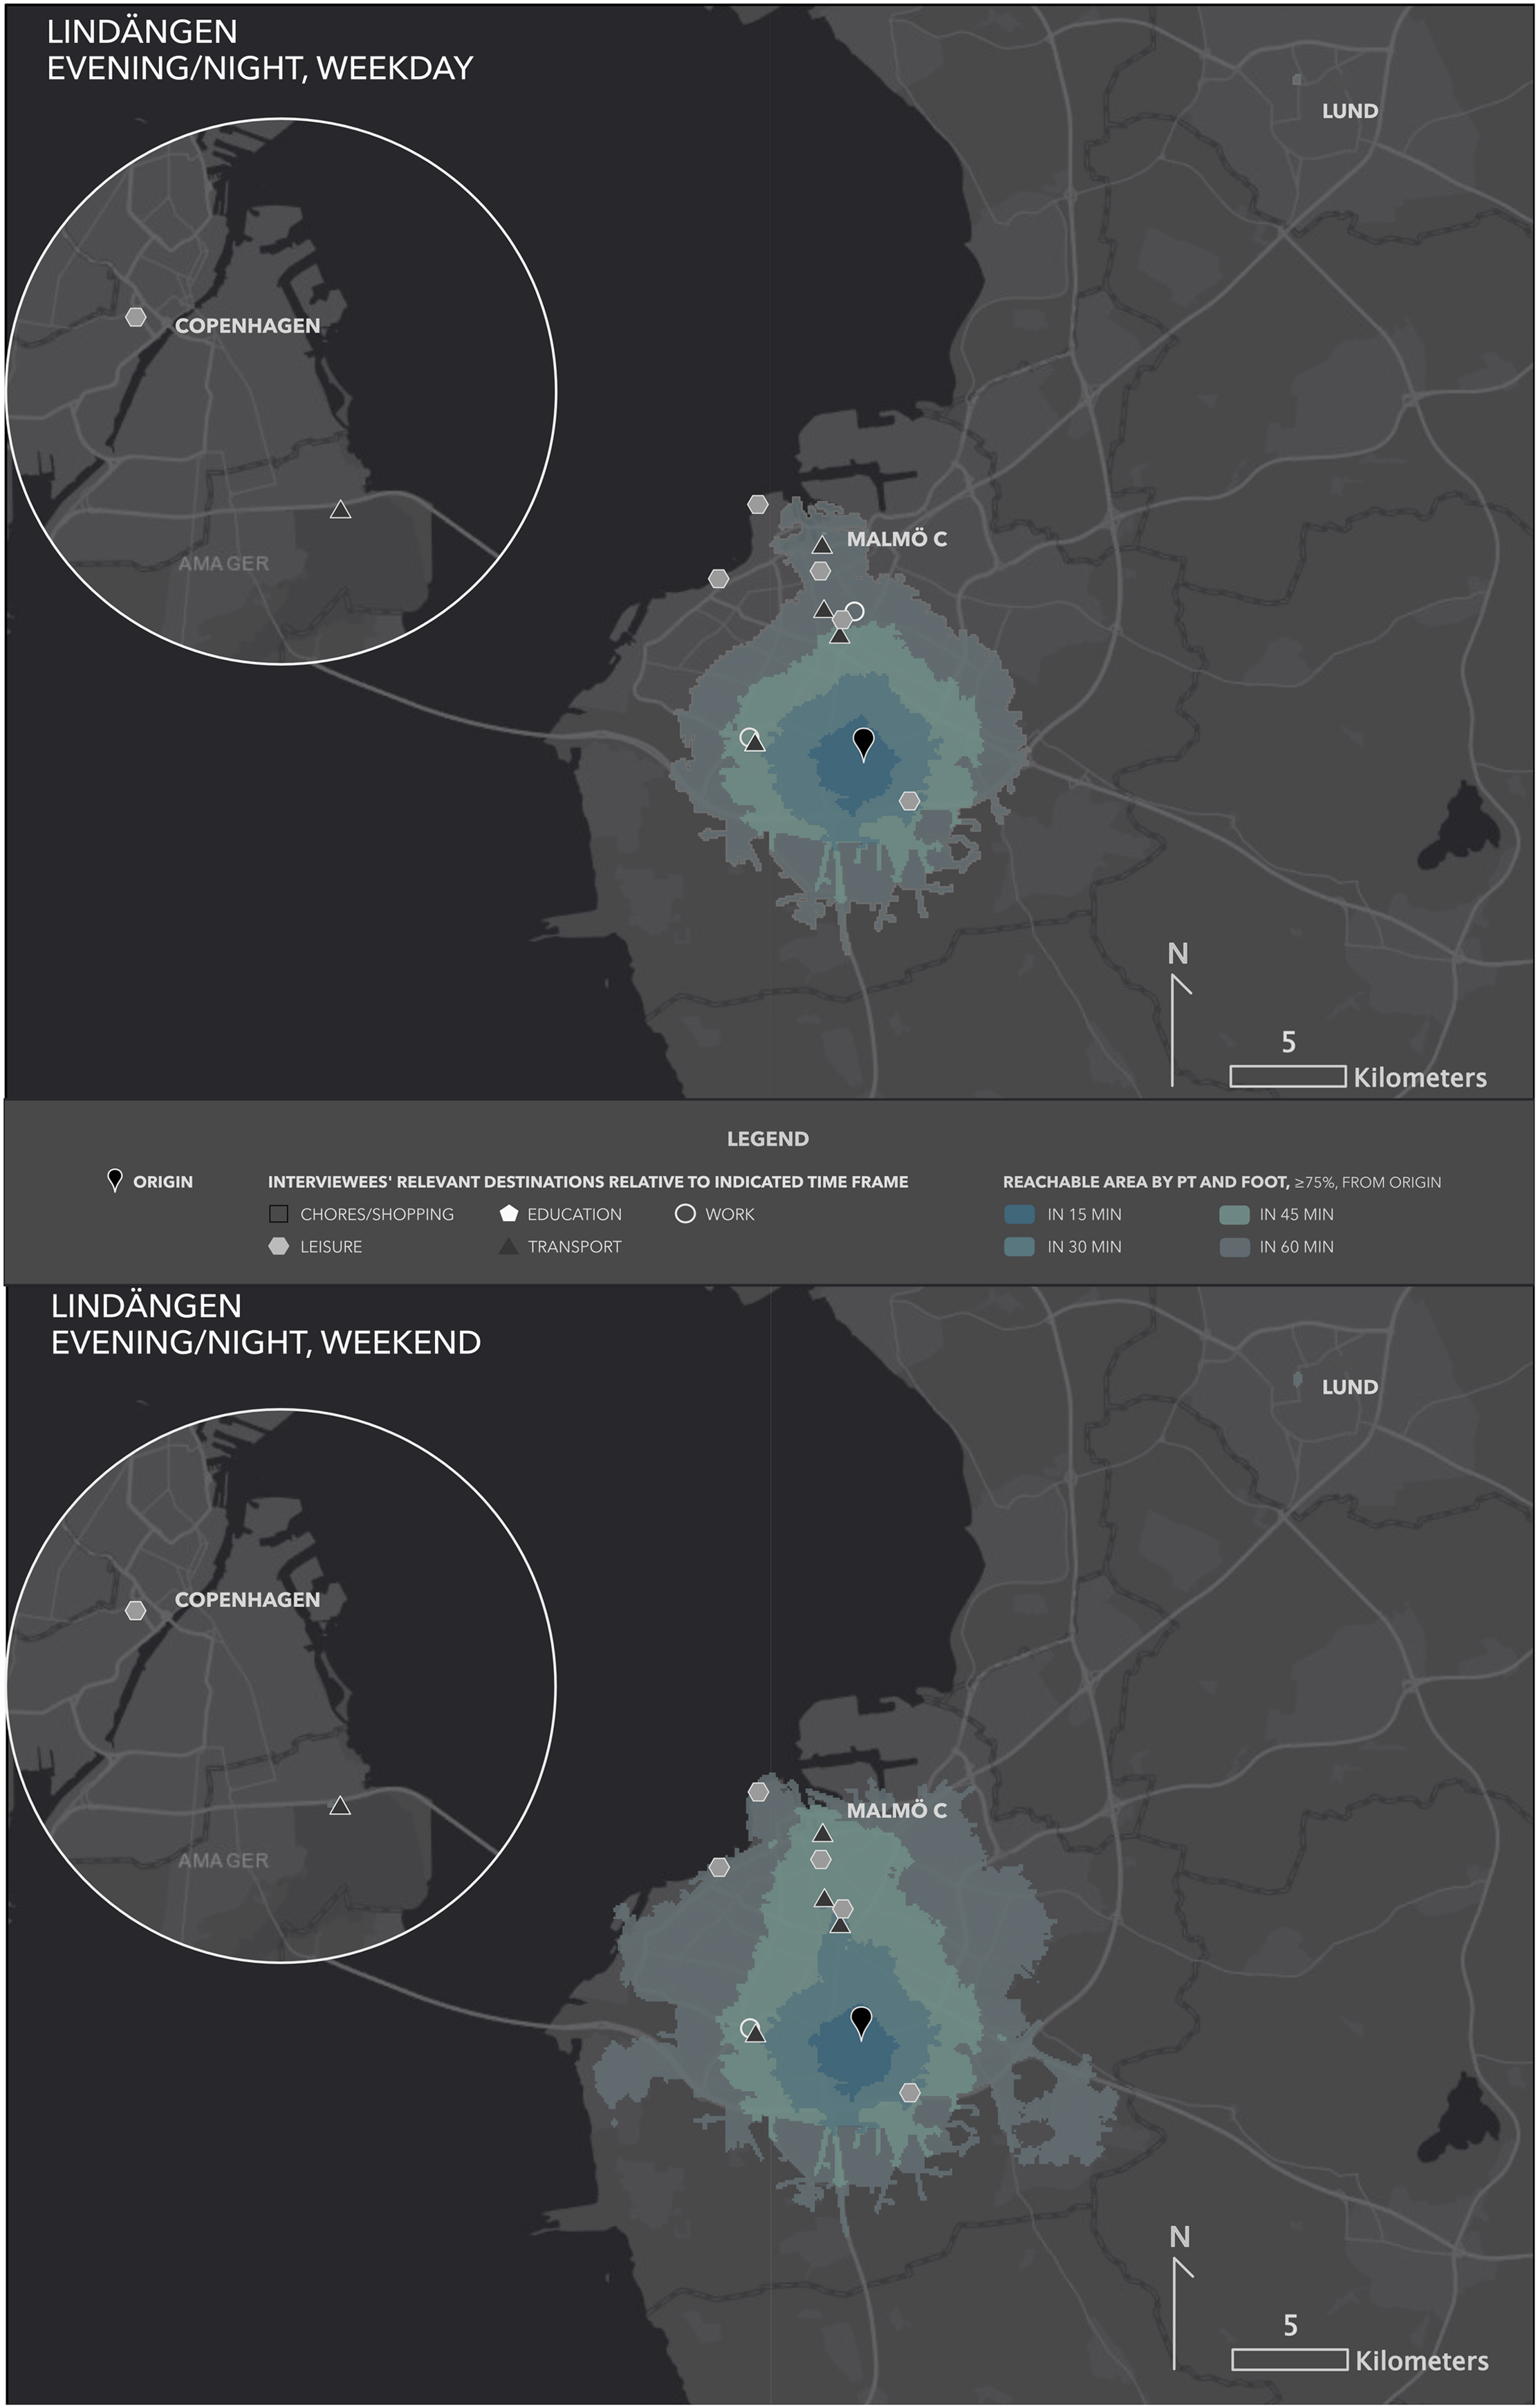
These results indicate that the spatiotemporal mismatch between the PT provision and the access needs can expose those who need to travel during secondary temporalities to inaccessibility. As a result, certain categories of users, for example, those working non-standard hours, early commuters and workers or users of the night-time economy, are exposed to additional temporal costs when relying on PT (Gwiazdzinski, 2007; McArthur et al., 2019). The lack or inadequacy of PT during the night can result in exclusion from participating in relevant work or socializing activities when no other transport options are available, affordable or accessible, as shown, for instance, in previous research on young people (Espinasse and Buhagiar, 2004).
The sovereignty dimension
Public transport service’s ability to support users’ control on their own time during the PT journey is related to (a) the reliability of PT schedules and the predictability of travel times and (b) the ease by which users can plan their trip in advance or following disruptions through real-time and accessible information.
In the interviewees’ experience, the reliability and predictability of journeys by PT can be hindered by delays (related, for instance, to congestion), cancellations, earlier departures, crowding and unavailability of space for strollers or wheelchairs. The experienced reliability and predictability vary among the interviewees in both neighbourhoods, ranging from enthusiastic satisfaction (‘It never disappoints me [...] I mean, taking into consideration it is a peripheral area, it is very well served [by PT]’ – B4) to dissatisfaction and annoyance because of delays, earlier departures or crowding (which, in some cases, forces passengers to wait for the next bus). The result is a negative image of PT reliability: ‘It’s easier to trust yourself when driving or biking, than to trust public transport’ (L1).
In order to cope with the mentioned disruptions, interviewees adopt a series of behaviours to maintain some control on their travel time: some check the real-time information in the app; some resort to different modes, for example, walking, biking or relying on last-minute car rides by friends or relatives. Interviewee B2 mentioned ticket refund schemes in case of delays as positive measures to partly compensate for the lack of reliability and predictability of PT.
Similar to long travel times, the lack of reliability increases our interviewees’ sense of time pressure: Interviewer: What do you like the least about public transport? Interviewee: When the bus is not on time, and I have to get to work. Also, when going home, it’s a bit stressful: you want to get home, make some food before heading off to the children’s activities. So, our days are stressful, we have a lot of things to fit in (B10).
When the information systems (e.g. the front displays on the vehicles or the waiting time information on displays at stops) are not working properly or are absent, further delays in the journey and disruptions can happen. Figure 9 shows the distribution of information displays, revealing how certain areas of the city, including Lindängen, were not equipped with them when the data was retrieved. Map showing the distribution of real-time information displays at PT stops in Malmö in July 2020. Source: Own elaboration on data from Skånetrafiken. Basemap: Light Gray Canvas (Basemap sources: Esri, HERE, Garmin, FAO, NOAA, USGS, © OpenStreetMap contributors, and the GIS User Community).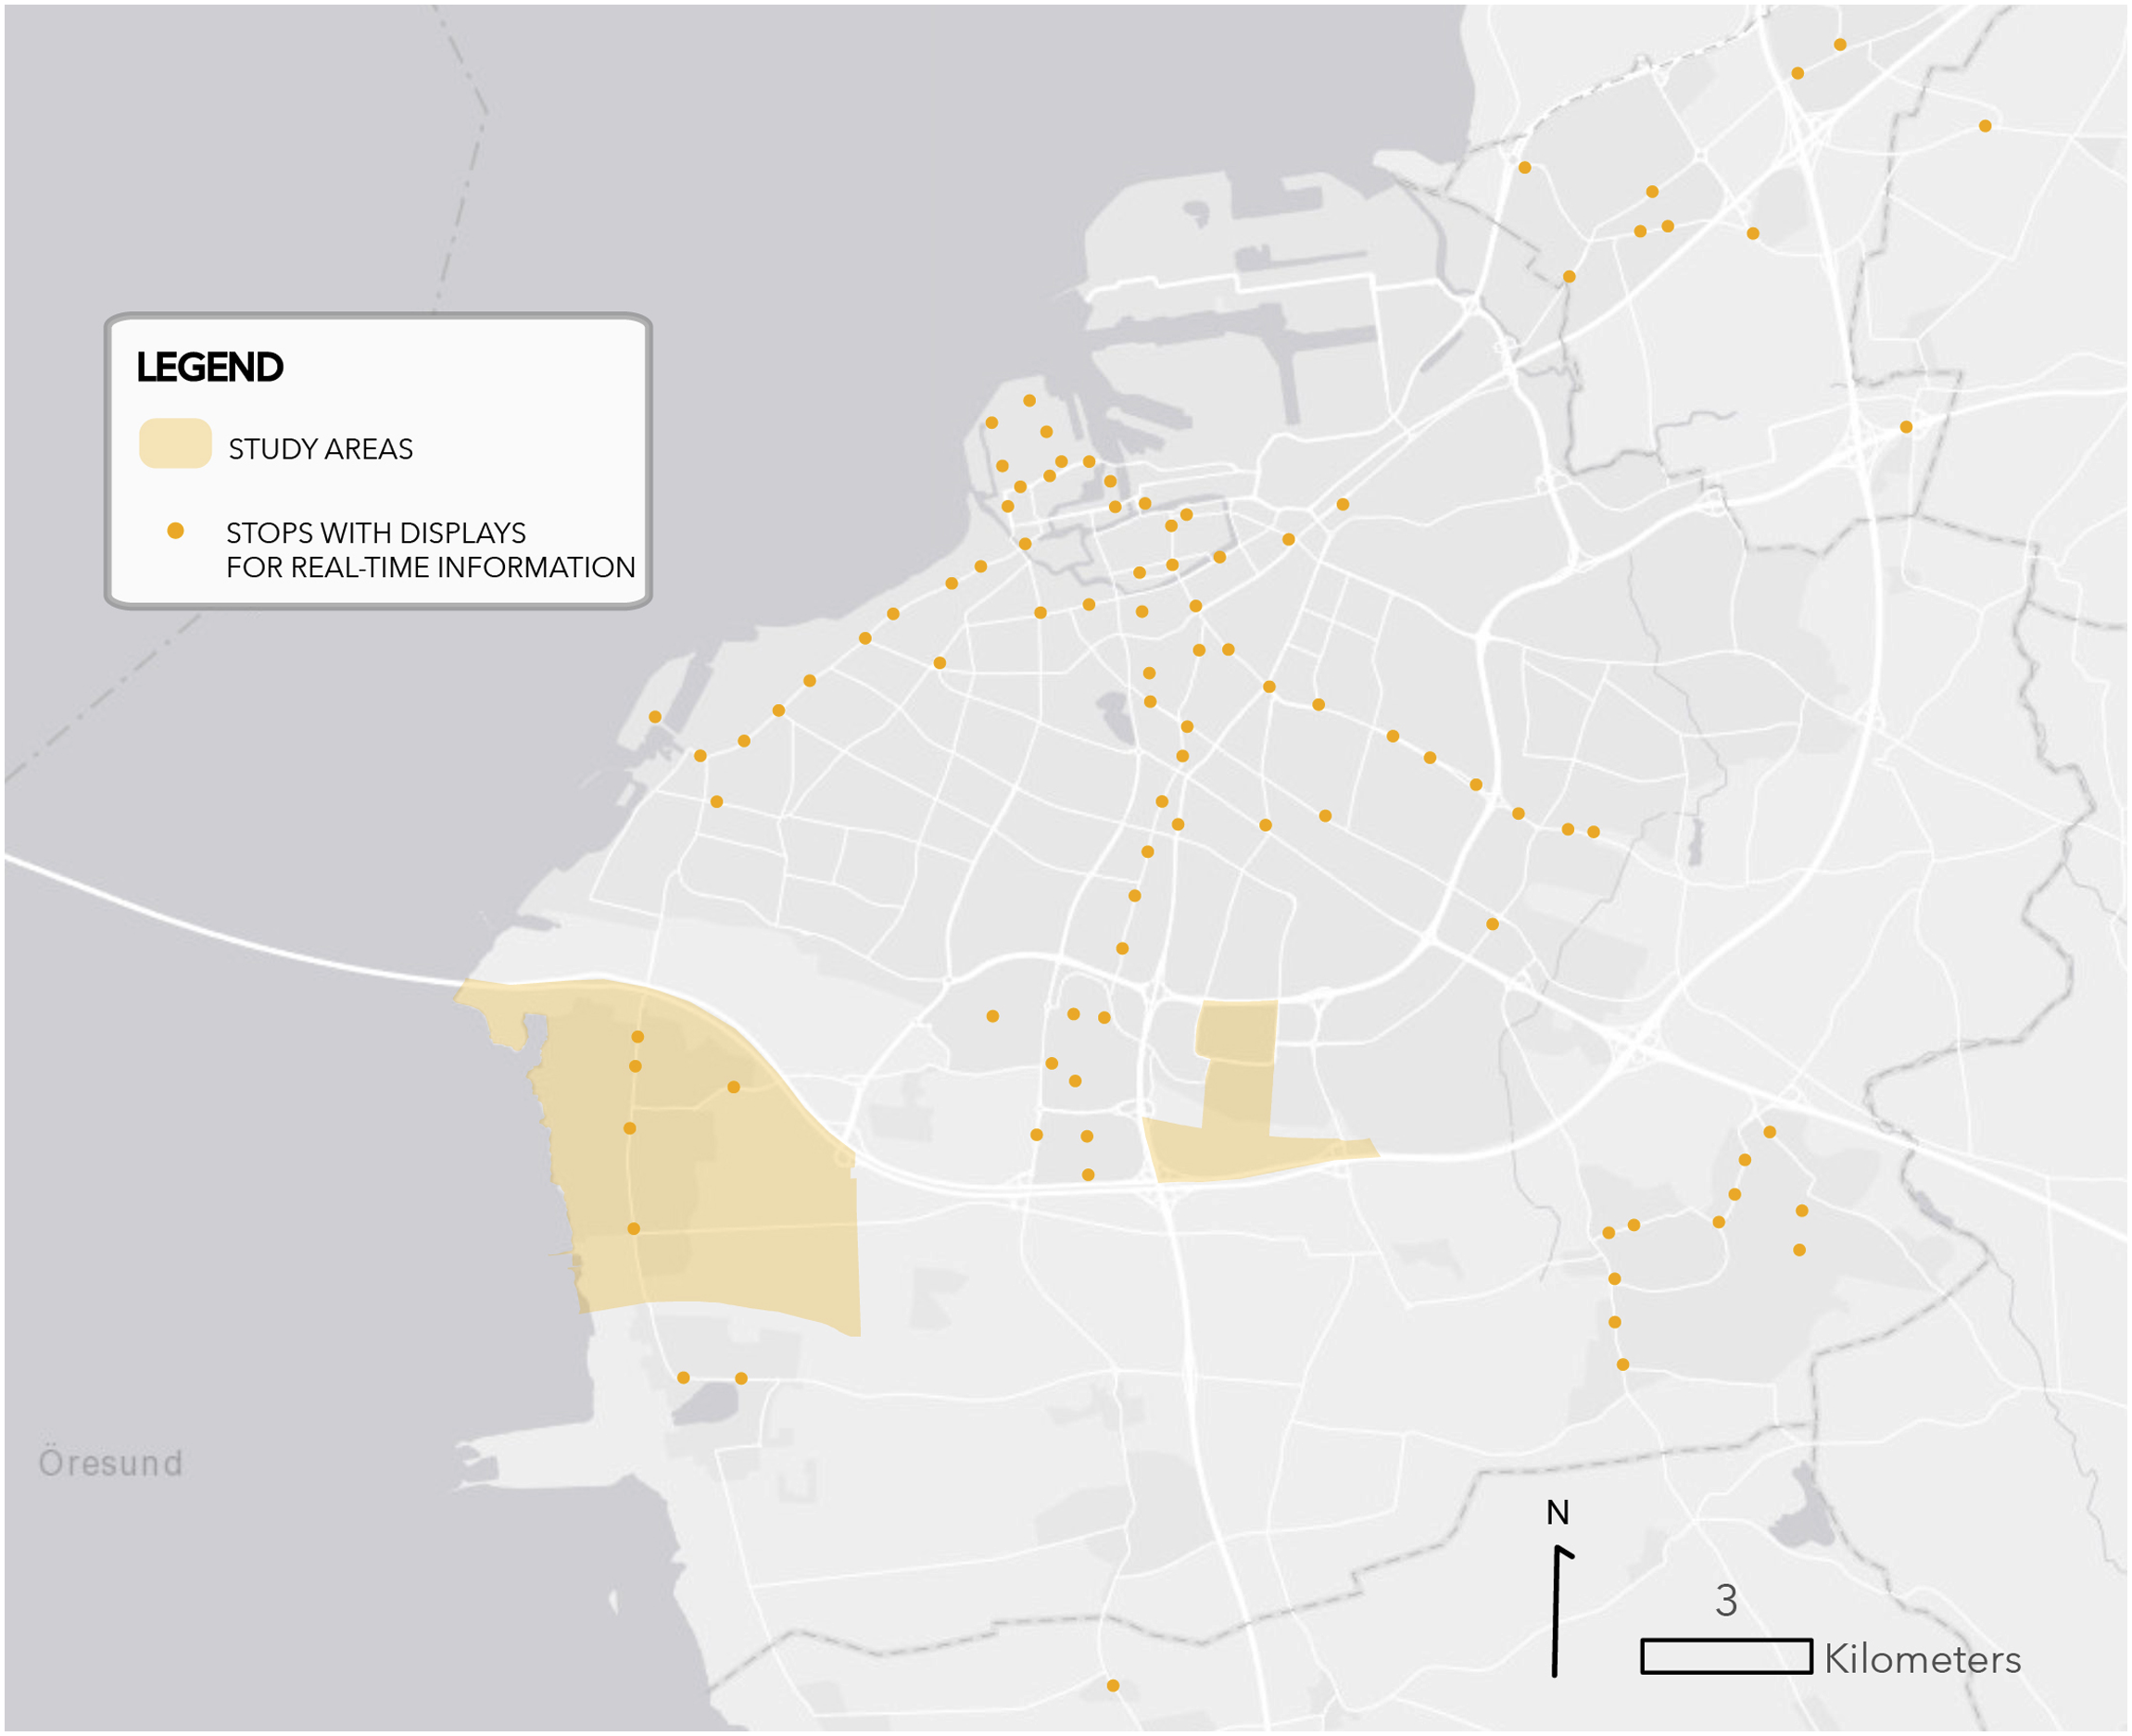
These results show how interviewees in both neighbourhoods experience the shortcomings of the local PT provision regarding reliability, predictability and information – with the residents in Lindängen being equipped with less infrastructure for information. Time sovereignty is a crucial factor in determining modal choice (Cass et al., 2003). Also, it is unequally distributed among different groups, with lower socio-economic status being related to less flexibility and control on the timing of the working day (Elchardus, 1991; Breedveld, 1998; Warren, 2003). Additionally, as digital poverty can create barriers to access to information, a provision of information that does not rely on the individuals’ digital tools and literacy is of pivotal importance to support sustainable and inclusive urban mobility (Velaga et al., 2012).
Conclusions
Public transport is a crucial pacemaker and its ability to meet the spatiotemporal access needs of (potential) users can profoundly affect everyday life opportunities and travel attitudes and behaviours. The spatiotemporal and thematic analysis conducted on the collected and retrieved data allows us to answer the research question (What aspects of the current PT provision in Malmö hinder or support time wealth for residents of peripheral neighbourhoods?) with regard to the two study contexts selected. Concerning the chronometric dimension, the current PT provision in Malmö provides residents in Lindängen (the neighbourhood with lower average socio-economic level and car ownership rate) with fewer resources for time-saving, which might result in lower accessibility to relevant destinations and higher reliance on private motorized means of transport. Regarding the synchronization dimension, the analyses highlighted constraints to spatiotemporal accessibility during off-peak hours for both neighbourhoods. This can result in additional transport disadvantage and temporal costs for PT users whose time-use patterns do not conform to those of the majority (e.g. those working shifts, unsocial, or non-standard hours) and can create an incentive to car use or car-dependency. Lastly, concerning the sovereignty dimension, PT seems to support time wealth by means of the ease to plan trips via the app, but presents constraints related to reliability (e.g. delays and earlier departures) and to the unequal distribution of real-time displays, which were, for instance, not available in Lindängen at the time of the study.
Notwithstanding its limitations, the study shows the importance of addressing several dimensions of time wealth – and their distribution among different urban areas and social groups – to better adapt PT provisions to the spatiotemporal needs of passengers and, thereby, reduce the risk of inaccessibility and/or unsustainable travel behaviours. Additionally, since PT expansion can require high costs, interventions on time wealth-related aspects could provide more efficient solutions to improve PT in a financially sustainable way and, thereby, increase both accessibility and ridership. Nonetheless, PT is not the only pacemaker affecting time wealth in the city. Additionally, socio-temporal processes, ideologies and practices affecting time wealth (e.g. related to the acceleration of life) cannot be easily addressed by local interventions. Drawing upon both our results and the experience of local time policies (see the section ‘Time wealth, local time policies and spatiotemporal accessibility inequalities’), we put forward the following reflections on the analysed dimensions of time wealth and their relation to policy: • Chronometric dimension: PT-related time scarcity and its unequal distribution in the urban fabric can be addressed by tracking the spatiotemporal distribution of opportunities for higher speed. They can include smooth connections to transport nodes and hubs, synchronized intermodality and PT prioritization. Also, providing opportunities for ‘productive multitasking’ (Malokin et al., 2021) (e.g. USB chargers and comfortable seating) can help address the sense of time loss related to PT trips and provide more opportunities, in comparison to the private car, for satisfactory time use. • Synchronization dimension: Adapting PT provision – whose efficiency is largely based on common rhythms and common destinations – to polyrhythmic and desynchronized access needs is challenging. Close coordination between PT authorities and local public and private stakeholders responsible for the different pacemakers’ schedules (e.g. dialogue with employers, especially if located in peripheral areas and adopting non-standard working times) would greatly support spatiotemporal accessibility by PT. The experiences of local time policies and ‘mobility pacts’ in Europe can provide useful strategies in this regard and support time-efficient decisions concerning the allocation of resources. • Sovereignty dimension: Control on the time of travel, reliability and predictability are probably the aspects where the private car’s benefits are harder to equal by PT while maintaining financial and environmental sustainability. In order to support time wealth in this regard, and thereby improve accessibility and PT attractiveness, it is crucial to provide access to information for all users taking into consideration issues of digital poverty.
In this paper, we focused on the temporal dimension as a crucial facet of unequal time geographies of accessibility, showing how its understanding is an increasingly important prerequisite for the planning of an accessible, equitable and attractive PT. However, time wealth is only one dimension of spatiotemporal accessibility. Factors related to spatial access, affordability, (perceived) safety, comfort and the built environment – all playing a role in affecting access and related to potential accessibility trade-offs (e.g. spatial accessibility vs. speed, affordability vs. frequency) – need to be taken into consideration for a comprehensive assessment of spatiotemporal accessibility.
Footnotes
Acknowledgements
Work on this article was made possible by K2 (The Swedish Knowledge Center for Public Transport), Malmö University, and VTI (The Swedish National Road and Transport Research Institute). The authors are particularly grateful to Christina Lindkvist and Jakob Allansson for their support in the research design and data collection, to Jean Ryan for her precious comments on earlier versions of the manuscript, to the anonymous reviewers for their valuable and constructive feedback, and to the editorial team.
Declaration of conflicting interests
The author(s) declared no potential conflicts of interest with respect to the research, authorship, and/or publication of this article.
Funding
The author(s) disclosed receipt of the following financial support for the research, authorship, and/or publication of this article: This work was supported by K2 (The Swedish Knowledge Center for Public Transport), Malmö University, and VTI (The Swedish National Road and Transport Research Institute).