
Abstract
Objective
To study the bone marrow (BM) immunohistomorphological characteristics in adult systemic lupus erythematosus (SLE) associated macrophage activation syndrome (SLE-MAS).
Materials and methods
Immunohistochemical (IHC) expression of CD3, CD8, perforin (PFN), and CD163 was studied on BM trephine biopsies from 30 cytopenic adult SLE cases (male: female = 1:5, age; 24 years, range; 19–32) and compared them with ten age matched controls. Clinicopathological parameters were compared among the cases likely (L) or unlikely (U) to have MAS using probability scoring criteria. The best cut off laboratory parameters to discriminate between the two were obtained through receiver operator curve (ROC) analysis.
Results
MAS occurred in 12/30 (40%) cases and was more commonly associated with prior immunosuppressive therapy (p = .07), ≥ 3 system involvement (p = .09), lower fibrinogen (p < .01), increased triglyceride (p = .002), increased BM hemophagocytosis (p = .002), and higher MAS score [185 (176–203) vs. 105 (77–119), p < .01] than MAS-U subgroup. Although PFN+CD8+ T lymphocytes significantly decreased among cases than controls (p < .05), it was comparable between MAS-L and MAS-U subgroups. Fibrinogen (< 2.4 g/L, AUC; 0.93, p < .01), hemophagocytosis score (> 1.5, AUC; 0.71, p = .03), and an MAS probability score of ≥ 164 (AUC; 1, p < .01) discriminated MAS from those without MAS.
Conclusion
We noted a decrease in perforin mediated CD8 + T cell cytotoxicity in SLE. Immunohistochemical demonstration of the same along with histiocytic hemophagocytosis on BM biopsy may be useful adjunct in early diagnosis and management of MAS in SLE.
Introduction
Systemic lupus erythematosus (SLE) is a chronic autoimmune disease with diverse manifestations which results due to pathogenic autoantibodies and subsequent dysregulated inflammatory response secondary to formation of immune complexes. 1 Data from low and middle income countries (LMICs) have reported incidence and prevalence ranging from 0.3 to 8.7 and 3.2 to 3000/1,00, 000 persons, respectively. 2 The mean age at diagnosis ranged from 25.5 to 45.8 years with female preponderance (female to male = 9:1). Up to 15 to 20% SLE cases occur in childhood (up to 16 years) (pediatric SLE) with a mean age at diagnosis of 8.6 to 13.5 years and this usually has an aggressive clinical course compared to adults with dominant neurological and renal manifestations. 3
Macrophage activation syndrome (MAS), a form of secondary hemophagocytic lymphohistiocytosis (HLH) in rheumatic diseases, may complicate the clinical course SLE with or without SLE directed therapies, and its occurrence is most frequently associated with active SLE disease or associated infection/sepsis. 4 The exact prevalence of SLE-MAS is not known; and this has been reported to range from 0.9 to 4.6% in several studies. 5 Literature review have highlighted an increased risk of ICU admissions (up to 30%) and in hospital mortality (up to 20%). 6 SLE-MAS may pose diagnostic challenge due to its clinical resemblance with SLE flare and/or associated sepsis, which necessitates different therapeutic approaches causing increased morbidity and mortality.
Previous studies pertaining to quantitative and qualitative aspects of cytotoxic T lymphocytes (CTL) and natural killer (NK) cells, two key players of perforin (PFN) mediated cell cytotoxicity, have yielded both supportive as well as contradictory results in SLE subjects with or without MAS.7–9 In this report, we aimed to describe the morphological and immunohistochemical profile of adult cytopenic SLE with or without associated MAS with a special note on PFN immunoexpression on bone marrow trephine biopsy sections (BMBx) and compare the data with clinicohematological parameters. We also present a comprehensive review of the published data pertaining to impaired T cell mediated cytotoxicity in such clinical syndrome.
Materials and methods
We conducted a cross sectional, hospital based, prospective, observational study (December 2020 to June 2022) including all adult (≥ 18 years) SLE subjects diagnosed as per 2019 EULAR/ACR criteria and presented to the Department of General Medicine of our institute with bicytopenia or pancytopenia and evaluated for associated MAS.
10
We defined cytopenia (s) based upon the cut off values as proposed by Fardet et al for predicting HLH: hemoglobin (Hb); < 92 g/L, leukocyte count (TLC); < 5 x 10⁹/L, and platelet count (TPC); < 110 x 109/L.
11
All other SLE cases with associated other autoimmune disorders (mixed connective tissue disorders/overlap syndromes), documented sepsis and/or liver or kidney disease unrelated to SLE, and associated hematological malignancies were excluded from the study. The Institutional Ethics Committee our Institute approved the study protocol (Figure 1). An algorithm of study protocol in the present study.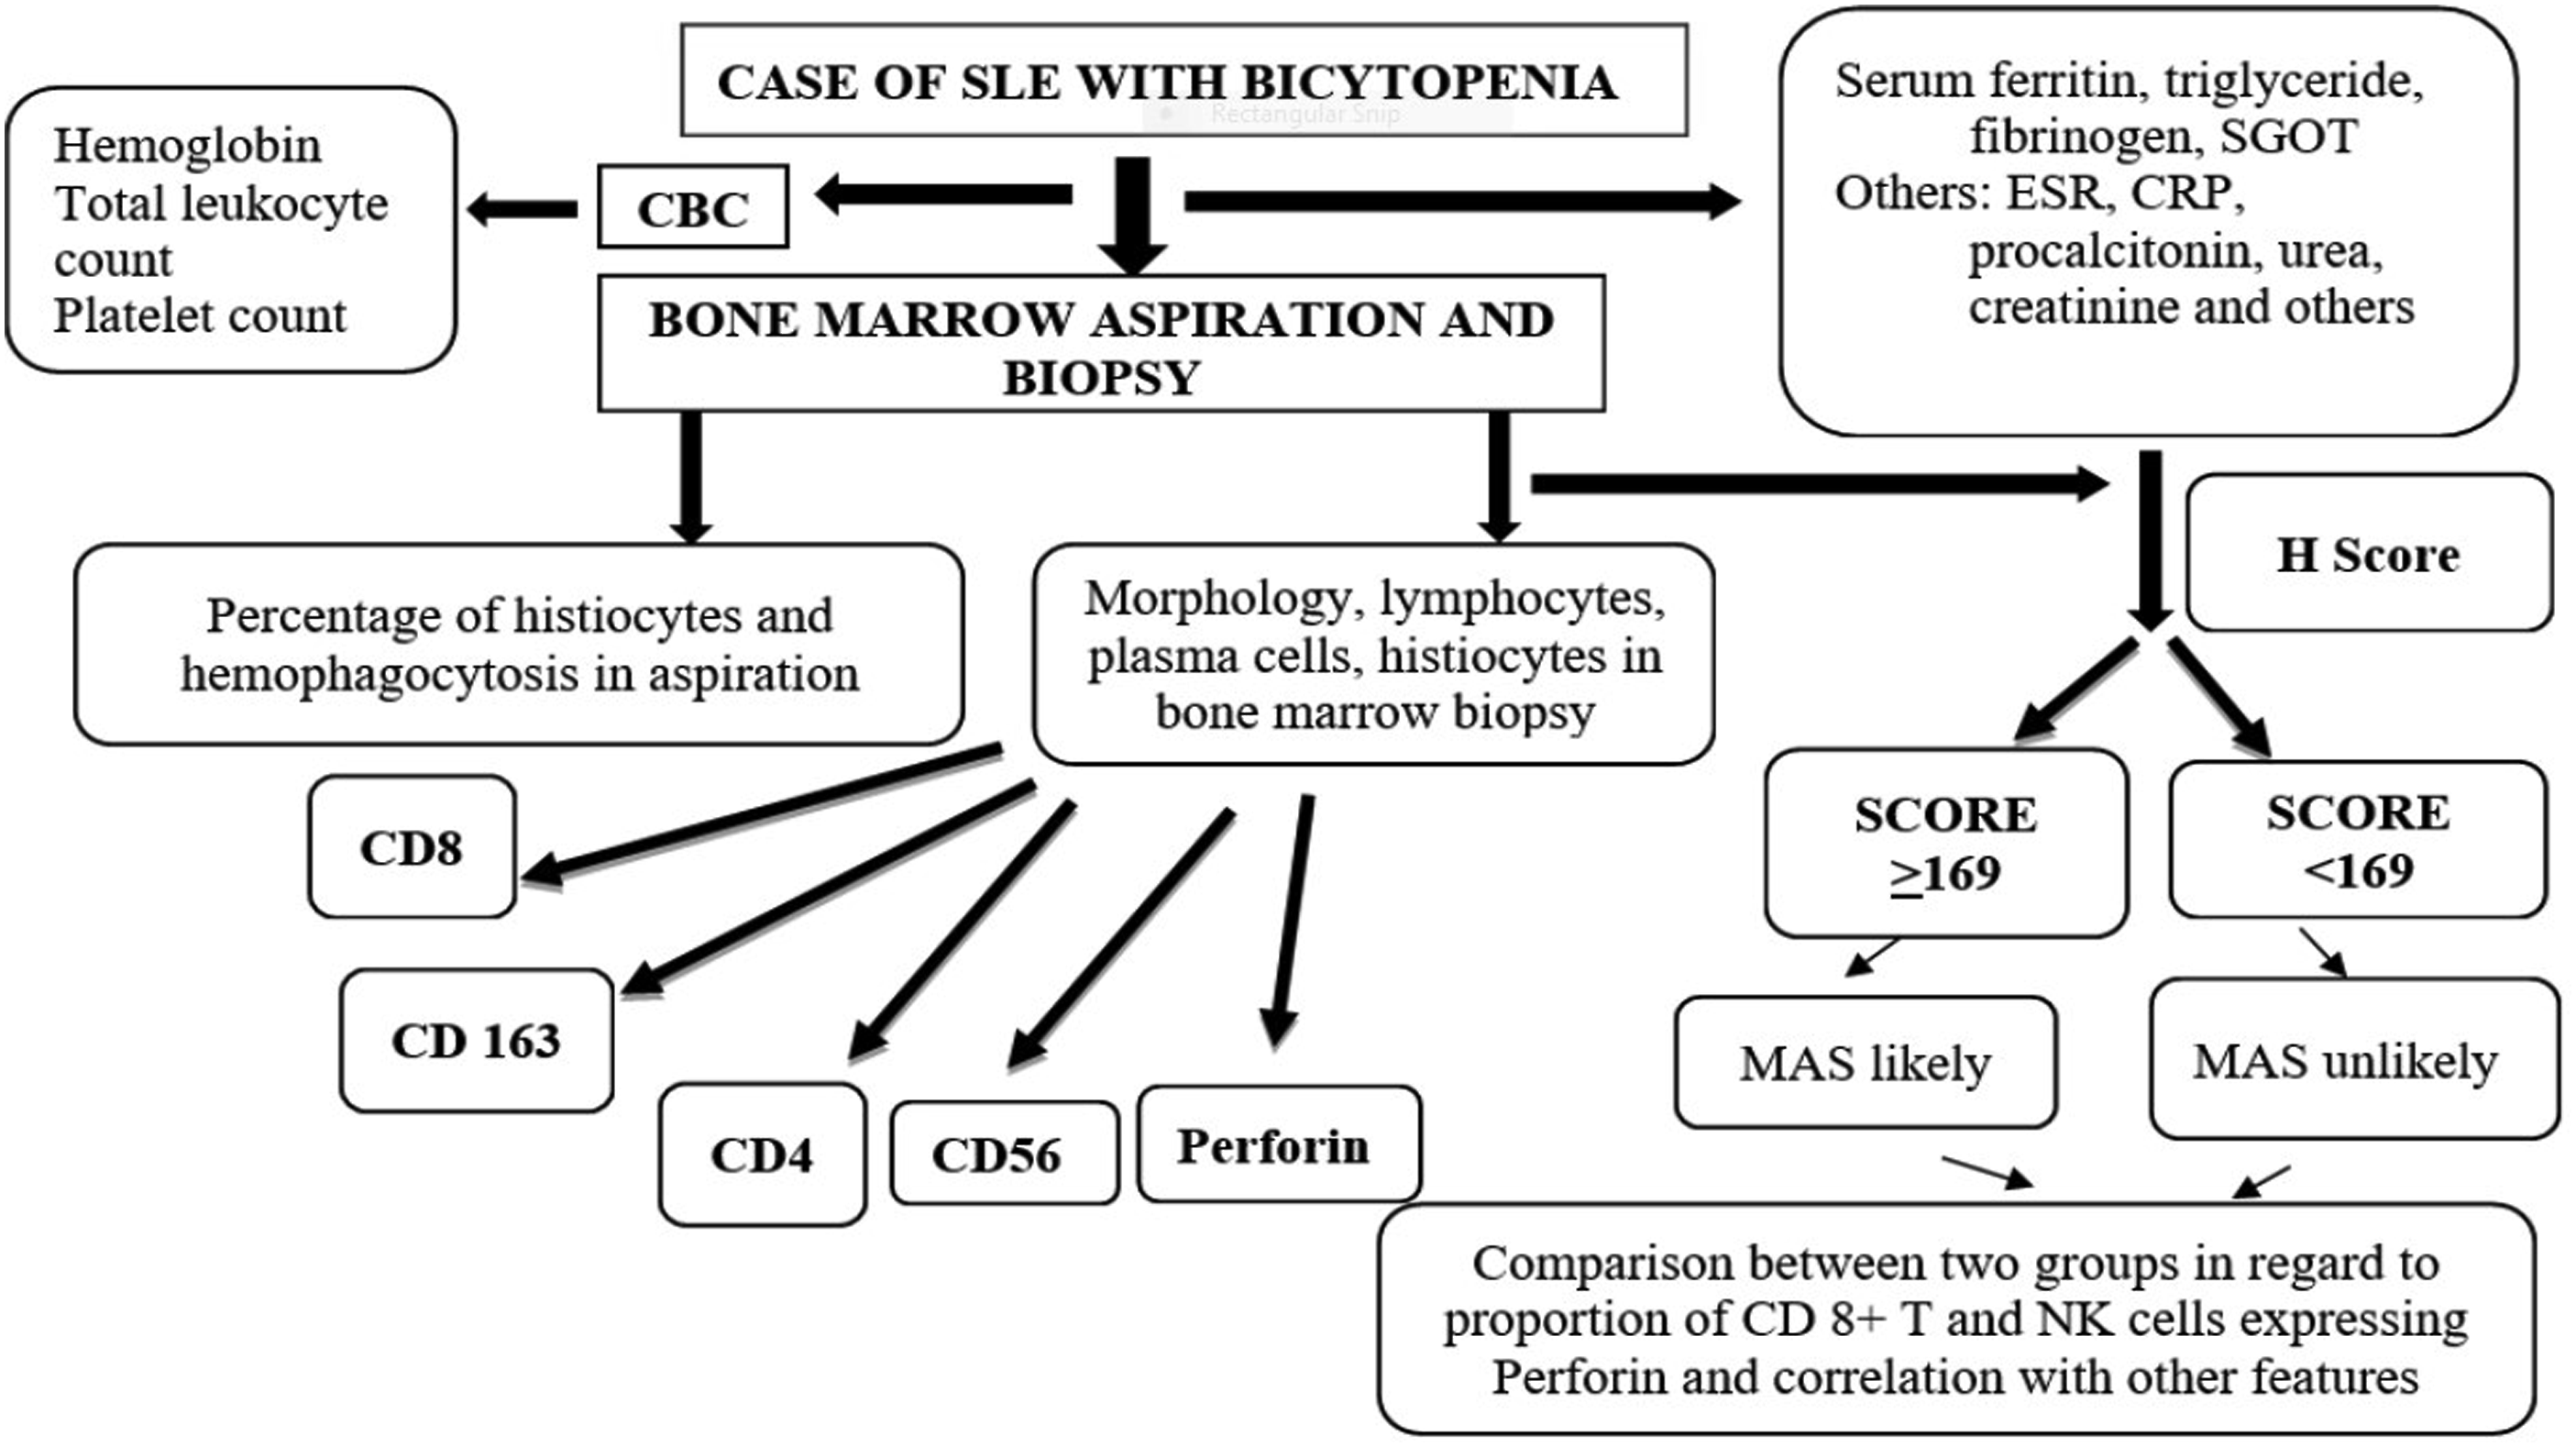
In all cases, 2 mL of blood was collected from medial cubital vein under all aseptic precautions in EDTA vacutainer and subjected to complete blood count (CBC) analysis in an autoanalyzer. Another 3 mL of unanticoagulated venous blood (in red capped vacutainer) was centrifuged at a speed of 1500 r/min for 15 min for serum preparation for biochemical analyses [ferritin, liver transaminases, alkaline phosphatase (ALP), fasting triglyceride (TG), creatinine, C-reactive protein, albumin] in an autoanalyzer. Additionally, 1 mL of heparinized anticoagulated blood (in blue cap vacutainer) was centrifuged at 3000 r/min for 15 min for separation of plasma to be used for estimation of fibrinogen.
Bone marrow aspiration (BMA) smears obtained from posterior superior iliac spine and one fingertip peripheral blood (PB) smear were routinely stained with Leishman Giemsa for morphological assessment of trilineage hematopoiesis, percentage of lymphocytes, plasma cells, histiocytic cells, and evidence of histiocytic hemophagocytosis (HPC) in all cases. Additionally, another “particle smear” was stained with Perl Prussian blue for assessment of marrow iron store on a 0 to 6 scale as per protocol. Similarly, following 6 to 8 h of fixation in 10% neutral buffered formalin, adequate (≥ 15 mm) BMBx trephine core was subjected to 12 to 18 h of decalcification using 14% EDTA before undergoing graded dehydration-clearing-paraffin embedding. Four-micron trephine biopsy sections were routinely stained with Hematoxylin eosin and Gordon-Sweet reticulin stain for assessment of morphology, reticulin fibrosis (0 to 3 scale, WHO), and performing immunohistochemistry (IHC) studies.12,13
Immunohistochemistry (IHC)
Immunohistochemistry was performed using primary antibodies (details given in Supplement Table S1) as per the established protocol. Briefly, the sections on Poly-
Assessment of histiocytic HPC
We followed the objective scoring as proposed by Ho et al to semi quantify the histiocytic HPC (defined as engulfment of intact lymphocyte, normoblast, neutrophil, or platelet) on BMA smears which is as follows: none (score 0), 1–4 cells/slide (score 1), 5–9 cells/slide (score 2), ≥10 cells/slide (score 3). 14 Similarly, we semi quantified the histiocytic HPC on CD163 immunostained trephine sections as follows: no HPC (score 0), 1–4 HPC/high power field (HPF) (score 1), 5–9 HPC/HPF (score 2), and ≥10 HPC/HPF (score 3).
MAS probability score
MAS probability score was calculated in each case using 2014 criteria as put forth by Fardet et al taking into consideration following eight parameters: a) imunosuppression status, b) grade of pyrexia, c) hepatosplenomegaly, d) number of cytopenia (s), e) serum glutamic oxaloacetic transferase (SGOT), f) serum ferritin, g) fasting TG/plasma fibrinogen, and h) demonstration of HPC on BMA and/or BMBx. With a cut off probability score of 169, the study participants were subdivided into two subgroups such as MAS likely (MAS-L) (≥ 169) and unlikely (MAS-U) (< 169). 11
Perforin immunoexpression
The trephine biopsy sections were screened under ×200 magnification (Nikon, Eclipse Ci-L microscope, Japan) by three independent observers (X, Y, Z) for the presence of PFN positive lymphomononuclear (LMN) cells (hot spot) by direct visual examination as per the similar methodology described elsewhere. 15 The average proportion (P, %) of PFN positive LMN cells were calculated from ten randomly selected x400 microscopic fields. The intensity (I) of PFN expression was graded semiquanitatively as follows: negative (score 0), weak - intermediate, fine granular positivity (score 1 to 2), and coarse, granular positivity (score 3); and photographed under oil immersion objective (x1000). Individual observer assigned PFN histoscore for each case by multiplying average P with average I (P x I). The final PFN histoscore for individual case was calculated by taking the average score of three independent observers (sigma X + Y + Z/3).
Statistical analysis
The data collected were entered into Microsoft excel worksheet and analyzed using Statistical Package for Social Sciences, version 15.0 (SPSS Inc., Chicago, IL, USA). Normally distributed continuous variables were expressed as mean ± standard deviation (SD); skewed distribution was expressed as median and interquartile range (IQR). Categorical variables were expressed as proportions. Student t test was employed to compare continuous variables. Chi-square or Fischer Exact statistics assessed difference amongst categorical variables. Pearson or Spearman correlation coefficient was calculated to correlate PFN score with various clinico-laboratory parameters. The ability of each parameter to discriminate MAS-L from MAS-U was tested by means of sensitivity, specificity, and area under the receiver operating characteristic curve (ROC) curve. A p value less than 0.05 was considered significant for all statistical inferences.
Results
Baseline clinicolaboratory characteristics of adult SLE cases (n = 30).
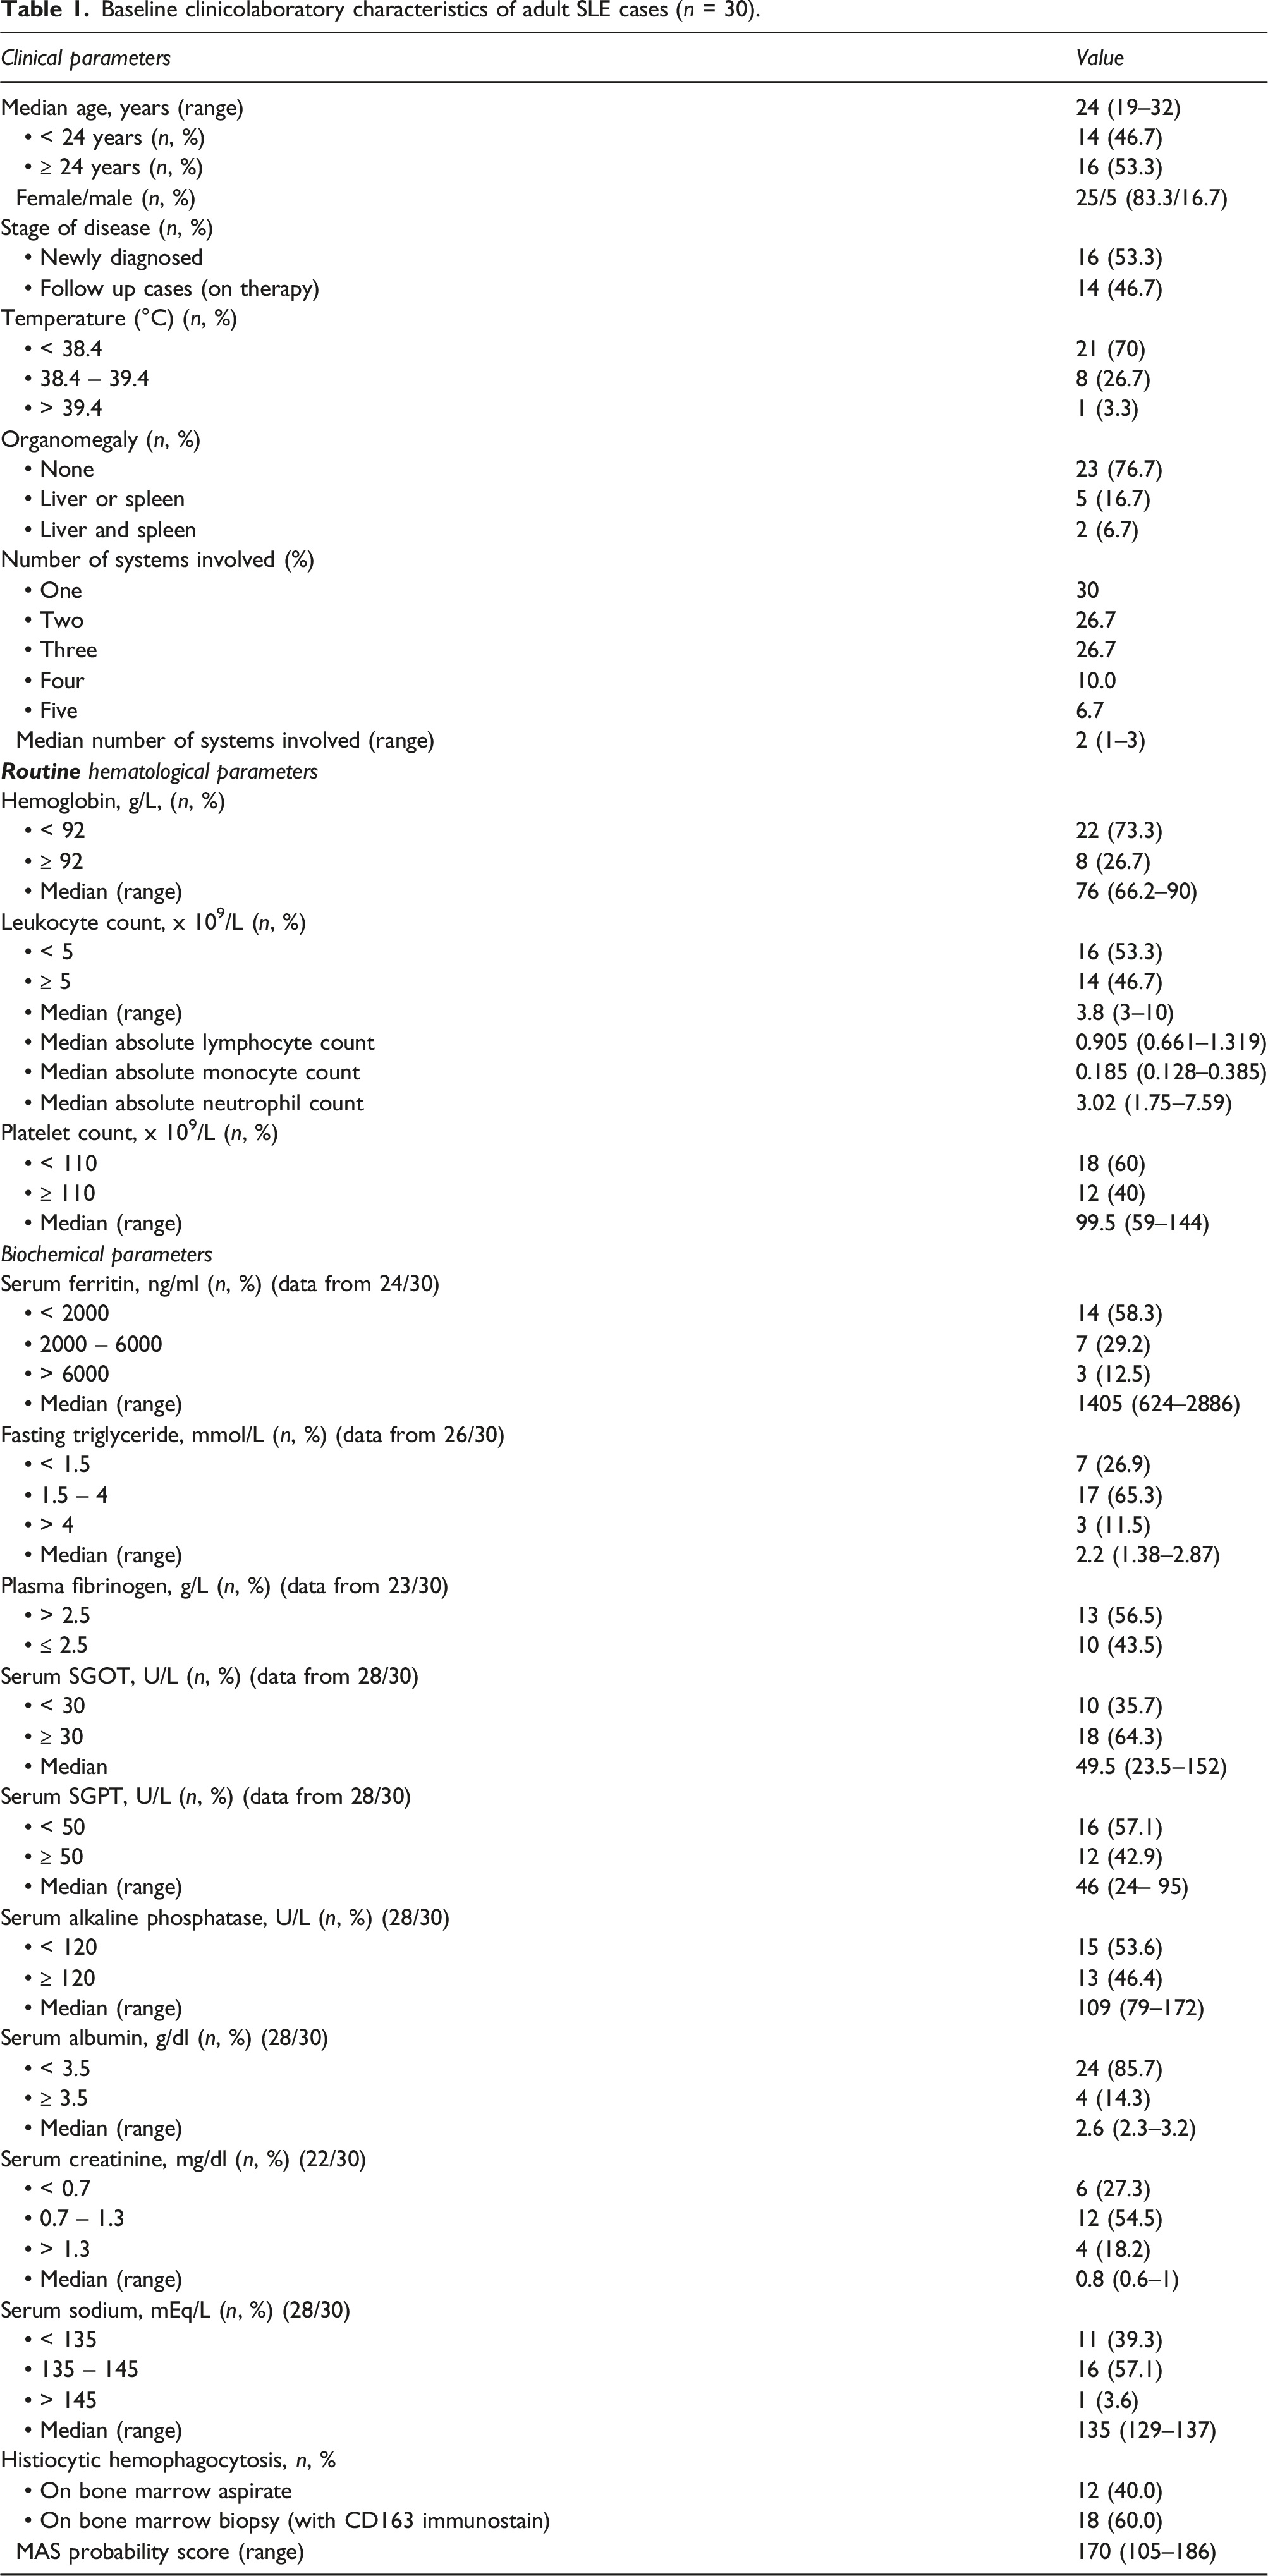
A higher proportion of cases (25/30, 83%) had bicytopenia and five (17%) had pancytopenia. As per 2014 HLH probability criteria, a higher proportion (73%) were anemic (< 92 g/L), nearly half had leukopenia (< 5 x 10⁹/L), and 60% had thrombocytopenia (< 110 x 109/L). Similarly, hyperferritinemia (≥ 2000 ng/mL), fasting hypertriglyceridemia (≥ 1.5 micromol/L), raised SGOT (≥ 30 IU/L), and lower fibrinogen (≤ 2.5 g/L) were noted in 10 (41.7%), 20 (76.8%), 18 (64.3%), and 10 (43.5%) cases, respectively.
Bone marrow morphology and histiocytic HPC
SLE associated trilineage dyspoieses were evident in 17/30 (66.6%) cases characterized by presence of small megakaryocytes with round hypolobated nuclei (micromegakaryocyte like), bare megakaryocyte nuclei, loose clustering, and at places, para trabecular localization; megaloblast like erythroid dyspoiesis; and dysgranulopoiesis in maturing myeloid lineages. On aspirate smears, marrow lymphocytosis was observed in 13/30 (43.3%) (median: 10%, range: 5%–12%), histiocytic HPC was noted in 11/29 (37.9%), whereas using CD163 immunostain on BMBx, histiocytic HPC was evident in 18/30 (60%) cases (Figure 2). Immunohistochemical demonstration of histiocytic hemophagocytosis in a case of SLE-MAS with pancytopenia and hypocellular marrow using CD163 antibody. Note the increased population of histiocytes (a, x200) with evidence of obvious hemophagocytosis (b, black arrow, x400) (Peroxidase-antiperoxidase).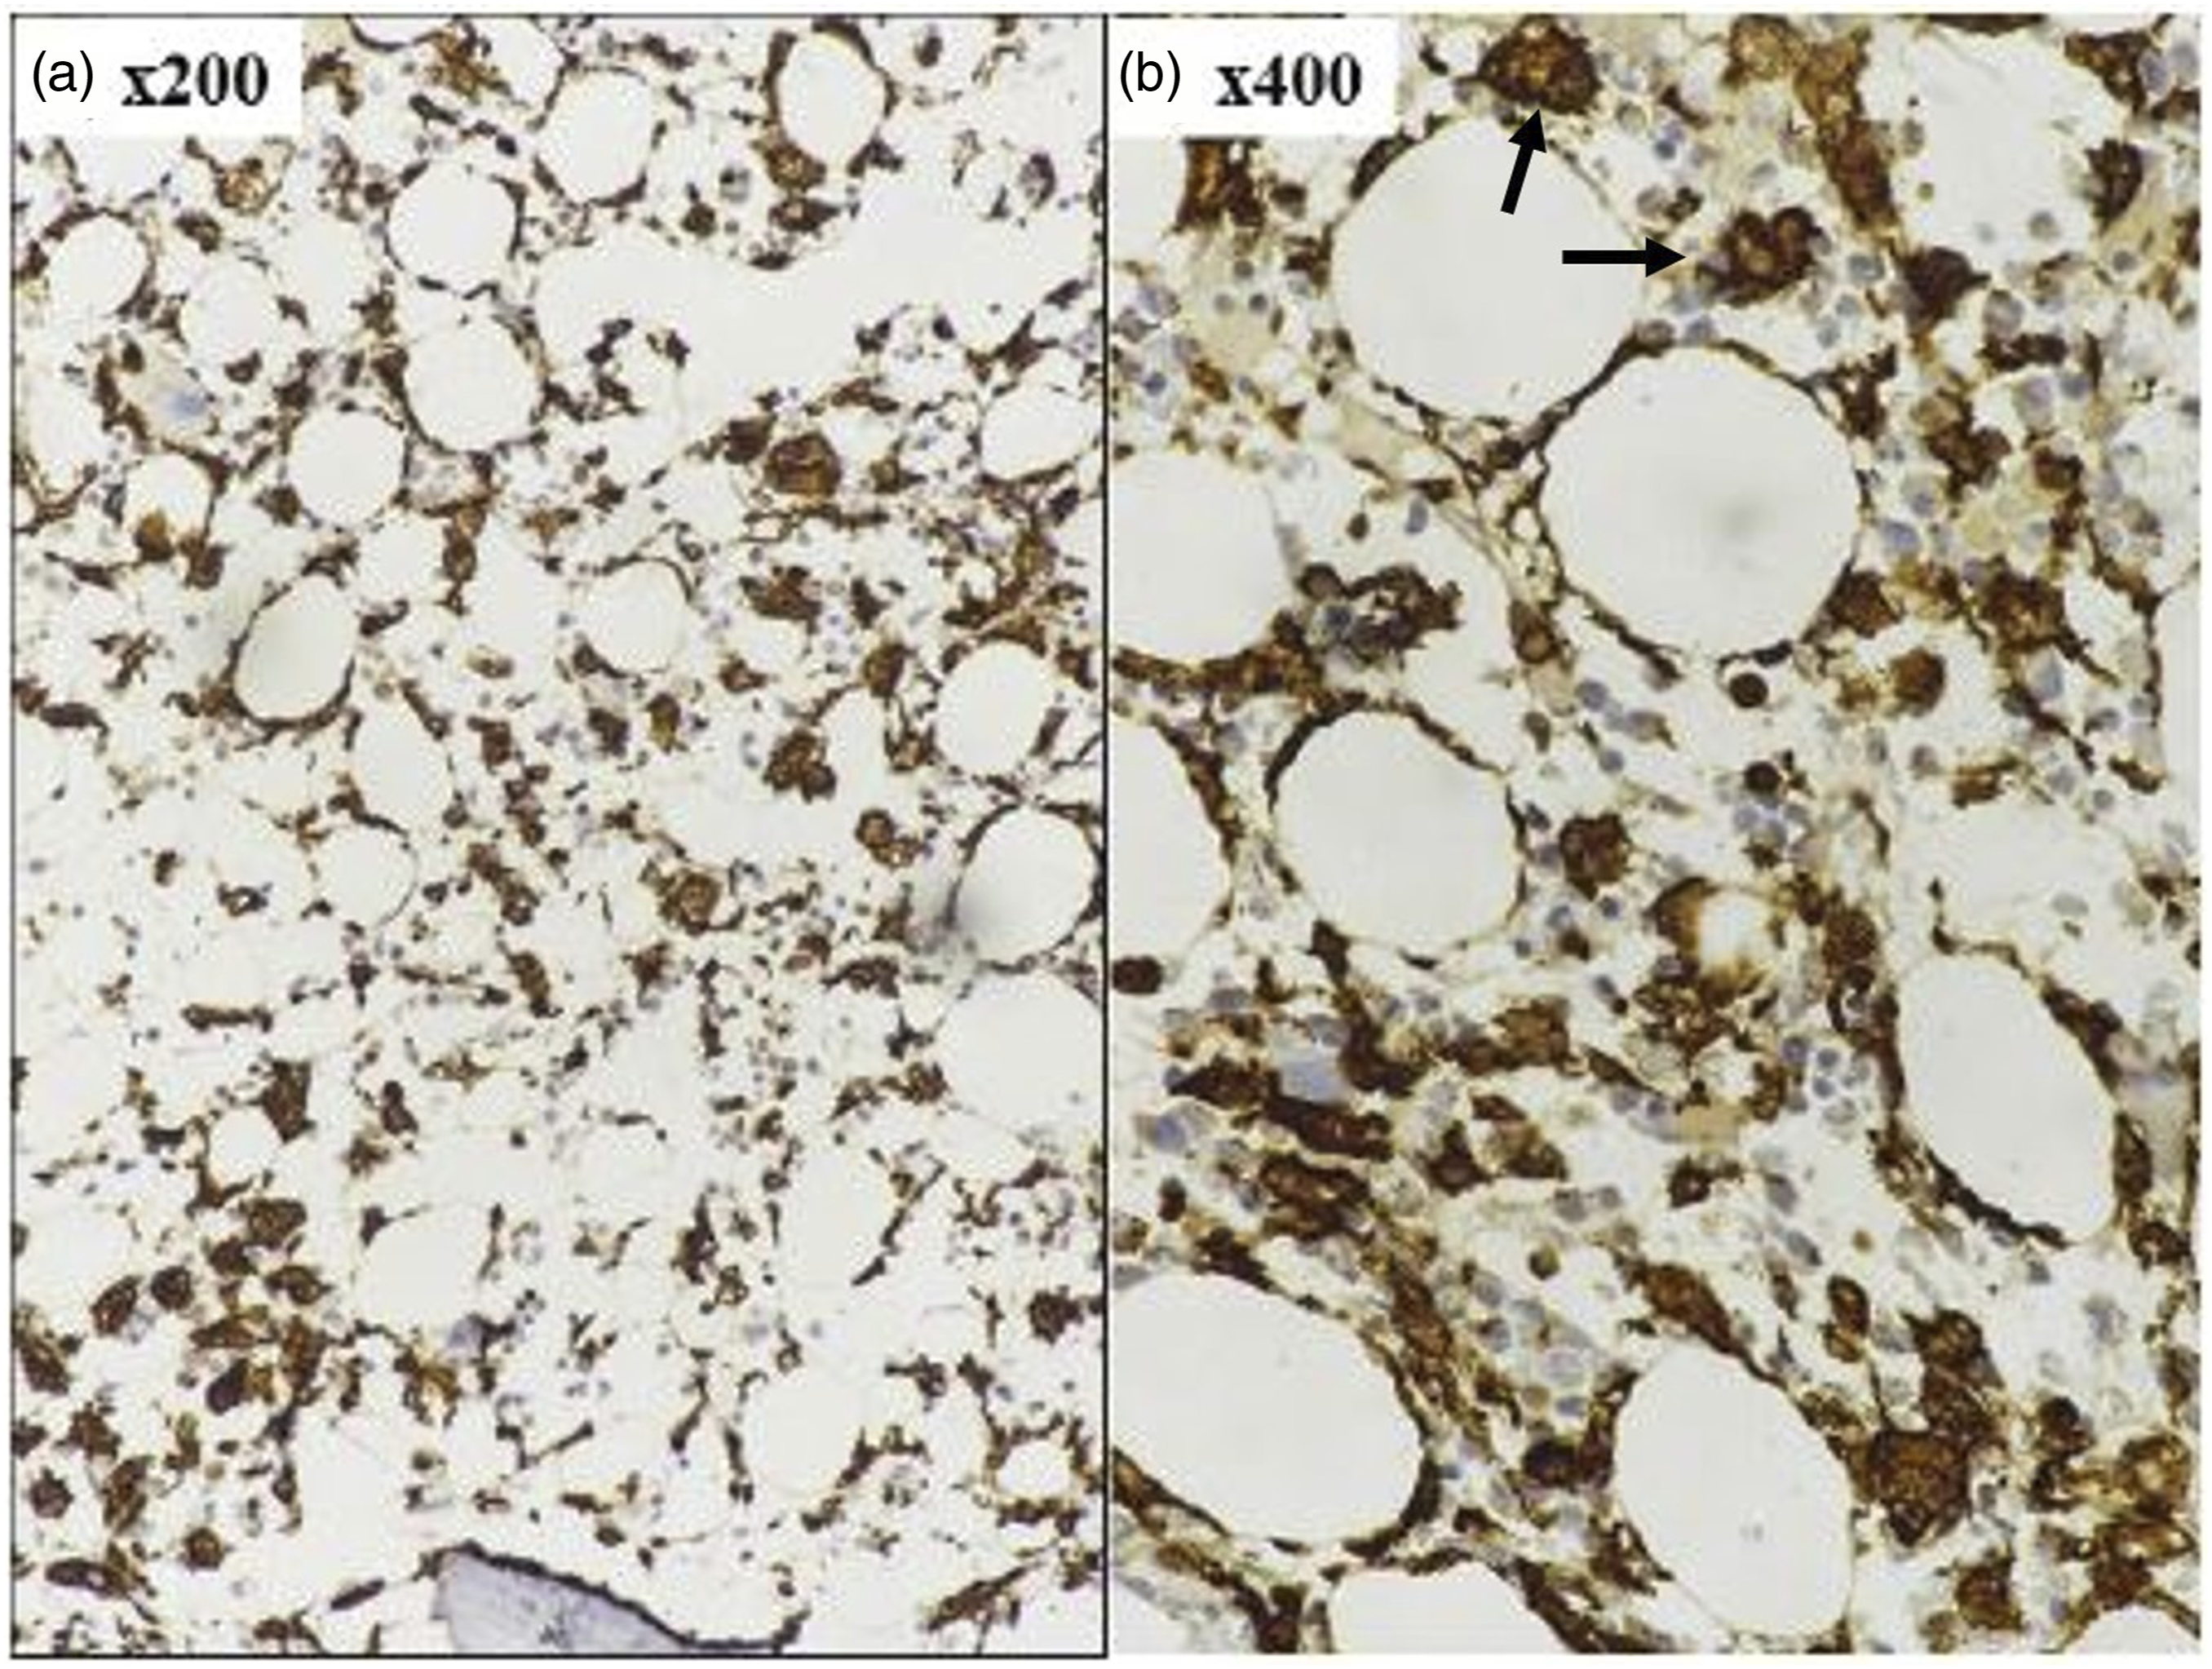
Comparison between MAS-likely (MAS-L) and MAS-unlikely (MAS-U) subgroup.
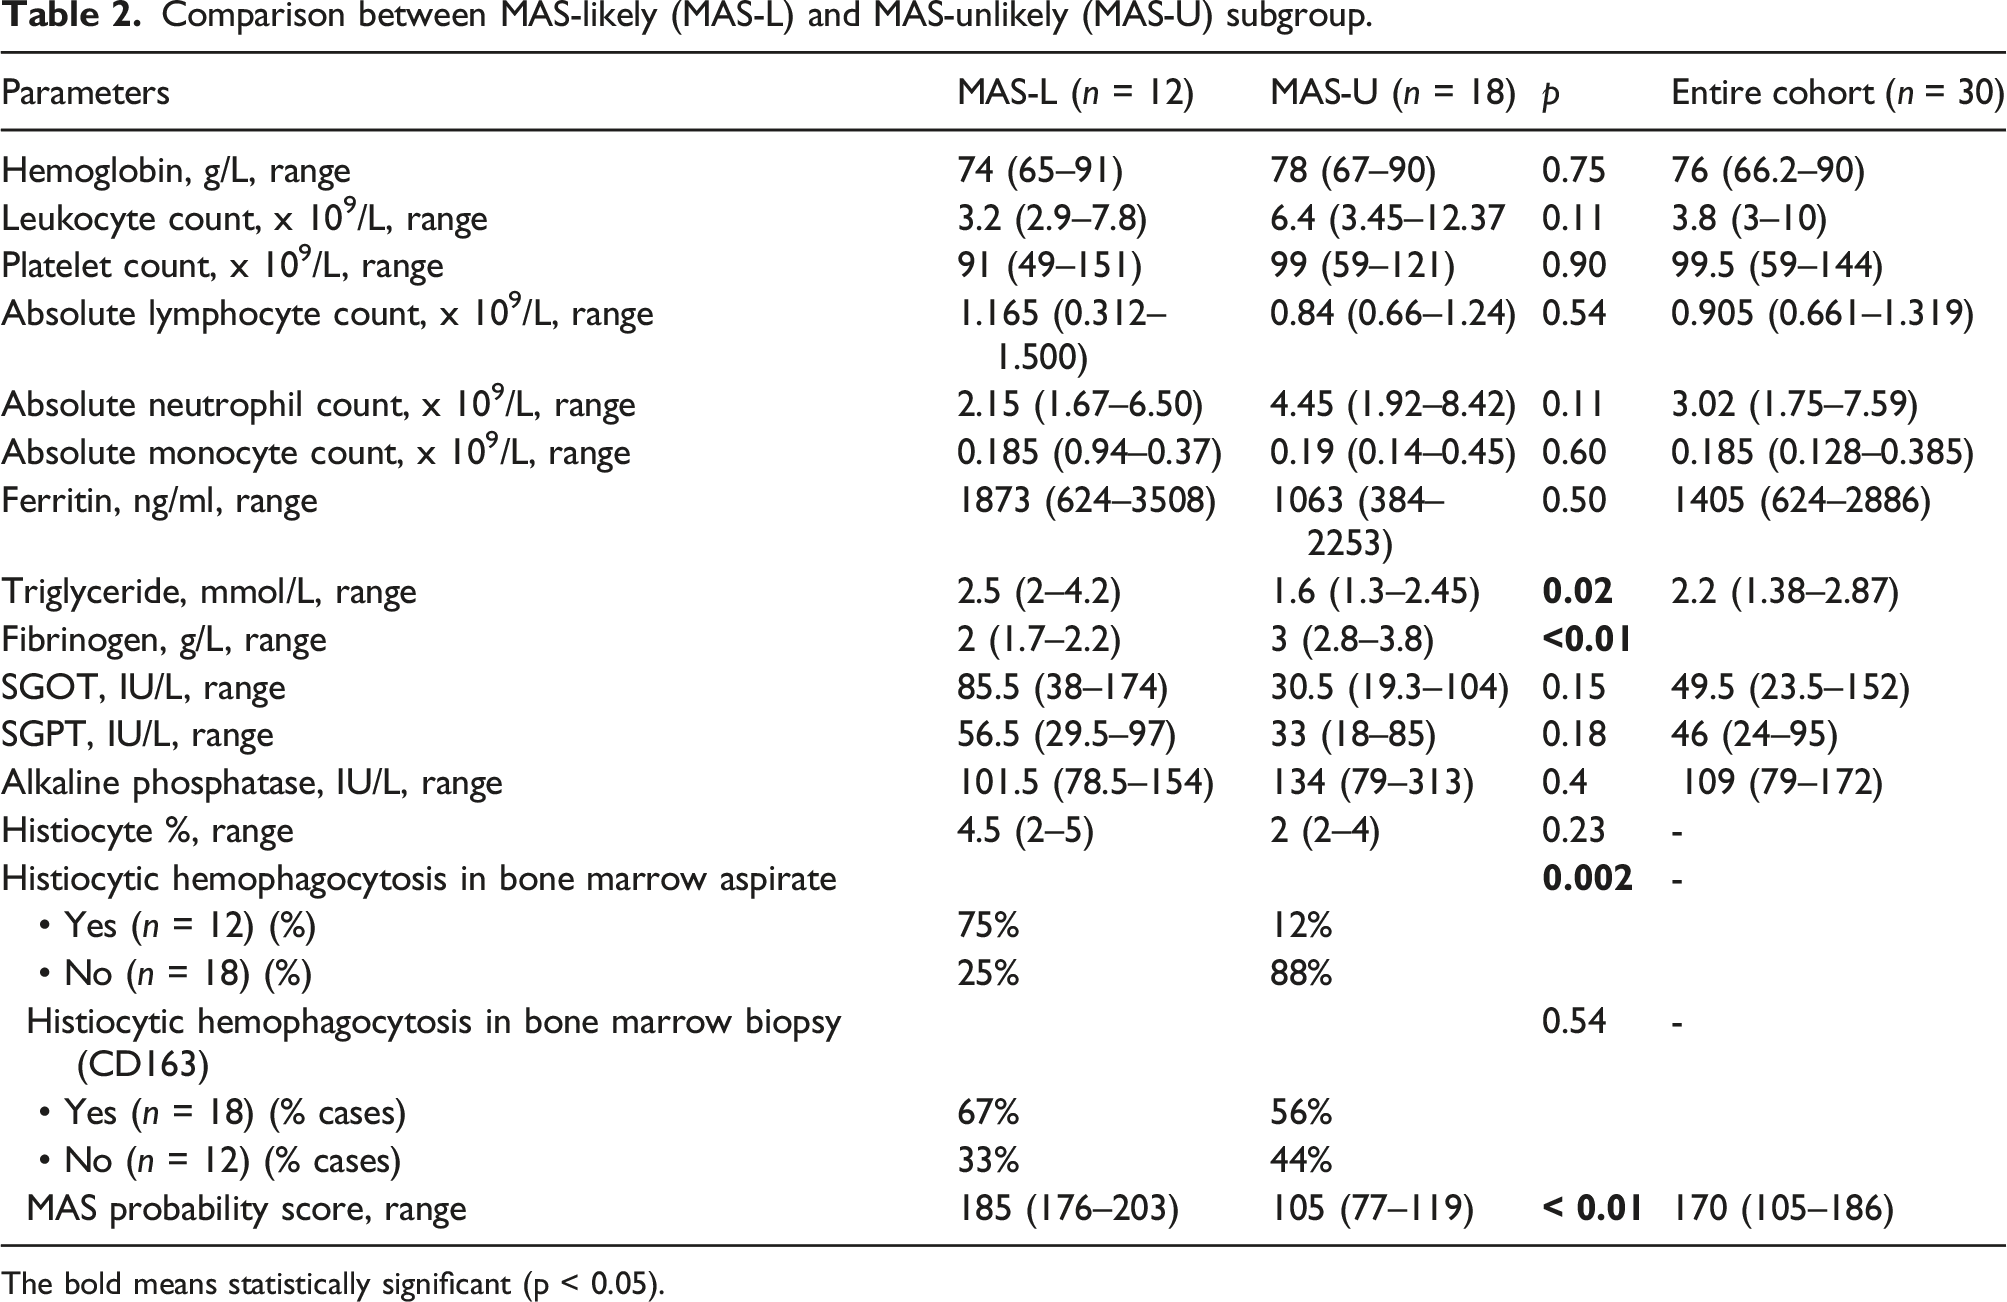
The bold means statistically significant (p < 0.05).
On BMA, a higher proportion MAS-L group had lymphocytosis (58% vs. 33%, p = .18), increased number of macrophages [4.5% (2%–5%) vs. 2% (2%–4%), p = .23], and evidence of histiocytic HPC (75% vs. 12%, respectively, p = .002) than MAS-U group. On IHC, CD163 positive histiocytes were increased in MAS-L group than latter [median; 13.5% (10%–27.5%) vs. 10% (5%–15%), respectively, p = .09] with a HPC score of 2 in the former compared to 1 in latter group (p = .04). The number of CD3, CD8, CD4 positive T lymphocytes, and proportion of CD8 and CD4 positive lymphocytes, and CD56 positive cells (NK cells) were similar between two sub groups (p > .05) (Figure 3) (Supplement Table S2). Box plot depicting the immunohistochemical features between SLE cases and controls. Note the significantly reduced PFN score among cases than controls, increased CD163+ cells as well as histiocytic hemophagocytosis score among MAS-L than MAS-U subgroup (p < .05) (lower three panels).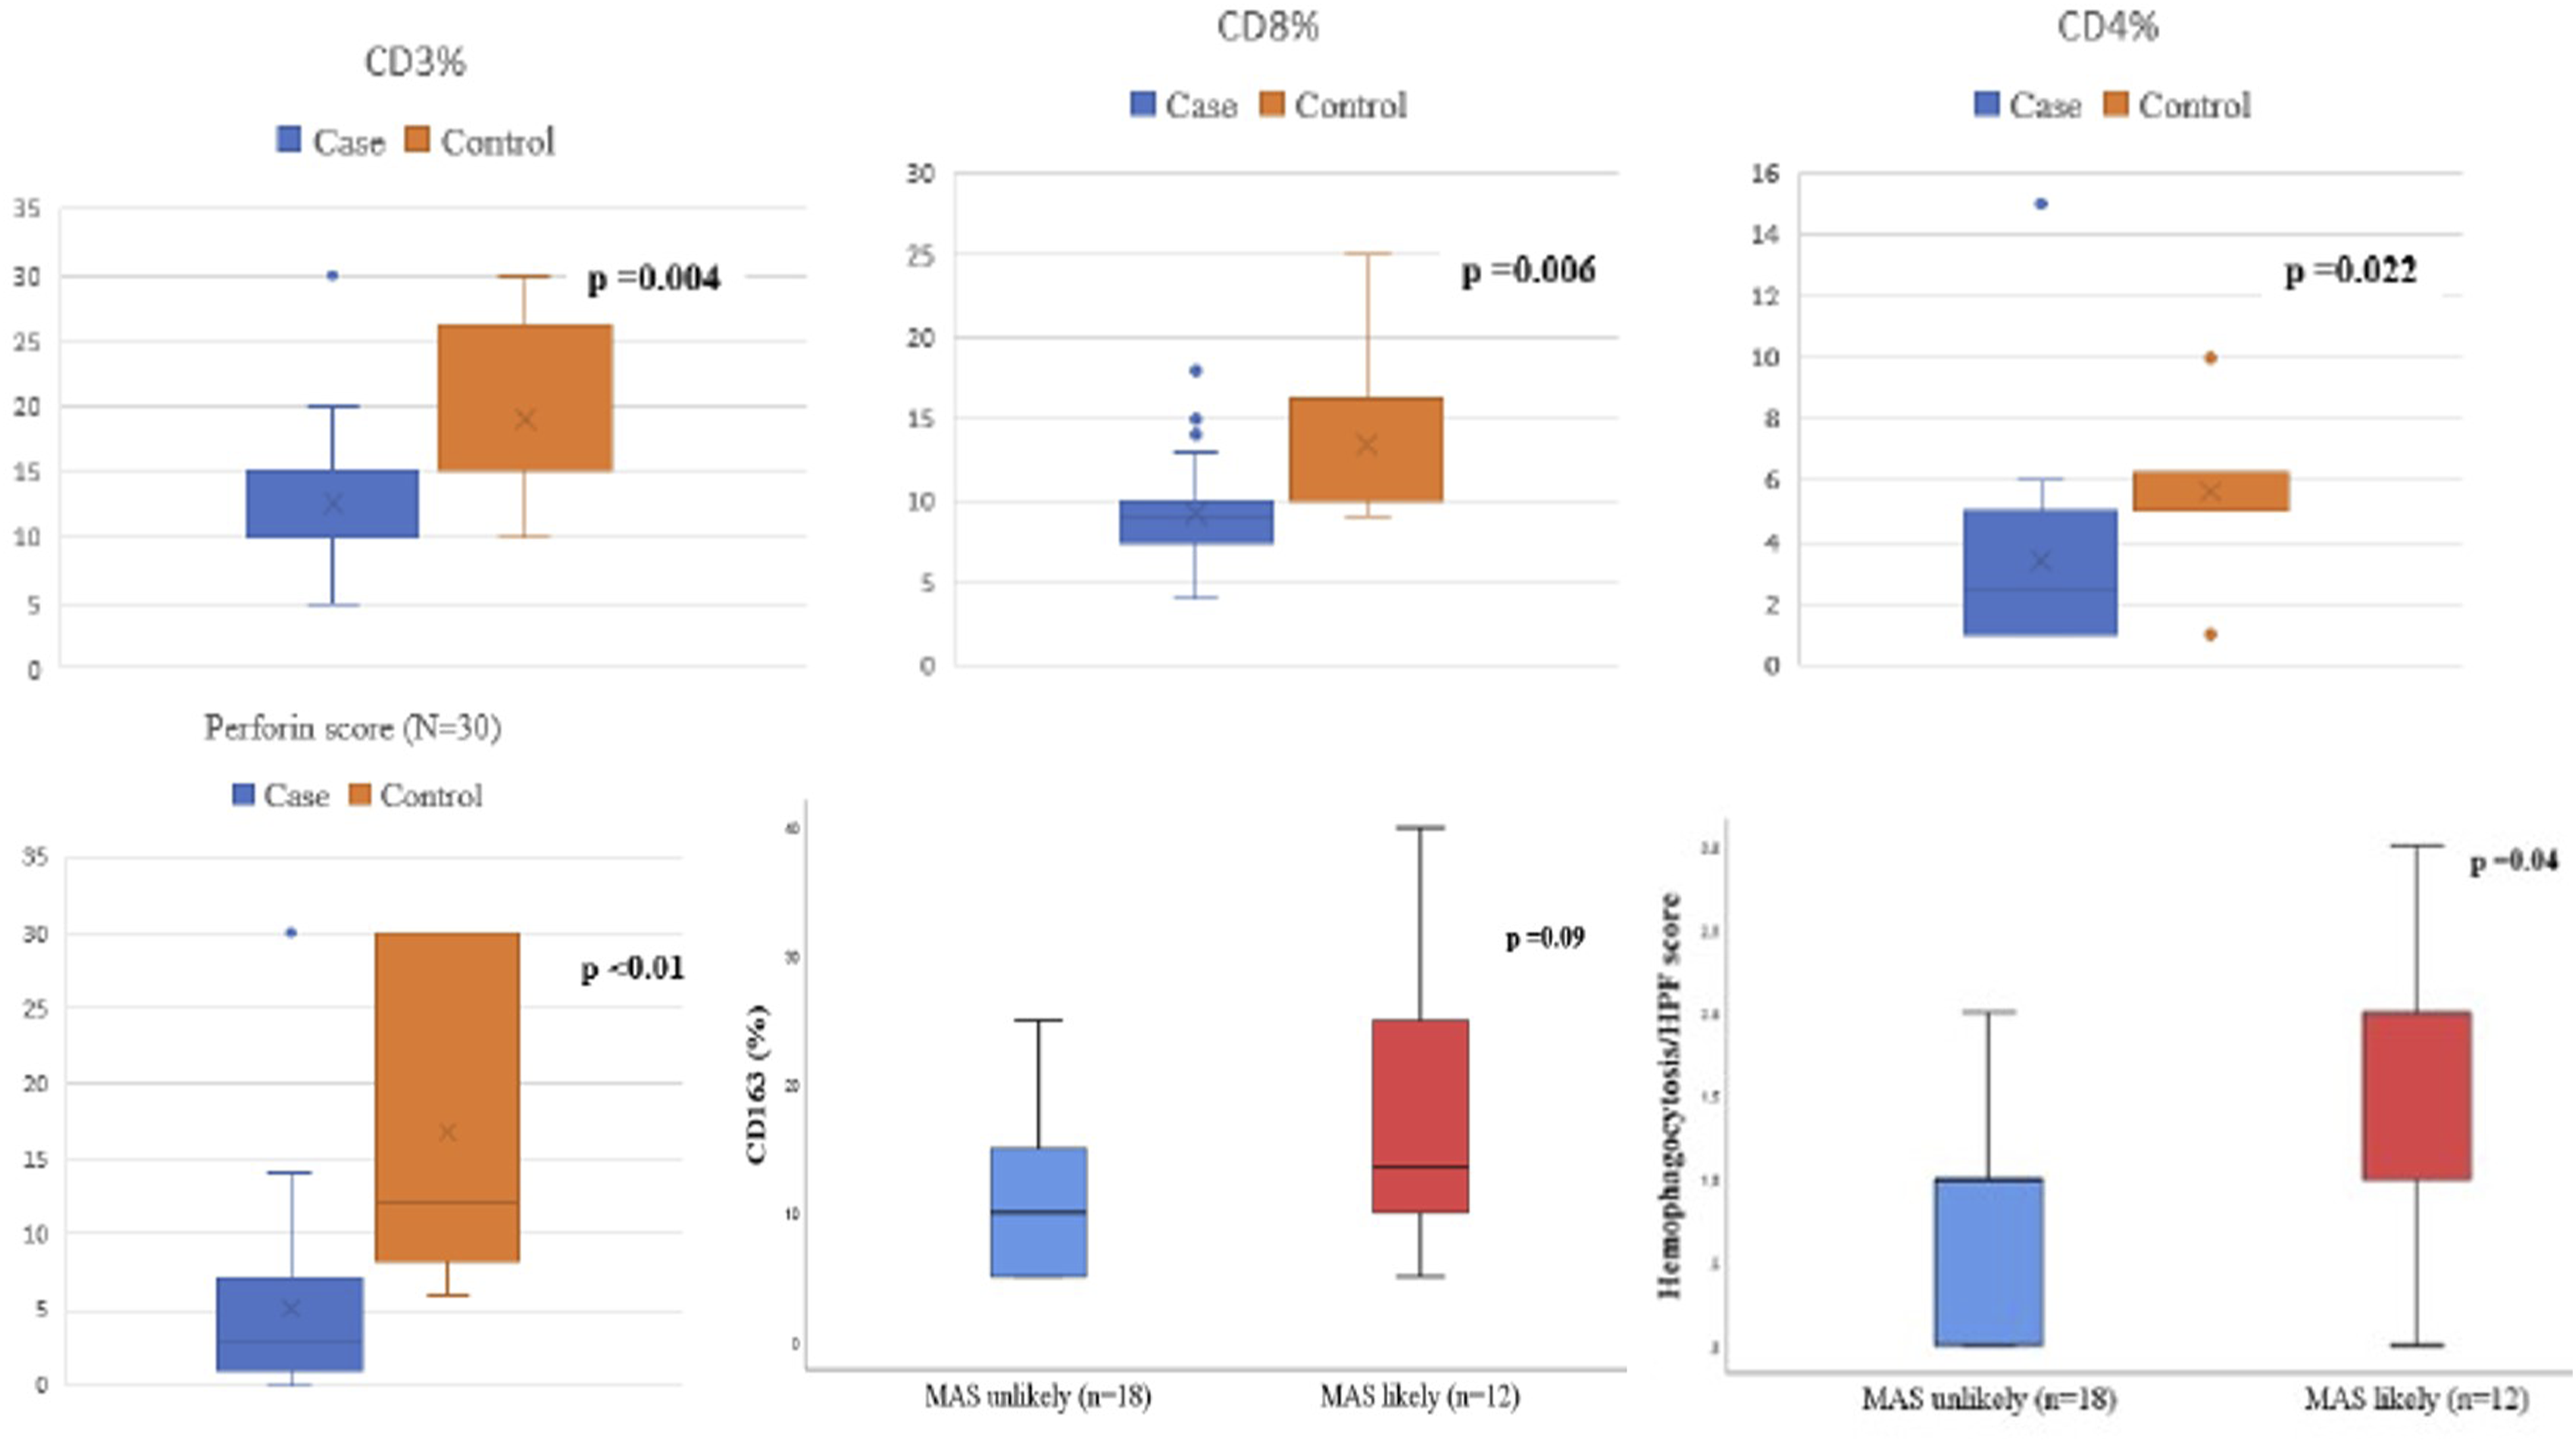
Perforin expression
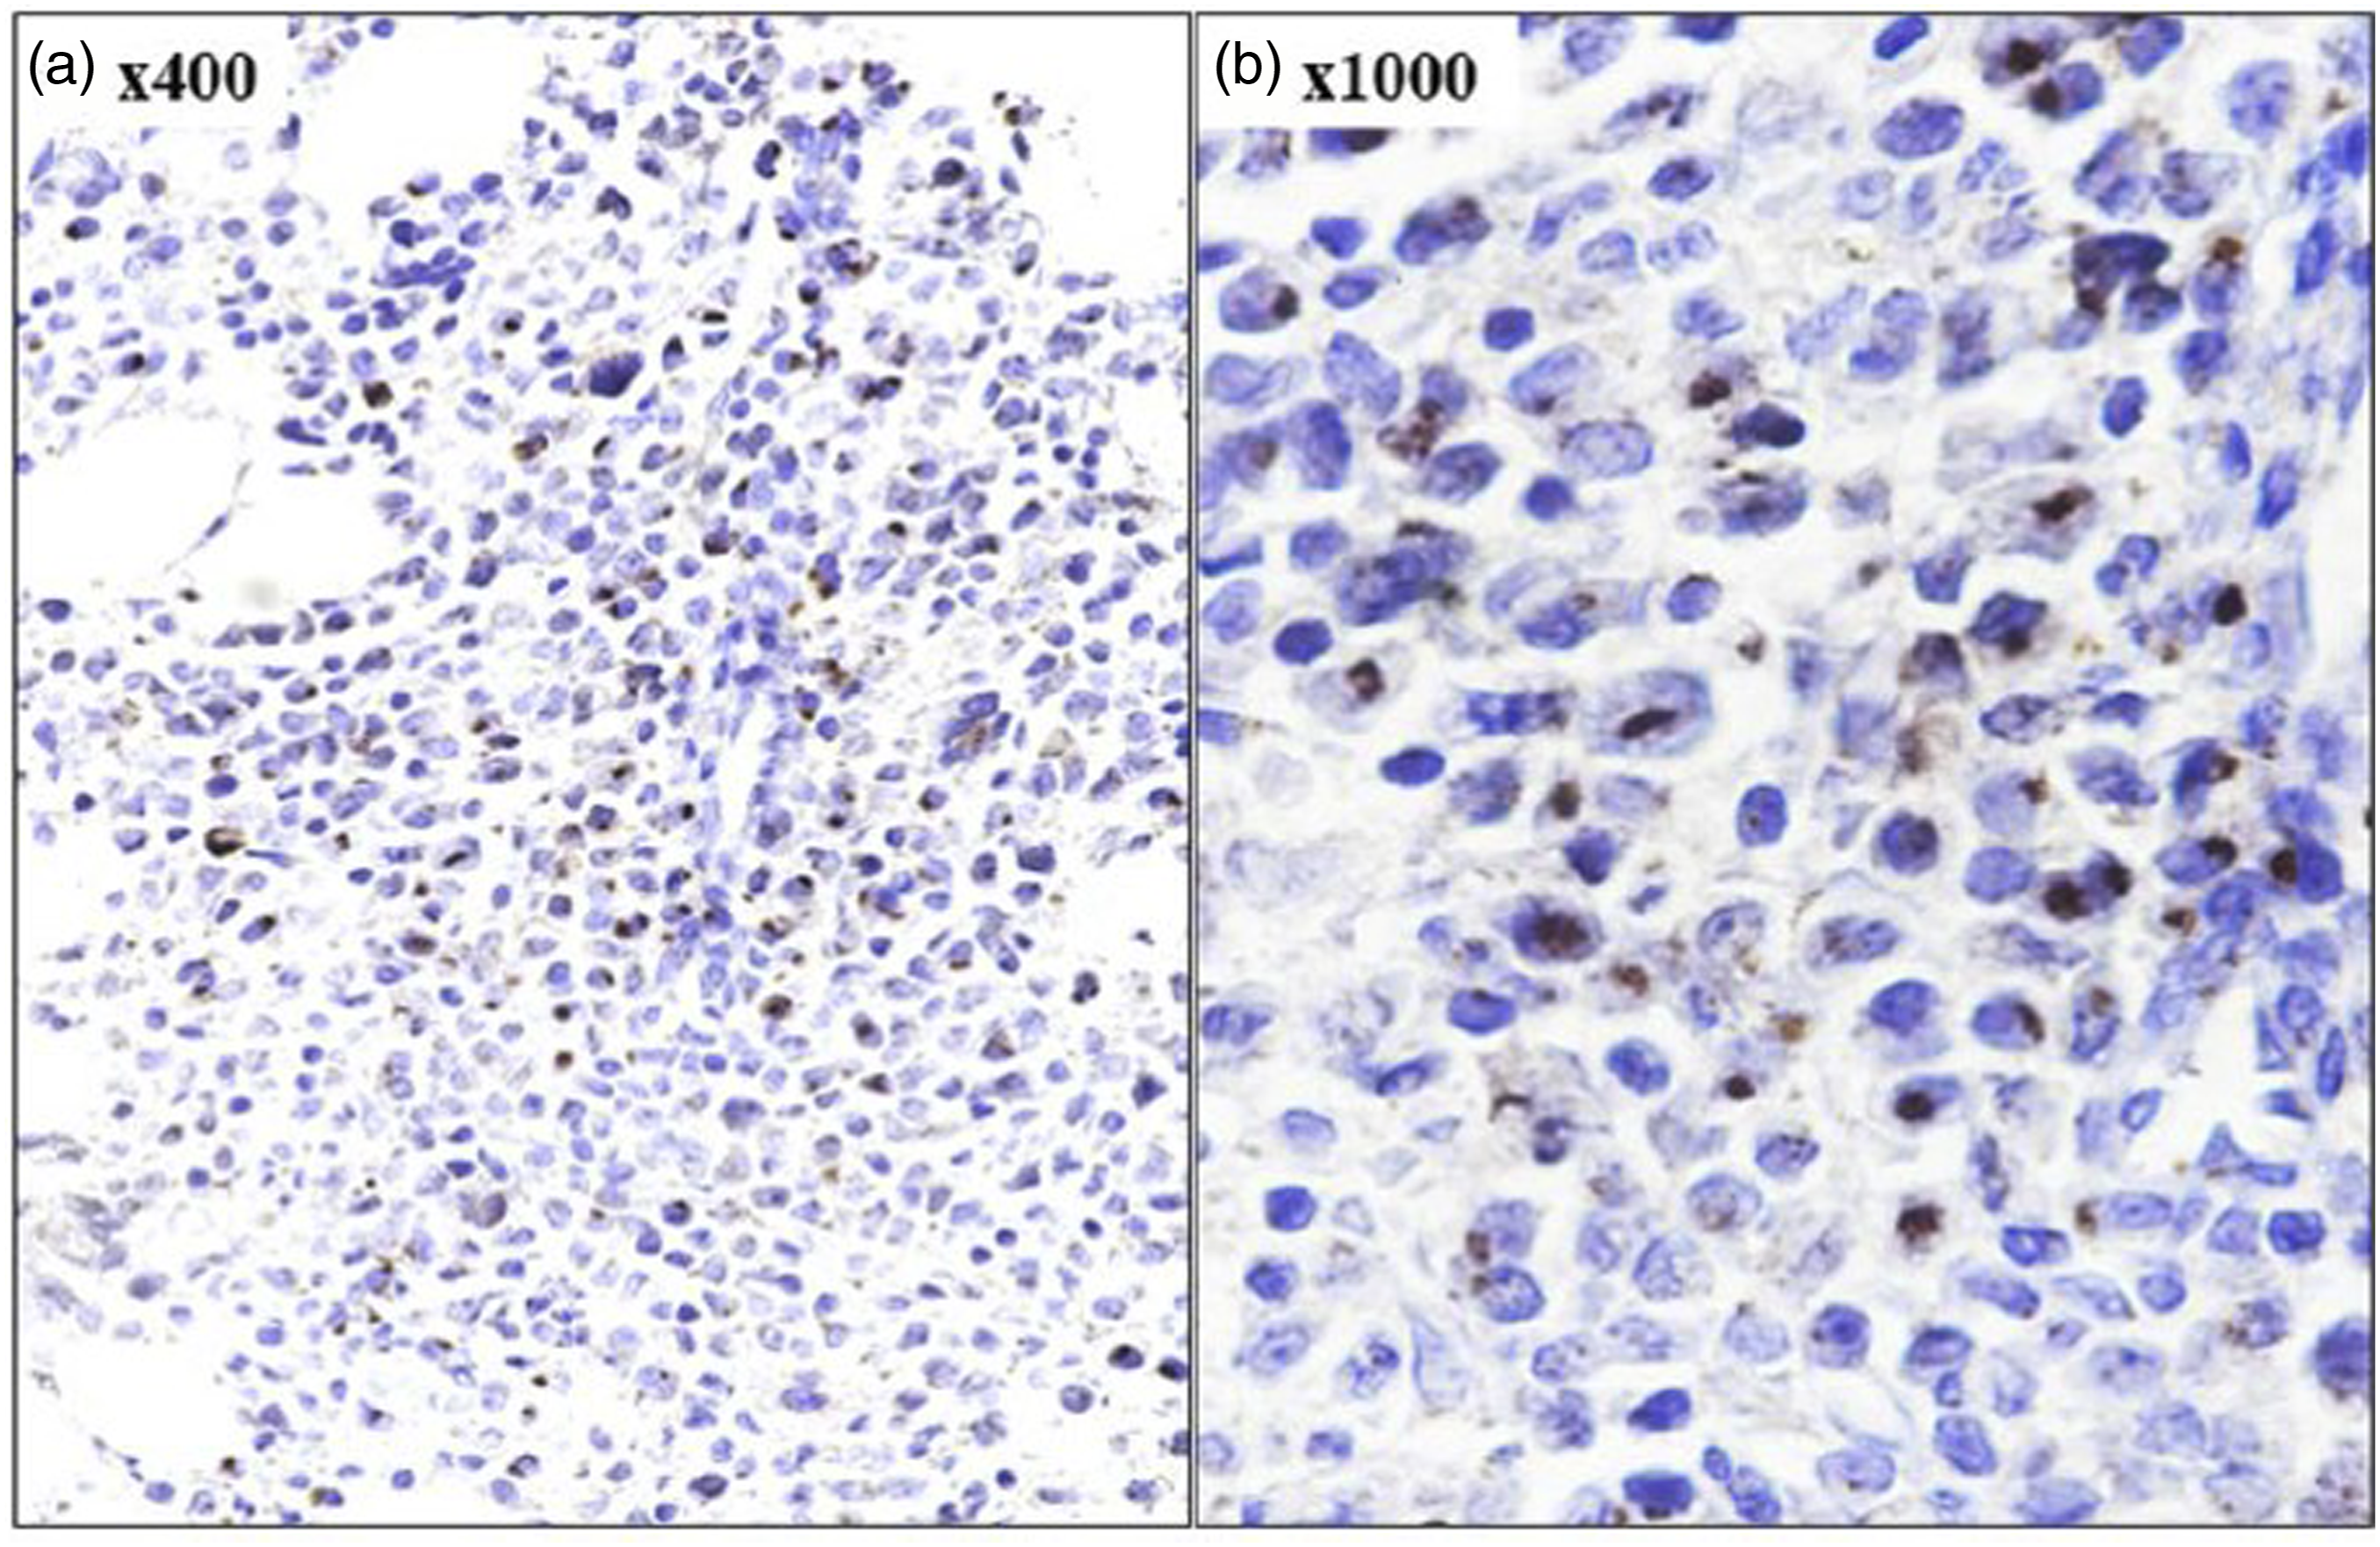
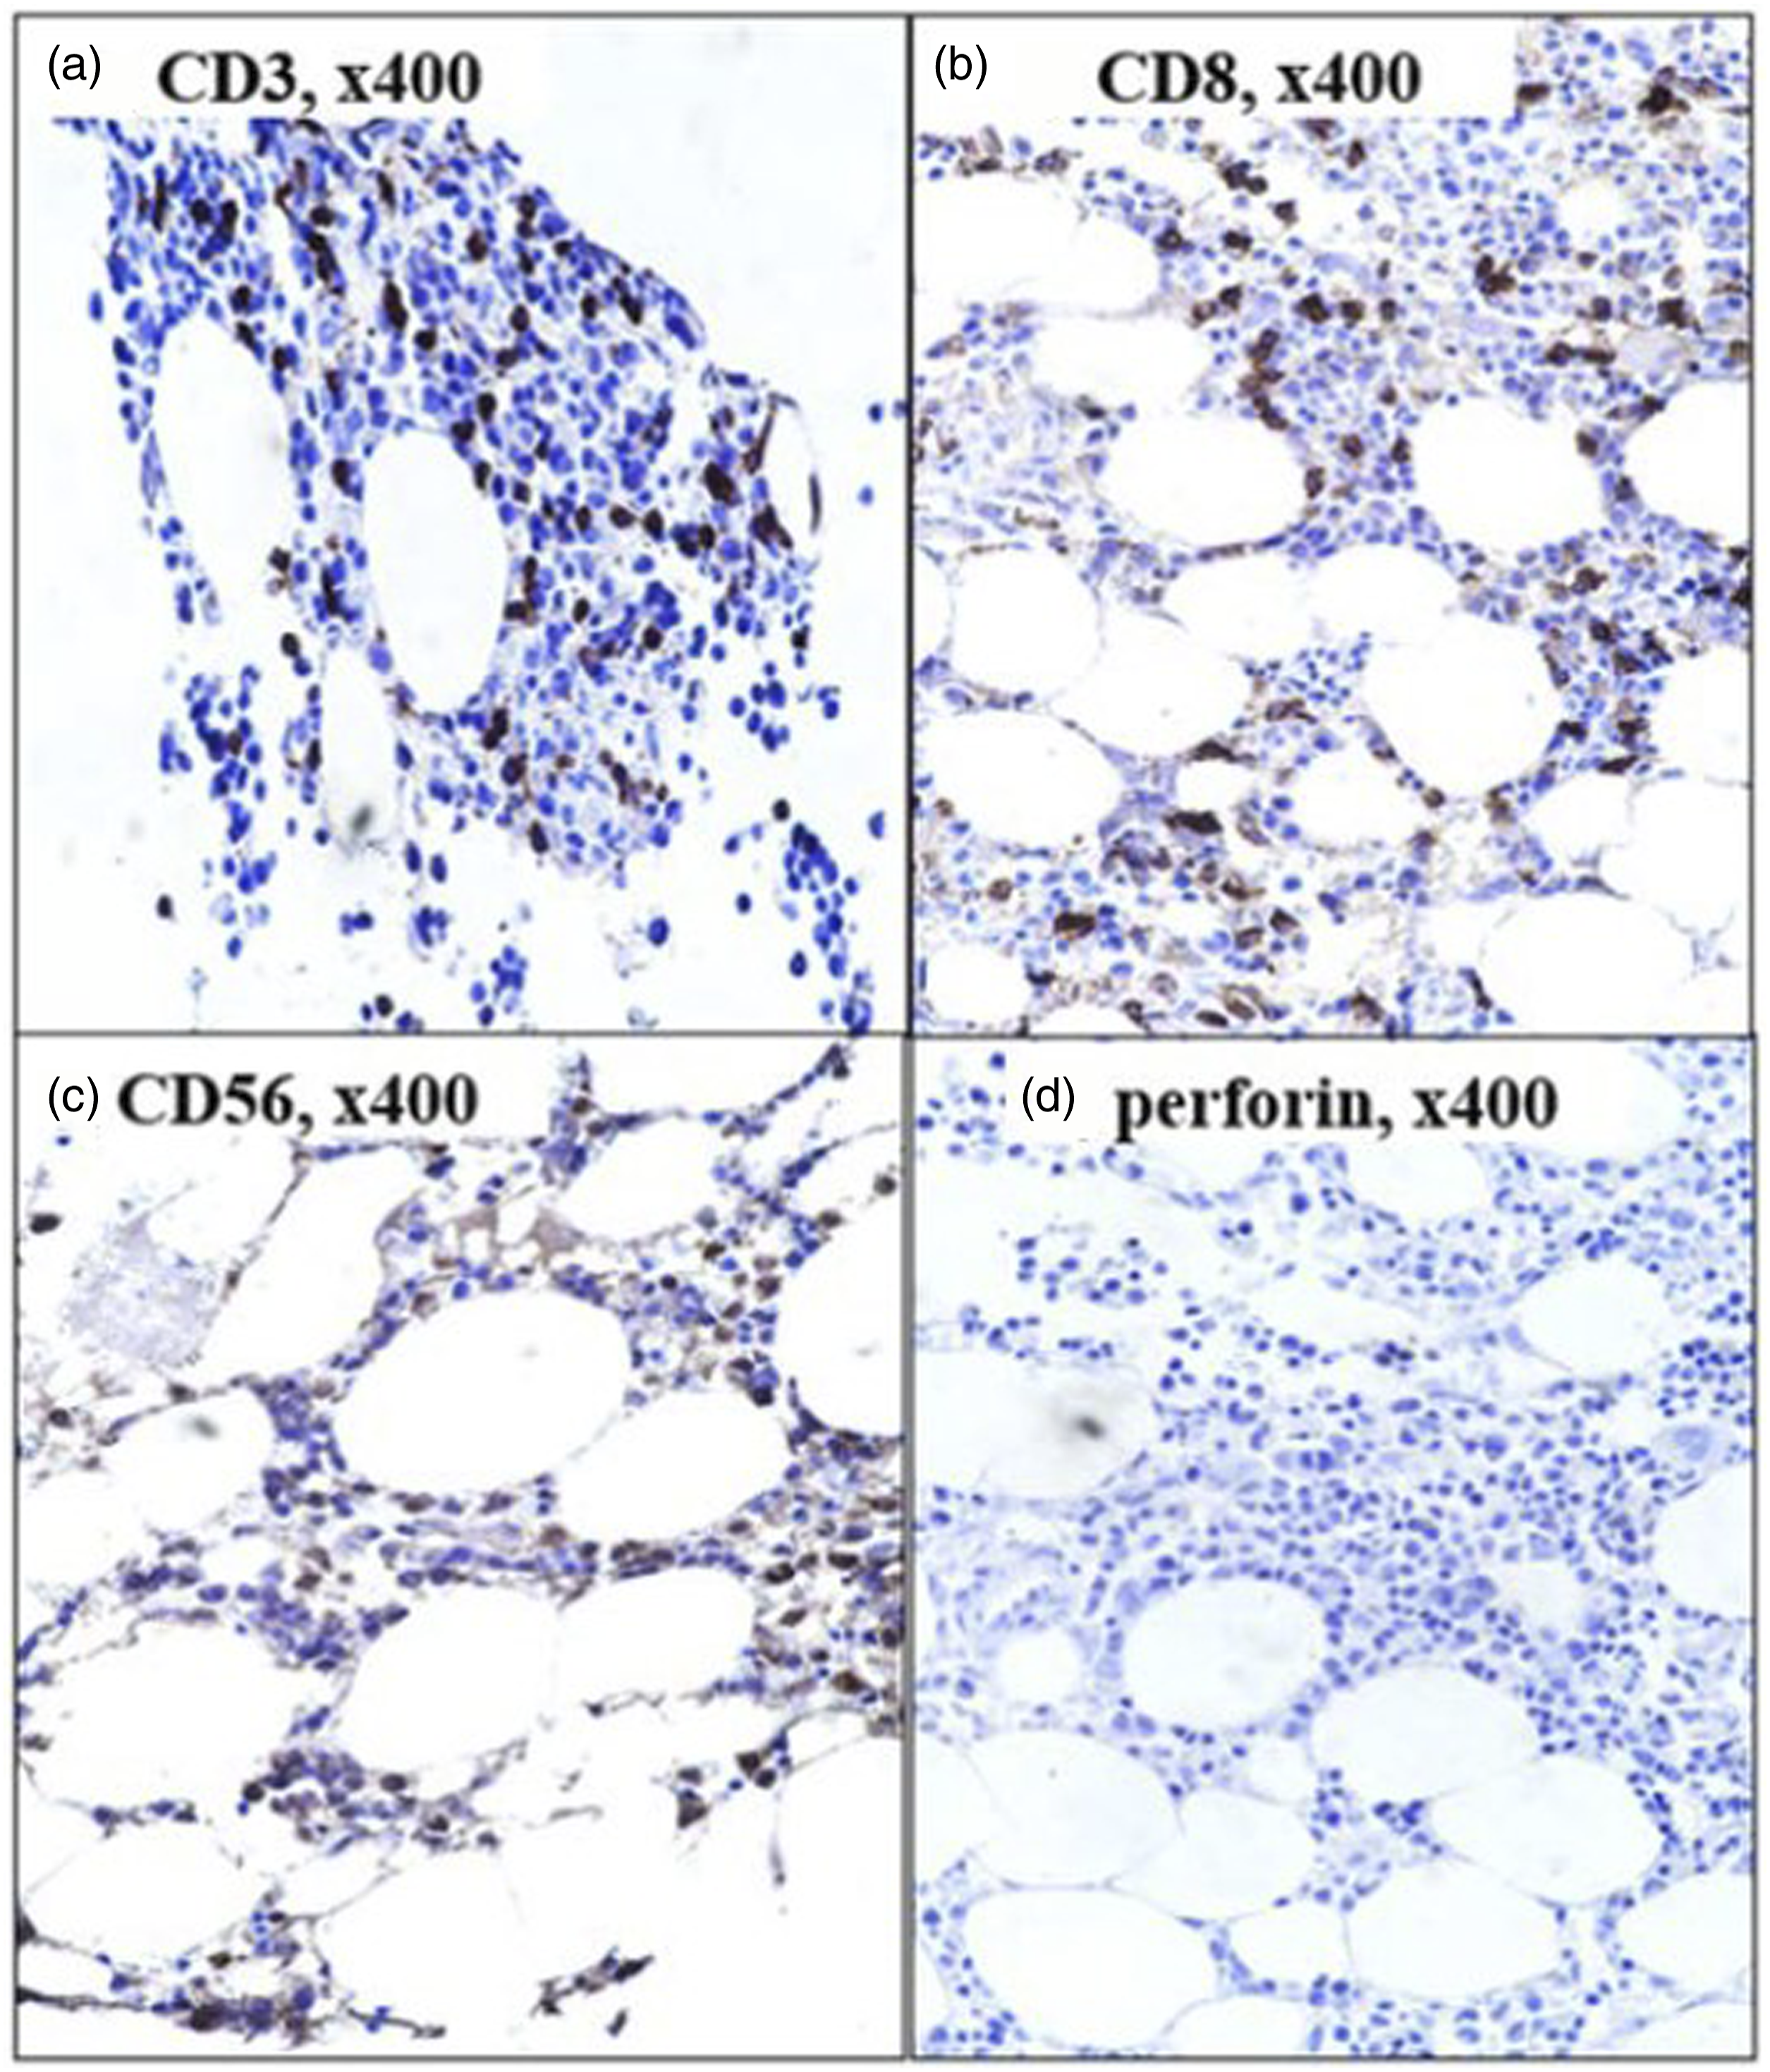
The proportion of PFN positive lymphoid cells (p = .10), PFN+CD8+ cells (p = .14), and PFN histoscore (p < .01) among controls were higher among control subjects than cases (Figures 4–6). No difference was noted among two subgroups of SLE in relation to PFN positive lymphoid cells, PFN+CD8+ cells, and PFN histoscore (p > .05). There was good interobserver agreement in regard to PFN% (kappa = 0.86), intensity (0.91), and histoscore (0.87) (p < .01). PFN expression had a weak significant positive correlation with number of systems affected (Pearson r = 0.368, p = .045), weak significant negative correlation with temperature (r = - 0.408, p = .025), weak negative insignificant correlation with leukocyte count, weak significant positive correlation with platelet count (Spearman r = 0.37, p = .04), and weak negative significant correlation with total bilirubin (Spearman r = - 0.39, p = .03). Immunohistochemical expression of CD3, CD8, and perforin on bone marrow trephine biopsy section in a case with pyrexia of unknown origin. Note the presence of perforin positive lymphomononuclear cells (c, d) with 3+ granular cytoplasmic positivity (peroxidase-anti peroxidase). Immunohistochemical expression of perforin on bone marrow trephine biopsy section in a case of SLE with MAS. Note the retained 3+ granular cytoplasmic positivity of perforin in cytotoxic cells (peroxidase-anti peroxidase). Immunohistochemical expression of perforin on bone marrow trephine biopsy section in a case of SLE with MAS. Note the depleted CD3+ (a), CD8 + T (b) lymphocytes, complete absence of NK cells (c) and perforin (d) expression in this case (peroxidase-anti peroxidase).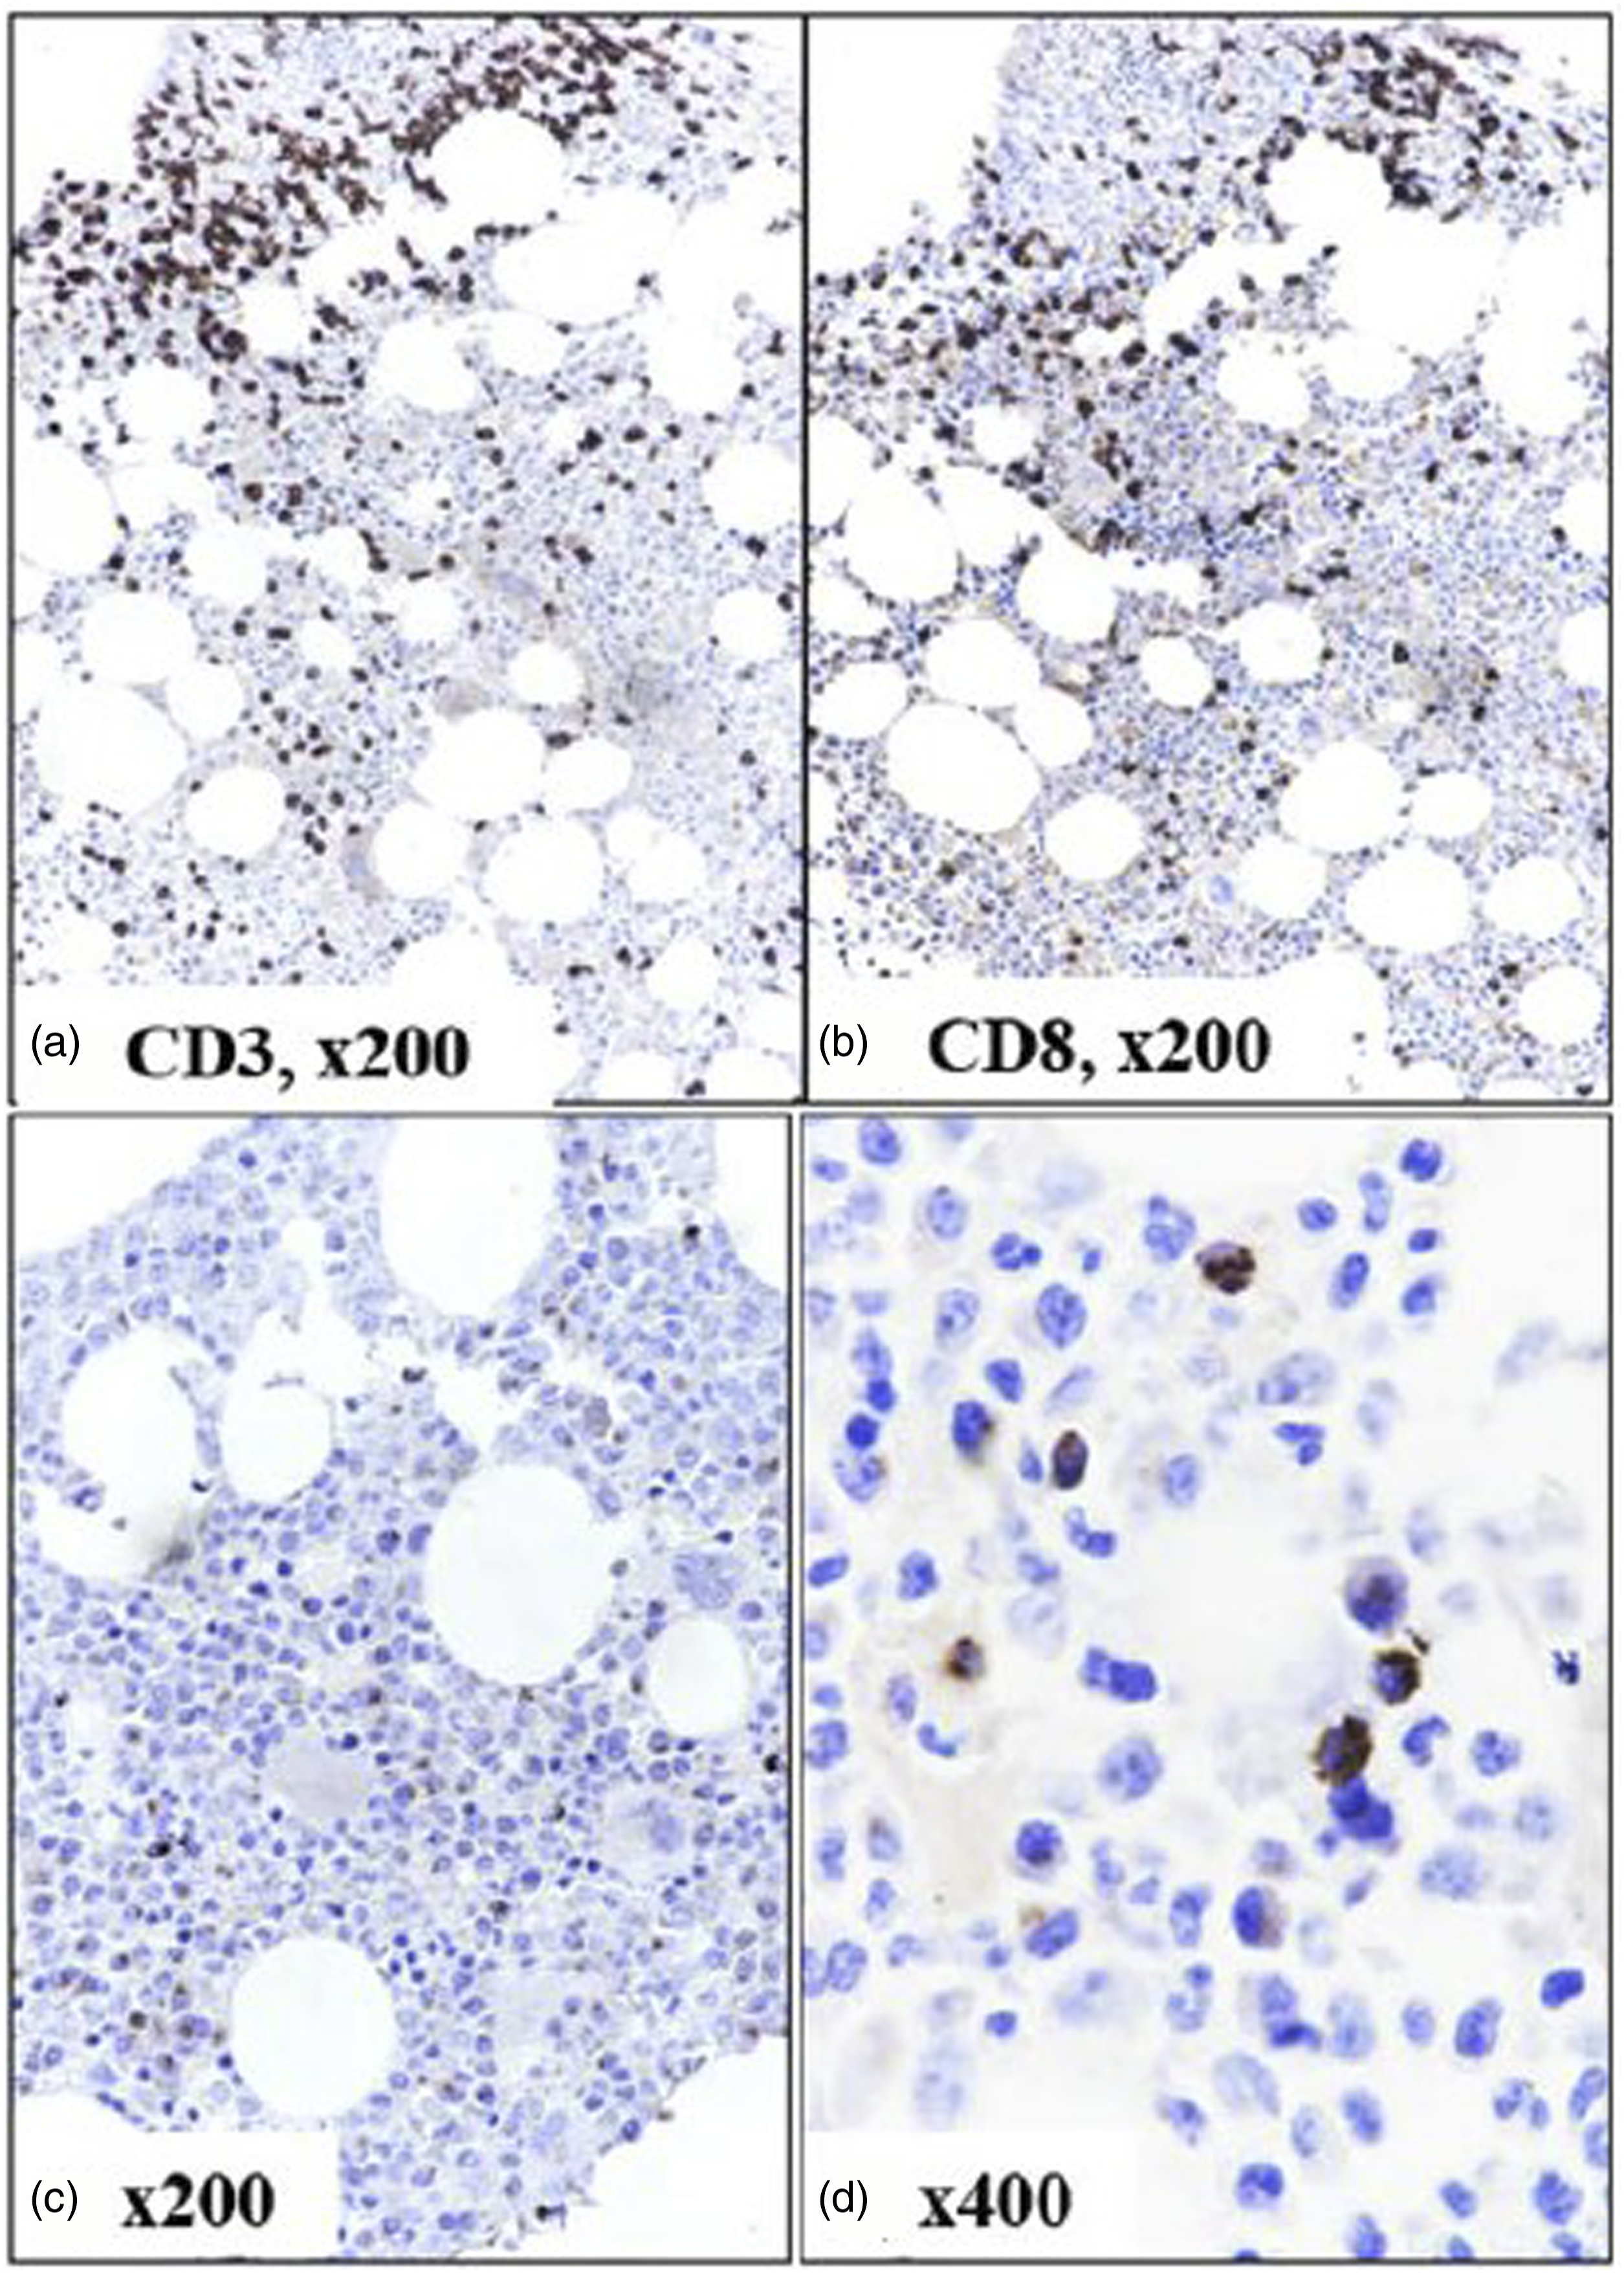
Sensitivity and specificity of laboratory parameters analyzed for ability to discriminate macrophage activation syndrome from without macrophage activation syndrome.
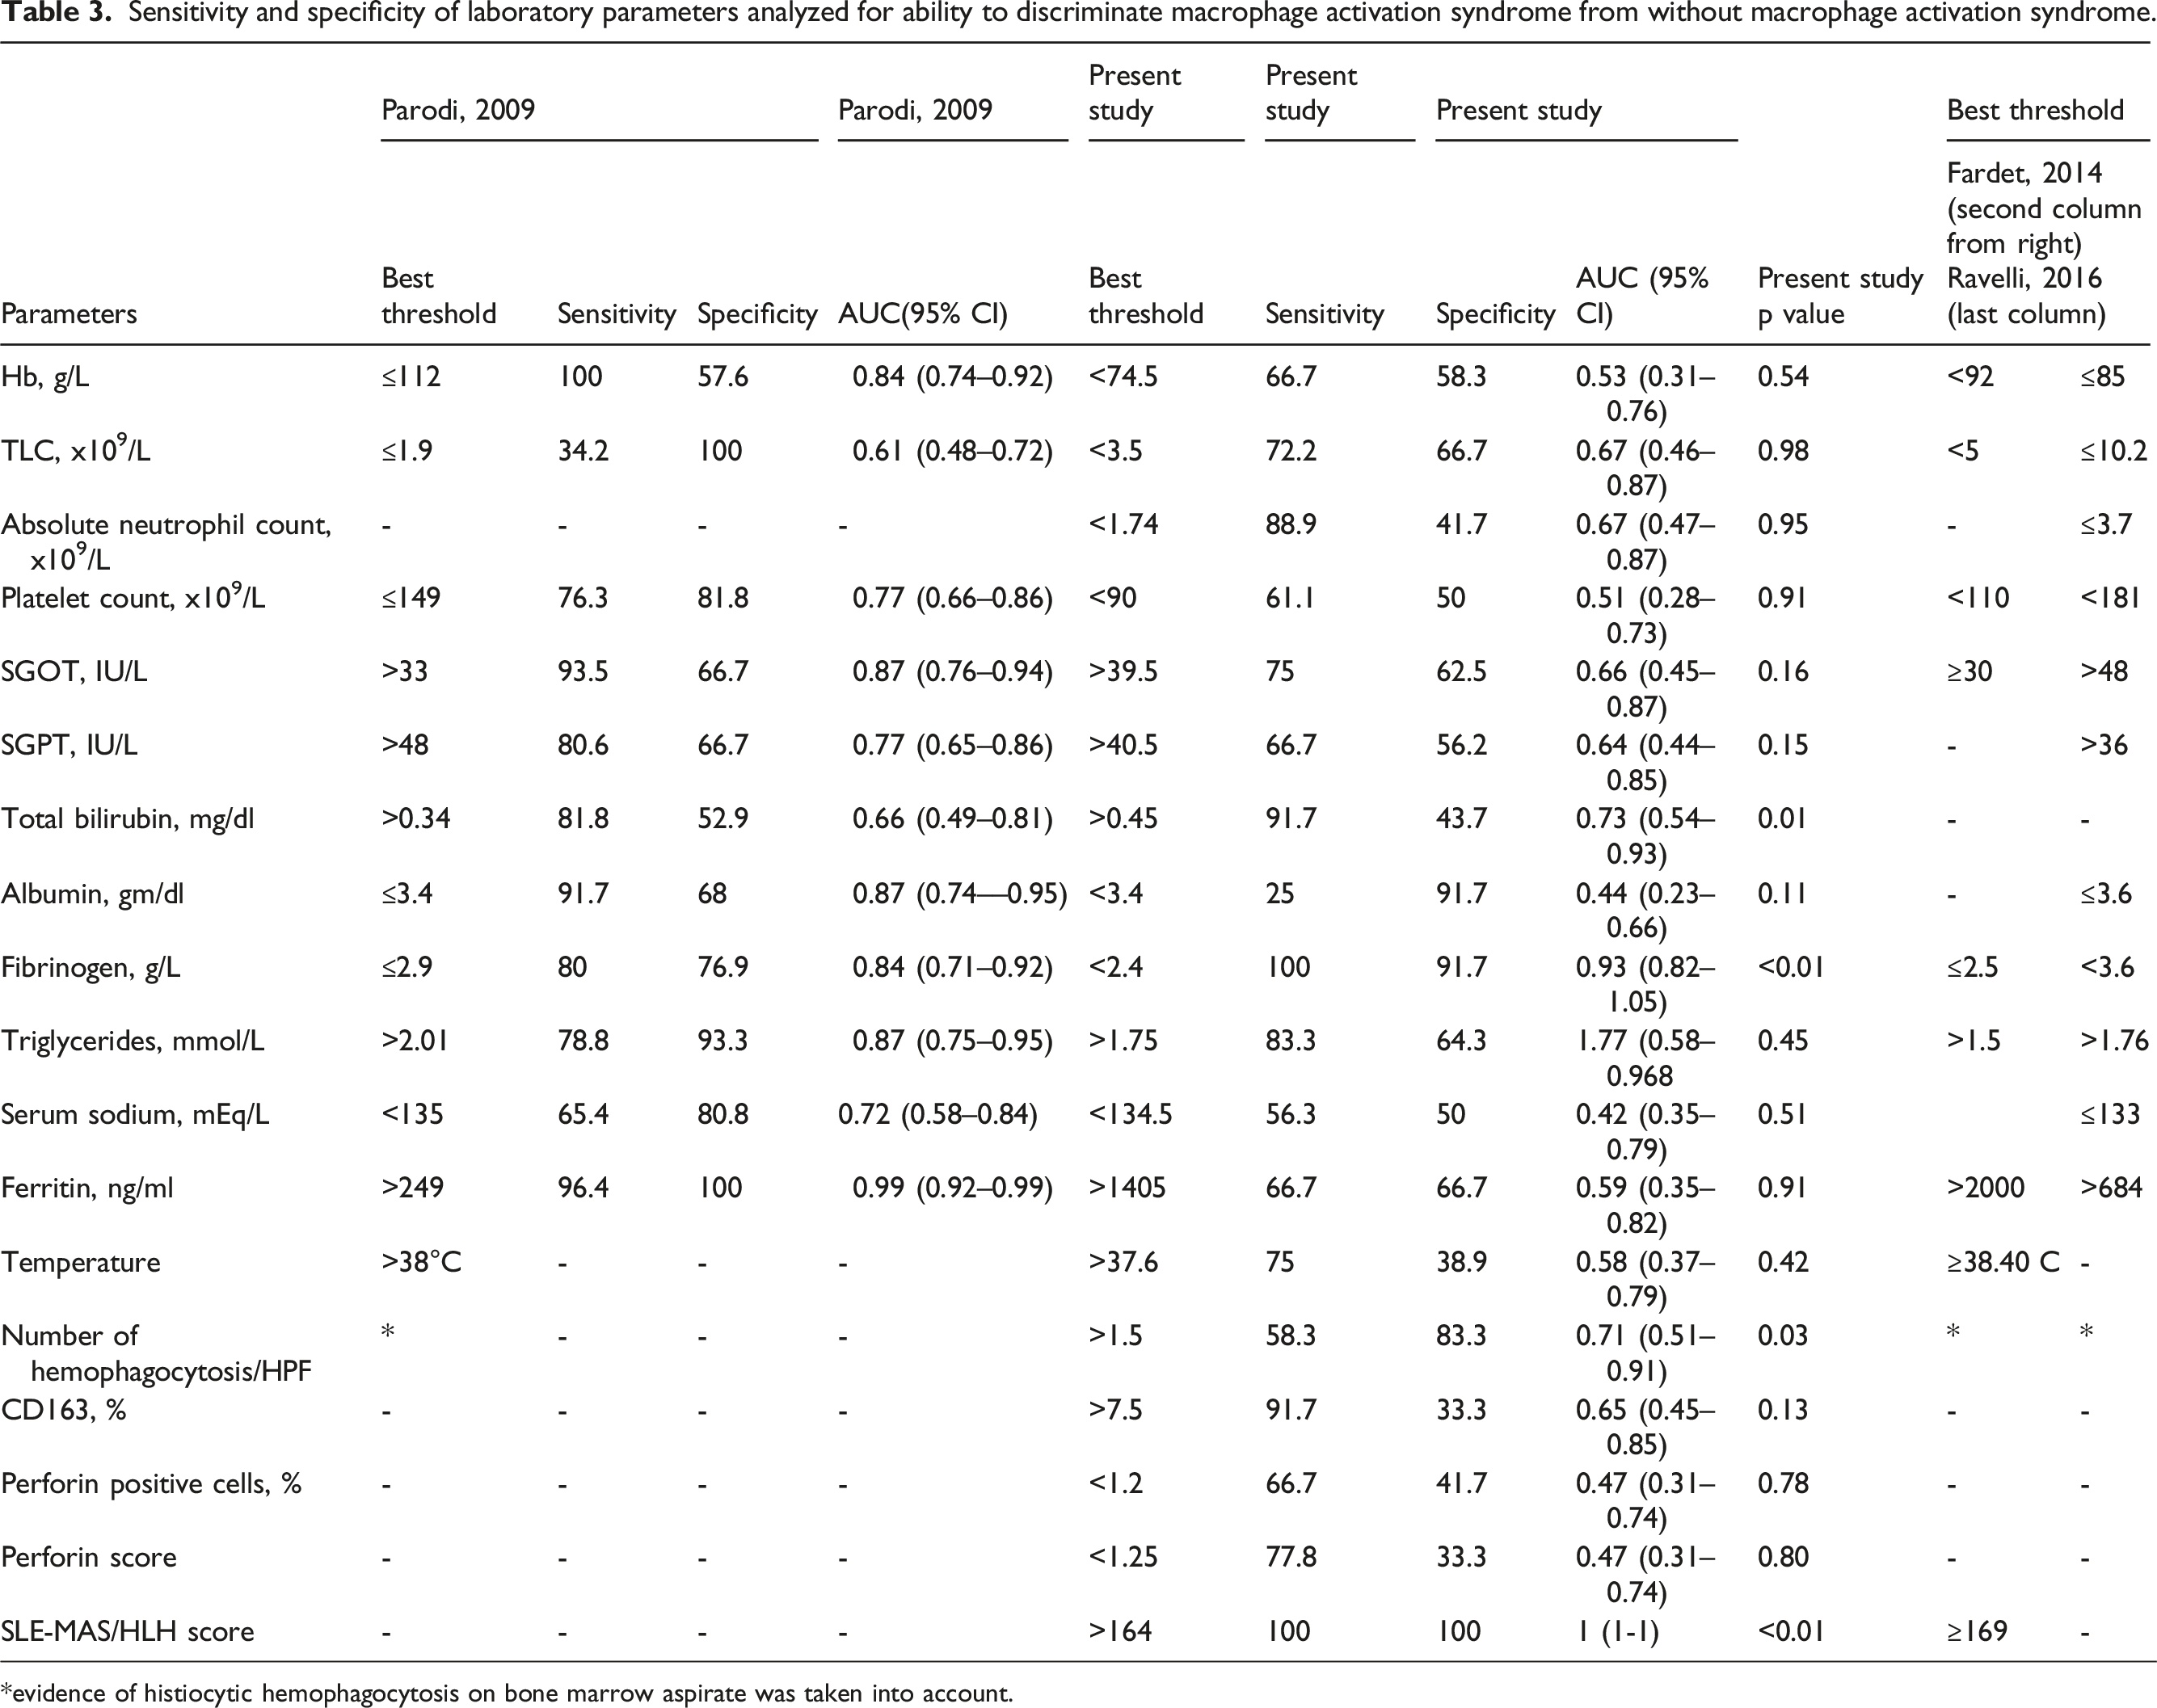
*evidence of histiocytic hemophagocytosis on bone marrow aspirate was taken into account.
Discussion
In this study, we quantified the CD8 + T lymphocytes, perforin immunoexpression, and histiocytic hemophagocytosis in bone marrow trephine biopsies from adult cytopenic SLE cases which were suspected to have MAS. We also incorporated these and other parameters to formulate new set of criteria for early diagnosis of MAS and validate previously established guidelines as proposed by Fardet et al, Parodi et al, and Ravelii et al.11,16,20 We revalidated the HScore cut off ≥ 169 as proposed by Fardet et al 11 to discriminate MAS from non-MAS (164 in our study). The parameters such as low albumin (< 3.4 g/dl), fibrinogen (< 2.4 g/L), and raised SGOT (> 30 IU/L), SGPT (> 40 IU/L), and triglyceride (> 1.75 mmol/L) were comparable to that proposed by Parodi et al. 16 The prevalence of SLE-MAS was found to be 40% (12/30) which was comparable to the published literature of up to 50% in hospital setting.4,6,16–18
Previous studies have reported that cytopenia (s), raised serum lactate dehydrogenase (2 to 4 times the upper limit of normal, ULN), SGOT (up to eight times that of ULN), and hyperferritinemia (> 1000 ng/mL) were common in both pediatric and adult SLE-MAS.16–21 Tusji et al reported a high prevalence (91.3%) of raised SGOT/SGPT in their series although MAS was evident only in 10% cases. 18 In a series of 28 cytopenic SLE cases reported by Morales et al, 22 (73.3%) showed histiocytic hemophagocytosis in the BM, although this did not correlate with disease severity and anti dsDNA titres. 19 Parodi et al reported that ferritin (>249 ng/mL), triglyceride (>2 mmol/L), and LDH (>567 IU/L) were better predictors of MAS in pediatric population. The combination of ≥ one clinical criterion and ≥ two laboratory criteria had a > 90% sensitivity and specificity for diagnosis of MAS in their cohort. Fever had high sensitivity, but lacked specificity to discriminate MAS from non-MAS. 16 In another study involving 277 cases of systemic onset juvenile idiopathic arthritis, parameters like ferritin of > 684 ng/mL, platelet count of ≤ 181 × 109/L, TG of >1.76 mmol/L, fibrinogen of < 3.6 g/L, and SGOT of > 48 U/L were reported to be very significantly associated with increased risk of MAS (AUC = 0.99). 20 Liu et al reported that SLE flare and infections were common triggers for development of MAS (n = 32/96) with a higher prevalence of renal involvement, hepatic dysfunction, and cytopenia (s). Serum ferritin (> 662.5 ng/mL) and LDH (> 359 U/mL) were better predictors of MAS in ROC analysis. 21
Using IHC on BMBx sections, we observed an overall increase in CD3+, CD3+CD8+ T cells than CD3+CD4+ T cells forming interstitial clusters and aggregates. Moreover, compared to control subjects, SLE cases showed reduced number of PFN positive lymphocytes [4% (2.7–10) vs. 2% (1–4.5), respectively, p = .10] that exhibited weaker and variable intensity granular cytoplasmic positivity [PFN score; 12 (8–30) vs. 3 (1–7), respectively, p < .01]; and three cases did not show any PFN expression. Although there was a slightly higher trend towards number of PFN + lymphocytes in MAS than non-MAS subgroup (p = .78), intensity of PFN expression did not vary much among two subgroups (p = .8). In line with the previous hypothesis by Hameed and colleagues, we too did believe that three important factors could have influenced such altered expression of PFN: i) prior usage of immunosuppressive therapy in some of our cases, ii) stage of evolution of disease and associated inflammatory reaction, and iii) the state of activation of cytotoxic T lymphocytes. 22
Perforin is a key cytoplasmic protein that is implicated in the CD8 + T lymphocytes and NK cell mediated cell cytotoxicity that along with granzyme B acts upon the virus or bacteria infected cells and tumor cells leading to effective clearance of stimuli and switching off of the immune response. Defective cell cytotoxicity leads to impaired clearance of target cells which may in turn trigger persistent Th1 mediated immune response, cytokine storm, ultimately leading to MAS/HLH in susceptible individuals. 23 The same PFN may act as a “double edged sword” in the sense that its over activity could be detrimental against self-antigens leading to origin of autoimmune and inflammatory disorders. 2
Flow cytometry based studies on the peripheral blood milieu of cytotoxic T lymphocytes and NK cells in SLE have reported both numerical and functional abnormalities.25–28 Many reports described a significant expansion of CD3+CD8+ T cells, depleted CD3+CD4+ T cells, altered CD4 to CD8 ratio, and depletion of NK cells among cases than healthy controls; in active than quiescent disease, as well as untreated than treated diseases; and these were linked to increased SLE disease activity index (SELDAI), increased prevalence of nephritis among adults, and lower prevalence of nephritis among juveniles.29–34 Blanco et al reported a very highly significant (p < 10−6) increase in PFN+CD8+ T cells among active SLE compared to stable disease and this had a significant positive correlation with SLEDAI. 25 Subsequent studies by Harigai and Abo-Elenein and further validated the findings of Blanco et al.27,29 On the contrary, Comte et al reported a lower proportion of PFN+CD8+ T cells among SLE subjects than controls and this expression was restored by engagement with a lymphocyte signaling molecule named SLAMF7. 28 Moreover, studies by different groups reported a reduced cytotoxicity with very little PFN expression in spite of expanded CD8 + T cell pool in active SLE with an increased propensity for infection, specifically activation of Epstein Barr Virus infection.30–34 Other studies reported enhanced apoptosis metabolic dysfunction, and exhaustion of CD8 + T cells in active SLE cases with an impact on disease remission.35–37 On the contrary, no such association was reported by studies led by Nehar-Belaid et al (2020) and Miyamoto et al (2011).8,38
The outcome of our present study should be interpreted with caution in view of some potential limitations. A relatively lesser number of study subjects in view of COVID-19 lock down as well as missing of data in some of the retrospective/follow-up cases could have influenced the study analysis. As we performed a bone marrow based study, the selection of pathologic marrow sample as controls could have led to a bias and error in interpretation of IHC results. Flow cytometry based analysis of BMA samples could have been a better option to analyze the T cell mediated cytotoxicity which was not properly standardized in our lab. However, with limited resources available, we could standardize perforin IHC on BMBx in these cases and revalidated the already established HLH probability score as proposed by Fardet et al. 11
In conclusion, MAS is a potentially under diagnosed and life threatening complications associated with SLE. Correlation of clinical and biochemical parameters in conjunction with bone marrow evaluation for histiocytic hemophagocytosis and perforin expression may aid in early diagnosis and initiation of appropriate therapy. More prospective studies in larger number of cases and using different control groups are needed to validate our preliminary observations and formulate new management protocols in SLE associated MAS.
Supplemental Material
Supplemental Material - Immunohistochemical expression of perforin in adult systemic lupus erythematosus associated macrophage activation syndrome: Clinicohematological correlation and literature review
Supplemental Material for Immunohistochemical expression of perforin in adult systemic lupus erythematosus associated macrophage activation syndrome: Clinicohematological correlation and literature review by Bakialakshmi Velayutham, Somanath Padhi, Sujata Devi, Susama Patra, Chinmayee Panigrahi, Mathan Kumar Ramasubbu, Rajesh Kumar, and Samiur Rehman in Lupus
Footnotes
Author contribution
BV: Data collection, analysis and interpretation of data, literature review, and writing of first manuscript draft. SP: Conceptual design, literature review, data acquisition and interpretation, review of manuscript for intellectual content. SD: Provided the data pertaining to clinical and lab investigation, management and follow-up, and reviewed the manuscript for intellectual content. SP; critical review of scientific contents; CP; data acquisition, analysis, marrow procedure; MKR: statistical assistance; SR; immunohistochemistry and standardization of PFN immunohistochemistry.
Declaration of conflicting interests
The author(s) declared no potential conflicts of interest with respect to the research, authorship, and/or publication of this article.
Funding
The author(s) received no financial support for the research, authorship, and/or publication of this article.
Ethical approval
The Institutional Ethics Committee at All India Institute of Medical Sciences, Bhubaneswar approved the study protocol (Ref. No. IEC/AIIMS BBSR/PG Thesis/2020-21/88), and this study was conducted in accordance with the Declaration of Helsinki.
Supplemental Material
Supplemental material for this article is available online.
References
Supplementary Material
Please find the following supplemental material available below.
For Open Access articles published under a Creative Commons License, all supplemental material carries the same license as the article it is associated with.
For non-Open Access articles published, all supplemental material carries a non-exclusive license, and permission requests for re-use of supplemental material or any part of supplemental material shall be sent directly to the copyright owner as specified in the copyright notice associated with the article.