
Abstract
Objective
Assess healthcare costs associated with systemic lupus erythematosus (SLE) flares among patients with and without lupus nephritis (LN).
Methods
This retrospective cohort study used medical and pharmacy claims data from the United States-based Optum Clinformatics database to identify adults with SLE between 1 January 2016, and 31 December 2018. Index was the date of a patient’s earliest SLE diagnosis claim during the identification period. Patients were categorized based on ICD-9/-10 diagnosis codes into one of two cohorts: SLE with LN (LN) and SLE without LN (non-LN). Baseline characteristics were assessed in the 12 months preceding index (baseline period). The presence, severity, and healthcare costs (in 2019 US dollars) of flares were determined in the 12 months following index (follow-up period).
Results
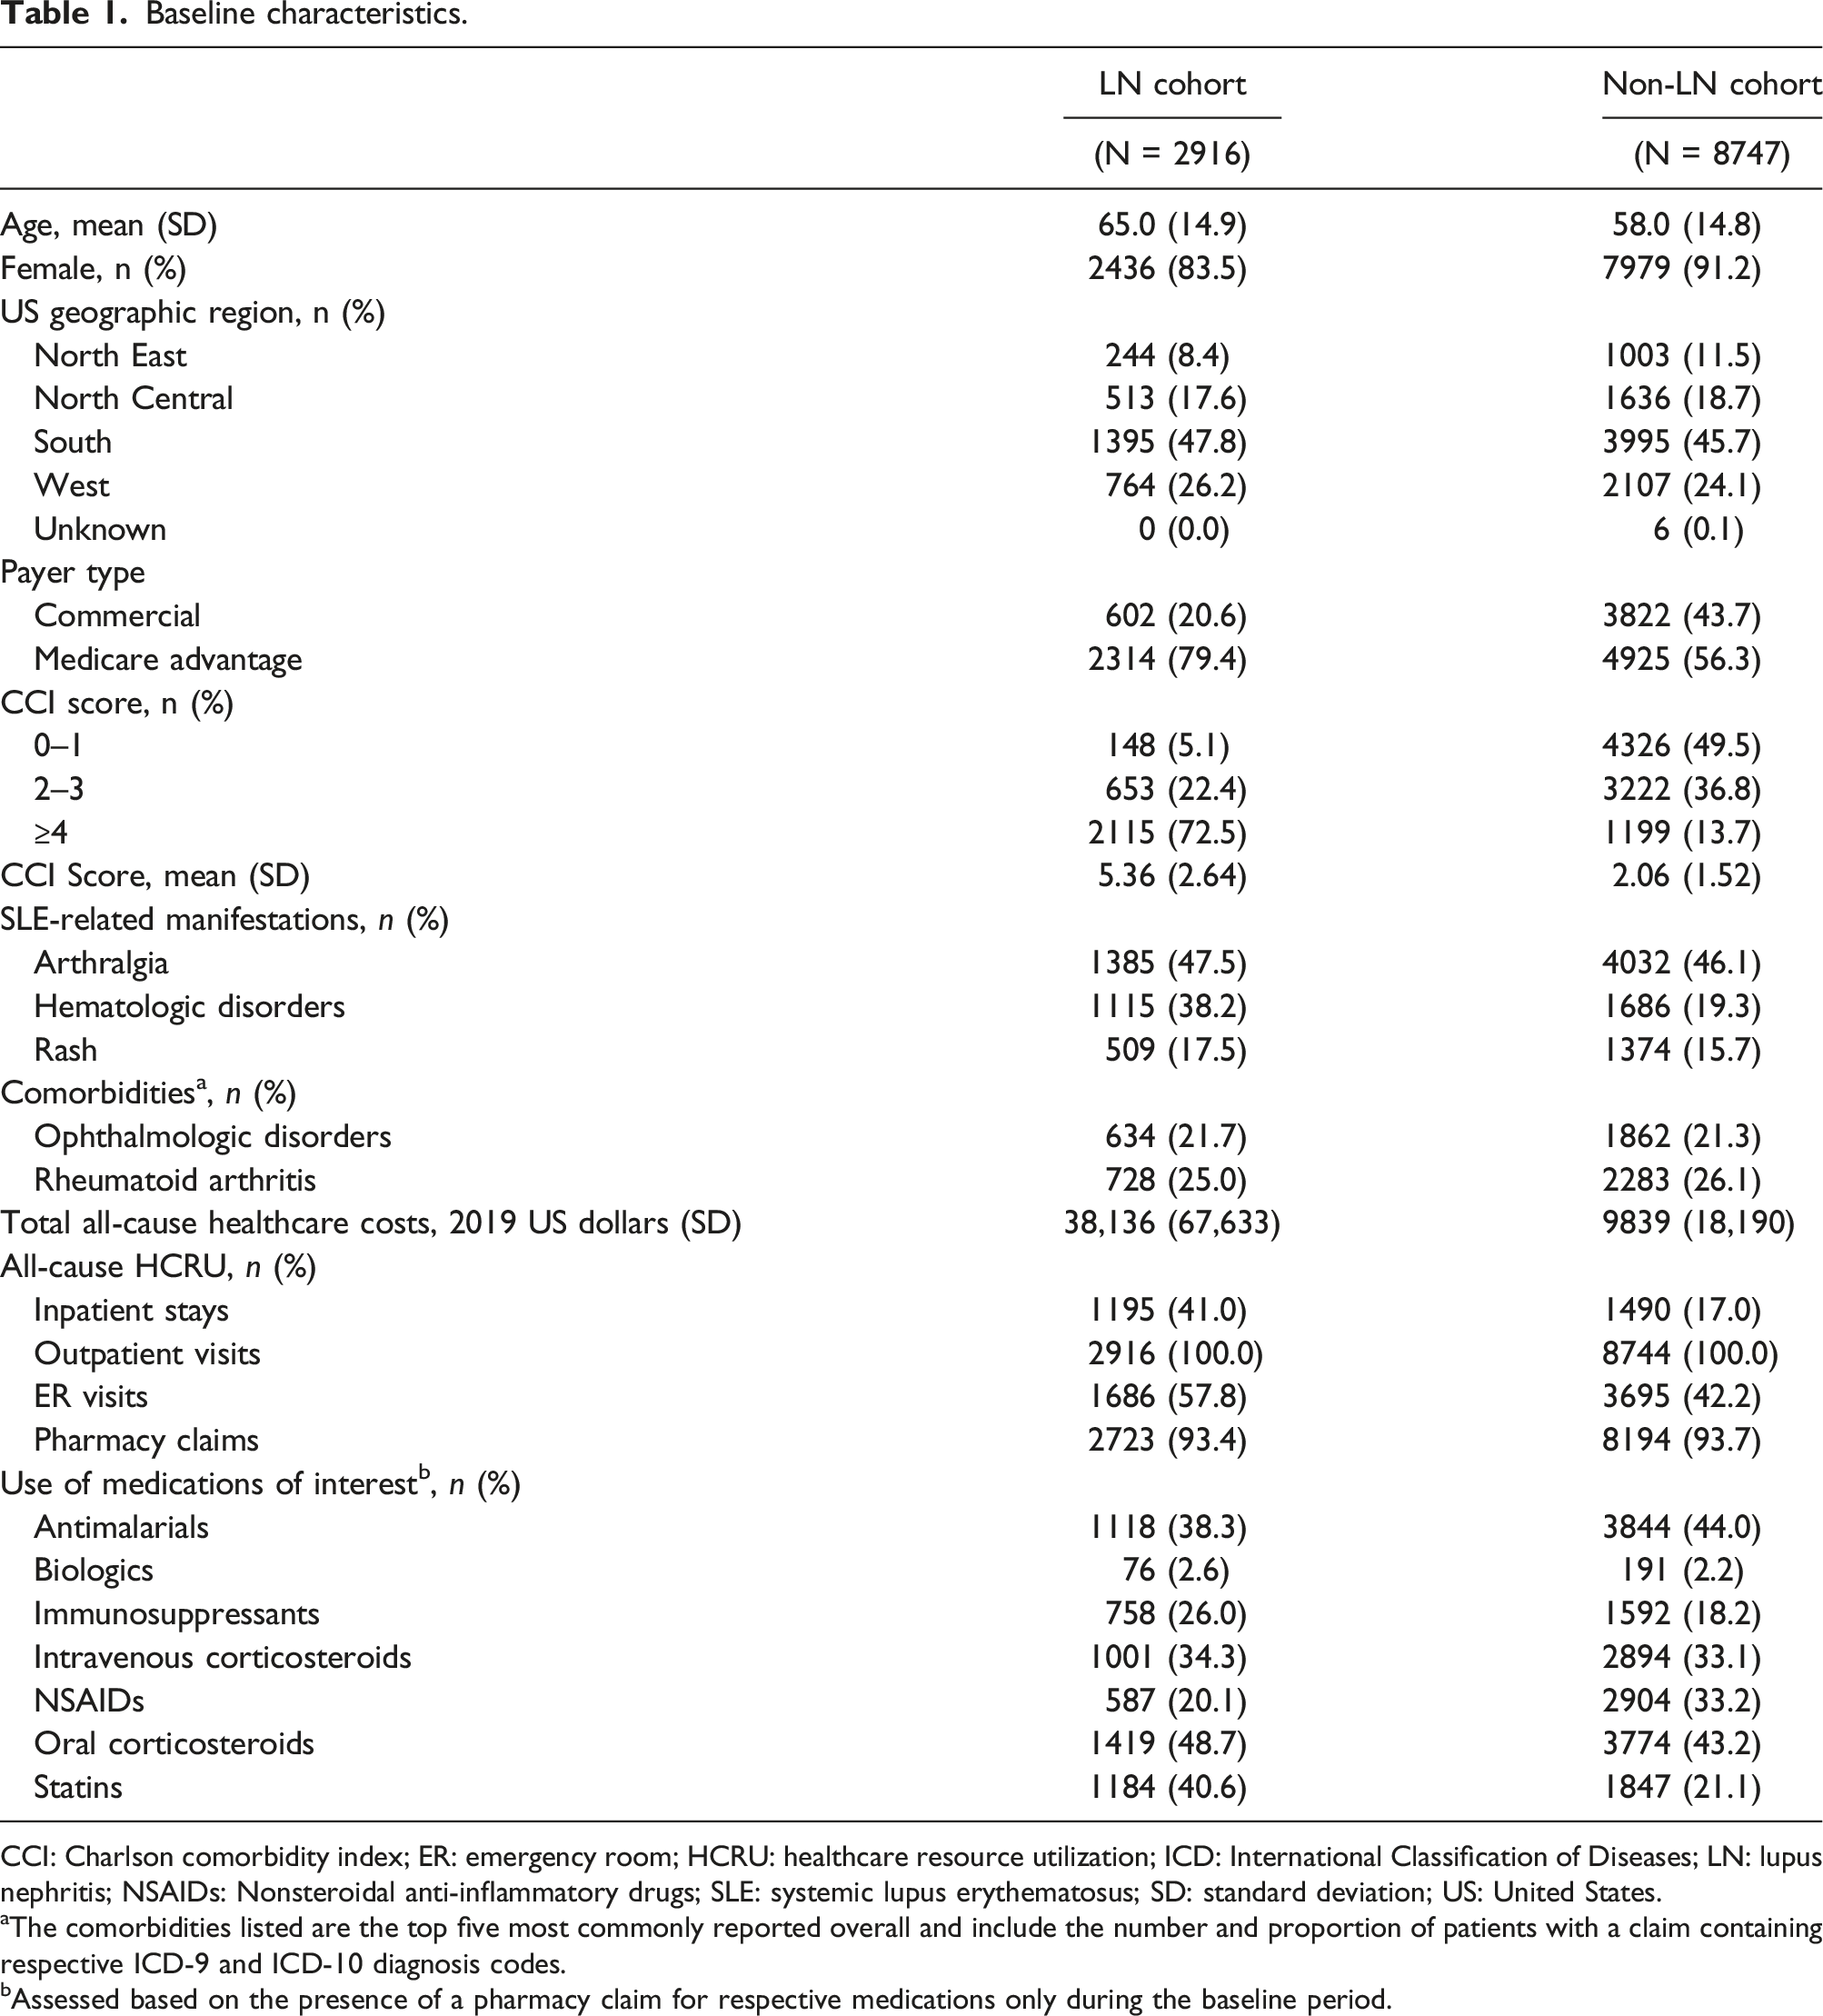
Overall, 11,663 patients with SLE were included (LN, n = 2916; non-LN, n = 8747). During the baseline period, a greater proportion of patients in the LN cohort versus non-LN cohort had a Charlson Comorbidity Index score ≥4 (72.5% vs 13.7%) and inpatient stays (41.0% vs 17.0%).
A total of 12,190 flares were identified during the follow-up period (LN, 3494; non-LN, 8696). A greater proportion of flares experienced by patients with LN versus those without LN were moderate (61.2% vs 53.6%) and severe (10.6% vs 5.4%). The mean (standard deviation [SD]) number of moderate and severe flares per patient was greater among the LN cohort than the non-LN cohort (moderate: LN, 1.8 [1.2] and non-LN, 1.4 [1.2]; severe: LN, 0.2 [0.6] and non-LN, 0.1 [0.3]). The mean (SD) total healthcare costs associated with SLE flares of any severity were greater for patients with LN (LN, $5842 [9604]; non-LN, $2600 [4249]). The mean (SD) cost per flare increased with severity (mild: LN, $2753 [4640] and non-LN, $1606 [2710]; moderate: LN, $4561 [7156] and non-LN, $2587 [3720]; severe: LN, $29,148 [27,273] and non-LN, $14,829 [19,533]).
Conclusions
Patients with SLE with LN have greater healthcare costs than those without LN. Flares among patients with LN were more frequent, severe, and costly than among patients without LN. This highlights the need for treatments that prevent or reduce flares among patients with SLE, both with and without LN.
Introduction
One of the most frequent manifestations of systemic lupus erythematosus (SLE) is lupus nephritis (LN); approximately 40% of patients with SLE present with LN, 1 of whom around 10%–20% develop end stage kidney disease (ESKD) 10 years after diagnosis.1,2 Additionally, patients with LN have been shown to incur greater healthcare resource utilization (HCRU) and economic burden than patients with SLE alone. 3
SLE flares are associated with hospital admissions and poor patient outcomes, such as an increased risk of organ damage.4–6 Occurrence of flares among patients with LN is particularly damaging; each renal flare results in nephron loss, reduces the lifespan of the kidney, and increases the risk of kidney failure.7,8
Previous clinical trials investigating the efficacy and safety of treatments for SLE have identified the presence and severity of flares using the SLE flare index.9–11 Currently, there are no specific diagnostic International Classification of Diseases (ICD) codes for an SLE flare, and the manifestations of SLE itself are diverse. This can make it difficult to identify SLE flares. 12 Therefore, a claims-based algorithm was developed (by Garris and colleagues) to identify SLE flares and to classify their severity (e.g., mild, moderate, or severe). 13 The algorithm is based on the Lupus Foundation second international Lupus Flare Conference definition of flare severity, 14 consensus of expert clinical opinion, and criteria including outpatient visits, hospitalization, and emergency room (ER) visits supported by a qualifying diagnosis of SLE or an SLE-related condition. 13 Using this algorithm, several studies have investigated the economic burden of SLE flares and shown that healthcare costs increase with flare severity.13,15–18 A comparison of this administrative algorithm and the SLE activity measure SLE Disease Activity Index-2000 (SLEDAI-2K) showed that the Garris algorithm had moderate agreement for the classification of SLE severity with the SLEDAI-2K when assessed in an academic lupus center, exhibiting a sensitivity of 85.7%, specificity of 67.6%, and positive and negative predictive values of 81.8% and 73.5%, respectively. 19
One such study used administrative commercial claims data from the United States (US) to evaluate the frequency, severity, and cost of flares in adults newly diagnosed with SLE and showed that mean all-cause healthcare costs within 30 days of an SLE flare rose from $1672 for mild flares to $16,856 for severe flares. 18 However, given the negative impact of flares among patients with LN, few studies have investigated if there is a difference in the cost of treating SLE flares among patients with and without LN.
The aim of this study was to assess direct healthcare costs associated with SLE flares among patients in the US with and without LN.
Methods
Study design and data source
This was a retrospective cohort study conducted using medical and pharmacy claims data from members of Commercial and Medicare Advantage plans in the US-based Optum Clinformatics database between 1 January 2015, and 31 December 2019 (Figure 1). The Optum Clinformatics database contains de-identified medical and pharmacy data and associated enrollment data for individuals across the US enrolled in health plans. Medical claims data include diagnosis and procedure codes, site of service codes, and paid amounts; pharmacy claims data include the drug name, national drug code, dosage form, drug strength, fill date, and financial information for health plan–provided outpatient pharmacy services. Informed consent, ethics committee approval, or institutional review board approval were not required for this study since there was no direct patient contact or primary collection of individual human patient data, and study results omitted patient identification. Study design. SLE: systemic lupus erythematosus.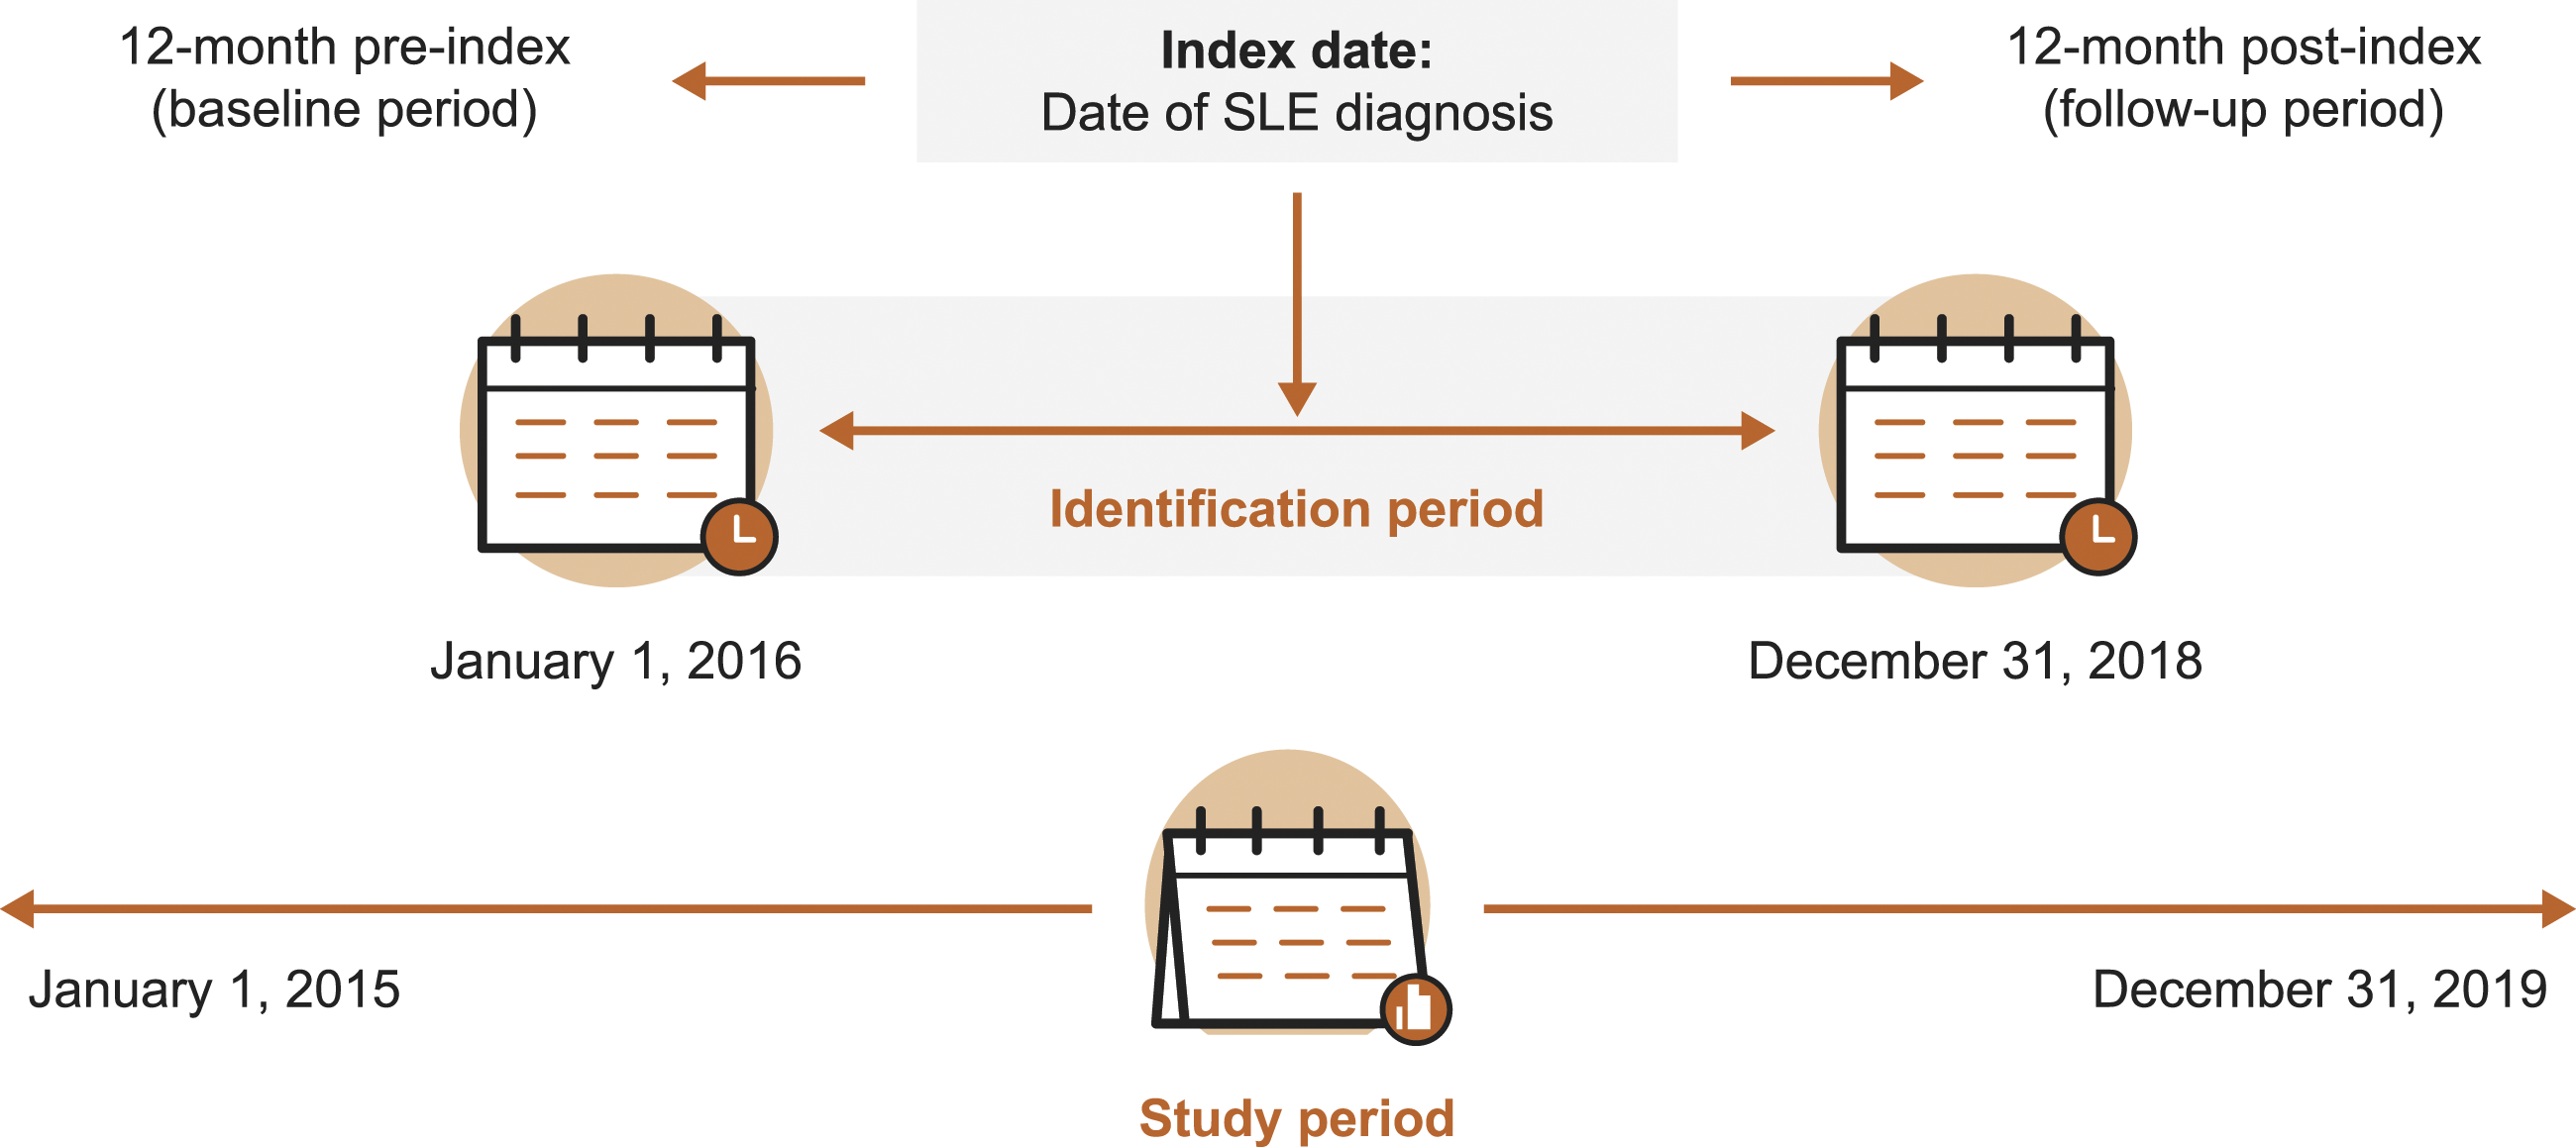
Patients with SLE with or without a diagnosis of LN were identified between 1 January 2016, and 31 December 2018 (identification period). The cohort included patients with prevalent and incident SLE. The index date was the date of their earliest observed SLE diagnosis during the identification period. Patient characteristics were assessed during the 12-month period preceding the index date (baseline period). The presence, severity, and healthcare cost of SLE flares were assessed during the 12-month period following the index date (follow-up period).
Eligibility criteria
Patients were included in the study if they were ≥18 years of age at the year of the index date, had continuous health plan enrollment during both the baseline and follow-up periods (for a minimum of 24 months), and had a diagnosis of SLE on ≥1 inpatient claim or ≥2 outpatient claims (separated by ≥30 days) with an ICD-9 or -10 diagnosis code for SLE (ICD-9-CM: 710.x; ICD-10-CM: M32, M32.1x, M32.8, and M32.9) in any position during the study period. If patients were included based on ≥2 outpatient claims, their index date was the earliest observed diagnosis code. Patients were excluded from the study if they had an ICD-10 diagnosis code for drug-induced SLE (M32.0).
Eligible patients were classified into one of two cohorts: SLE subgroup with LN (LN) and SLE subgroup without LN (non-LN). Patients were included in the LN cohort if they had ≥2 renal diagnosis codes in any position on medical claims during the baseline period or on the index date; diagnosis codes are shown in Supplementary Table 1. The non-LN cohort comprised patients meeting the study eligibility criteria, but had no diagnosis of LN (no renal diagnosis claims) during the baseline or follow-up periods.
Variables and outcomes
Patient demographic characteristics including age (at index), gender, US geographic region, and payer type were assessed at baseline. Charlson comorbidity index (CCI) score (calculated using a validated algorithm),20,21 comorbidities (identified based on the presence of any claim with respective ICD-9 and -10 diagnosis codes), total all-cause healthcare costs (comprised of inpatient, outpatient, and ER visits, and pharmacy costs), all-cause HCRU (comprised of inpatient, outpatient, and ER visits, and pharmacy claims) and use of SLE-related medications (derived from pharmacy claims) were also determined during the baseline period.
The total and mean number of SLE flares during the follow-up period were calculated and stratified by severity (mild, moderate, and severe); flares were identified using the previously published Garris claims-based algorithm. 13 The algorithm was employed due to the inherent difficulty in identifying SLE flares and its reliability as a tool for classifying SLE severity in administrative database studies. 19 Patients could experience multiple disease flares of varying severity, each of which was assessed in the study. Mild flares were defined as the initiation of a new antimalarial prescription; or oral corticosteroid with prednisone-equivalent dose of ≤7.5 mg/day; or non-immunosuppressive therapy. Moderate flares were defined by the: initiation of oral corticosteroid with prednisone-equivalent dose of >7.5 mg/day but ≤40 mg/day or immunosuppressive therapy (excluding cyclophosphamide); or ER visit with primary diagnosis of SLE; or ER or office visit with a primary or secondary diagnosis of a specified moderate SLE-related condition (see Supplementary Material for list of conditions). Finally, severe flares were defined as: initiation of oral corticosteroid with prednisone-equivalent dose of >40 mg/day or cyclophosphamide; or hospitalization (inpatient admission) with a primary diagnosis of SLE; or hospitalization with a primary diagnosis for a specified severe SLE-related condition (see Supplementary Material for a list of conditions). Based on the algorithm, flares were considered to last for 30 days, unless a flare of a higher severity occurred during those 30 days; in this case, the length of the flare was limited from the start of the first flare until the onset of the more severe flare. 13
Total healthcare costs (comprised of inpatient, outpatient, ER visit, and pharmacy costs) were calculated for the duration of each flare and reported per flare, and stratified by severity (any, mild, moderate, and severe flare). Costs per flare were computed as the combined costs paid by the patient and health plan during the flare period. The entire cost for hospitalizations that started during the flare but did not finish before the end of the flare were counted toward the cost of the flare. Healthcare costs were adjusted to 2019 US dollars.
Statistical analysis
This was a descriptive study as no formal statistical comparisons were made. Mean values and standard deviation (SD) were calculated for continuous variables; absolute numbers and percentages were calculated for categorical variables.
Results
Patient demographics and clinical characteristics
Baseline characteristics.
CCI: Charlson comorbidity index; ER: emergency room; HCRU: healthcare resource utilization; ICD: International Classification of Diseases; LN: lupus nephritis; NSAIDs: Nonsteroidal anti-inflammatory drugs; SLE: systemic lupus erythematosus; SD: standard deviation; US: United States.
aThe comorbidities listed are the top five most commonly reported overall and include the number and proportion of patients with a claim containing respective ICD-9 and ICD-10 diagnosis codes.
bAssessed based on the presence of a pharmacy claim for respective medications only during the baseline period.
Total all-cause healthcare costs at baseline were substantially higher among patients in the LN cohort compared with patients in the non-LN cohort (Table 1). With regards to all-cause HCRU during the baseline period, the proportion of patients with inpatient stays and ER visits were higher among patients in the LN cohort compared with the non-LN cohort (Table 1). The most frequently prescribed SLE-related medications were oral corticosteroids in the LN cohort and antimalarials in the non-LN cohort (Table 1).
SLE flares
In total, 3494 and 8696 flares occurred during the follow-up period among patients in the LN and non-LN cohorts, respectively. The most commonly reported SLE flare severity in both cohorts was moderate (Figure 2). A greater proportion of SLE flares experienced by the non-LN cohort were mild compared with the LN cohort; conversely, the proportions of moderate and severe flares were greater in the LN cohort than the non-LN cohort (Figure 2). The number of SLE flares by severity experienced during the 12-month follow-up period among patients in the a) LN cohort and b) non-LN cohort. Note: Proportions are based on the total number of flares experienced in each cohort. SLE: systemic lupus erythematosus; LN: lupus nephritis.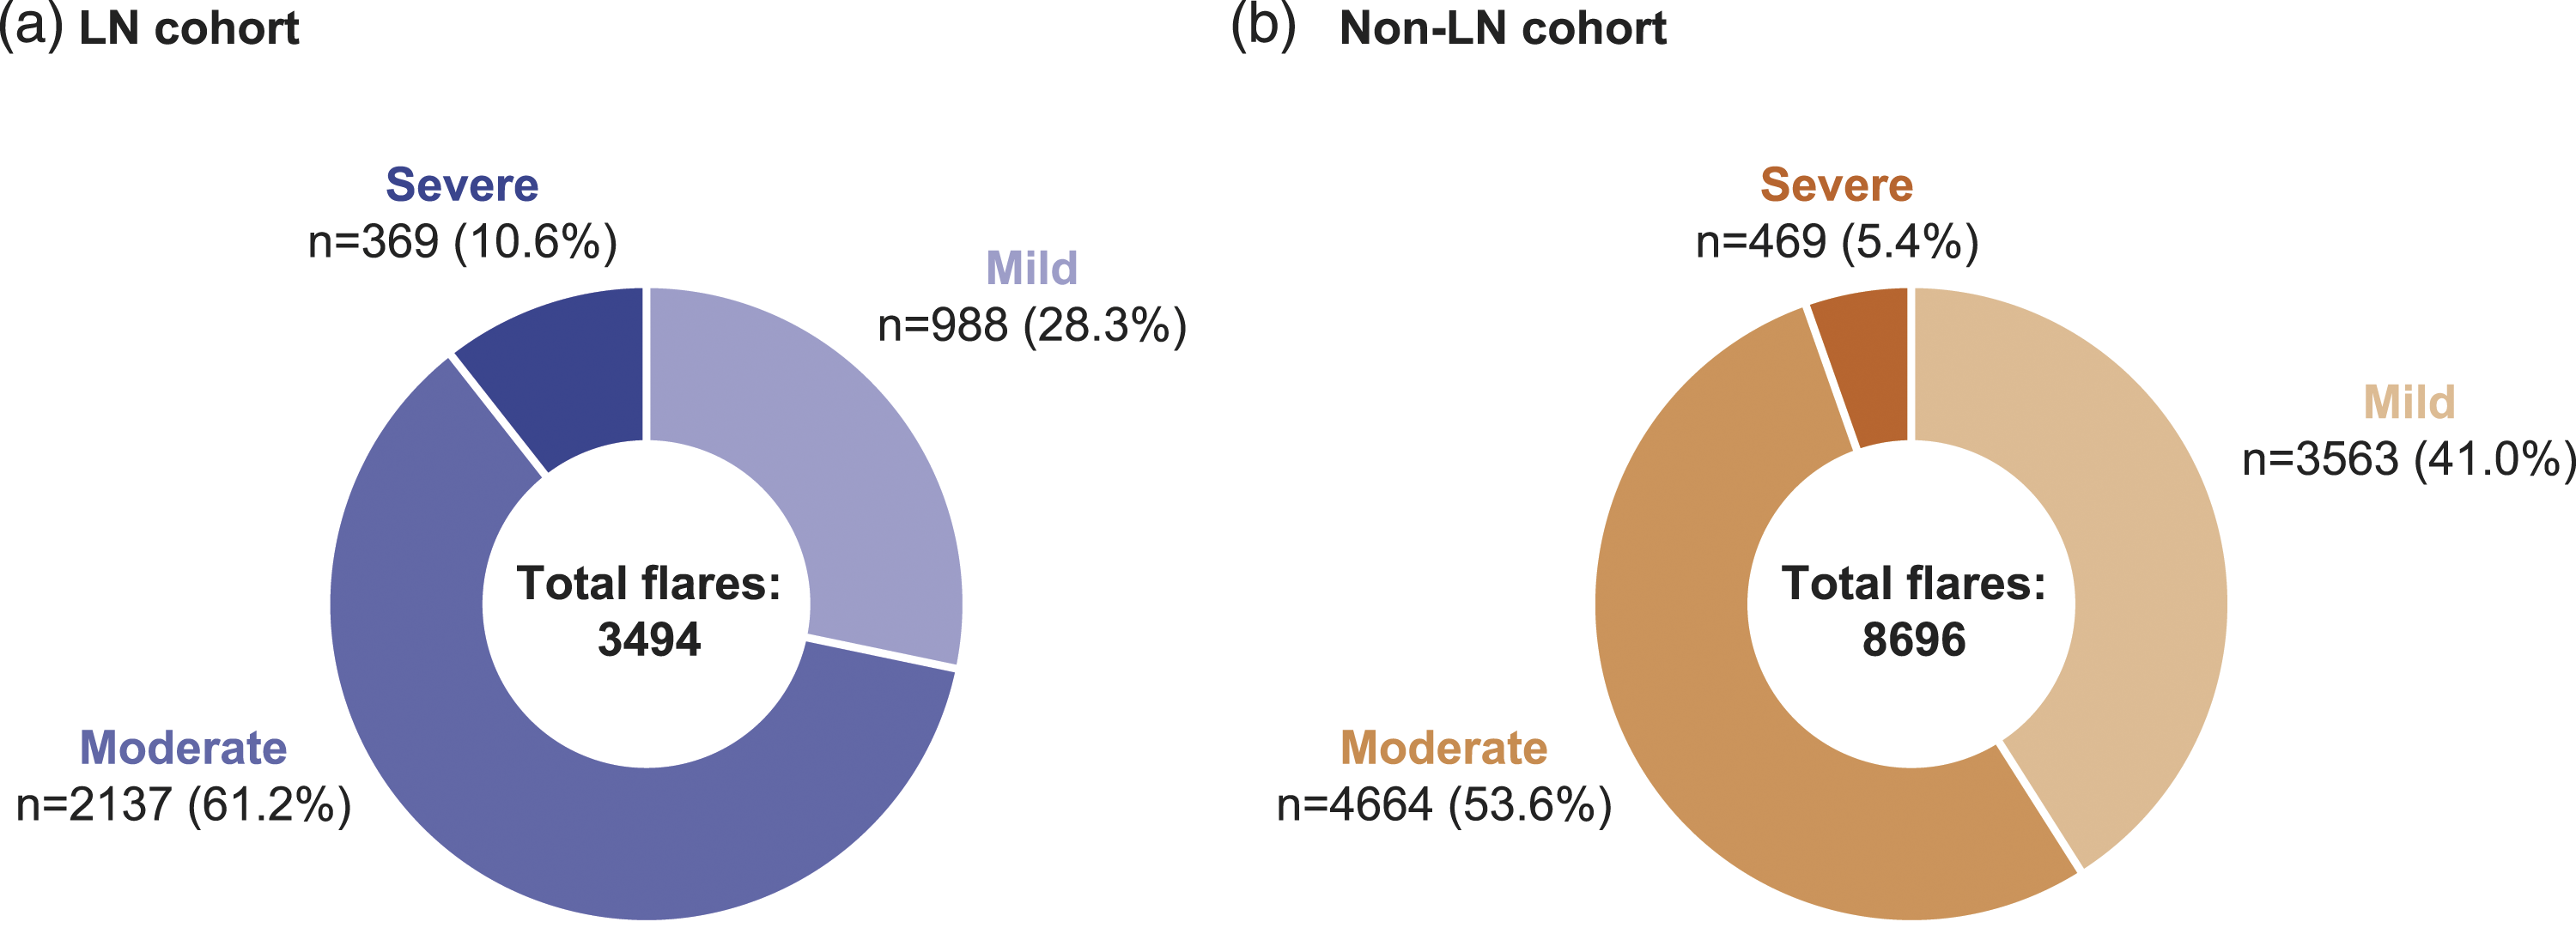
Mean number of SLE flares per patient during the 12-month follow-up period.
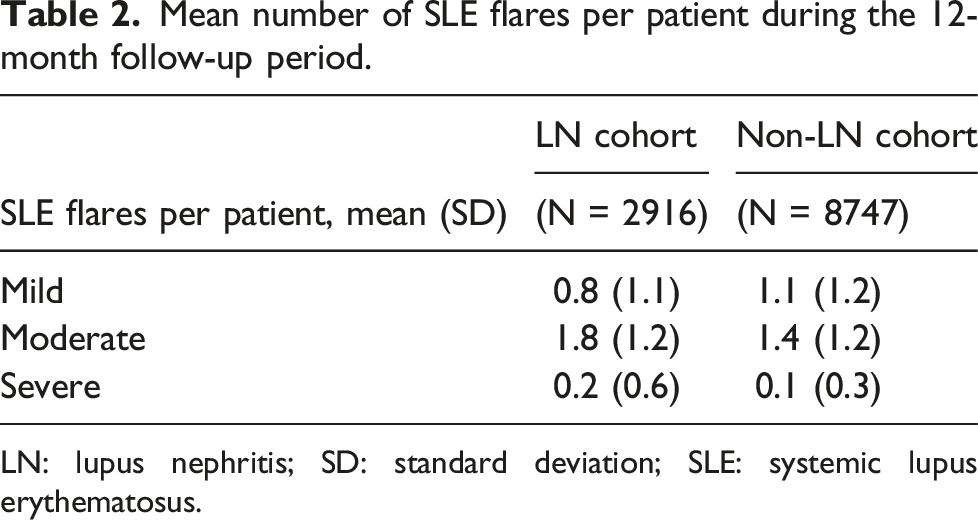
LN: lupus nephritis; SD: standard deviation; SLE: systemic lupus erythematosus.
Healthcare costs per flare
The mean total healthcare costs per SLE flare of any severity during the follow-up period were approximately 2.2-fold higher among patients in the LN cohort compared with those in the non-LN cohort (Figure 3). Mean healthcare costs per flare increased with severity; costs were approximately 1.7-fold, 1.8-fold, and 2.0-fold higher per mild, moderate, and severe flare, respectively, among patients in the LN cohort compared with the non-LN cohort (Figure 3). Specifically, the mean (SD) costs per flare among the LN cohort were $2753 (4640), $4561 (7156), and $29,148 (27,273) for mild, moderate, and severe flares, respectively; compared with $1606 (2710), $2587 (3720), and $14,829 (19,533), respectively, among the non-LN cohort (Figure 3). Mean (SD) healthcare costs (2019 US dollars) per SLE flare during the 12-month follow-up period in the LN and the non-LN cohorts. SD: standard deviation; SLE: systemic lupus erythematosus; LN: lupus nephritis.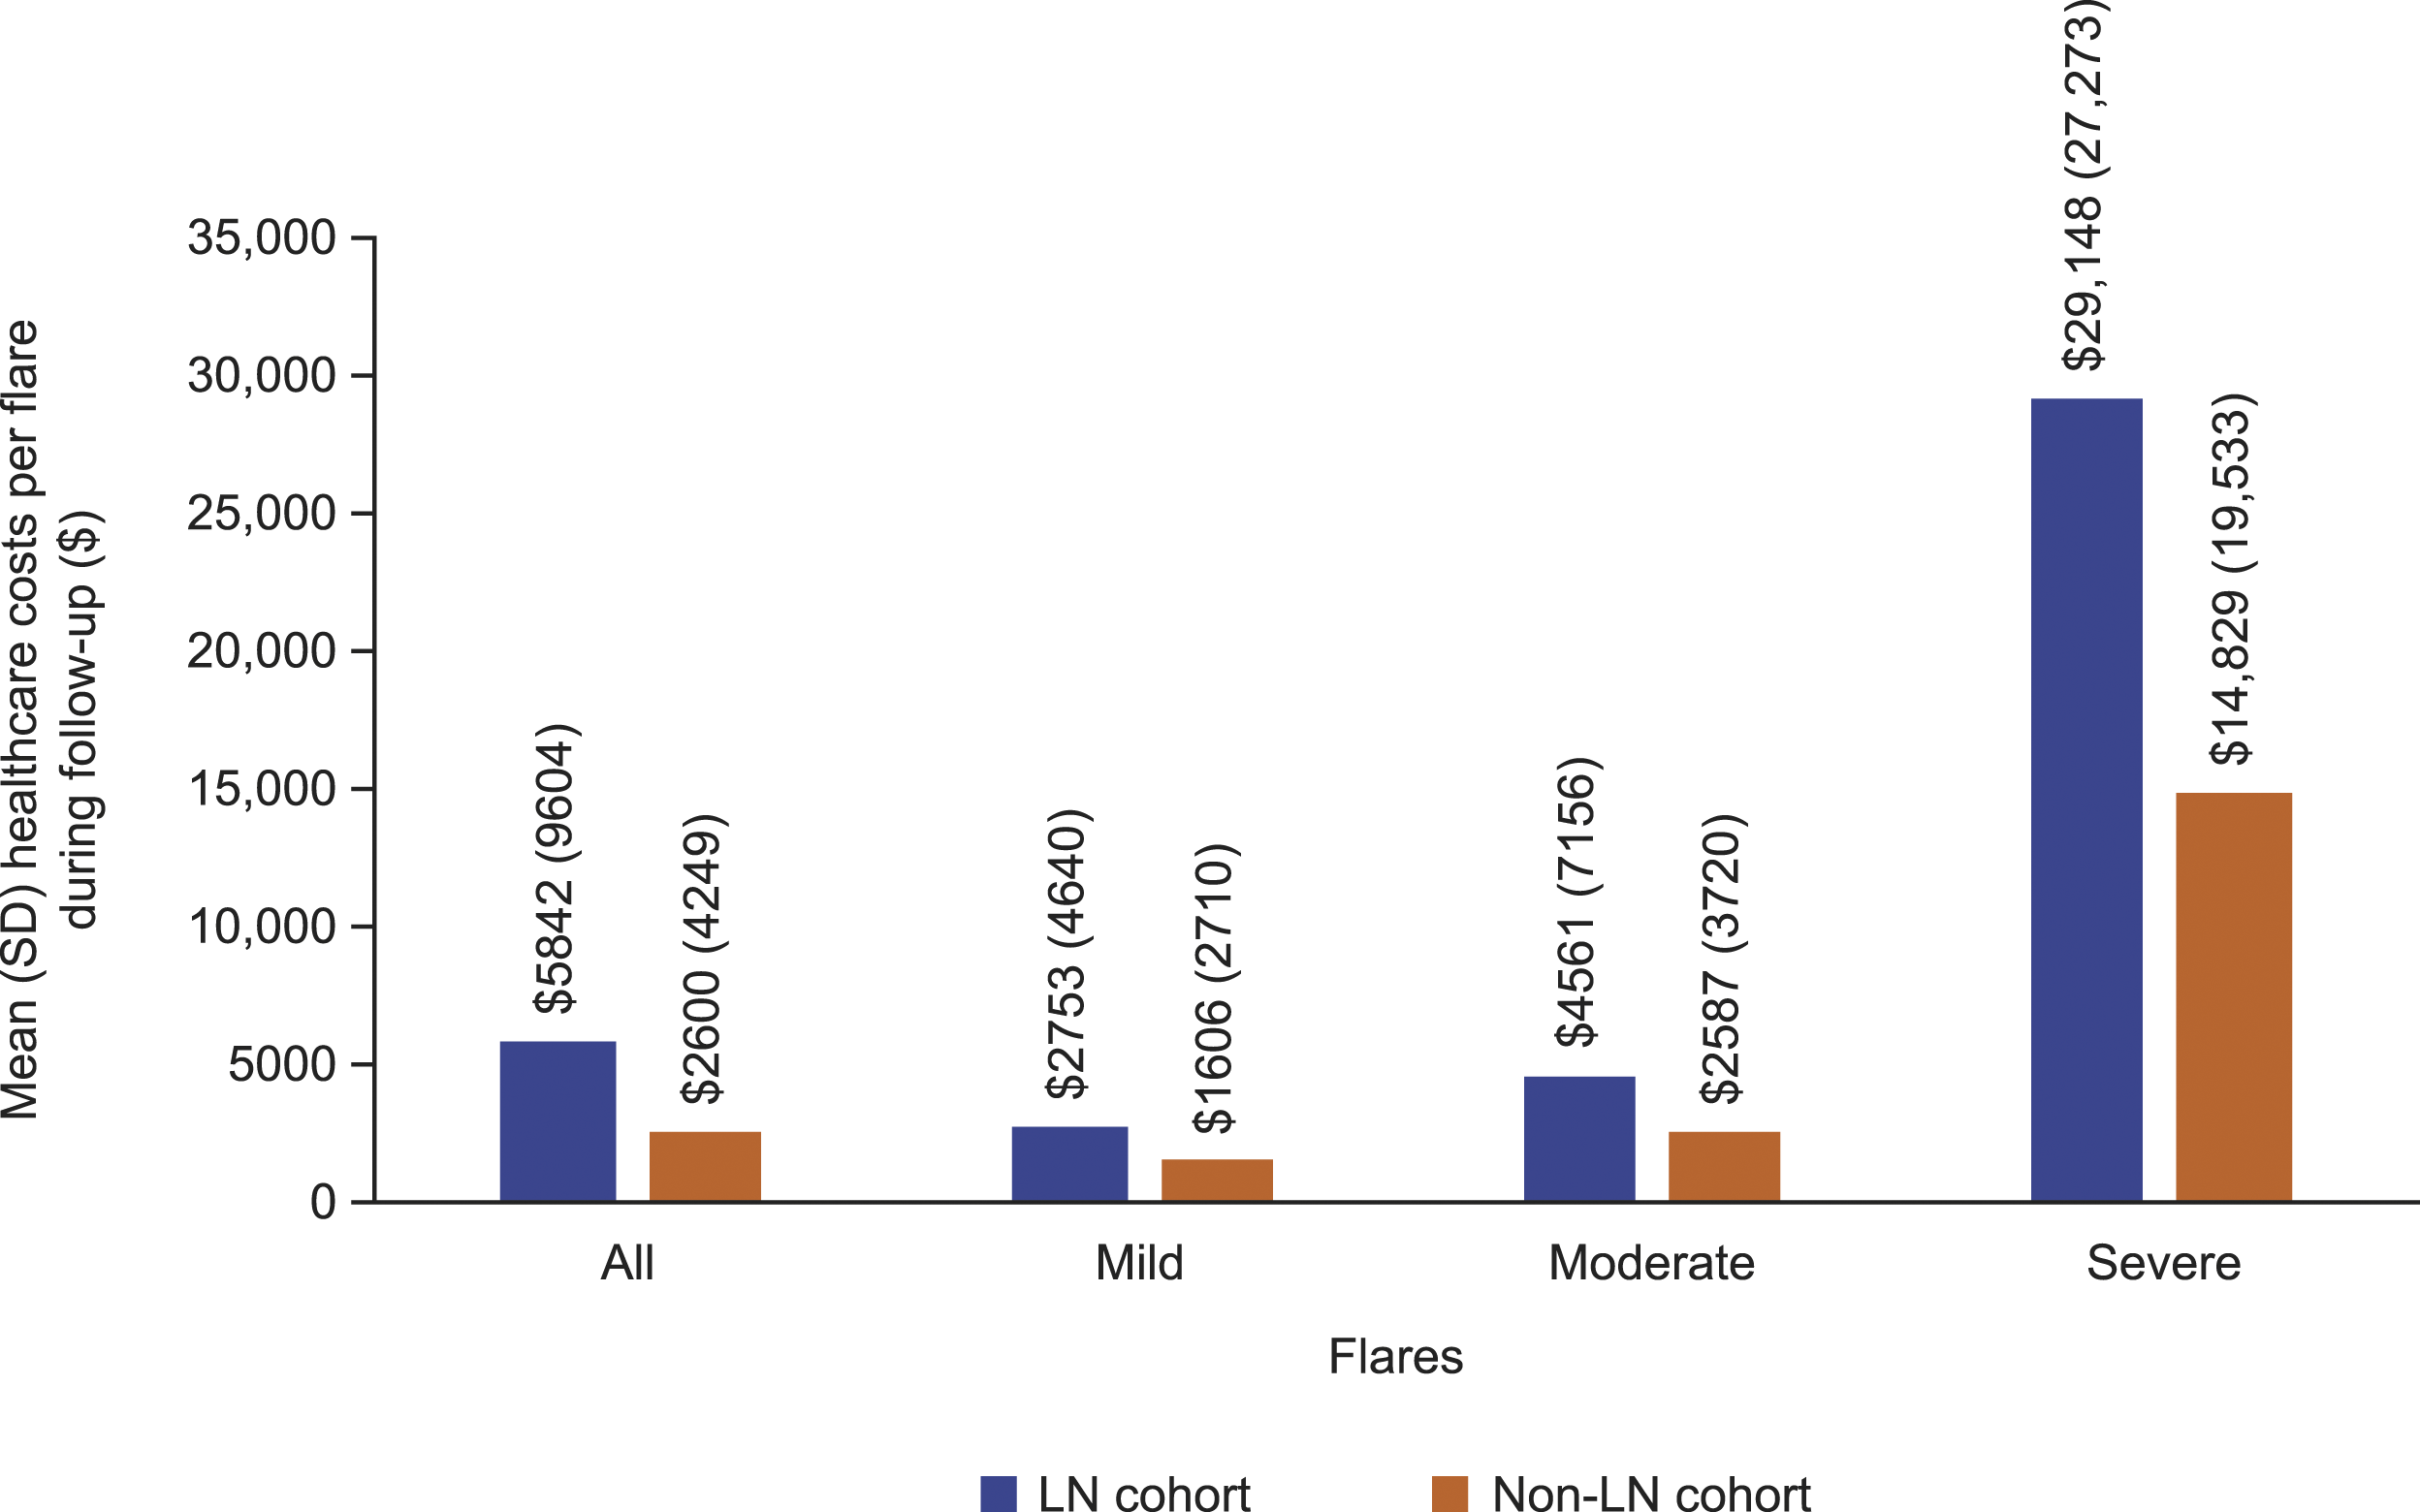
Discussion
Using a claims-based algorithm to define SLE flares and a large US-based patient cohort from diverse geographical regions, we have shown that patients with LN experience disease flares more frequently than patients without LN. Additionally, flares experienced by patients with LN were generally more severe and costly than for patients without LN.
The increased economic burden observed among patients with LN compared with those without LN in our study is consistent with reports elsewhere. A systematic literature review that aimed to determine the HCRU of patients with LN and the associated direct and indirect costs showed that patients with LN have substantially higher HCRU and economic burden compared with those with SLE. 3 Specifically, one study showed that mean 12-month follow-up direct medical costs were significantly higher among patients with LN ($30,652) compared with patients without LN ($12,029). 22 Another study showed that mean total annual costs among patients with LN were $39,284 compared with $33,369 for all patients with SLE, 23 while a further study showed that patients with LN incurred healthcare costs of $50,958 compared with $10,738 for a control group of patients with no evidence of SLE or renal impairment. 24 In addition, a longitudinal study showed that mean healthcare costs during the first year post-LN diagnosis were substantially higher compared with Years 2–5. 25
Two studies using administrative claims data have estimated the total mean annual healthcare cost per SLE flare to be approximately $1576 and $2163.13,17 Numerous studies have calculated costs per flare by severity and estimated that mild flares cost between $129–$1672 per flare; moderate flares cost $562–$4305 per flare; and severe flares cost between $2344 and $18,952 per flare.13,15–18 All of these studies utilized a similar claims-based algorithm to define flare severity as our study. The costs we have calculated per flare for patients without LN, and those with LN fall within these range of values. Similar to the present study, these studies have also shown that the costs per flare increase with severity.13,15–18
While our study did not investigate the effect of SLE flares on the ability of patients to work, two studies have shown that increased incidence of flares is associated with work productivity impairment. One study conducted in Malaysia used patient questionnaires to show that cumulative flare frequency and presence of LN were associated with impairment of the ability of patients with SLE to work. 26 A separate study conducted in the US showed that the incidence of flares was significantly associated with work absences, time impaired while at work, loss of productivity, and inability to work. 27 This further highlights the burden of SLE flares and LN.
SLE flares are associated with irreversible organ damage, which accumulates during prolonged periods of disease activity.4,6,28 Additionally, renal flares are associated with irreversible kidney damage with each subsequent renal flare reducing the lifespan of the kidney and progressing further toward ESKD.7,8 Therefore, the higher incidence of SLE flares observed among patients with LN could be associated with poorer patient outcomes.
Due to the negative short-, medium-, and long-term impacts on patient outcomes associated with SLE flares, treatment guidelines recommend reducing the risk of flares. 29 Currently, hydroxychloroquine is recommended by EULAR as a first-line treatment, as antimalarials have been shown to reduce flares.29,30 The disease-modifying treatment belimumab, a B-lymphocyte stimulator-specific inhibitor indicated for the treatment of patients with SLE,31–33 has consistently been shown to reduce both the incidence of flares and the risk of severe SLE flares in clinical trials.10,11,34,35 A pooled analysis of data from five double-blind, placebo-controlled studies showed that there was a 39% reduction in the risk of severe flares among belimumab-treated patients compared with placebo. 36 Furthermore, a post-hoc economic analysis of the BLISS-SC trial (NCT01484496) showed that the mean number of severe flares that occurred among patients treated with belimumab plus standard therapy was approximately 1.7-fold lower than those treated with placebo plus standard therapy, which in turn lowered the costs associated with flares. 37 This suggests that treatment strategies that reduce the incidence of severe flares may reduce economic burden.
This study had some limitations. The presence of diagnosis codes on a medical claim does not necessarily confirm the presence of a disease; diagnosis codes can be incorrectly coded or be included on claims as rule-out criteria rather than actual disease diagnosis. Claims data are not considered to be a comprehensive patient record. The results presented here may not be generalizable to the entire US population. For example, the present cohort is an insured population and findings may differ from an uninsured cohort, which may have more barriers to healthcare and therefore have more uncontrolled disease and greater risk of flare; no equity variables were included in this analysis. It is also important to note the underlying payer distribution among the SLE and LN cohorts in this study. In particular, the proportion of patients represented by Commercial versus Medicare Advantage was 21% and 80%, respectively, in the LN cohort and 44% and 56%, respectively, in the non-LN cohort. This observation is likely an explanation for the greater average age of the cohorts identified for this study (LN cohort, 65.0; non-LN cohort, 58.0) compared with patients with SLE from other claims-based studies (41.4–52.7).24,38–43 Bias may also have been introduced by using two sets of diagnoses codes (ICD-9 and ICD-10) to identify patients and flare severity. No specific SLE flare diagnosis codes exist, so this study relied on a claims-based algorithm to define the presence of flares. 13 Additionally, the cost of renal flares specifically was not included in this study, although they would likely be captured through use of the claims-based algorithm, especially among patients in the LN cohort. The proportion of patients using antimalarials in this study appears to be low, considering EULAR recommends the use of hydroxychloroquine for all patients with SLE. 29 Herein lies one of the many challenges to managing SLE: adherence. Specifically, adherence to guideline-recommended treatment and patient adherence to prescribed medications. In this study, use of antimalarials was only measured during the 12-month pre-index period, before the earliest diagnosis of SLE; however, the values reported here fall within the range reported by other claims-based studies (16.4%–78.6%).24,38–43 Yet, when examining data from a lupus center of excellence, for example, the Johns Hopkins Cohort, 95% of patients had used hydroxychloroquine between 2010 and 2019. 44 Finally, not all Medicare plans or patients are represented in the Optum Clinformatics database. Patients with ESKD may not have been captured as they would be eligible for Medicare; however, Medicare Advantage enrollees were included in this study.
In conclusion, this study has shown that SLE flares among patients with LN were more frequent, severe, and costly than among patients without LN. These data highlight the need for interventions that prevent or reduce flares among patients with SLE, with or without LN. Relevant stakeholders should be engaged to ensure that treatment options that reduce the risk of flares are accessible to patients with LN.
Supplemental Material
Supplemental Material - The cost of flares among patients with systemic lupus erythematosus with and without lupus nephritis in the United States
Supplemental Material for The cost of flares among patients with systemic lupus erythematosus with and without lupus nephritis in the United States by Christopher F Bell, Shirley P Huang, Anissa Cyhaniuk, and Carlyne M Averell in Lupus around the World.
Footnotes
Acknowledgements
Editorial support (in the form of writing assistance, including development of the initial draft based on author direction, assembling tables and figures, collating authors’ comments, grammatical editing, and referencing) was provided by Robert Bloxham, PhD, of Fishawack Indicia Ltd., part of Fishawack Health, and was funded by GSK. The manuscript was submitted by Fishawack Indicia Ltd. on behalf of the authors. The authors approved all statements and declarations.
Declaration of conflicting interests
The authors declared the following potential conflicts of interest with respect to the research, authorship, and/or publication of this article: CFB is an employee of GSK and holds stocks and shares in the company. SPH is a former postdoctoral fellow at GSK and held stocks and shares in the company. AC was an employee of STATinMed at the time of the study, who received funding from GSK to conduct the study. CMA was an employee of GSK at the time the study was conducted/completed and holds stocks/shares in the company.
Funding
The authors disclosed receipt of the following financial support for the research, authorship, and/or publication of this article: This study (GSK Study 214104) was funded by GSK. GSK was involved in the design of the study, and the analysis and interpretation of the data.
Supplemental Material
Supplemental material for this article is available online.
References
Supplementary Material
Please find the following supplemental material available below.
For Open Access articles published under a Creative Commons License, all supplemental material carries the same license as the article it is associated with.
For non-Open Access articles published, all supplemental material carries a non-exclusive license, and permission requests for re-use of supplemental material or any part of supplemental material shall be sent directly to the copyright owner as specified in the copyright notice associated with the article.