
Abstract
This paper explores the exact relationship between the development level of American public libraries and the output of science and engineering publications. We use the sample data from 1996 to 2019 to build a time series model, and analyze the long-term equilibrium, short-term correlation and Granger causality relationships between them with stationarity test, cointegration test, Granger causality test, and impulse response function. The results suggest that there are a long-term equilibrium relationship and a bidirectional Granger causality between them. The two interact and promote each other. The impact of the development level of American public libraries on the output of science and engineering publications can be seen in fewer time periods, while the impact of the output of science and engineering publications on the development level of American public libraries take more time periods to show.
Keywords
Introduction
With the development of science and technology and the progress of society, public libraries are playing an increasingly important role. People use library resources to create new knowledge through learning, independent thinking and scientific experiments, etc., and produce scientific papers and patents and other products. These add new knowledge content for library resources. On the other hand, the output of these scientific researches also provides an impetus for the progress of society. Science and engineering publications are the carriers that reflect people’s scientific and technological activities, provide a bridge for scientific and technological workers to communicate, and are also the link for the transformation of science and technology into productive forces. The primary method of disseminating research findings is through publication of conference proceedings and peer-reviewed journal articles (i.e. publication output). Publication output reached 2.9 million articles in 2020, based on data from the Scopus database of S&E publications (White, 2021). Data on publication output indicate an increase in global research activity, a growth in the involvement and scientific capabilities of middle-income countries, and an internationally connected research ecosystem (White, 2021). Since 2000, 215 of the 216 Nobel Laureates in Science and Economics have published their research in Elsevier’s journals (Elsevier, 2021). Several examples are given below. Goodenough (2007, 2015), Goodenough and Kim (2011), (Goodenough and Huang, 2007), Whittingham (1979, 2000), Whittingham et al. (1995), Whittingham and Gamble (1975), and Yoshino (2014) were jointly awarded the 2019 Nobel Prize in Chemistry for “the development of lithium-ion batteries.” Lithium-ion batteries are found everywhere, from handheld devices to electric vehicles to solar power plants. James P. Allison and Tasuku Honjo shared the 2018 Nobel Prize in Physiology or Medicine “for their discovery of cancer therapy by inhibition of negative immune regulation” (Allison, 2015; Egen and Allison, 2002; Iwasato et al., 1990; Nishimura and Honjo, 2001; Okazaki and Honjo, 2005, 2006; Shimizu and Honjo, 1984). The therapy, now called “immune checkpoint therapy,” has fundamentally changed the prognosis and survival of patients with certain types of cancer. The Sveriges Riksbank Prize in Economic Sciences in Memory of Alfred Nobel 2019 was awarded jointly to Banerjee (2004), Banerjee et al. (2018), Chamon and Kremer (2009), Duflo (2004), and Duflo et al. (2015) “for their experimental approach to alleviating global poverty” . The research has a positive impact on policy-making to alleviate poverty. These scientific achievements have had a great impact on the world. It can be said that the improvement of people’s living standards is increasingly dependent on scientific research and technological innovation. It was estimated that 116,462, 216,657, and 764,553 papers were cited in government, news, and patent documents, respectively between 2005 and 2014 (Yin et al., 2021). This suggests that scientific publications are not merely an exercise of ivory tower academics but serve as a key linkage enabling public uses of scientific output. The output of science and engineering publications is the products of scientific and technological research activities in which people use resources of public libraries to create new knowledge. Naturally, it is believed that there is a certain connection between the development level of public libraries and the output of S&E publications. Their exact relationship is unclear and requires in-depth discussion and empirical study.
Literature review
Public libraries, as institutions meeting reading of users, play an important role in promoting the development at various levels of society such as community life (Lipkova et al., 2019), agricultural production (Ugwoke, 2013), innovation in science and technology (Cai, 2013), economic growth (Barron et al., 2005; Gao and Pan, 2013) and so on. Librarians and information workers offered agricultural information to farmers in Nigeria to promote boosting food and cash crops production (Ugwoke, 2013). Barron et al. (2005) conducted a study on the impact of public libraries in South Carolina on the local economy, and concluded that for every $1 spent by state and local government on SC public libraries, the return on investment was $2.86. Morris et al. (2006) studied economic sense of audiovisual materials in UK public libraries. A cost benefit of 1:1.34 using the PVB (present value benefits) based on maximum loan charges was found, meaning that the UK got £1.34 direct benefit from every £1.00 spent on the audiovisual service. Linhartová and Stejskal (2017) analyzed data from 37 public libraries in the Czech Republic and found that the public libraries’ benefit/cost ratio was 5.86%–6.17%, which meant that every $1.00 spent on the Czech public libraries, provided on average $6.00 benefit value to taxpayers. Analyzing data from 1979 to 2008 in China, Gao and Pan (2013) found that there was apparent two-way causality between the development of public libraries and economic growth. Cai (2013) verified that public libraries were correlative with scientific and technological innovation through correlation analysis and concluded that if the total expenditure of public libraries increased by 1%, then the growth rate of transaction volume in national technology market would be 1.34%.
Inglesi-Lotz et al. (2014) investigated the relationship between knowledge (research output) and economic growth in US over 1981–2011. Using a two-state regime switching vector smooth autoregressive model, the authors found that there was a unidirectional Granger causality from research output to GDP in the sample. Using annual data for the number of nation publications in SCI and SSCI indexed journals and annual GDP data for the period 1981–2007, Lee et al. (2011) examined the correlation between GDP and research output for 24 countries and a region. The empirical findings suggested that there was a mutual causality between research output and economic growth in Asia, whereas in Western countries the causality was much less clear. Solarin and Yen (2016) examined the effect of research output on economic growth in 169 countries for the period, 1996–2013. The results indicated that research output had positive impact on economic growth, irrespective of whether the sample was for developing or developed countries. Using the extended Cobb-Douglas model with capital per worker and the quantity of scientific and technical journal articles (research publications) per worker, Kumar et al. (2016) explored the link between research articles and economic growth in China and US over the sample period, 1981–2012. The authors found that there was a bidirectional causality between research publications per worker and output per worker for China, and there was a unidirectional causality from output per worker to research publications per worker for USA.
In the existing literature, it has not been found to study the relationship between the development level of American public libraries and the output of S&E publications with empirical analysis. This paper builds a time series model to investigate the relationship between them. Introducing stationarity test, cointegration test, Granger causality test, and impulse response function examines the relationship between them. Compared to Inglesi-Lotz et al. (2014), Gao and Pan (2013), Lee et al. (2011), and Kumar et al. (2016), there are the following differences. First, the research subjects are different. Second, modeling is more difficult due to the complexity of a study object in this paper. Since there are many indexes for evaluating the development level of public libraries, and there are cross-coupling between these indexes, how to effectively extract a comprehensive index that truly reflects their development level is a difficult problem for us, whereas they are not like that, and their objects themselves come with an index, respectively. Third, unlike them, we also use impulse response function to analyze the relationship between variables.
Model construction and data analysis
Construction of evaluation index system and data sources
A time series model is divided into an explanatory variable and an explained variable. Suppose that the output of S&E publications is an explained variable, and the development level of public libraries in the United States an explanatory variable. The data of evaluation indexes of the output of S&E publications are derived from “Publications Output: U.S. Trends and International Comparisons” (White, 2021) published by the National Center for Science and Engineering Statistics (NCSES). The time span of the indexes is 1996–2019. Under the direction of the National Science Council, the data are compiled by NCSES, which is a principal federal statistical agency subordinate to the National Science Foundation (NSF) and Bureau of Social, Behavioral, and Economic Sciences. Index reports were extensively reviewed by internal and external subject matter experts, federal agencies, members of the National Science Council, and NCSES statistical reviewers to ensure data accuracy. A more scientific and accurate score counting method is adopted, that is, the publication counts are allocated according to the proportion of co-authors for each country or institution mentioned in the articles.
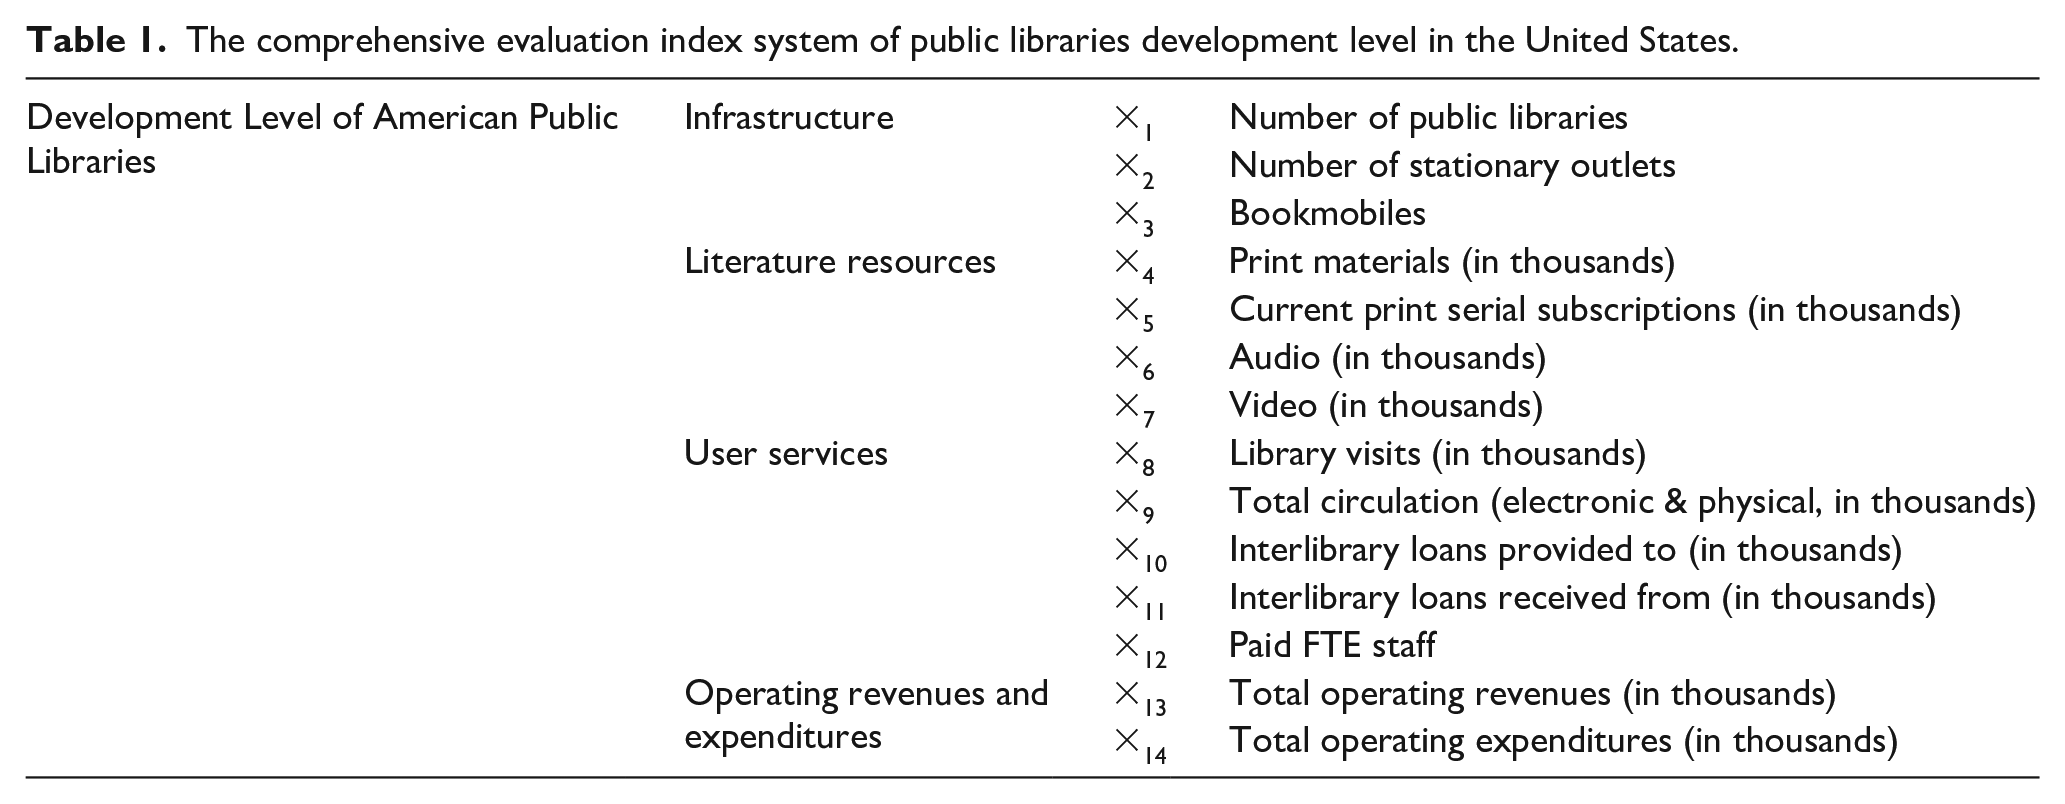
For the construction of the evaluation index system of the development level of American public libraries, considering that the factors of the development of American public libraries are relatively complex, it is difficult to completely reflect their comprehensive development by only selecting a single index. According to relevant theories, the index system is divided into four dimensions: infrastructure, literature resources, user services, operating revenues and expenditures. Then the four dimensions are decomposed into 14 secondary indexes, as shown in Table 1, in an effort to completely reflect the development level of public libraries in the United States. The data of evaluation indexes of the development level of American public libraries come from the Public Libraries Survey (PLS) published annually by the Institute of Museum and Library Services (IMLS, 2021). The data are collected from approximately 9000 public libraries with approximately 17,000 individual public library outlets in the 50 states, the District of Columbia, and outlying territories. To ensure the consistency of the data time span, the time span was also chosen as 1996–2019. In addition, in order to eliminate the impact of price changes, the GDP deflator index with 1996 as the base period was used to deflate the above-mentioned indexes of the design amount. The deflator index comes from the data released by the Bureau of Economic Analysis of the US Department of Commerce.
The comprehensive evaluation index system of public libraries development level in the United States.
Analysis of development level indexes of public libraries in the United States
Since there are many indexes to measure the development level of public libraries, if all are copied without any treatment, it is not suitable for subsequent analysis and testing. In addition, there may be multicollinearity problems between variables, which cause the information reflected in the index data to overlap each other, and obscure the true characteristics of the things to be reflected. Therefore, using validity analysis and factor analysis, the dimensionality of the indexes can be reduced as much as possible without losing information, that is, 14 indexes representing the development level of public libraries are reflected through a few indexes.
Standardization
By sorting out the data of indexes, it is found that values between them vary greatly. If the original data are directly used for analysis, the role of the index with higher value in the comprehensive analysis will be highlighted, the effect of the index with lower value will be relatively weakened. For this, it is necessary to standardize the original data. In this paper,
The formula for
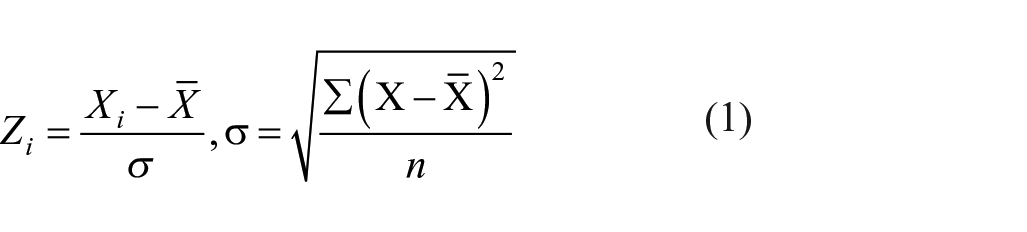
where
Validity analysis
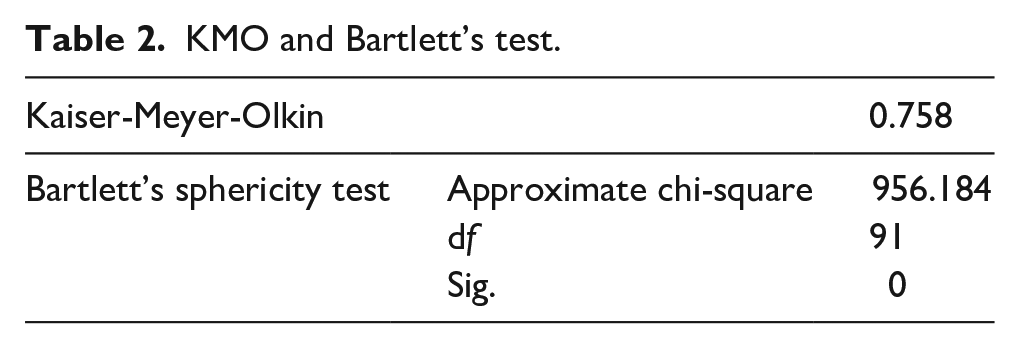
Validity analysis is used to examine whether the design of data of indexes is reasonable by KMO and Bartlett sphericity test. After testing, the KMO value is 0.758 > 0.7, and the observation value of statistic of Bartlett sphericity test is 956.184, and the corresponding probability ρ value is 0 < 0.01. The test results are shown in Table 2. It indicates that the 14 index variables are not completely independent, have a strong correlation, and are suitable for factor analysis.
KMO and Bartlett’s test.
Factor analysis
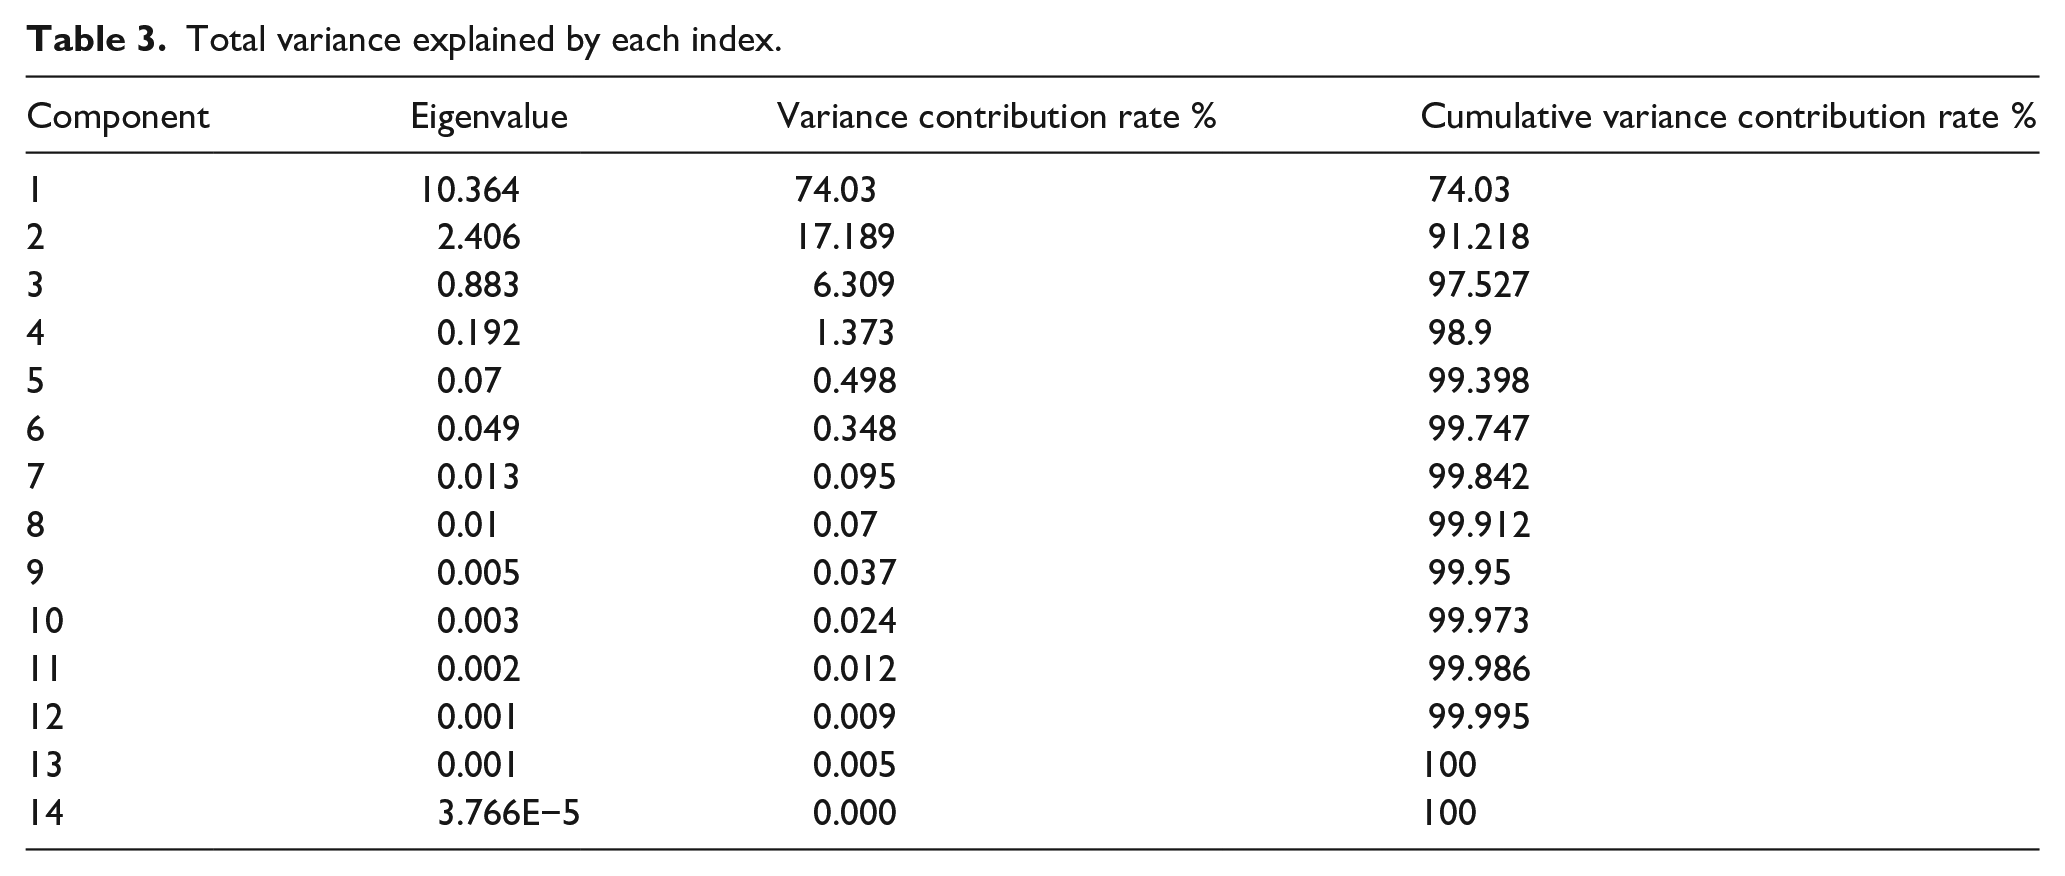
The validity analysis implies that the design of data of indexes is reasonable, and now it is verified by factor analysis. Table 3 shows the results of factor contribution rates. The eigenvalues of the first two factors are greater than 1, and the explained cumulative variance contribution rate is 91.218%, which can reflect the overall level of the development of public libraries in the United States. Hence, it is appropriate to extract the first two components as common factors.
Total variance explained by each index.
In order to better explain the extracted common factors, the maximum variance method is used to perform orthogonal rotation for the factors. The variance contribution rates of the two common factors after the rotation are 68.148% and 23.07%, respectively. It can be found from the component matrix after the rotation that the common factor F1 has a strong correlation with literature resources, user services, operating revenues and expenditures. It can be interpreted as a subjective factor in the development of public libraries. The common factor F2 has a strong correlation with infrastructure, and can be interpreted as an objective factor in the development of public libraries. The contribution rates show that the current development of public libraries in the United States is mainly pushed by the subjective factor, and the objective factor cannot be a stable factor to promote the development of public libraries due to its large fluctuation.
Comprehensive evaluation score for the development of public libraries in the United States
On the basis of extracting the two common factors, the component coefficient matrix is obtained, and the estimated values of the common factors are calculated. The calculation formula is:
where,
After the values of the two common factors
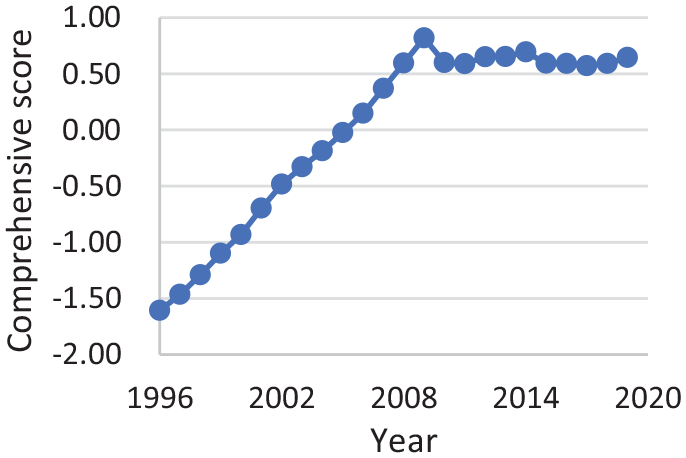
Comprehensive scores of the development level of public libraries in the United States.
It can be seen from Figure 1 that for the period 1996–2009, the comprehensive evaluation scores of the development of public libraries in the United States showed an increasing trend year by year. In 2010, there was a relatively obvious decline. After that, although there were occasional fluctuations, the whole trend was relatively stable. In the last few years, there was a slow upward trend again. By consulting relevant reports and data, it is found that in 2010, compared with 2009, operating revenues and expenditures, service hours and staffing decreased. Operating revenues and expenditures fell for the first time since 1996. Meanwhile, the number of visits to libraries declined due to the increase in online services. In addition, budget cuts led to a reduction in literature resources. Affected by the economic recession, the staff of public libraries decreased by 3.9%. These comprehensive factors had a great impact on the development of public libraries. On the whole, the development of public libraries in the United States has shown an upward trend since 1996.
Model construction
According to the above selected explained variable and explanatory variable, the time series model of S&E publications output (Y) and the development level of public libraries in the United States (X) is constructed as follows:
where
Whether the model is correct depends on the stability of the time series to a large extent. If the time series variables are non-stationary, spurious regression will occur. In this paper, stationarity test, cointegration test, Granger causality test, and impulse response function are used to investigate the possible relationships between variables.
Specific steps are as follows. First, the Augmented Dick-Fuller (ADF) unit root test (Dickey and Fuller, 1979) is performed on the time series data to examine the stationarity of the variables. If the variables are same-order difference stationary series, the Engle-Granger two-step procedure (E-G) for cointegration is used to test the unit root of the residuals of the regression equation to investigate whether there is a long-term cointegration relationship between the variables. The Granger causality test is used to examine whether there is a causal effect between the variables. Finally, we investigate the dynamic change relationship between variables with the impulse response function to further explore the influence between the development level of public library and the output S&E publications.
Tests and analyses
Stationarity test
Figure 2 shows a publishing trend of S&E publications. Although there are occasional fluctuations in the number of publications, the overall trend is on the rise. It is determined that it is not a stationary time series. It can be judged from Figure 1 that the development level of American public libraries is not a standard stationary time series, either. To avoid spurious regressions in the regression equation, the stationarity of the two time series are tested by the ADF unit root test. According to modified Schwarz information criterion, Akaike info criterion (AIC), and Hannan-Quinn criterion (HQ), lag orders are determined, and the test results are shown in Table 4.
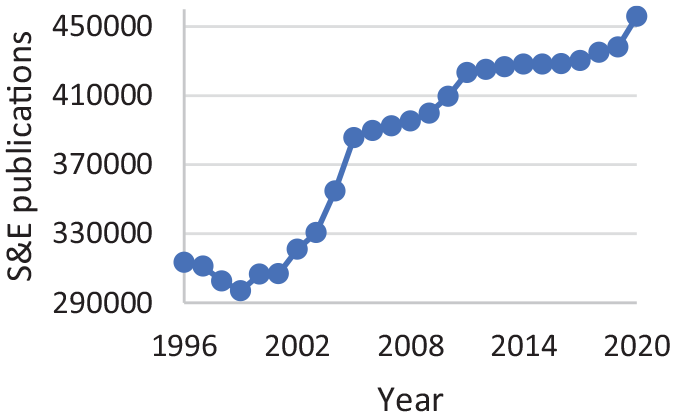
Publishing trend of S&E publications.
Stationarity test.
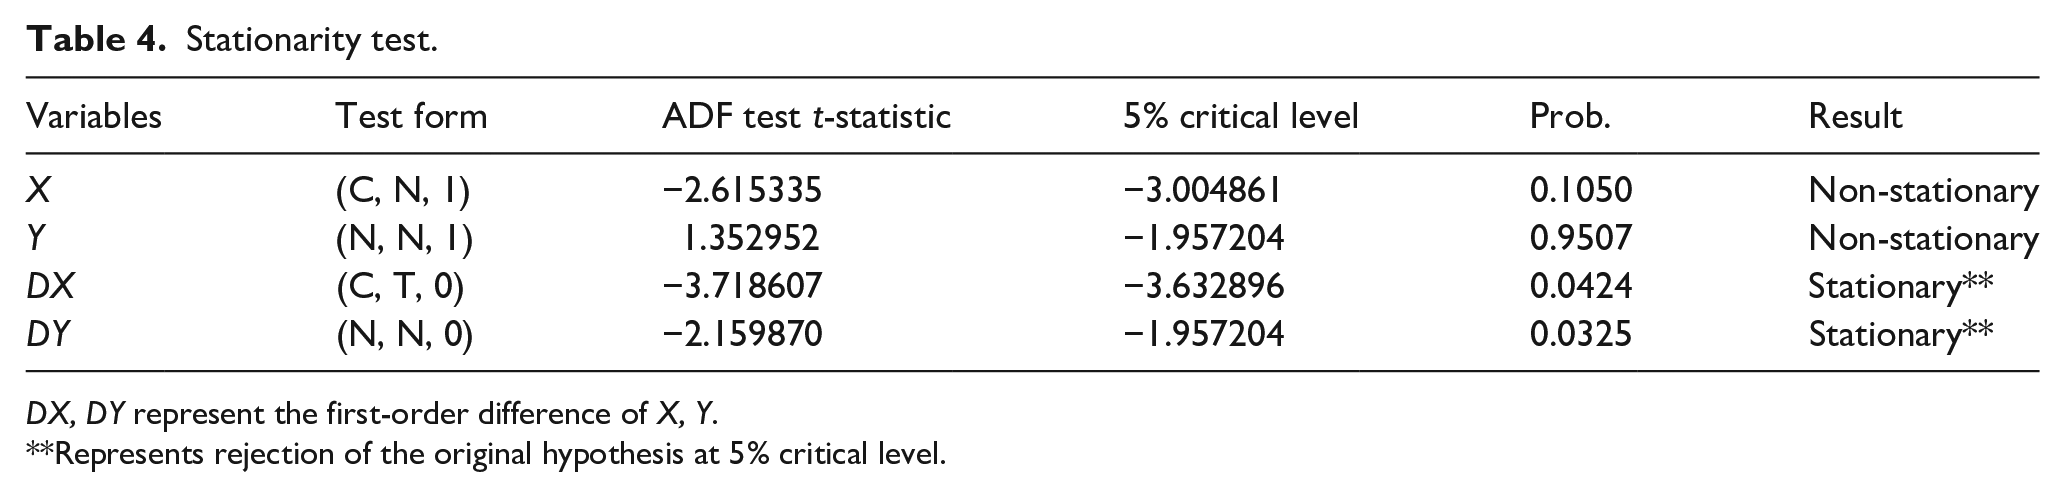
DX, DY represent the first-order difference of X, Y.
Represents rejection of the original hypothesis at 5% critical level.
The ADF t-statistics of the two variables X and Y are both greater than test values at 5% critical level, so both of them are non-stationary time sequences. We make first-order difference for X and Y respectively to obtain DX and DY, both of which have t-statistics less than test values at 5% critical level. Thus, the original hypothesis is rejected. DX and DY are stationary time series. Both variables X and Y are first-order difference stationary series, which satisfy the condition of cointegration test.
Cointegration test
For two time series that are non-stationary but same-order difference stationary series, their linear combination may be stationary, the Engle-Granger (E-G) two-step procedure for cointegration is used to determine whether there is a long-term stable equilibrium relationship between the two series. Since X and Y are both first-order difference stationary series, the ordinary least squares (OLS) method is used to regress X and Y. The regression results are as follows:
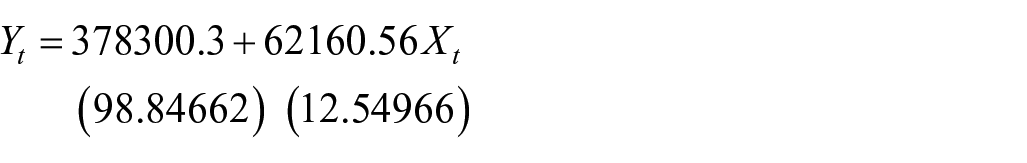
where, the numbers in parentheses are the values of the corresponding t-statistics,
The goodness of fit
According to the Durbin Watson (
In order to overcome its autocorrelation, on the basis of the regression model, the Conditional Least Squares (CLS) and Cochrane-Orcutt iterative method are used for correction, and the results are as follows:
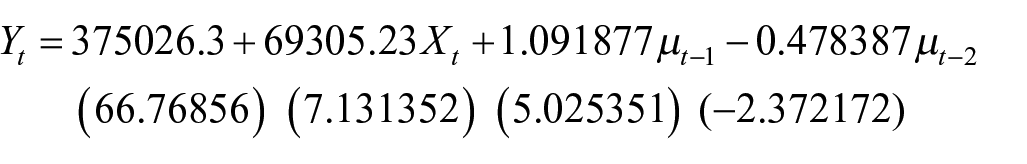
The goodness of fit of the revised model is increased to 0.97, indicating that the fitting degree of the model to the sample data reaches 97%. After looking up the table, we obtain
We make the stationarity test for the residual series of the revised model and the results are shown in Table 5. It should be noted that the ADF test here is for the residual term calculated from the regression equation. It is needed to calculate the corresponding critical level. The formula is as follows:
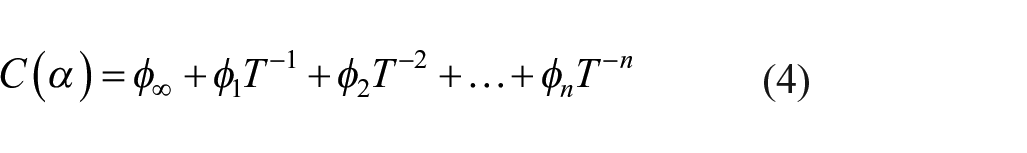
where
Stationarity test for residual.
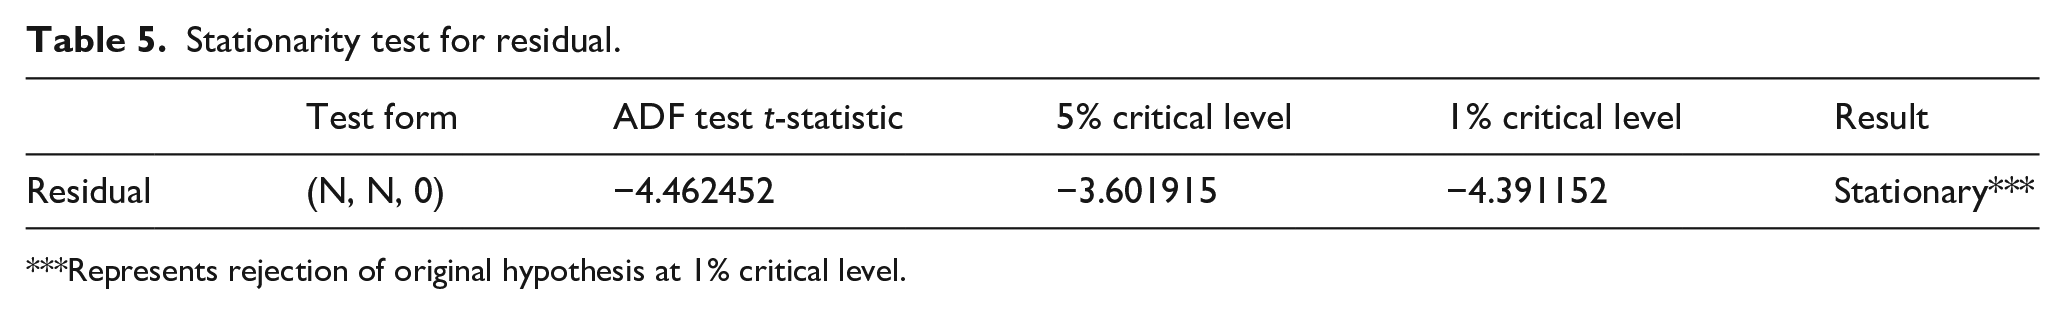
Represents rejection of original hypothesis at 1% critical level.
Granger causality test
From the cointegration test, it can be found that the development level of American public libraries has a positive impact on the output of S&E publications. However, although the cointegration test shows that there is a long-term stable relationship between them, it is only a numerical conclusion, and the causal relationship between them needs to be further determined. This paper constructs a Granger causality test to investigate the sequence of influence between variables. The principle of the test is that if a change in X causes a change in Y, then the change in X should occur before the change in Y. Table 6 shows the results of the Granger causality test.
Granger causality test.
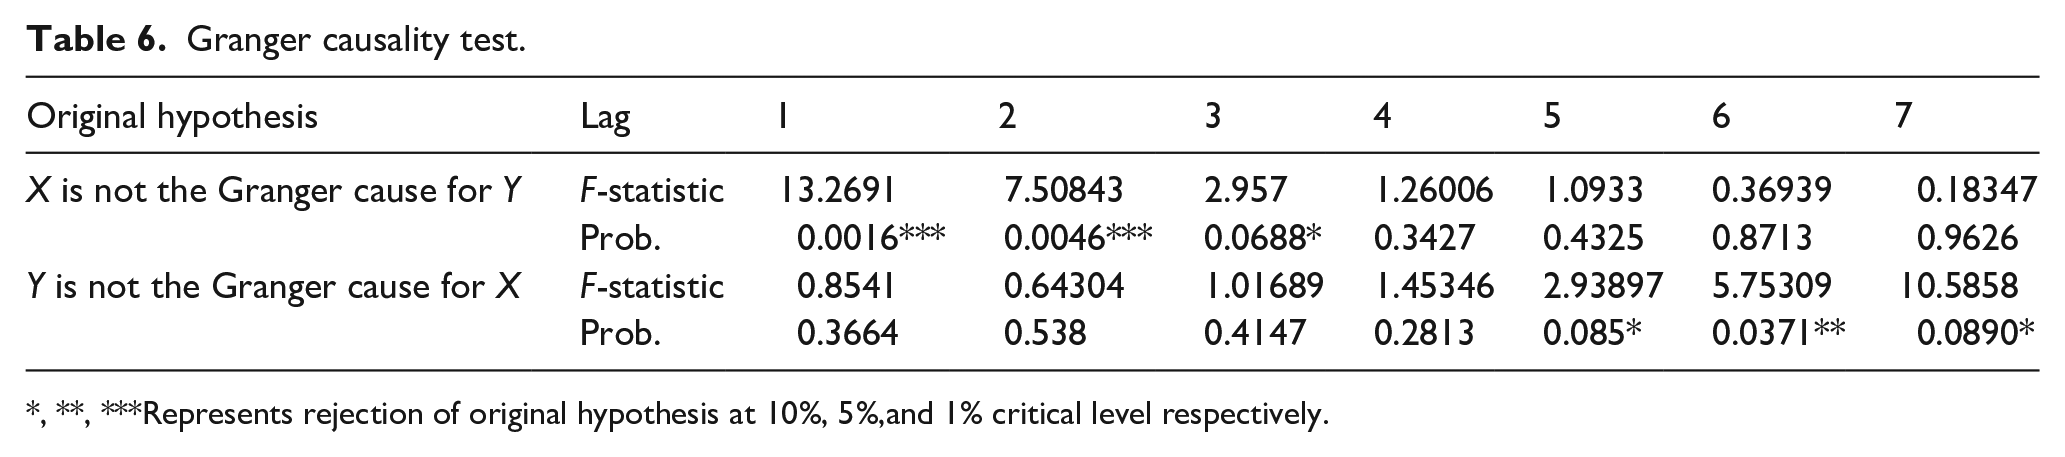
, **, ***Represents rejection of original hypothesis at 10%, 5%,and 1% critical level respectively.
Table 6 shows that there is a one-way Granger causality from the development level of American public libraries (X) to the output of S&E publications (Y) in lag period 1, lag period 2, and lag period 3. It indicates that the improvement of the development level of American public libraries can promote the output of S&E publications within 1–3 years of lag. That is to say, American public libraries can comprehensively promote the output of S&E publications through the development of the four aspects in infrastructure, literature resources, user services, operating revenues and expenditures. The improvement of the development level of public libraries implies that the libraries better meet the needs of users, prompt more people to pay attention to books, periodicals, magazines, newspapers, electronic publications, etc., in the meanwhile, improve the cultural level of users, and better help users for scientific research and paper writing, thus affecting the output of the S&E publications. In lag period 5, lag period 6, and lag period 7, there is a one-way Granger causality from the output of S&E publications to the development level of American public libraries. It implies that the output of S&E publications can affect the development level of American public libraries within 5–7 years of lag. It shows that it takes a relative long time for the output of S&E publications to promote the development of public libraries. The causal relationship does not exist in lag periods 1–4.
Impulse response function analysis
Since X and Y are first-order difference stationary series, the VAR model can be used to examine the influence of a shock of random disturbance term on them. In order to better reflect the dynamic characteristics of the model, it is necessary to determine the optimal lag orders of the model before building the VAR model. According to the five information criteria, we consider the lag orders 0–3 of the model to obtain that the optimal lag orders of the model are 2, that is VAR (2). The results are shown in Table 7.
Lag selection of VAR model.
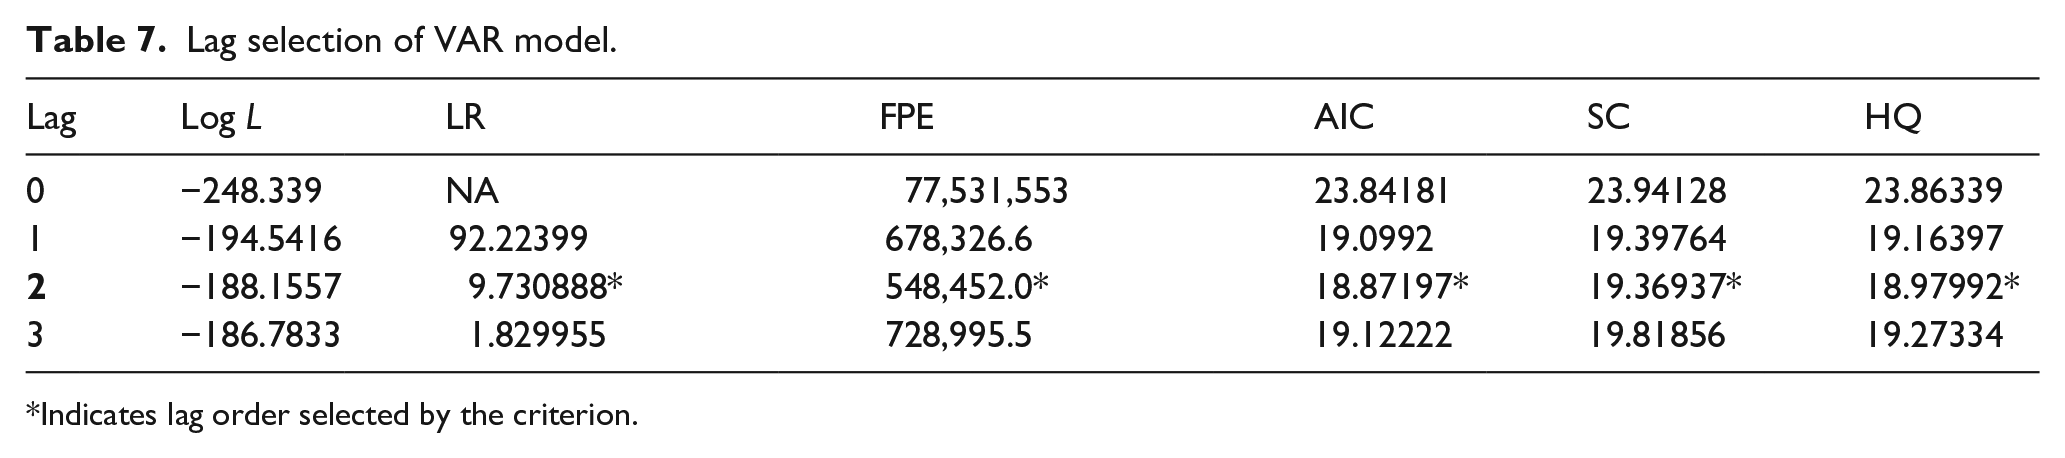
Indicates lag order selected by the criterion.
The stationarity of the VAR model is tested and the results are shown in Figure 3. The reciprocals of the eigenvalues of the VAR model are all located within the unit circle, indicating that the established model is stable. Considering that the VAR model is a non-theoretical model, its independent variable coefficients have little practical significance and its model is not explained in detail here. Instead, an impulse response function is used to analyze the relationship between variables. In order to fully show the impulse responses for the development level of American public libraries and the output of S&E publications, this paper make 30-periods impulse response function graphs (see Figures 4 and 5). The horizontal axis is the time period, and the vertical axis is the response of the variable to a shock.
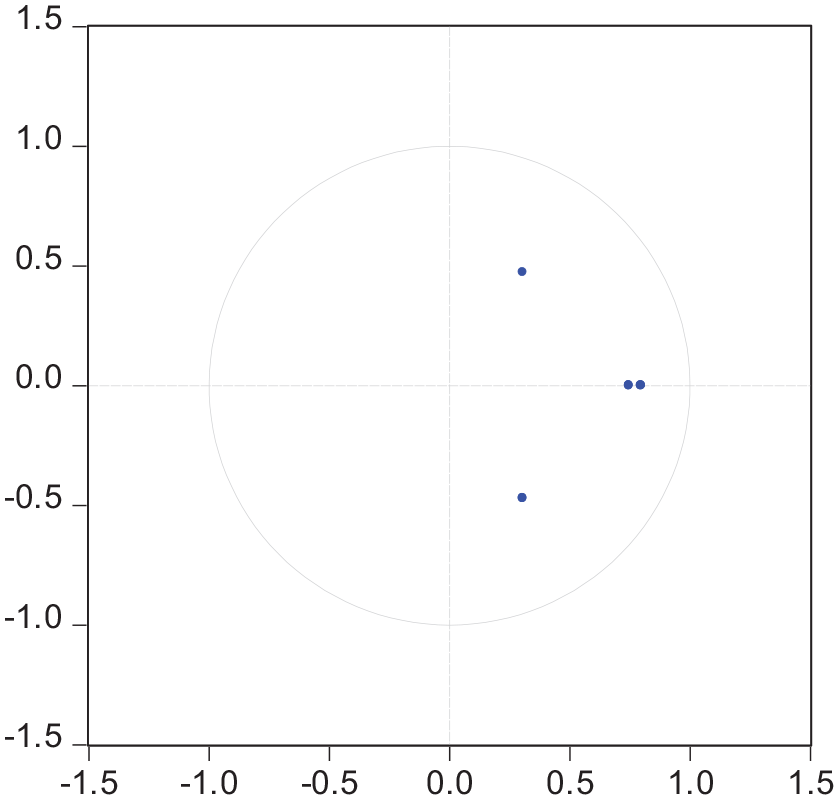
VAR model stationarity test.
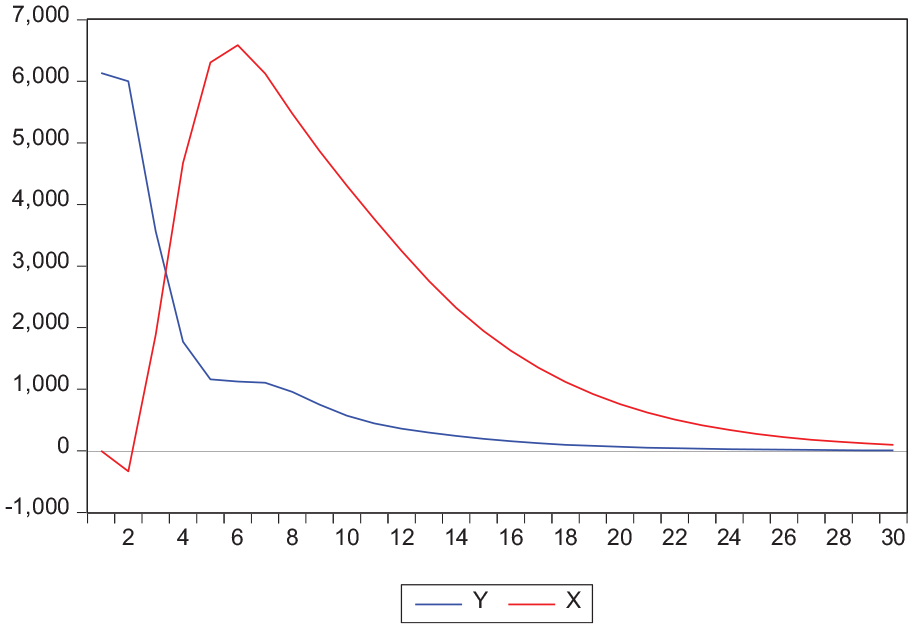
Shock influence on the output of S&E publications.
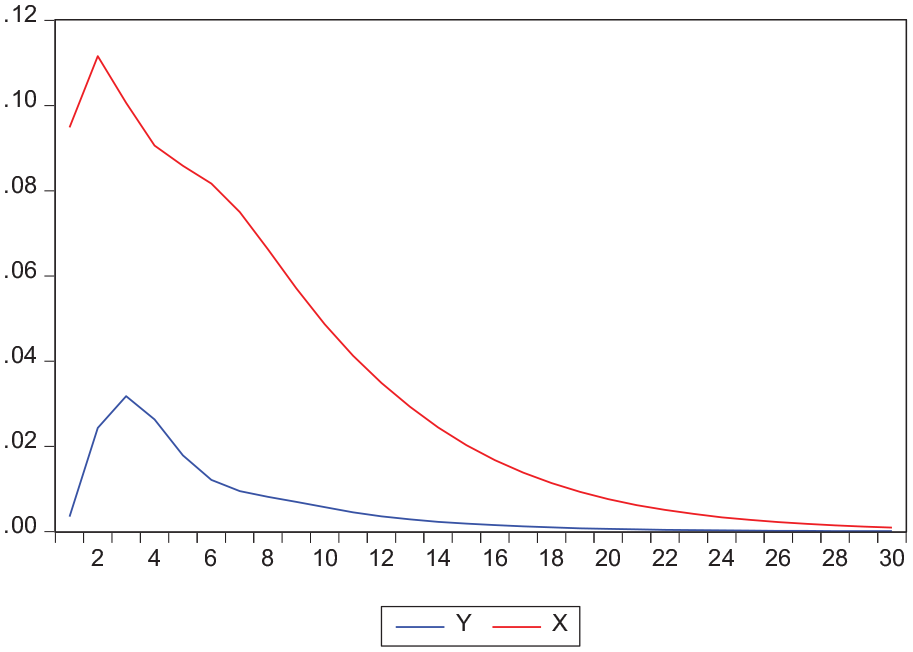
Shock influence on the development level of American public libraries.
In Figure 4, the output of S&E publications is positively influenced in period 1 after receiving its own shock, and the positive effect is relatively obvious in former periods. This shows that the output of S&E publications is significantly affected by itself in former periods, and there is certain path-dependent characteristics. After the output of S&E publications receives a shock from the development level of American public libraries, there is a small negative effect (−332) in the second period, at third period it begins to rapidly rise to a positive effect (1882), then exceeds the effect of S&E publications on itself, in the third period, goes up to a positive effect (3564), reaches a maximum (6586) in sixth period, then gradually declines, and finally becomes stable. The above shows that the shock of the development level of American public libraries on the output of S&E publications has a certain lag. The deficiencies of American public libraries in the quality of computer and internet infrastructure (Noh, 2019), the application of management innovation (Potnis et al., 2021), and the uneven development level (Mehra et al., 2017) restricted the output of S&E publications in the initial period. With the gradual emergence of the information aggregation effect of American public libraries, the supporting effect on the output of S&E publications begins to appear. This influence is continuous, accumulates during periods 2–3, after the third period, exceeds the influence of S&E publications on itself and becomes the main influencing factor.
In Figure 5, the development level of American public libraries is positively influenced in the first period after receiving its own shock, and the positive effect reaches a peak in the second period. Since then, although the impact continues to fall, the positive impact has always dominated. After the development level of American public libraries receives a shock from the output of S&E publications, a positive impact of 0.003 occurs in the first period, and the impact reaches the maximum 0.032 in the third period. As time goes on, the influence gradually weakens, and becomes stable after the 20th period. It can be seen that the development level of American public libraries is greatly affected by itself. The output of S&E publications has a long-term positive impact on the development of American public libraries. With time, the impact gradually increases, it peaks in the third period, and after that gradually weakens. But on the whole, the impact value is small.
Conclusions
The relationship between the development of American public libraries and the output of S&E publications has been deeply explored through time series analysis methods such as stationarity test, cointegration test, Granger causality test, and impulse response function, and the following conclusions are obtained. First, the co-integration relationship between them is verified, that is, there is a long-term equilibrium relationship between them. The elevation of the development level of public libraries can promote the output of S&E publications in the United States. Second, there is a two-way Granger causality between them. In the lag of 1 and 3 years, the development level of American public libraries has a relatively obvious ability to predict the output of S&E publications. In the lag of 5–7 years, the output of S&E publications has a relatively obvious ability to predict the development level of American public libraries. Third, the results of impulse response function analysis are consistent with the results of Granger causality test. This also confirms the correctness of the results of Granger causality test from another perspective.
To promote the coordinated development of public libraries and other aspects of society requires joint efforts. In terms of the construction and development of public libraries, it is necessary to enhance scientific and technological service capability, improve management services, try service diversity, and expand service businesses. Librarians with professional backgrounds form information service teams, which visit enterprises, institutions and rural areas to understand their requirements and provide corresponding supports. Also, public libraries can cooperate with governments, institutions, research groups, and other organizations to undertake the services of quantitative analysis for literature resources and information, provide relevant analysis reports, which provide scientific grounds for their decision-making or other work. This not only increases the utilization of literature, but also increases the depth and breadth of services.
Footnotes
Declaration of conflicting interests
The author(s) declared no potential conflicts of interest with respect to the research, authorship, and/or publication of this article.
Funding
The author(s) disclosed receipt of the following financial support for the research, authorship, and/or publication of this article: The authors received financial support from the Research Project of Library Society of China for the research of this article. (No.2022LSCKYXM-ZZ-QN010).