
Abstract
Analytical near-infrared (NIR) spectroscopy has developed rapidly over the past few decades and is today of incredible value for academic, industrial and institutional laboratories. These developments are closely related to the development of instruments and miniaturization, as well as the methods of multivariate analysis. The strong stimulus for the development of NIR spectroscopy originating from the application field resulted in the advancement of this technique to suite unitarian goals. By contrast, less actively explored have been the foundations of NIR spectroscopy. Much of the information contained in the NIR spectrum is still not easily accessible for the purpose of basic research. In the past few years, a promising development has been made in application of the methods of computational chemistry to NIR spectroscopy. In this article, the current frontier of this advancement is summarized. The scope of the recent accomplishments shifts closer to the challenging real-life problems, such as interactions of the analysed molecules with the matrix, including the aqueous environment. Particular attention was given to the interpretation of the chemical factors underlying instrumental differences between miniaturized NIR spectrometers using different technology and optical solutions. The applicability of the methods of computational chemistry to unravel intricate NIR spectral features of complex molecules such as biomolecules and polymers should be highlighted as well.
Keywords
Introduction
Near-infrared (NIR) spectroscopy is characterized by an unmatched potential in practical applications, and has become one of the most widespread techniques of analysis in modern science and industry. 1 , 2 Since the beginning of its advance, a part of the thriving development of the applications, the fundamental research in the area of NIR spectroscopy mostly focused on instrumentation and the methods of multivariate analysis (MVA). While the intensive research aimed at those directions has led to the current thriving industrial and institutional adoption of NIR spectroscopy, it had become apparent that the basic science at the foundations of NIR spectroscopy remained underexplored. To large extent, it was dictated by intrinsic complexity of NIR spectra and the difficulties in the interpretation of the measured spectral lineshape and its exact relationships with chemical structures. 3 , 4
The spectral complexity in the NIR region extends far beyond the ones seen in mid-infrared (MIR; 4000–400 cm−1) and Raman spectra. NIR spectra feature much higher number of strongly overlapped bands, creating broad absorption structures with various mixed contributions from different vibrational transitions. 4 The relationships of those broadened absorption regions with the chemical structures are less straightforward than typically well-researched MIR or Raman spectra. This feature of NIR spectra is the major reason for much lower chemical specificity of NIR spectroscopy, which hindered its advancement in certain applications, in which the mentioned competing techniques, superior in their chemical specificity, have become well-established. 5 , 6 The molecular mechanisms and background for NIR vibrational transitions were previously discussed by us in detail in focused literature. 7 At this point I would like to emphasize that despite the intrinsic convolution, numerous bands populating NIR spectra carry plentiful information for chemical analysis. Therefore, considerable potential for physical chemistry and analytical applications awaits to be fully utilized.
Brief overview of the foundations of NIR spectra
Quantum chemical methods useful for NIR spectroscopy
In contrast to the fairly routine quantum chemical simulations of MIR or Raman spectra based on harmonic approximation, NIR spectra require anharmonic methods. 8 Recent years have made those expensive, in the sense of computer time and resources, anharmonic calculations applicable to provide assistance to NIR spectroscopy. 9 The availability of accurately reconstructed by theoretical methods NIR spectra of various molecules, reaching the complexity level of long-chain fatty acids, polymers represented by their model fragments, or carbohydrates and their hydration shells, opens new possibilities both for basic research as well as the applications. 10 This creates opportunity for direct interpretation of the chemical information expressed in chemometric models. 11 Beneath a brief overview of some of noteworthy avenues of NIR spectroscopy opened by those accomplishments is given.
Complexity of NIR spectra
NIR spectrum constitutes numerous overlapping bands. Despite common perception as ‘overtone spectra’, one should rather consider combination bands as the primary contributors to the NIR spectrum. Quantum chemical simulation demonstrates this in supreme detail, as shown in Figure 1 for vinylacetic acid. 12 Note, the region 5000–4000 cm−1 is nearly entirely formed by binary combination bands, i.e. those involving excitations of two vibrational modes. The first overtone bands are meaningful at around 6000 cm−1, where they co-contribute noticeably to the spectral lineshape.
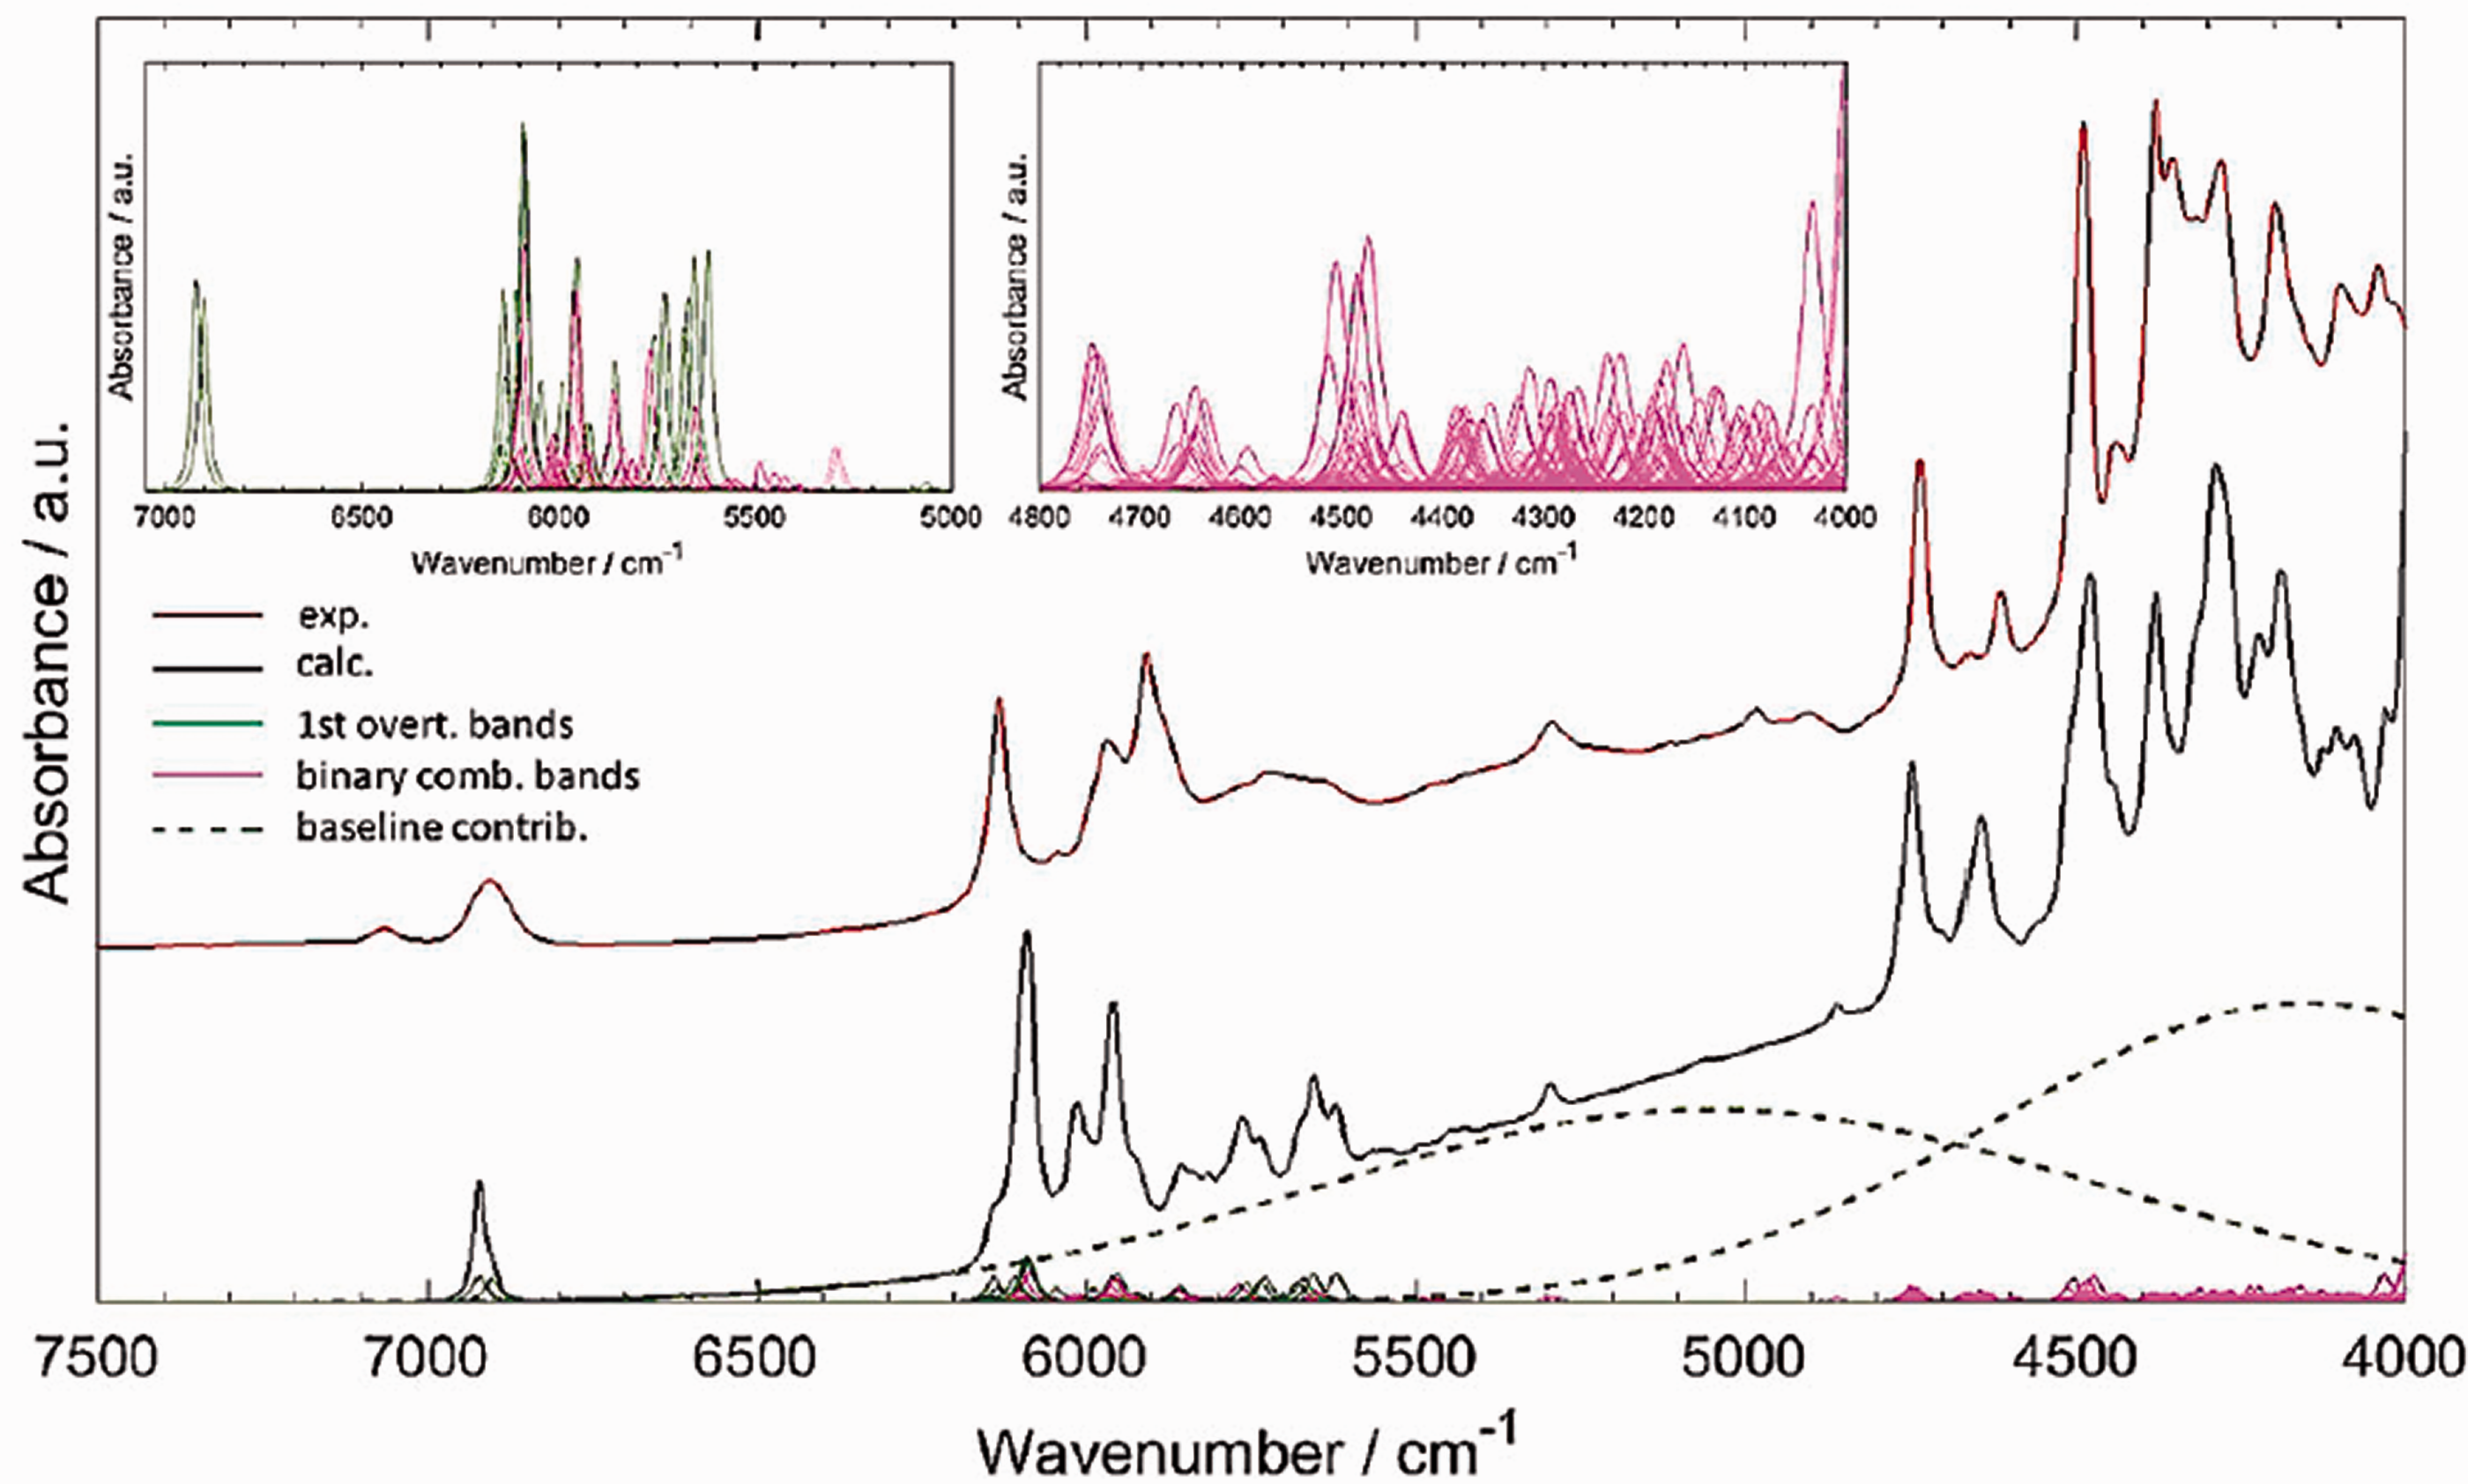
An example of how convoluted NIR abortion lineshape is, as unravelled by spectra simulation. The example of a simple biomolecule, vinylacetic acid, a short-chain fatty acid. All bands are presented in the common scale of intensity. Reprinted with permission from Grabska et al. 12 Copyright (2017) American Chemical Society.
Studies of basic molecules and physiochemical phenomena
NIR spectra of small to medium molecules isolated in relatively inert solvent can be simulated with nearly full accuracy, 13 including very fine spectral details.14–17 On the example of the spectra of four isomers of butyl alcohol, 16 one may notice that even intricate band asymmetries were exactly reconstructed, as shown in Figure 2. The reliability and accuracy of the simulations open path for solving numerous essential research problems, beginning with detailed band assignments, through physical chemistry studies with NIR spectroscopy, to improving the applications of this technique in real-life scenarios.
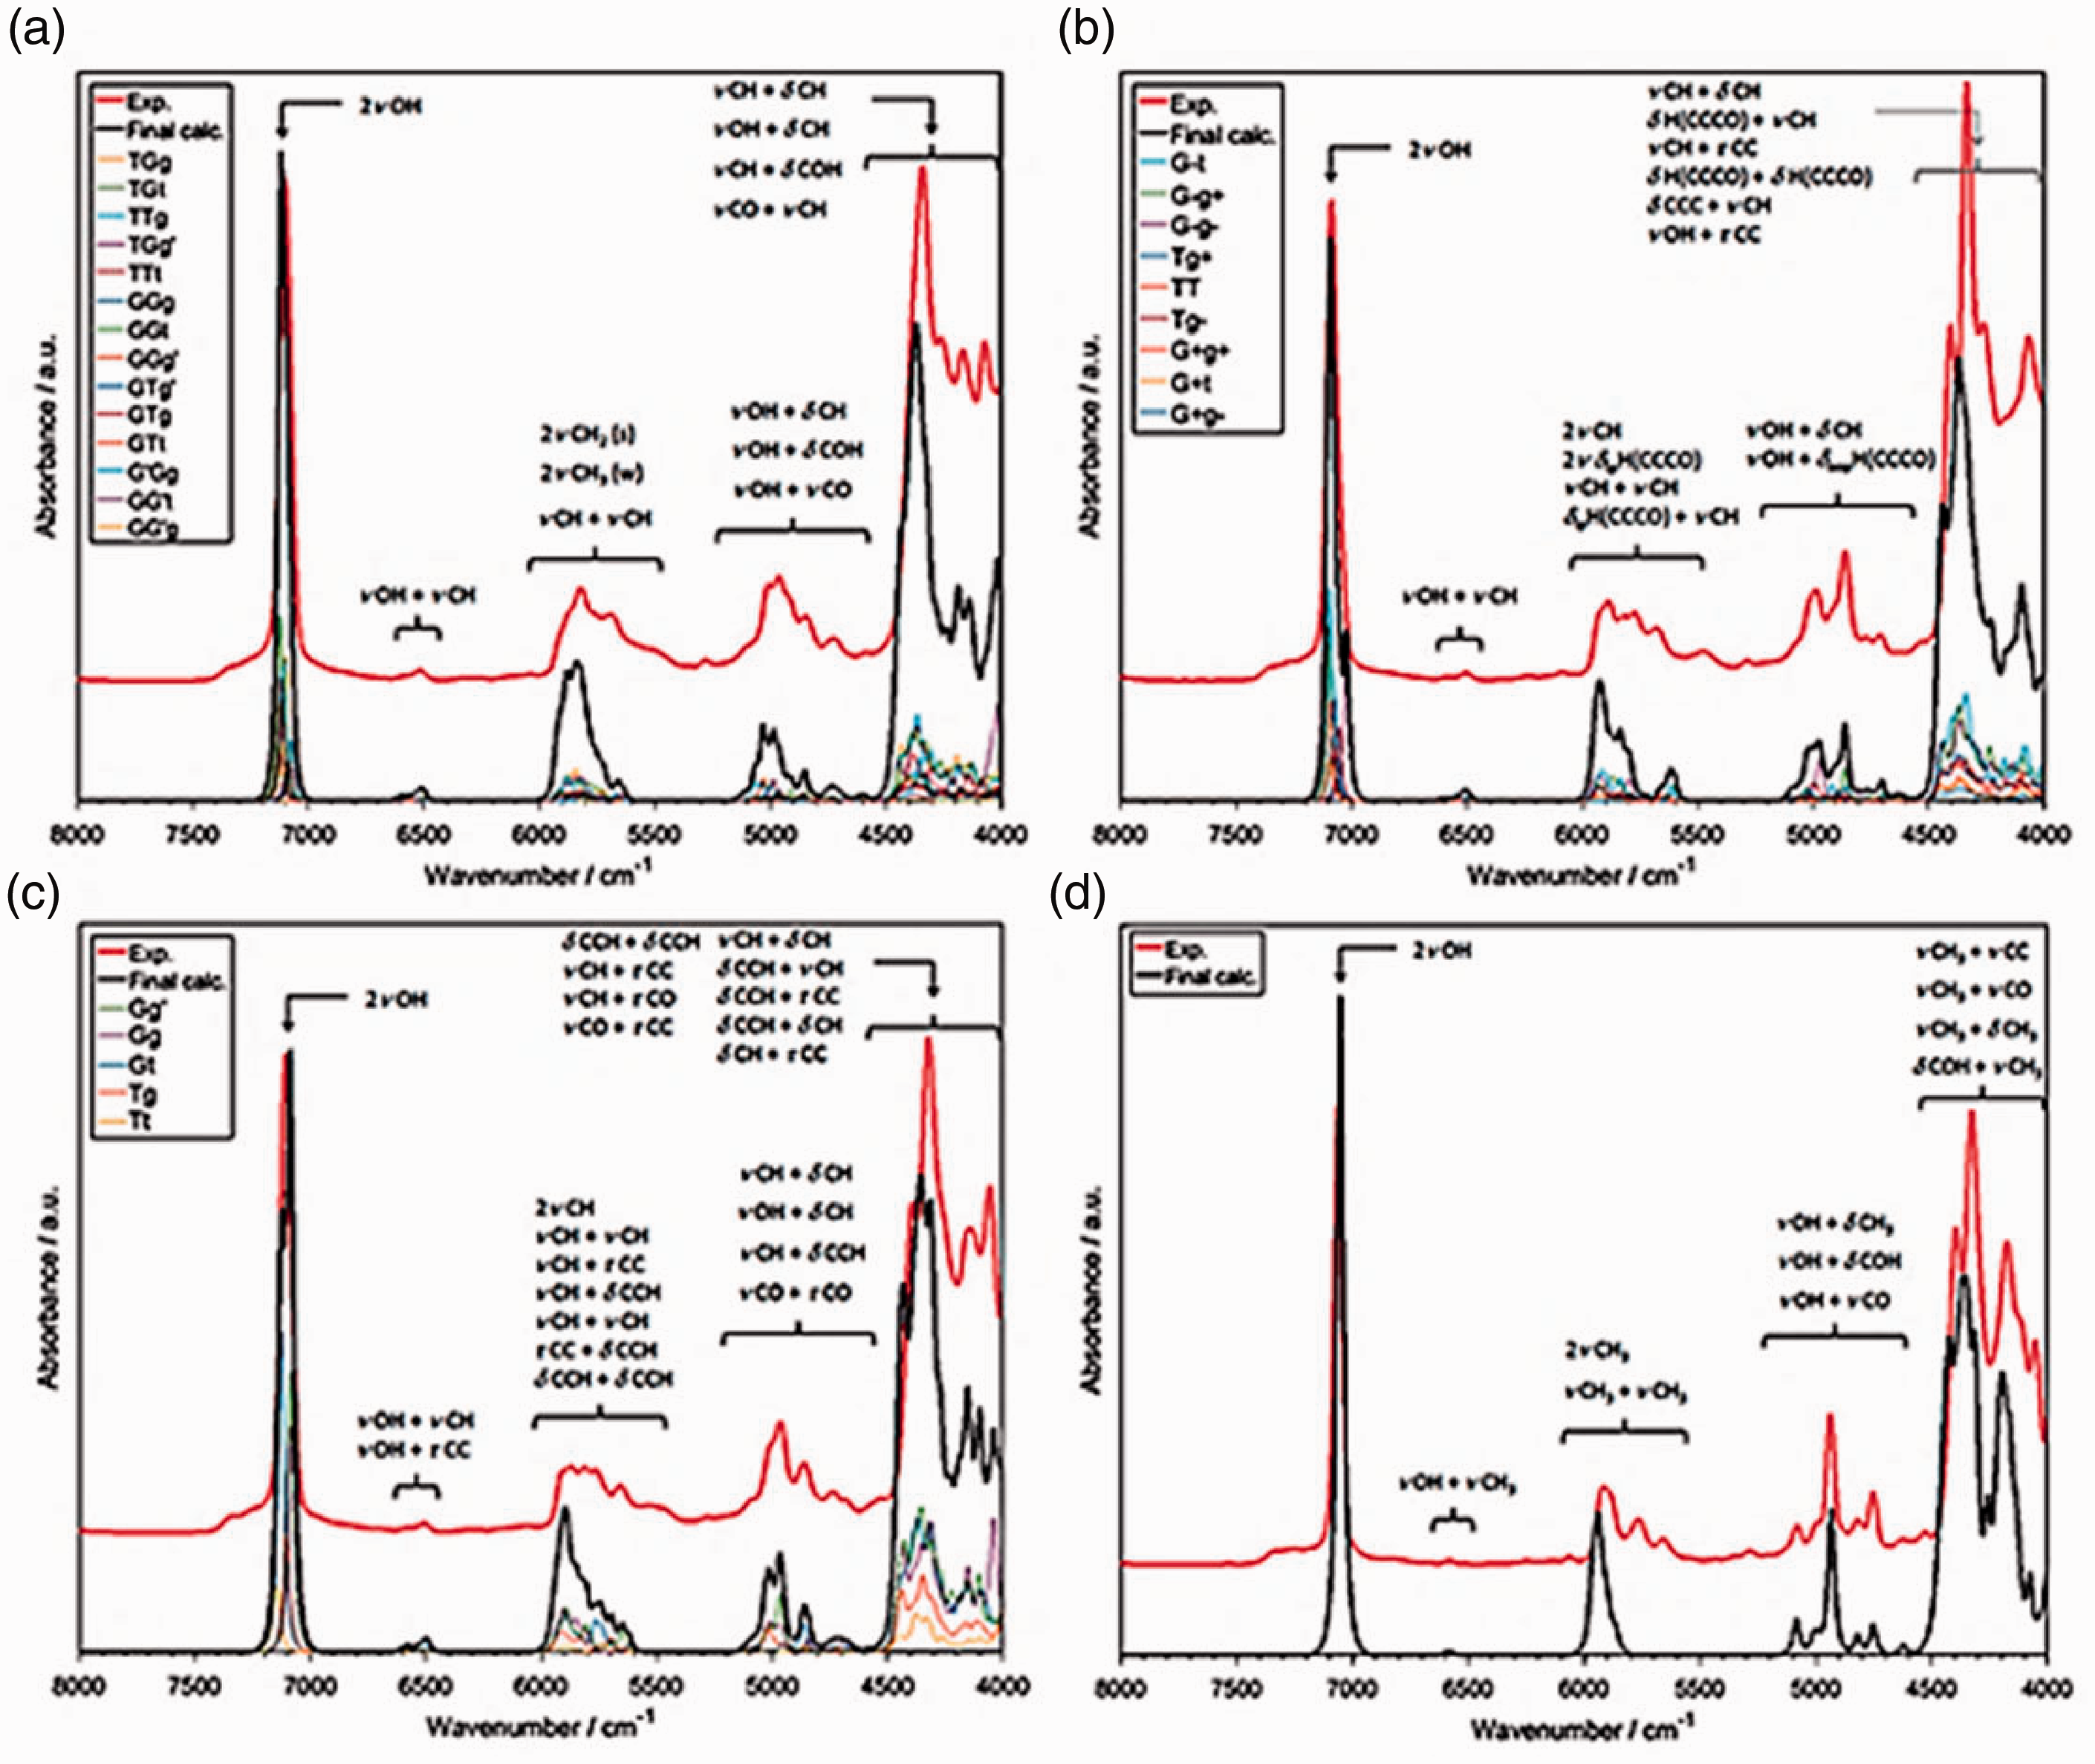
Fine details in NIR spectra of butyl alcohols accurately reproduced in simulation: (a) n-butyl alcohol, (b) sec-butyl alcohol, (c) iso-butyl alcohol and (d) tert-butyl alcohol. Reprinted with permission from Grabska et al. 16 Copyright (2017) American Chemical Society.
Quantum chemical simulations of NIR spectra – Biomolecules
Biomolecules are universally significant systems and particularly challenging ones for NIR spectroscopy. Unlike well-researched MIR or Raman characteristic bands, it is much more difficult to assign clearly specific wavenumber regions, in which the presence of peptides, fatty acids or nucleic acids may be detected in NIR spectra. Sophisticated experimental approaches may resolve this issue only to a certain extent, and even the characteristics amide bands are still intensively studied and discussed in the most recent literature. 18
On this background, the availability of simulated NIR spectra offers particular benefits and may help addressing the shortcoming of this technique in chemical specificity. 5 Within reach of these approaches have recently come short-, medium- and long-chain fatty acids. 12 , 19 , 20 The NIR spectra of these important constituents of most biological materials were accurately reconstructed and analysed (Figure 3(a)). Similar accomplishment was made for nucleobases (i.e. nucleic acid bases), adenine (Figure 3(b)), thymine cytosine and guanine. 21 , 22
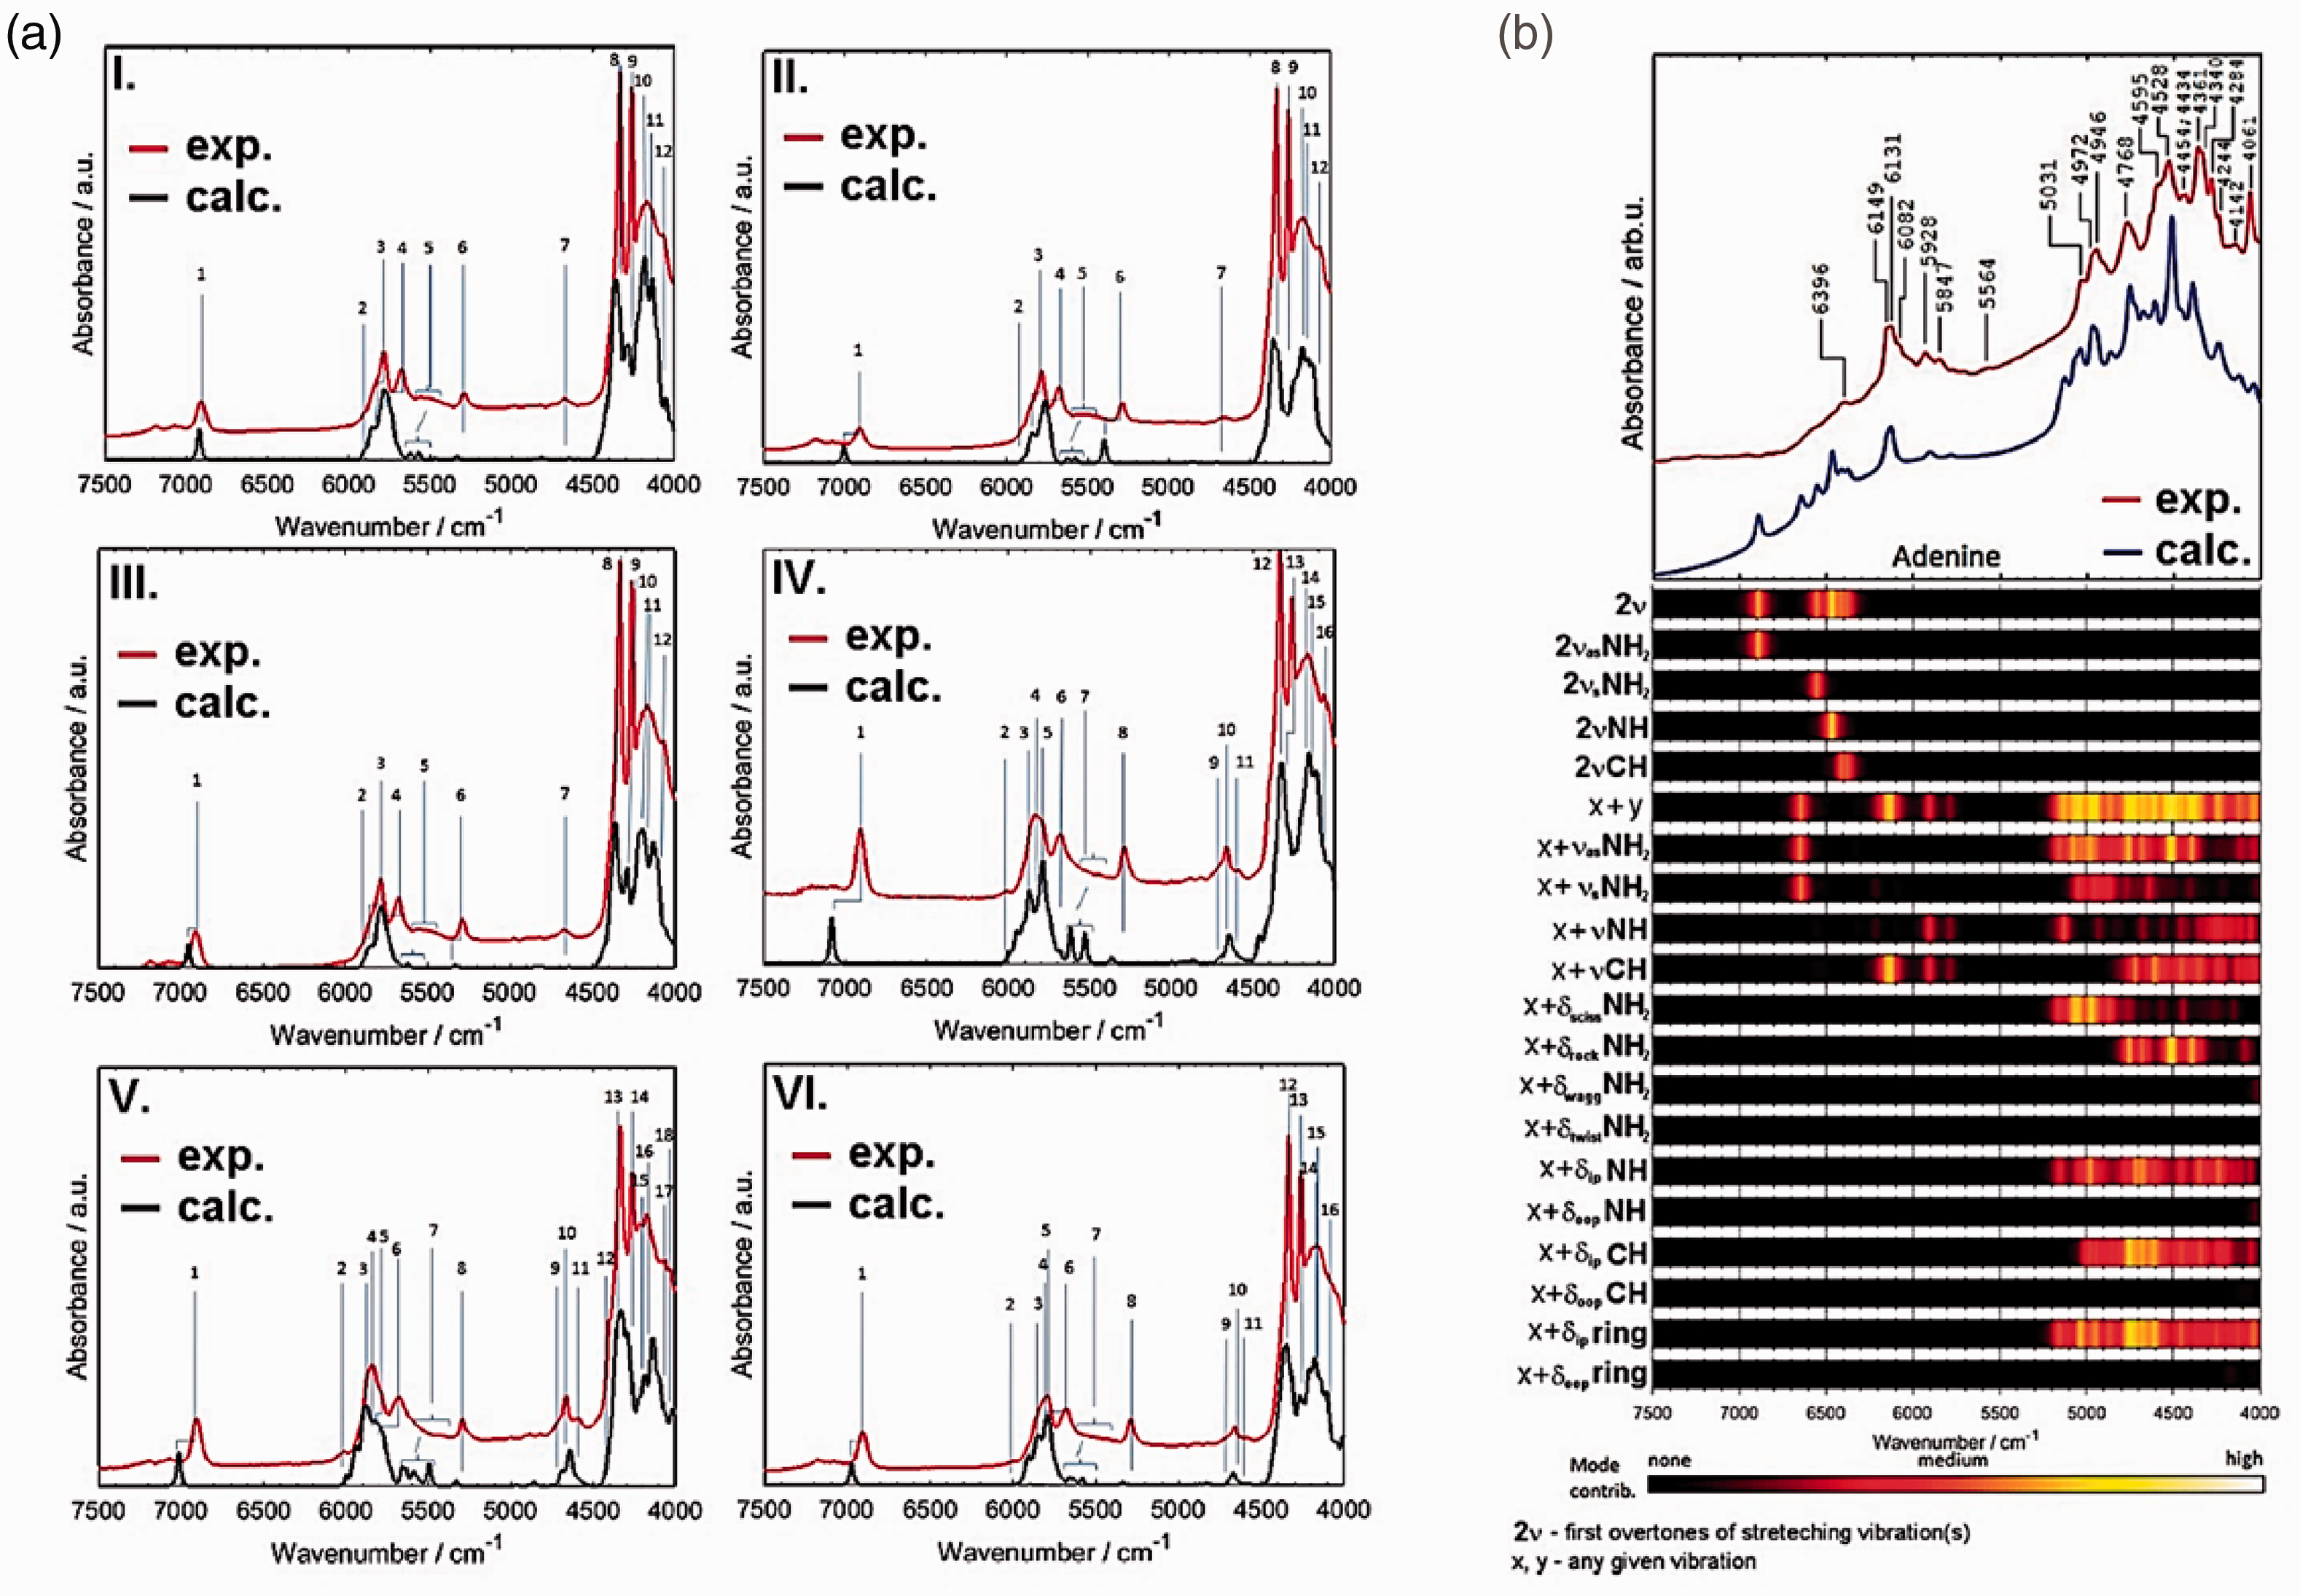
Experimental and simulated NIR spectra of biomolecules. (a) Long-chain fatty acids in carbon tetrachloride solution; I. arachidic acid, II. palmitic acid, III. stearic acid, IV. linoleic acid, V. α-linolenic acid, VI. oleic acid. Reprinted with permission from Grabska et al. 20 Copyright (2018) American Chemical Society. (b) Crystalline adenine. Reprinted with permission from Grabska et al. 20 and Beć et al. 21 CC-BY 4.0 license.
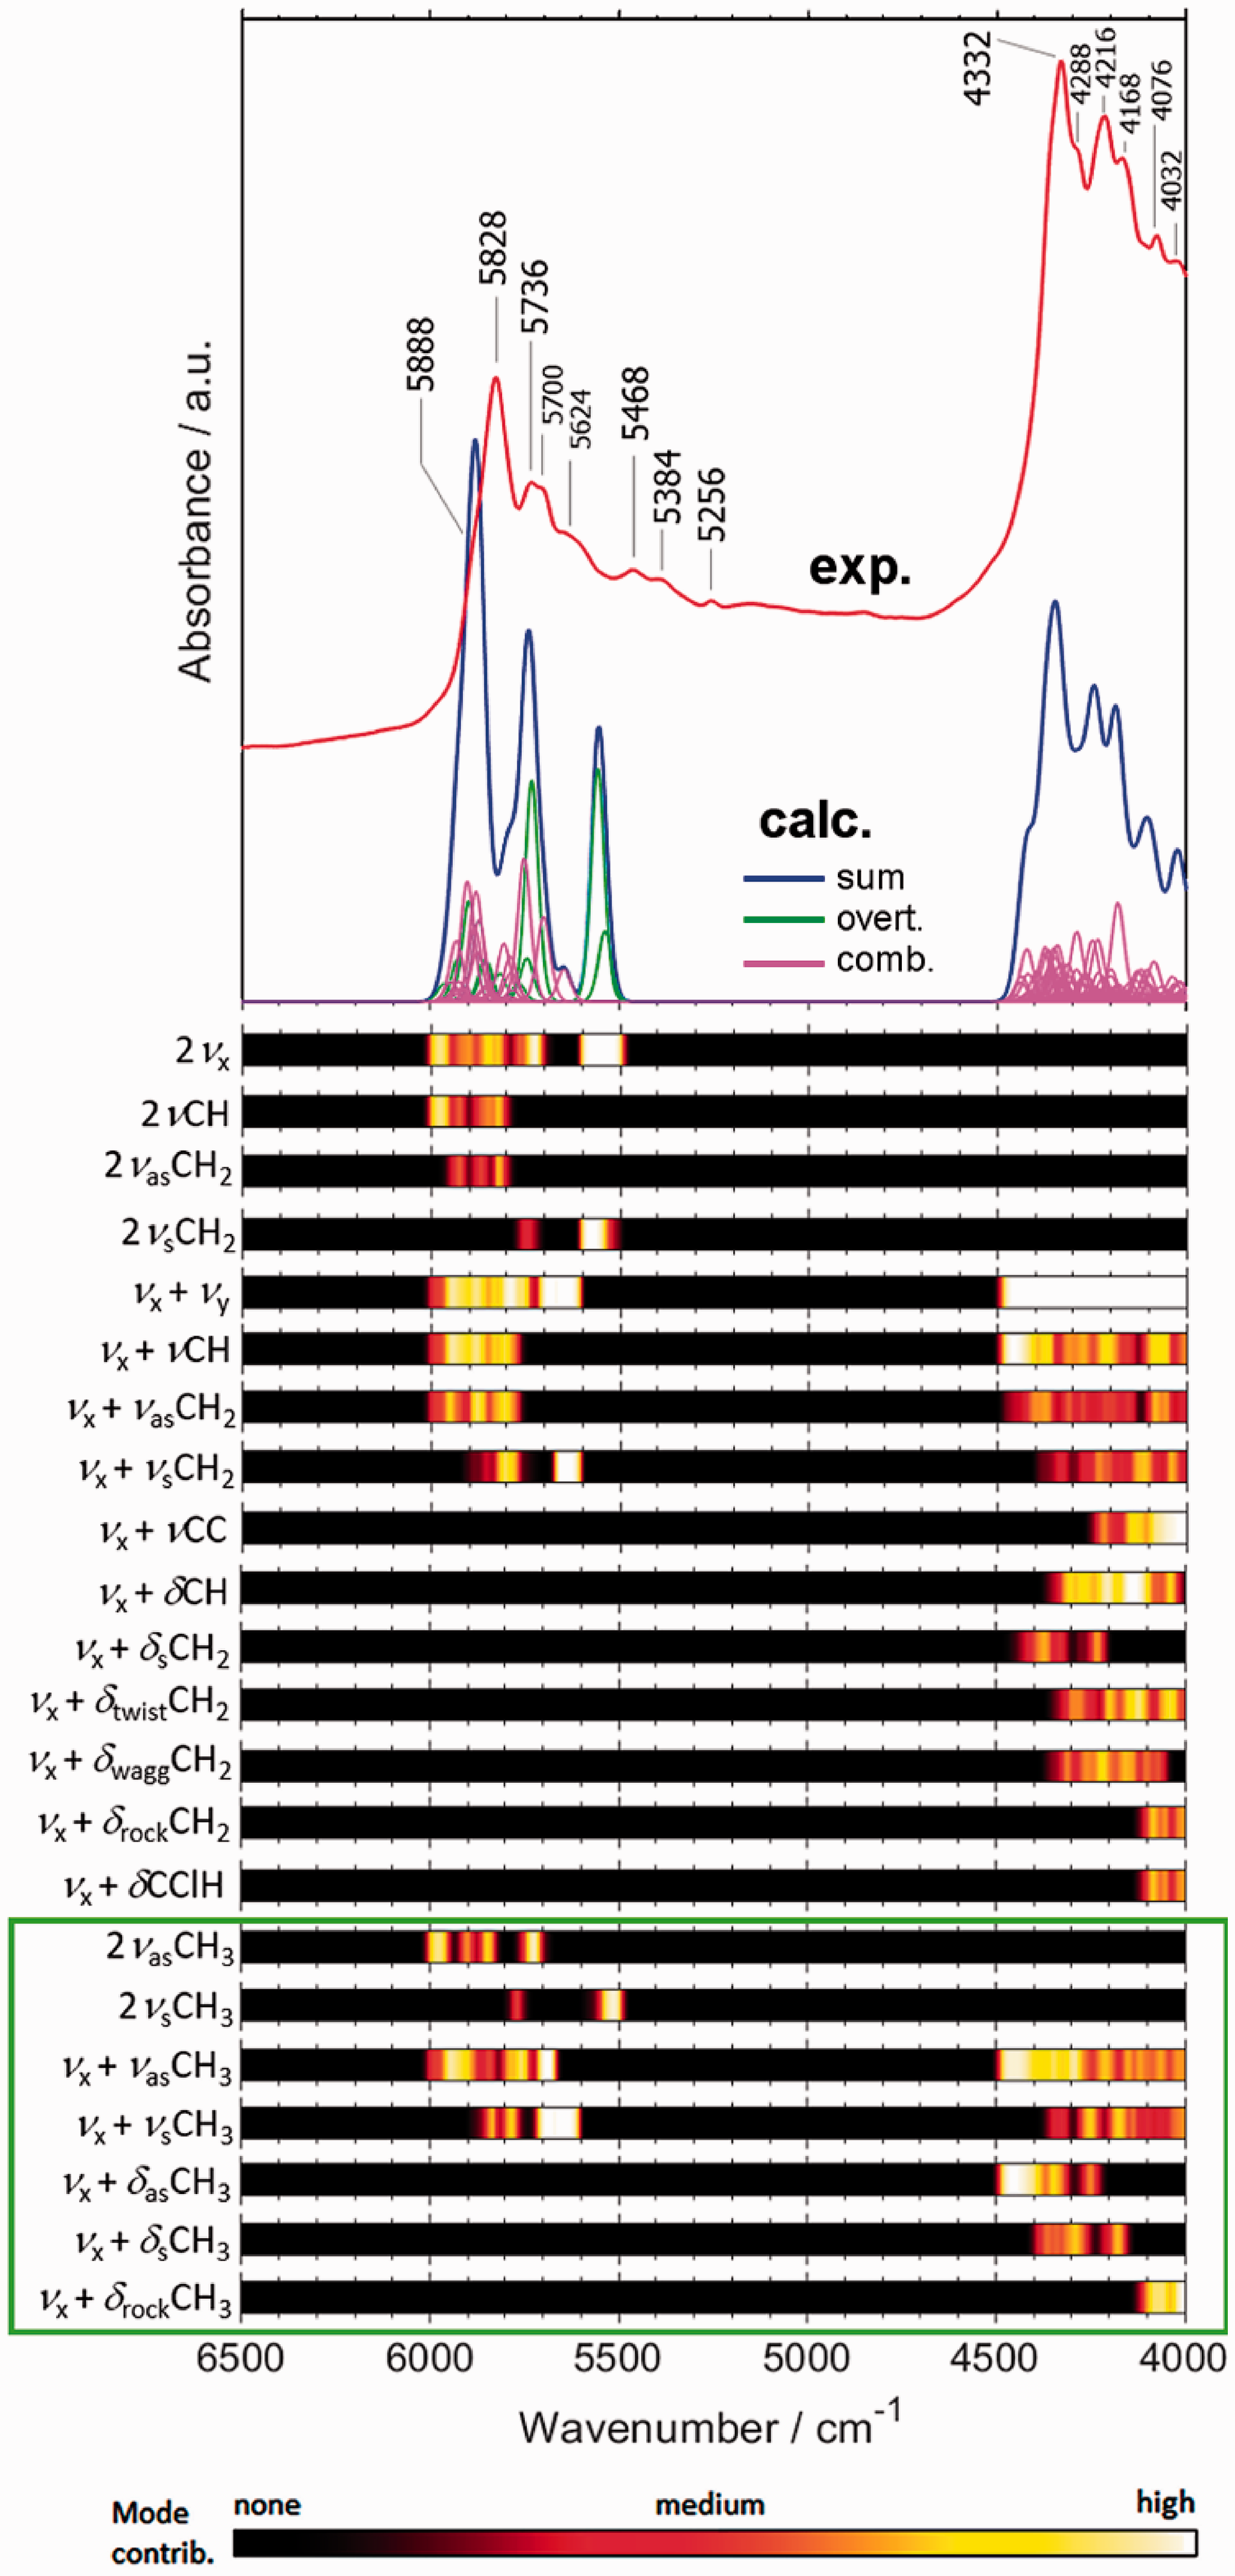
Experimental and simulated NIR spectrum of PVC polymer. Band assignments presented in the form of intensity maps, to better reflect the overlapping, convoluted nature of NIR spectrum. Reproduced with permission from Beć et al. 23 CC-BY 4.0 license.
Quantum chemical simulations of NIR spectra – Polymers
Other than biological molecules, complex systems in keen attention of NIR spectroscopy are the polymers, given their universal industrial importance. While the complicated structure of polymers may not yet be exhaustively modelled in anharmonic calculations, the peculiarity of NIR transitions make using smaller models feasible. The models that capture major structural motifs of larger molecular systems work particularly well in the case of polymers, given their periodic structure. With this approach, accurate simulation of NIR spectra of nine polymers was accomplished recently. 23 These results were presented for nine polymers: acrylonitrile butadiene styrene (ABS), ethylene-vinyl acetate (EVAC), polycarbonate (PC), polyethylene terephthalate (PET), polylactide or polylactic acid (PLA), polymethylmethacrylate (PMMA), polyoxymethylene (POM), polystyrene (PS) and polyvinylchloride (PVC). The exemplary comparision of calculated and experimental spectra of PVC is presented in Figure 4.
Quantum chemical simulations of NIR spectra – Carbohydrates in aqueous matrix; insights into water mirror effect
Vibrational coupling between carbohydrates and the hydration shell was unveiled as the underlying mechanism that improves wavenumber-selectively the carbohydrate discrimination performance by NIR spectroscopy. This effect has been previously identified as the ‘water mirror effect’ and evidenced by empirical studies and observations. 24 It has been concluded in the literature as the driving factor behind the improved ability to detect the presence of an analyte in aqueous solution, because of its interaction with the surrounding water molecules. 24 Its existence, however, was only indirectly observed through its impact on analytical performance of NIR spectroscopy.
The simulation unveiled that the water mirror phenomenon is vibration-selective and thus wavenumber-selective, and leads to an enhancement of the qualitative information contained in the specific spectral regions. 25 The location of these regions and the related performance correspond fully to the appearance and magnitude of the cooperative vibration effect unveiled by MVA. The investigation of ‘water mirror’ on the classification performance in low concentration of an analyte was based on NIR spectral measurement of six carbohydrates (fructose, glucose, mannose, ribose, xylose and sorbitol) in aqueous solution in different concentration levels. This evidenced that the ‘water mirror effect’, understood as the vibrational coupling between the analyte (in this case, carbohydrate molecule) capable of forming hydrogen bonding with the solvent molecule (i.e. in this case, water) is vibration-selective and thus wavelength (wavenumber) selective. This picture obtained from the data independent from the experiment, spectra simulation, is fully consistent with the observations of the real-life systems. The improvement in selectivity of NIR spectra towards the solvated analyte (Figure 5(b); presented for qualitative analysis) appears only in those wavelengths, where this effect is observed (Figure 5(c)). Therefore, we confirm the existence of the water mirror effect, and its role in enhancing the capability of NIR spectroscopy to sense lower concentrations of the hydrated analyte that it otherwise would be impossible without the vibrational cooperative effect between the analyte and the surrounding water molecules. 25
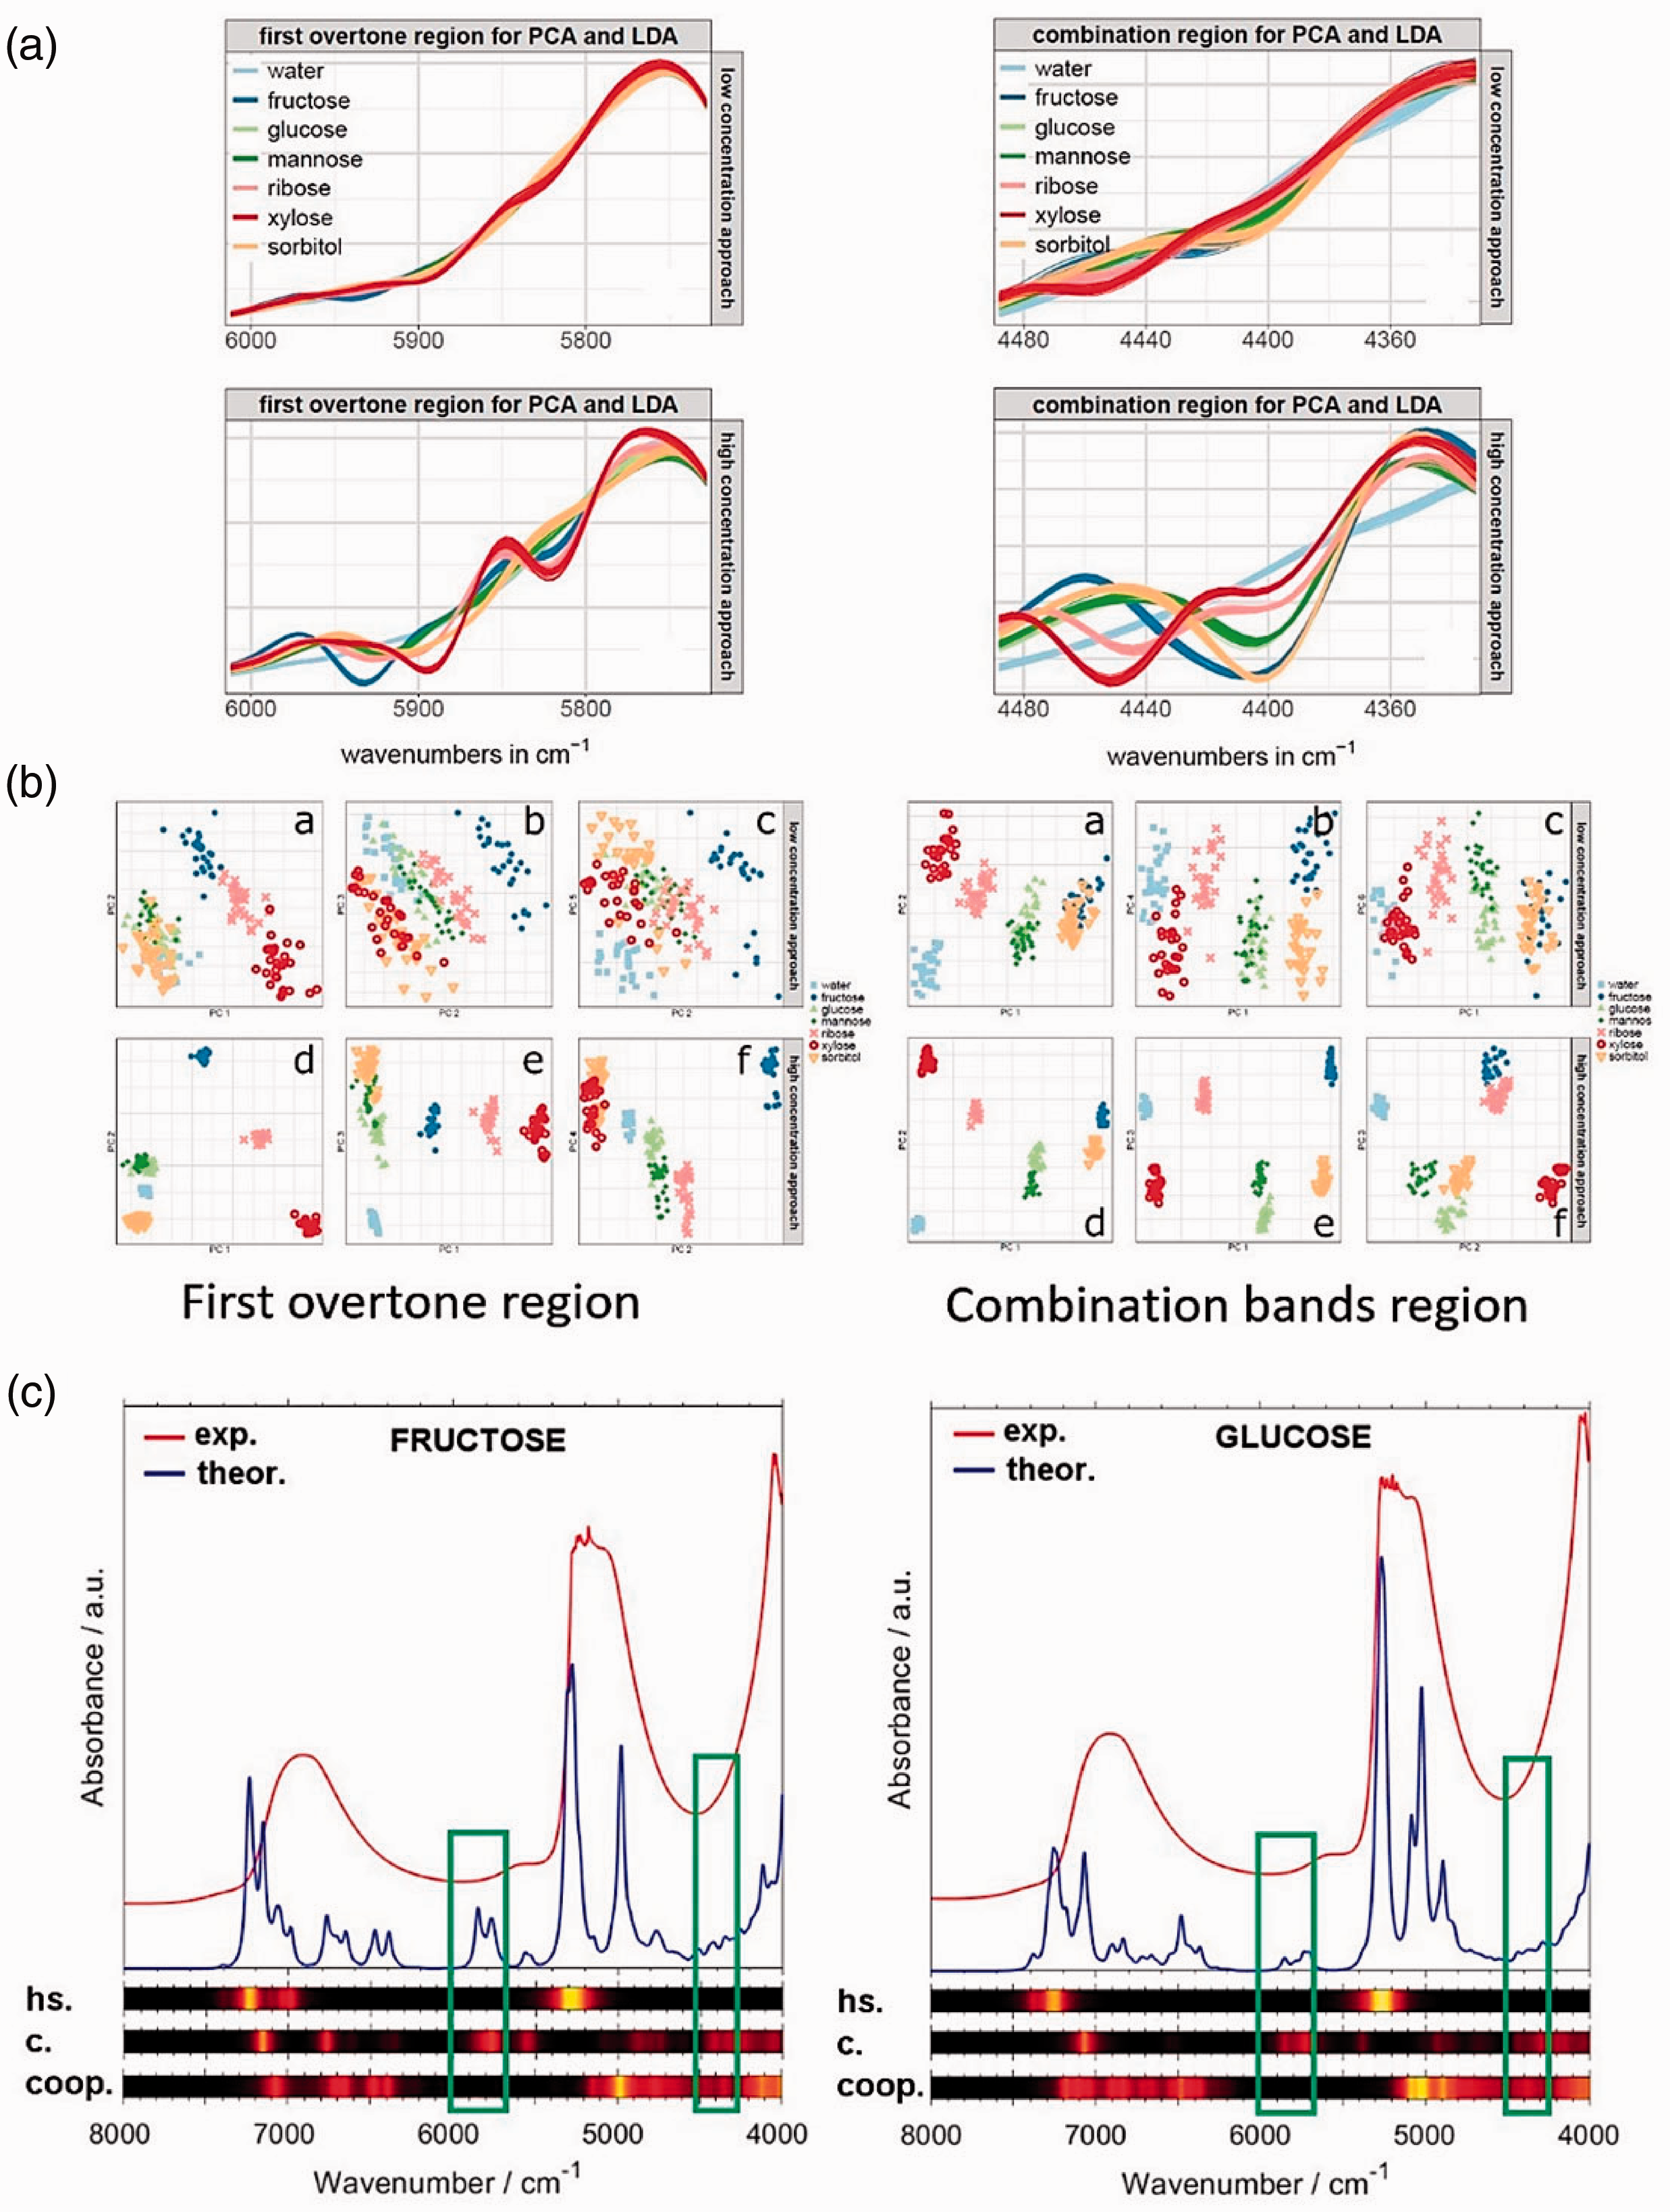
Cooperative effect in carbohydrate-water system: (a) NIR spectra of carbohydrates in aqueous solution (top: 5 mg/mL; bottom: 20 mg/mL). (b) PCA plots (PC1 vs. PC2) presenting the corresponding discrimination performance. (c) Simulated spectra of the carbohydrate-hydration shell systems; pure vibrations of hydration shell (h.s.); pure vibrations of carbohydrate (c.); cooperative vibrations of carbohydrate and hydration shell (coop.). Reproduced with permission from Beganović et al. 25 CC-BY 4.0 license.
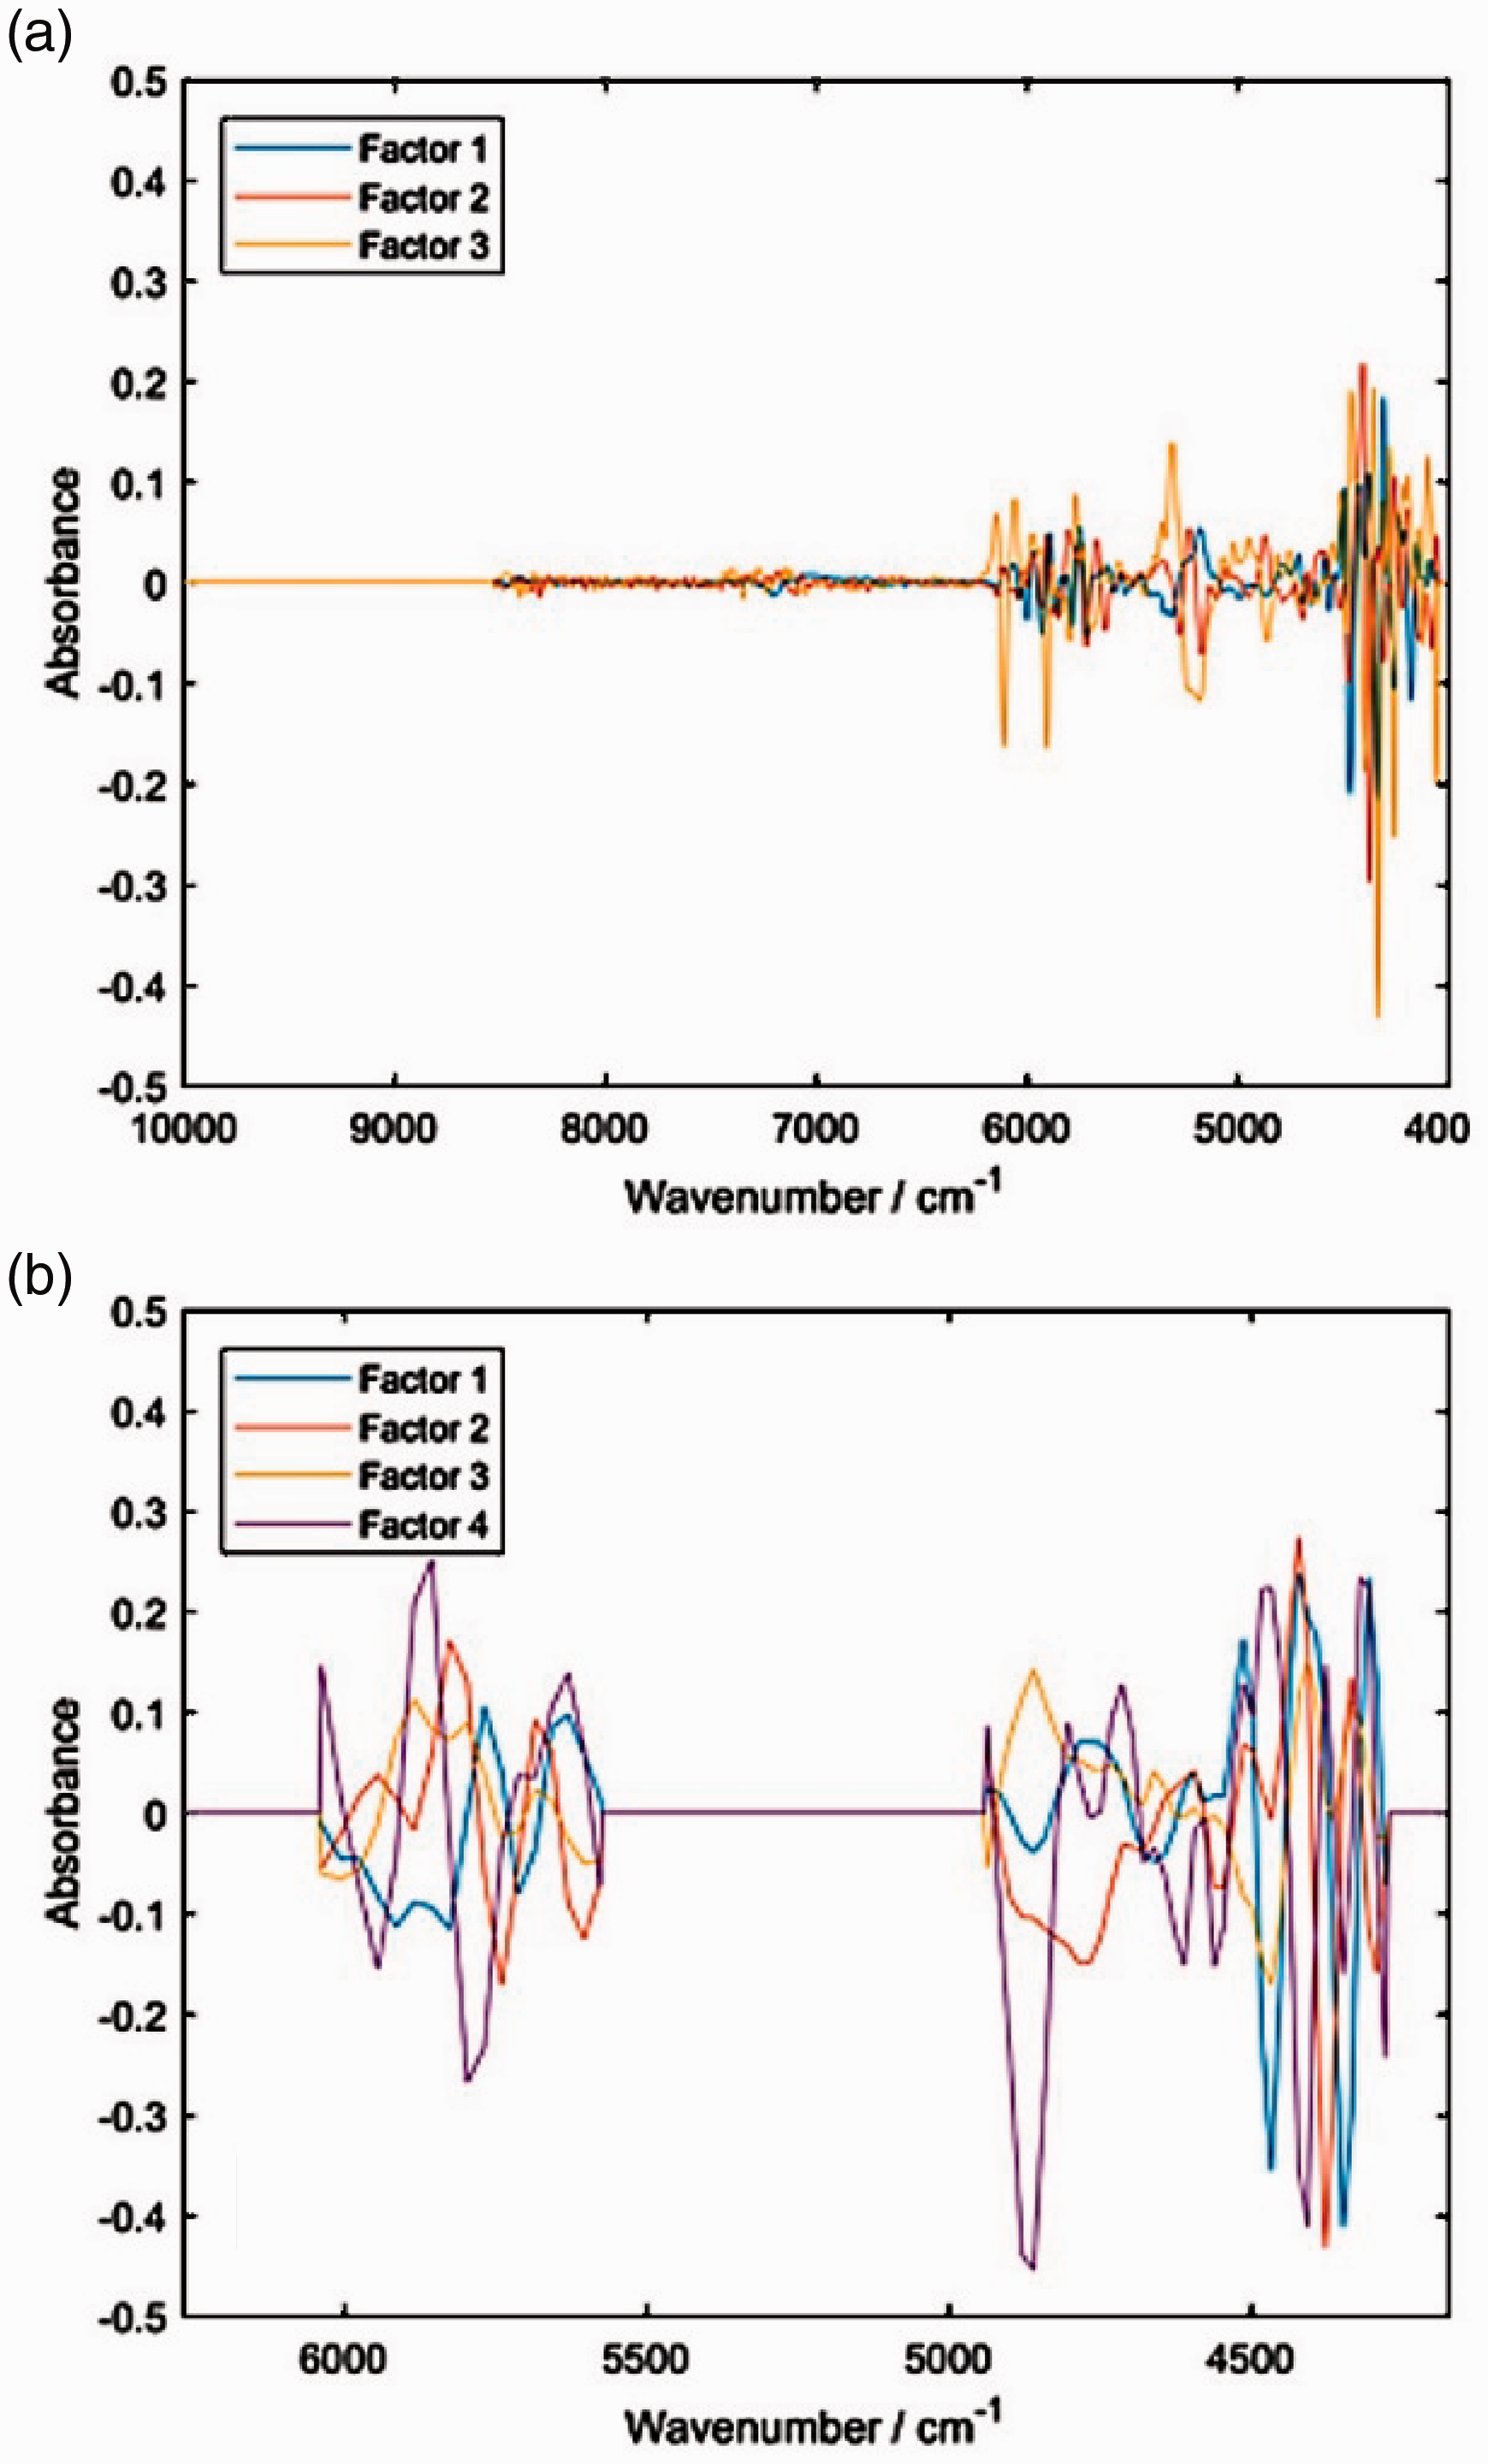
Loadings plots for the PLSR model of piperine content in black pepper developed for the NIR spectral sets measured with a (a) benchtop Buchi NIRFlex N-500; (b) miniaturized microPHAZIR spectrometer. Reproduced with permission from Grabska et al. 29 . CC-BY 4.0 license.
Interpretation of instrumental difference of handheld spectrometers
Instrumental difference attracts keen interest in NIR spectroscopy, particularly because of the widespread miniaturized spectrometers and various technologies engineered into those devices.26–28 NIR spectra simulations can offer invaluable information on how chemical information constitutes to this aspect. A good example may be given by a recent paper, where cross-section of the NIR spectrum of piperine yielded detailed assignments of NIR bands. These data allowed us to interpret the characteristics of the PLS regression models that were built to describe the content of the pipeline in black pepper samples. 29 , 30 Two models were compared, which were developed for spectral data sets obtained with the benchtop laboratory instrument (NIRFlex N-500) and a miniaturized spectrometer (microPHAZIR). These two spectrometers use different optical principles (benchtop: FT-NIR with a polarization interferometer and microPHAZIR: a programmable MEMS Hadamard mask), leading to profound instrumental differences. However, both are able to capture the most significant NIR absorption of piperine (Figure 6). We concluded that the sensitivity of the two instruments to certain types of piperine NIR vibrations is different, with the stationary spectrometer being much more selective. This difference in capturing chemical information from the sample results in the difference in the performance between the laboratory FT-NIR spectrometer and narrow-waveband miniaturized spectrometer in analysing the piperine content in black pepper. 29 The interested reader is referenced to similar studies aimed at elucidating instrumental difference in miniaturized NIR spectrometers.31–33
Studies of physicochemical phenomena
Anharmonic simulations yield unique information on NIR spectra and enable a variety of applications in basic research and applications. Briefly mentioned should be here investigations into conformational contributions, 34 isotopic substitution35–37 or shape and parameters of NIR bands. 37 New possibilities are given to elucidating the correlations of NIR bands with MIR and Raman ones. 17 Intermolecular interactions,21,22 the effects of chemical neighbourhood (i.e. matrix) 38 , 39 as well as studies of hydrogen bonding and intermolecular interactions15,17 complement these studies in the area of physical chemistry and contribute to further establishing NIR spectroscopy as universally potent technique of analysis.
Overtones and combination bands in MIR spectra
While the capability of anharmonic calculations to simulate overtones and combination bands primarily falls into the interest of NIR spectroscopy, their usefulness is proven also in MIR spectroscopy. Albeit the primary focus there is given to the fundamental bands, the overtones and combinations, together with anharmonic effects such as Fermi resonances, are essential features of MIR spectra as well. 40 If the accessibility to fundamental peaks is limited in MIR spectra, e.g. because of the ‘detector saturation’ effect, weak overtones and combination bands can be used instead. This is particularly evident in the MIR region typically free from the presence of fundamental bands, i.e. ca. 2700–1500 cm−1 (Figure 7). The moderate intensity of the overtones and combination bands prevents any distortion of the spectral lineshape by instrumental limitations.
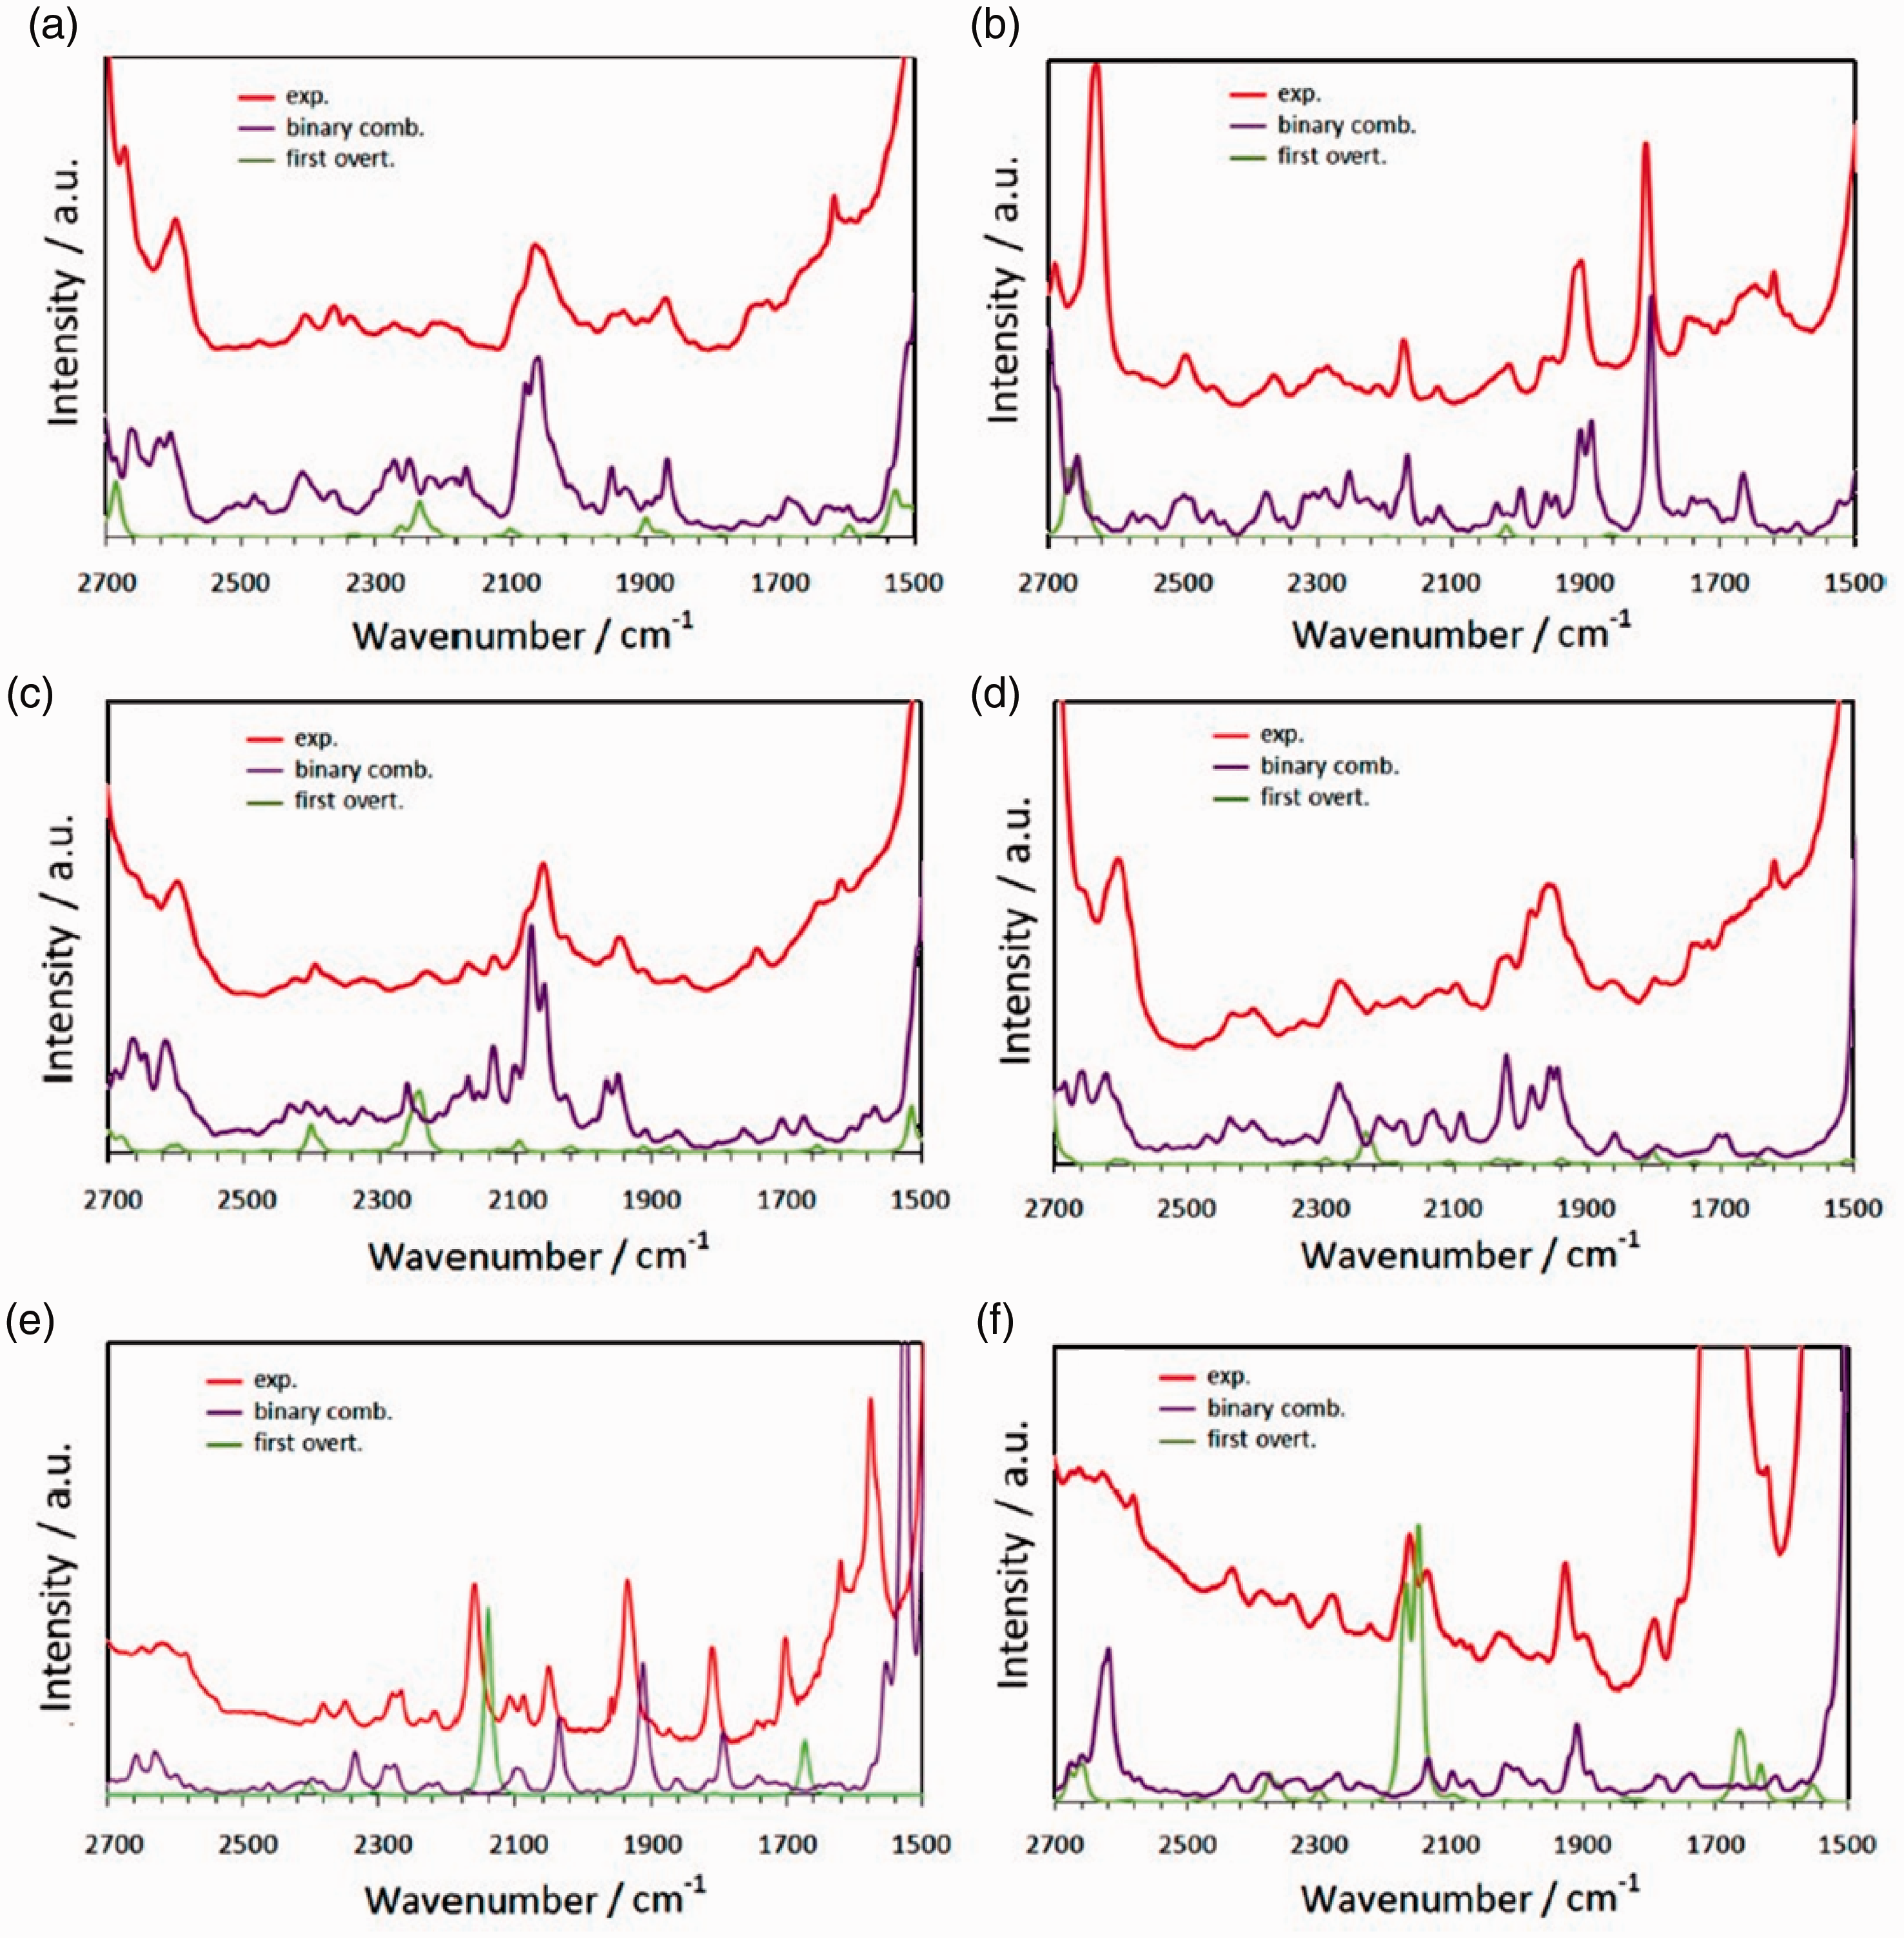
Overtones and combination bands populated MIR spectra as well; this is particularly easily visible in the region where fundamental peaks do not appear, i.e. ca. 2700–1900 cm−1. (a) DNPE, (b) DIPE, (c) NBME, (s) NBEE, (e) TBME and (f) TAME. Reprinted with permission from Beć et al. 40 Copyright (2017) American Chemical Society.
With anharmonic simulation of the spectra, ‘fingerprinting’ based on the overtones and combination can successfully be achieved. The availability of simulated, anharmonic MIR spectra, including the effects of vibrational resonances as well as overtones and combination bands, increases the potential of using this technique in analytical applications. 41 It brings new prospect for hyphenated use of NIR and MIR spectroscopies, as the correlations between these complementary spectra may be better understood.
Final remarks and future prospects
It can be concluded from the long history of NIR spectroscopy that its analytical applications developed to large extent independently of basic research. As a result, much of the physical foundations of NIR spectroscopy still remain open for exploration. While the recent progresses described in this article show ubiquitous potential of quantum chemical simulation of NIR spectra both for physical chemistry and analytical applications, it is believed that the major breakthrough is still ahead. With advances in chemical theory and rapidly growing computer technology, increasingly complex problems will successfully be tackled with NIR spectroscopy aided by such simulations. The ultimate idea is to include the assignment of chemical bands directly in the chemical analysis; a promising concept that has not yet been fully explored due to practical limitations.
Footnotes
Declaration of conflicting interests
The author(s) declared no potential conflicts of interest with respect to the research, authorship, and/or publication of this article.
Funding
The author(s) received no financial support for the research, authorship, and/or publication of this article.